






Abstract
This study investigates a reinforced concrete beam subjected to a close-in explosion. In a series of tests, the scaled distance was varied from 0.045 m/kg1/3 (contact) to 0.30 m/kg1/3. The measurement parameters were failure state, pressure distribution, residual displacement at the center of the beam, and reaction force. The experimental results showed that the pressure waveform closer to the center of the reinforced concrete beam had considerable peak pressure and a sharp rise-time. Moreover, the loading duration at the ends of the beam was increased as compared to that at the center. The intensity of the local failure region and the residual displacement at the center of the beam increased with decrease in the scaled distance. Referring to previous studies on failure prediction of a reinforced concrete slab and beams subjected to close-in explosion, their prediction methods for local failure were compared to test results. Numerical simulations were performed to investigate failure characteristics of the reinforced concrete beam. The numerical results demonstrated that the peak pressure and impulse in the central part were considerably high as the scaled distance decreased. The numerical simulations effectively reproduced failure characteristics of the reinforced concrete beam.
Introduction
Terrorist bombing incidents occur frequently worldwide, particularly after the synchronized terrorist attacks in the United States in 2001. In addition to these attacks, unexpected explosion disasters, such as large explosions in hazardous material warehouses, have increased in recent years. Hence, developing a safety assessment method and protective design of structures subjected to explosive loads are a matter of great urgency.
In such explosions, high pressure, high temperature gases propagate spherically from the source of the explosion and generate a shock wave with supersonic speed (Baker, 1973). Consequently, the structures are subjected to extremely high pressures generated by the shock waves and cause severe damage. The equations of motion for a shock wave were first solved by Brode (1954) in the 1950s, and subsequently, Kingery and Bulmash (1984) verified the method experimentally for predicting a blast wave. The results of their studies have been used in practice, for example, the ConWep computer code (Hyde, 1991) and UFC-3-340-02 design manual (US Department of Defense, 2014).
Numerous tests have been conducted (Cheval et al., 2010, 2012; Rigby et al., 2014, 2015) for a far-field explosion, wherein a detonation occurs at a distance from the structures, and the results proposed an assessment procedure using the nomogram of a blast pressure as a function of the scaled distance, as shown in UFC-3-340-02. In relation to structural response subjected to the blast pressure, the equivalent single-degree-of-freedom (SDOF) model is adopted assuming that the explosive load uniformly acts on the structures (Biggs, 1964; Krauthammer, 2008; Norris et al., 1959). The SDOF model has been widely used in practice, for example, in TM5-1300 (US Department of the Army, the Navy and the Air Force, 1990).
Furthermore, explosive loads due to a close-in explosion are characterized as highly non-uniform loads (Rigby et al., 2015), because the stand-off distance is extremely small. The pressure distribution is also influenced by the angle between incident pressure and the structure. When concrete members suffered a close-in explosion, they are likely to show local failure in addition to global deformation.
To predict the local failure in a concrete slab, a nomogram that assesses the crater dimension is described in TM5-855-1 (Headquarters, Department of the Army, 1988). McVay (1988) suggested empirical formulae for evaluating the spall limit and breach limit thicknesses considering the explosive mass, stand-off distance, and slab thickness. Morishita et al. (2000, 2004) and Tanaka et al. (2001) conducted contact explosion tests for concrete slabs, and they suggested empirical formulae for the crater limit, spall limit, and breach limit thicknesses. Shi et al. (2008) and Li and Hao (2014a, 2014b) conducted a numerical study on the failure behavior of reinforced concrete (RC) columns subjected to a close-in explosion and indicated that increasing the column depth and using denser arrangement of shear or longitudinal reinforcement bars were effective in mitigating the spall damage. However, few studies of RC columns and beams subjected to close-in explosions were conducted with respect to RC slabs. There are many issues to be studied regarding failure conditions and impact responses of RC columns and beams subjected to the close-in explosions.
This study presents a fundamental investigation of a RC beam subjected to a close-in explosion. In a series of tests, the scaled distance was varied from 0.045 m/kg1/3 (contact) to 0.30 m/kg1/3. The measurement parameters were the failure state, pressure distribution, residual displacement at the center of the beam, and reaction force. Numerical simulations were performed to investigate the failure mechanism of the RC beam.
Experimental setup
RC beam and C-4 explosive
The front and cross-sectional views of the RC beam are illustrated in Figure 1. The width, height, and support span of the RC beam were 120, 180, and 1100 mm, respectively. Reinforcing bars with a diameter (D10) of 9.53 mm were used for the longitudinal reinforcement, and the longitudinal reinforcements were welded to 3.2-mm-thick steel plates at both the ends of the RC beam to secure the bond between the longitudinal reinforcing bars and concrete. Reinforcing bars with a diameter (D6) of 6.35 mm were used for the shear reinforcement with a spacing of 100 mm. The yield strengths of the D6 and D10 bars were 322 and 388 MPa, respectively. The stress–strain curves for the different specimens of concrete are shown in Figure 2. After conducting three uniaxial compression tests, the average compressive strength and Young’s modulus were found to be 27 MPa and 33 GPa, respectively. The static shear and flexural loading capacities were 82.7 and 22.1 kN, respectively, based on the standard specifications for concrete structures given by the Japan Society of Civil Engineers (2010), which indicated that the RC beams were designed to fail in the flexural mode under static loading.

(a) Front and (b) cross-sectional views.

Stress–strain curves of concrete.
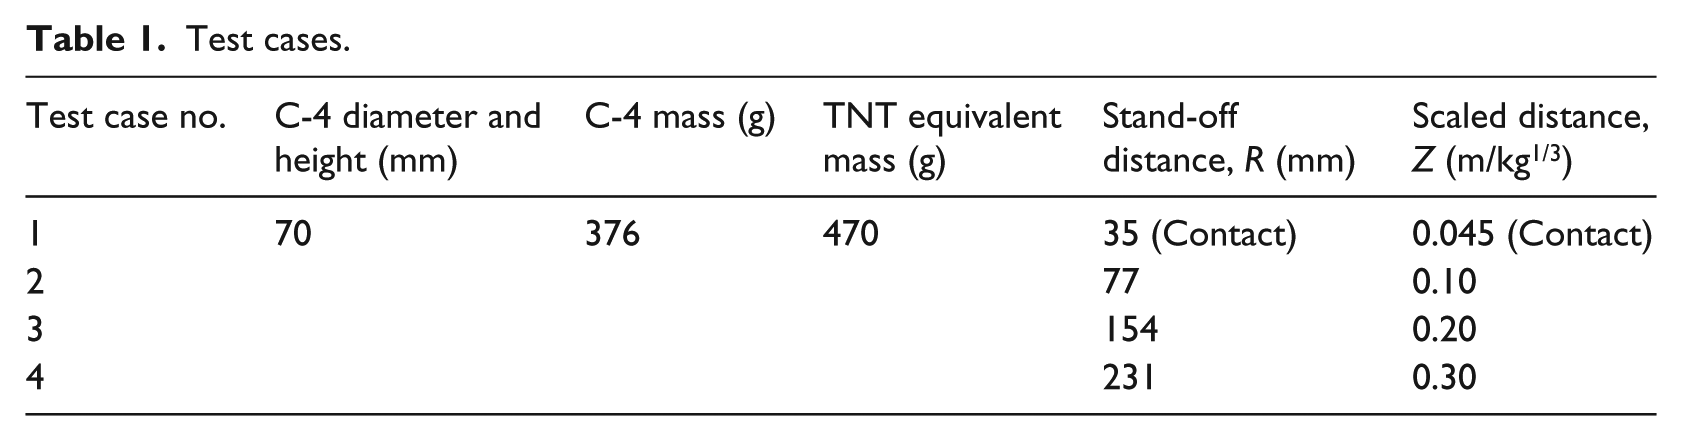
A C-4 explosive was employed, as it is chemically safe and easily molded. The C-4 explosive was molded into a cylindrical shape with both diameter and height of 70 mm. The packing density and mass were 1.4 g/cm3 and 376 g, respectively. In a blast resistant design of structures, an explosive mass is generally converted into the trinitrotoluene (TNT) equivalent mass. The TNT equivalent mass of the C-4 explosive depends on the scaled distance and varies with the peak pressure and impulse (Bogosian et al., 2016; Cooper, 1994; Swisdak, 1975). Swisdak (1975) measured the TNT equivalence of C-4, which is defined as the ratio of TNT mass to the mass of C-4 in the peak pressure range of 1 psi (6.9 kPa)–100 psi (690 kPa), and they reported that the average TNT equivalences based on the peak pressure and impulse were calculated as 1.37 and 1.19, respectively. In addition, the explosion energies of TNT and C-4 explosives were 1080 and 1350 cal/g, respectively, that is, the ratio of C-4 explosive energy to that of the TNT explosive is 1.25 (Japan Explosive Society, 1993). In this study, the mean value of 1.25 among the TNT equivalencies of C-4 was adopted, which indicates that the mass of the C-4 explosive was identical to a mass of 470 g of the TNT explosive. An electric detonator was set and exploded at the center of the cylindrical C-4 explosive.
Experimental setup and test cases
A schematic of the experimental setup is shown in Figure 3. The beam is simply supported with rebounding prevention jigs. This boundary condition allowed the rotation of the beam at the end supports. A pair of strain gauge type load cell is set underneath the supports to measure the reaction force. The explosive is set above the center of the RC beam at a predetermined height range of 35–231 mm.

Schematic of experimental setup.
The test cases are listed in Table 1. A series of contact and close-in explosion tests were conducted. In the contact explosion test, the stand-off distance was 35 mm for the cylindrical radius and the scaled distance was 0.045 m/kg1/3. In the close-in explosion tests, the scaled distances were set as 0.10, 0.20, and 0.30 m/kg1/3, and the corresponding stand-off distances were 77, 154, and 231 mm, respectively. To measure the pressure acting on the RC beam due to the close-in explosion, pressure sensors, placed at 100 mm intervals, were arranged on a 500 mm long steel plate, which were set at the same height as that of the top surface of the RC beam along the orthogonal direction of the beam, as shown in Figure 4. Hence, the pressures were measured at the positions of 100 mm (Pr1), 200 mm (Pr2), 300 mm (Pr3), 400 mm (Pr4), and 500 mm (Pr5) from the center of the RC beam. The sampling rate of all pressure sensors was 1 MHz, and the measurement ranges of Pr1, Pr2-4, and Pr5 were 690, 69, and 6.9 MPa, respectively.
Test cases.

Installation status of pressure sensors.
Failure characteristics and residual displacements at the center of the RC beam were measured after the explosion test. The residual displacement measured the distance between the lower edges at the center of RC beam and the support position. In the case of concrete peeling, wherein the lower reinforcing bars were exposed, the residual displacement was measured based on the displacement of the lower reinforcing bar at the center of the RC beam.
Experimental result and discussion
Pressure–time history
The pressure waveforms measured using the pressure sensors are shown in Figure 5. As the detonation time could not be measured in the experiments, the origin of the time axis was determined by numerical analysis described later in which the rise times of Pr1 of the experiment result and numerical analysis were coincided. The noise waveform of Pr1 sensor was greater than that of the others because the measurement range and acceleration sensitivity of the pressure sensor Pr1 are approximately 10 times greater than that of the other sensors. The figure indicates that the pressure waveform closer to the center of the RC beam showed higher peak pressure and sharper rise-time in all the test cases. For instance, in test case no. 3, as shown in Figure 5(b), the peak pressure of Pr1 is approximately 50 MPa, which is as much as 10 times higher than that of Pr5, which is placed closest to the end of the beam. This indicates that the peak pressure tends to decrease abruptly from the center to the end of the RC beam. The positive phase duration of Pr1 is 0.08 ms, which is slightly lower than the 0.12 ms of the Pr5. Figure 5(a) to (c) clearly indicates that the positive phase duration tends to increase slightly from the center to the end of the RC beams. Figure 6(a) shows the comparison of the peak pressures and impulses between experimental results and UFC (US Department of Defense, 2014). Although cylindrical C-4 explosive was used in the test, the spherical TNT equivalent mass was assumed in the UFC calculation. The figures show that the experimental results are less than the UFC values at most points in both cases. The discrepancy was probably caused by the difference of the shape of C-4 explosive between the test and UFC. The cylindrical explosive exhibits an extremely high blast pressure in the cylindrical axis direction. Due to this directivity, the experimental peak pressure and impulse at the position apart from the center of the RC beam became less than the spherical UFC values.

Pressure–time histories: (a) test case no. 2 (Z = 0.10 m/kg1/3), (b) test case no. 3 (Z = 0.20 m/kg1/3), and (c) test case no. 4 (Z = 0.30 m/kg1/3).

Comparison between test results and UFC (US Department of Defense, 2014): (a) peak pressure and (b) impulse.
Failure state
The failure states of the RC beams and the residual displacements at the center of the beams after the explosion tests are shown in Figure 7. In test case no. 1 (contact explosion), the RC beam showed a mixed failure damage of both local damage and global flexural failure. The core concrete of the center portion completely failed with the size of coarse aggregate. The maximum residual displacement was 44 mm. In test case no. 2, the concrete cover of the central part was peeled, and the residual displacement was 36 mm. Although a large number of cracks occurred in the core concrete, the concrete inside the shear reinforcement remained. In test case no. 3, a local failure similar to that of test case no. 2 occurred, but the local failure region was narrow compared to that of test cases no. 1 and no. 2. The residual displacement was 8 mm. In test case no. 4, a part of the concrete at the top central corner was broken in addition to diagonal and flexural cracks developing from the lower edge. Cracks along the longitudinal reinforcement appeared, and the residual displacement was 6 mm. As crater and spall failures were not observed in this case, the stand-off distance for the failure limits of local failure in this experimental condition is between 231 and 154 mm, corresponding to scaled distances of 0.30 and 0.10 m/kg1/3, respectively. The residual displacement and intensity of the local failure region increased with the decrease in the scaled distance.

Failure states of RC beams and residual displacements. Cracks that were confirmed by observation are emphasized.
Empirical formulae for the local failure of concrete slabs were suggested by McVay (1988), Morishita et al. (2000, 2004), and Tanaka et al. (2001). They are given as follows:
Spall limit thickness for close-in explosion (McVay, 1988)
Breach limit thickness for close-in explosion (McVay, 1988)
Crater limit thickness (Morishita et al., 2000, 2004; Tanaka et al., 2001)
Spall limit thickness for contact explosion (Morishita et al., 2000, 2004; Tanaka et al., 2001)
Breach limit thickness for contact explosion (Morishita et al., 2000, 2004; Tanaka et al., 2001)
where T is the slab thickness (cm), W is the TNT equivalent mass (g), and R is the stand-off distance (cm).
The comparison between the empirical formulae and the test results is shown in Figure 8. As the failure mode of case no. 4 is close to the crater limit line and a part of the concrete at the top central corner is broken, equation (3) seems to be applicable for the RC beam for the crater limit. In test case no. 2, the spall failure was in agreement with the prediction made by equation (1) at the spall limit. However, in test cases no. 1 and no. 3, the empirical formulae for breach and spall limit thicknesses were not consistent with the test results, that is, breach and spall were observed in the tests, but the formulae predicted spall and crater, respectively. Equations (1) to (5) are empirical formulae obtained from contact and close-in explosion tests for RC slabs. In these cases, the incident compressive pressure wave is reflected at the rear free surface of the slab and transforms into the tensile pressure wave. However, the RC beam in this test had the lateral side surfaces whose width was comparably close to the diameter of the explosive, so the spall failure could occur on the lateral surfaces. The difference in the reflection state of the pressure wave between a RC slab and the RC beam could cause the inconsistency between test cases no. 1 and no. 3 and the empirical formulae. To fit the test results to the empirical formulae of McVay or Morishita for spall and breach limits, an increase factor of 1.3 is required to increase the limit thickness.

Comparison between empirical formulae of RC slabs and test results.
The test result is subsequently compared to the prediction result for a spall damage in a RC column suggested by Li et al. (2014b), as shown in Figure 9. The comparison between the spall damage classification and test results is listed in Table 2. The following are the prediction equations for a spall damage in RC columns suggested by Li et al. (2014b):
Comparison between spall damage classification (Li et al., 2014b) and test results.

Threshold spall damage limit
Medium damage limit
Severe spall damage limit
where y is the stand-off distance (m), D is the column depth (mm), and w is the TNT equivalent mass (kg).

Comparison between empirical formulae for RC columns and test results.
It should be noted that the influence of shear reinforcement was not considered in these formulae, although Li et al. (2014b) pointed out that shear reinforcement was effective in mitigating the spall damage. The column depth and the TNT equivalent mass in the test conditions were not in the applicable range. As the failure mode of test case no. 4 was not spall damage, equation (6) for the threshold spall damage limit is suited for the test result. Moreover, to fit the test results to equation (7) for medium damage limit and to equation (8) for severe spall damage limit, factors of 1.5 and 0.6 must be multiplied to these equations, respectively. The inconsistency might be due to the rectangular cross section of the RC beam used in the test because the numerical simulation employed a square cross section. In the future, a further study on the prediction method for a local failure of RC beams is necessary.
Numerical simulation
Numerical simulations were conducted using the hydro code ANSYS AUTODYN (ver.15.0) to reproduce the experimental results. The air and C-4 explosives were modeled using the Eulerian elements, and the RC beam was modeled using the Lagrangian solid elements. The interactions between both the elements were applied. In this numerical model, a quarter of the C-4 explosive, the RC beam, and supports were modeled because of symmetry. Although the supports of the RC beam were placed on steel plates laid on the ground in the experiment, fixed boundary conditions in the numerical model were applied under the supports. The reaction force was numerically calculated from the sum of the reaction force at the fixed node, considering the symmetry of the model as shown in Figure 10.

Typical 3D FD model.
Numerical model
Modeling of blast pressure
To reproduce the detonation phenomenon satisfactorily, fine meshes were required in the explosive region. As the dimension of the C-4 explosive was quite smaller than all the calculation regions, two-dimensional (2D) axisymmetric models were first used to calculate the detonation phenomena near the explosive, as shown in Figure 11. Thereafter, the calculation results were transferred to the three-dimensional (3D) axisymmetric system, which includes the RC beam model. In this study, air was assumed as an ideal gas expressed by the following equation of state
where p is the pressure, ρ is the density, γ is the adiabatic exponent, and γ = 1.4; e is the internal energy. The initial pressure and density of air were 101.3 kPa (1 atm) and 1.225 kg/m3, respectively.

Reproduction of detonation phenomena.
The Jones–Wilkins–Lee (JWL) equation of state expressed by the following equation was applied for the detonation pressure
where P is the detonation pressure; A, B, R1, R2, and ω are constants; e is the specific internal energy; η = ρ/ρ0; ρ is the density; and ρ0 is the initial density.
The parameters of the JWL equation of state for the C-4 explosive were calculated using deflagration and explosion code KHT2003 (Society for the Study of Detonation, 2011), as listed in Table 3. The detonation point was set at the center of the C-4 explosive. In the contact explosion analysis, high reproducibility of the Chapman–Jouguet pressure (C–J pressure) during the detonation process is crucial. Hence, sensitivity analysis for the effect of mesh size on the reproducibility of the C–J pressure was conducted as shown in Figure 12. A C-4 explosive model was set in a larger range than the experimental explosive, and measurement points of pressure were arranged at 5, 15, 25, and 35 mm from the detonation point. Figure 13 shows pressure–time histories of three mesh size cases of 0.1, 0.5, and 2.5 mm. The figure shows that the peak pressure increases as the distance from the detonation point increases, and the pressure at measurement point #4 corresponding to the explosive surface exhibits maximum in all cases. The pressure shows a sharper rise-time as the mesh size becomes small. Figure 14 shows the relationship between the ratio of the peak pressure at measurement point #4 to the C–J pressure of 18.1 GPa obtained by KHT2003. The figure indicates that smaller the mesh size, higher the peak pressure. However, calculation time increased sharply as the mesh size decreased. Hence, the mesh size of the Eulerian element was determined as 0.5 mm because it assures approximately 70% of the C–J pressure and a sharp rise-time. To calculate the air and blast pressures efficiently for each test case, the dimensions of the Eulerian elements was set, as listed in Table 4. The number of Eulerian elements of the 3D axisymmetric models, which include the Lagrangian solid elements of the RC beam model, was 2,557,800 (4 × 4 × 4 mm). To allow the pressure to transmit outside, flow out condition was employed at the outer boundary.
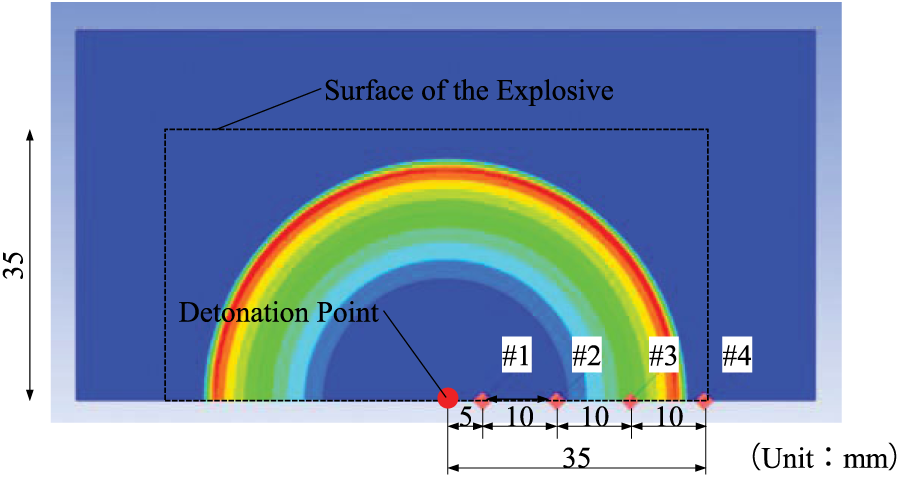
Example of 3D FD model for sensitivity analysis of mesh size.

Pressure histories in C-4 explosive.

Variation of peak pressure/C–J pressure.
Parameters of JWL equation of state.

Dimensions of Eulerian elements surrounding detonation.

2D: two-dimensional.
RC beam model
The RC beam model constituted of 56,160 (5 × 5 × 5 mm) hexahedron solid elements. When the concrete was subjected to the blast load, the maximal strain rate reaches more than 102 s−1, and the dynamic strength of concrete becomes several-folds greater than that in the static case. Hence, concrete constitutive model requires strain rate dependency. In this numerical study, a dynamic nonlinear constitutive model of CAPROUS (Itoh et al., 2013) was employed for the concrete model. In the CAPROUS model, pressure was obtained using an equation of state proposed by Morishita and Asonuma (2005), expressed by the following equation, and the yield function, as shown in Figure 15, was adopted

Nonlinear yield function.
where
The yield surface was non-uniformly harden and soften, developed by Han and Chen (1985). The strain rate effects were considered using the dynamic increasing factor (DIF) proposed by
Yamaguchi et al. (1989) expressed by the following equations
where γt and γc are the tensile and compressive DIFs, respectively;
A criterion using the dynamic spall pressure pspall was applied for the tensile fracture of concrete, and it is expressed by the following equations (Itoh et al., 2013)
where
After the peak pressure pspall, pressure was softened using the following gradient Ksoft linearly
where L0 and Gf are the representative mesh size and the fracture energy, respectively.
The element elimination criterion using the geometric strain was adopted. The geometric strain
where ε1, ε2, and ε3 are the principal strains; ε12, ε23, and ε31 are the principal shear strains.
When the geometric strain element instantaneously reached prescribed value in a specific element, the element was eliminated. This method has been used in the analyses of RC members to model concrete under blast and impact loads (Luccioni et al., 2013; Nyström and Gylltoft, 2009; Riedel et al., 2009). In this study, the specified strain value of 0.5 which is the lower limit of the recommended value range (ANSYS AUTODYN, 2015) was used. The CAPROUS model requires the density, Young’s modulus, Poisson’s ratio, and uniaxial compressive strength, and other parameters are obtained using empirical formulae (Itoh et al., 2013). The material properties of concrete are listed in Table 5.
Material properties of concrete.

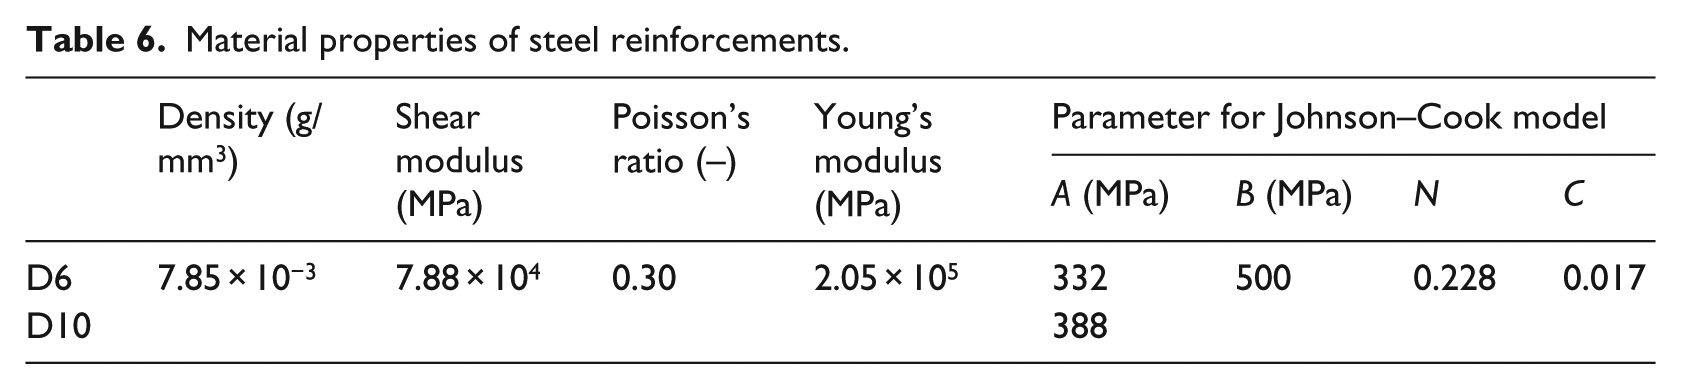
The longitudinal and shear reinforcement bars were modeled using the beam elements with a mesh size of 5 mm, which is the same as that of the concrete mesh size. The beam element nodes were rigidly connected with those of the concrete elements. The Johnson–Cook constitutive model (Johnson and Cook, 1983) was used for the yield criterion of the reinforcement bars. This model has been typically used in ductile materials, such as metals, and the yield stress was defined as a function of the effective plastic strain, strain rate, and temperature. In this study, the temperature was not considered, and the following equation was used
where σp is the yield stress; σ0 is the initial yield stress; Bj and N are the hardening constants;
The material properties of the steel reinforcement bars were determined based on the ASTM-A36 values proposed by Schwer (2007), as listed in Table 6. To examine the dynamic mechanical properties, the strain rate dependency was calculated by conducting uni-tension tests numerically using a bar model, as shown in Figure 16. The tensile tests were numerically conducted by increasing the loading rate. The dimension of the specimen was 50 mm × 14 mm, and the mesh size was 5 mm × 5 mm. Figure 17(a) and (b) shows the relationship between the effective stress and strain, and the strain rate–time history for a loading rate of 20 m/s, respectively. The strain rate was determined at the dynamic yield stress, as shown in Figure 17(a) and (b). The relationship between the DIF and the strain rate from the numerical simulation is compared to the experimental results reported by Sakino (2002), as shown in Figure 18. The figure indicates that the dynamic yield stress increased with the increase in the strain rate, and the strain rate at 102 s−1 became as much as 1.5 times higher than that of the static one.

Numerical uni-tension model.

Examples of verification of results (loading rate of 20 m/s): (a) relationship between effective stress and strain and (b) strain rate–time history.

Relationship between DIF and strain rate.
Material properties of steel reinforcements.
Numerical results and discussion
Pressure–time history
The pressure–time histories calculated by the numerical analysis were compared to that of the experimental ones, as shown in Figure 19. The origin of the time axis is chosen at the instant of detonation. The numerical results show that the pressure waveforms closer to the center of the RC beam have sharper rise-time, and the pressure waveform changes gradually at a position away from the center of the beam, as it is similar to the experimental results. The numerical results indicate that the positive phase duration tends to increase from the center to the end of the RC beam.

Comparison of pressure–time histories: (a) test case no. 2 (Z = 0.10 m/kg1/3), (b) test case no. 3 (Z = 0.20 m/kg1/3), and (c) test case no. 4 (Z = 0.30 m/kg1/3).
The peak pressures and impulses calculated numerically are compared to that of the experimental ones, as shown in Figure 20. The figure indicates that the peak pressures calculated from the numerical simulation reproduced the test results well. However, a large amount of error occurs in the impulse calculations. In particular, the impulse of Pr1, which is the closest to the center of the RC beam, is approximately 1.5 times greater than that of the experimental one. This inconsistency might be due to the oscillation of the pressure waveforms of Pr1 measured experimentally, which was disturbed just after peak pressure. The differences of peak pressures between two adjacent measurement points indicate that the numerical pressure between Pr1 and Pr2 was the greatest in all the test cases, as it is similar to the experimental results. Figure 20(b) indicates a similar tendency for impulse calculations.

Comparison of peak pressures and impulses: (a) peak pressure and (b) impulse.
The pressure distributions calculated numerically are compared to that of the experimental ones, as shown in Figure 21. The numerical and experimental results show that the pressure at a distance of 100 mm from the center of the RC beam considerably high, and subsequently, the pressures increased as the location of the pressure sensors became close to the end of the RC beam with the passage of time. In the numerical simulation, the pressure at a distance of 100 mm from the center lasted a little longer as compared to that of the experimental results because of a slight attenuation of the pressure at that point.
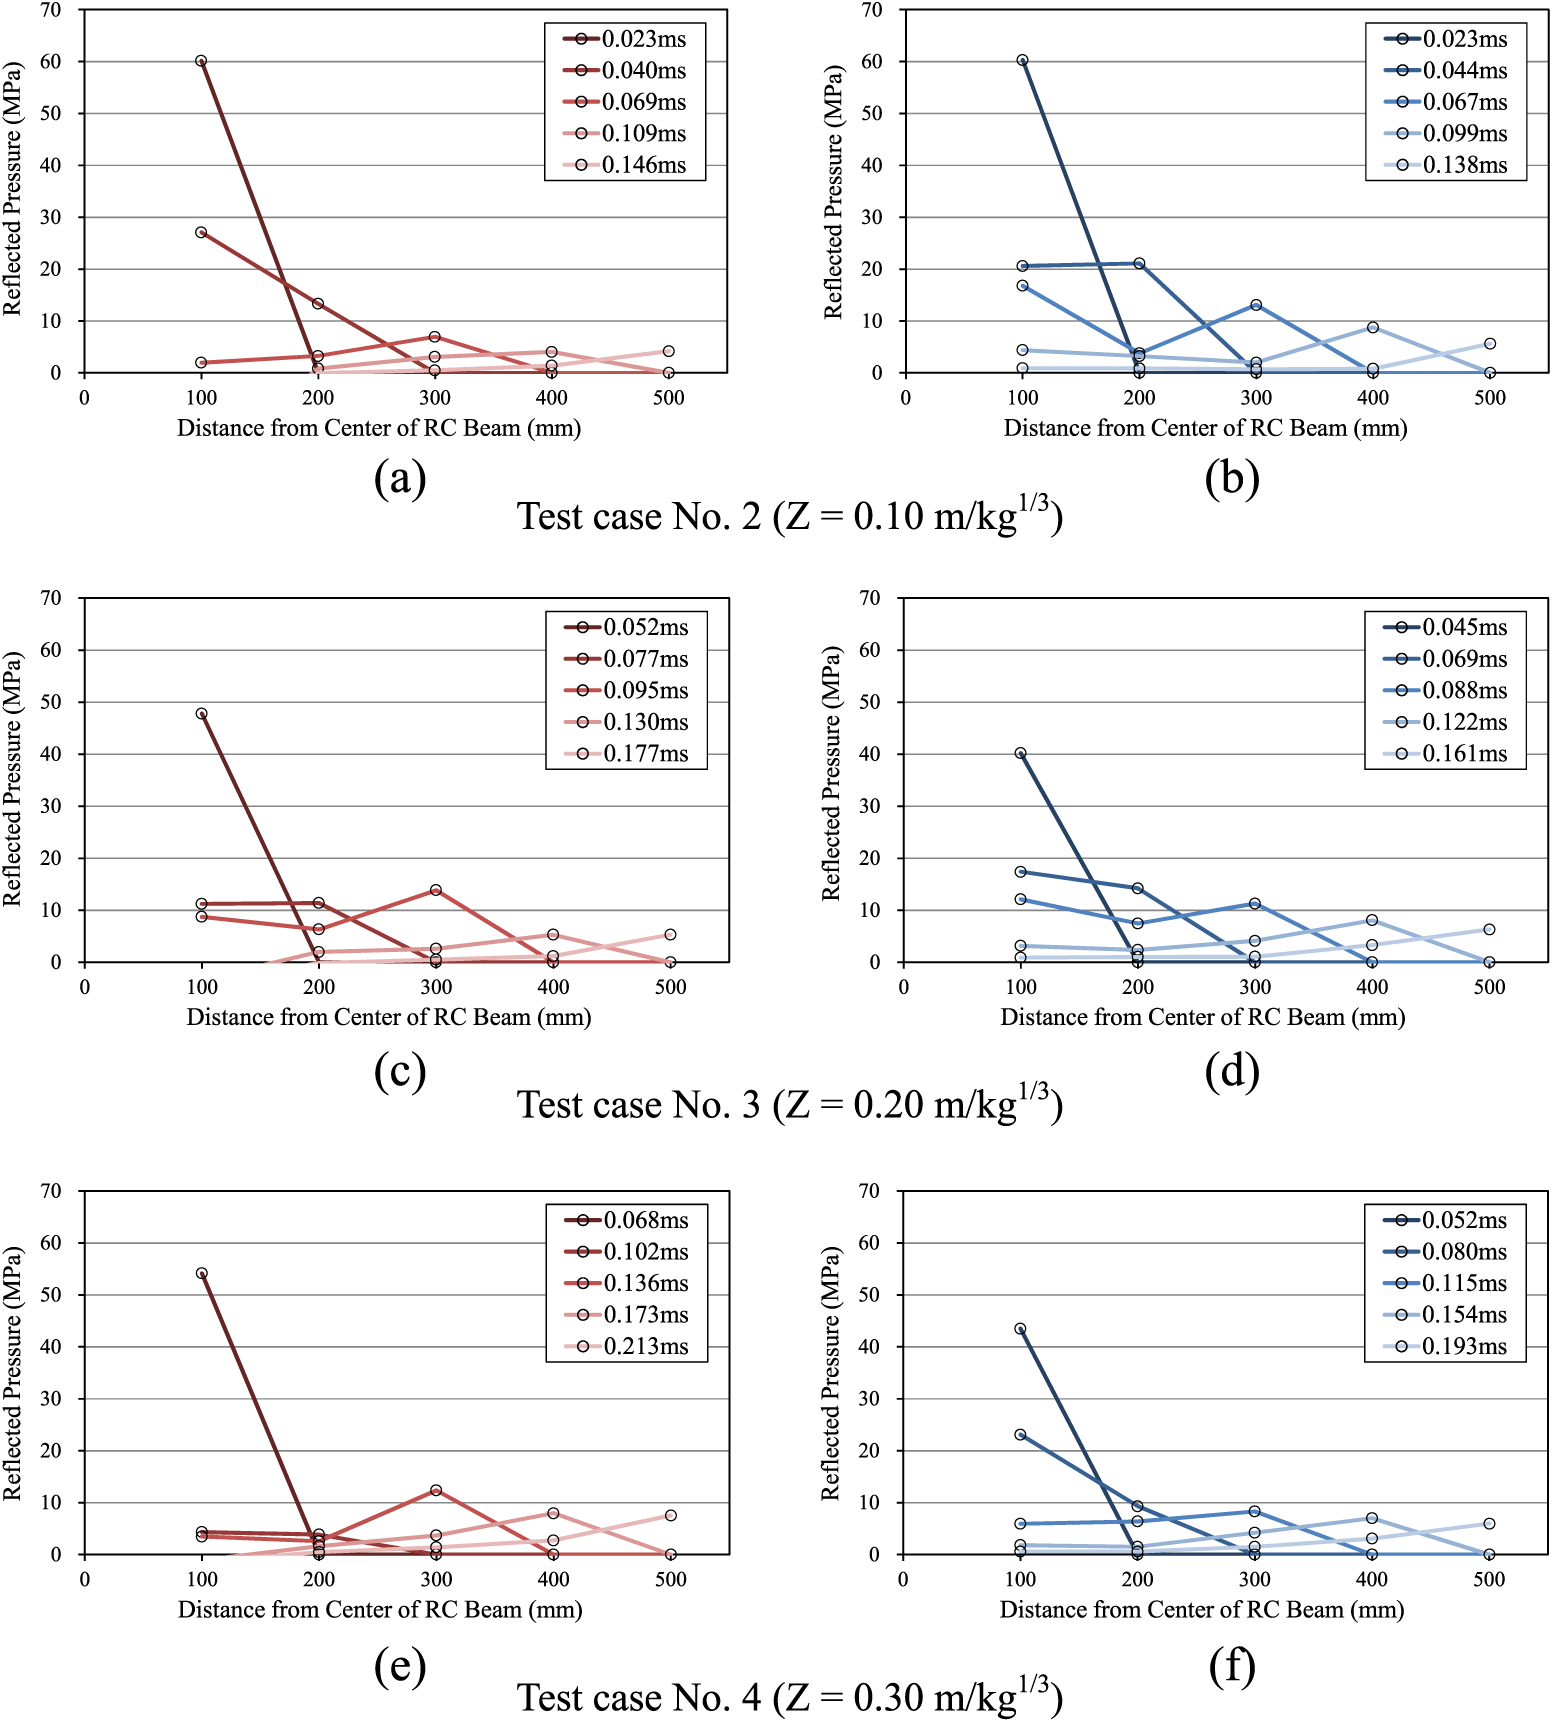
Comparison of pressures distributions. (a) experimental result and (b) numerical result—test case no. 2 (Z = 0.10 m/kg1/3); (c) experimental result and (d) numerical result—test case no. 3 (Z = 0.20 m/kg1/3); (e) experimental result and (f) numerical result—test case no. 4 (Z = 0.30 m/kg1/3).
The peak pressures and impulses at the central parts calculated numerically are shown in Figure 22. The figure indicates that the peak pressures of test cases no. 2 and no. 3 increased 2.4 times and 7.4 times, respectively, as compared to that of test case no. 4. The corresponding impulses increased by 2.3–6.3 times than that of test case no. 4. In brief, the peak pressure and impulse at the central part are extremely high as the scaled distance decreased.

Comparison of peak pressures and impulses at the center of RC beams.
Failure state
The failure processes of the RC beams obtained by the numerical simulation are shown in Figure 23. The numerical simulations were calculated until 40 ms after the explosion when the failure had completed. To examine the lost concrete mass due to the local failure, the failed concrete mass ratio was defined as the ratio of failed concrete mass to the total mass of the RC beam. Figure 24 shows the failed concrete mass ratio–time history. In test case no. 1 of the contact explosion, as shown in Figure 23(a), clear local failure occurred, but a small portion of concrete inside the shear reinforcement remained, unlike the test result. The local failure region was slightly narrower, and the cracks opened widely as compared to that of the experiment. The figure indicates that the local failure occurred from top to the middle height of the beam under 1 ms of the explosion, at which the mass of the RC beam decreased to 97%, as shown in Figure 24. The failure of the central portion developed to the bottom end at 10 ms, at which the mass of the beam decreased to 94%. Although the failure of the RC beam developed later, the mass did not change significantly. For test case no. 2, Figure 23(b) shows that concrete inside the shear reinforcement remained the same, similar to the experimental result. The cracks developed diagonally from the local failure region on the lateral side, but the local failure region was slightly narrower compared to that of the experimental result. Although the top center of the concrete beam had failed under 1 ms of the explosion, the mass did not decrease at this time, as shown in Figure 24. The failure developed from the middle height to the bottom of the RC beam, and the mass decreased to 96% at 40 ms. Although the pressures close to the center of the RC beam in the numerical simulation were comparably reproducible to the experimental ones, the pressures in the middle to the end of the beam were higher as shown in Figure 21. In the numerical simulation, the gentle distributed pressure suppressed the failure around the center of the beam, whereas in the experiment, the central portion might have locally deformed and greater local failure occurred. For test case no. 3, Figure 23(c) shows that the numerical simulation did not satisfactorily reproduce the local failure on the top surface and the lateral side. Flexural and diagonal cracks at the central lower portion developed locally at 0.2 ms, and shear cracks also developed at 0.3 ms in the top center part. The failure process largely stopped in about 0.5 ms, and the mass did not decrease, as shown in Figure 24. In the numerical simulation, the crater on the top surface of the beam did not occur because the pressures close to the center of the beam were lower than the experimental ones, although the attenuation of the pressures of the portion was gentle as shown in Figure 21. As no crater failure was numerically reproduced, shear failure occurred without causing spall failure unlike experimental results. In test case no. 4, Figure 23(d) shows that the failure process was similar to that of test case no. 3, although the number of cracks decreased compared to test case no. 3. The mass of the RC beam did not change, similar to the numerical test case no. 3. Several shear failures, which was not evident in the experimental results, occurred and the failure at the top central corner was not reproduced unlike the experimental result. In the numerical simulation, as the pressures close to the central part were lower than experimental result, crater failure was not numerically reproduced as similar to test case no. 3.

Failure processes: (a) test case no. 1 (contact), (b) test case no. 2 (Z = 0.10 m/kg1/3), (c) test case no. 3 (Z = 0.20 m/kg1/3), and (d) test case no. 4 (Z = 0.30 m/kg1/3).

Failed concrete mass ratio–time history.
The pressure distributions at the middle width of the RC beam in test cases no. 1 and no. 4 are shown in Figure 25. In the figures, positive and negative values imply compression and expansion pressures, respectively. In test case no. 1 as shown in Figure 25(a), the crater failure developed by the high compressive pressure propagated from the crater to the end of the beam within 0.2 ms. A negative pressure, which was generated by the reflection at the free surface, was confirmed at diagonal directions from the crater, and it seems to have spread widely. Corresponding cracks appeared, as shown in Figure 22(a). Negative pressure along the lower reinforcing bar was also observed, and the global deformation developed after 3 ms. However, in test case no. 4, as shown in Figure 25(b), crater failure did not occur, and the relatively low pressure propagated widely from the center of the RC beam to the end. Negative pressure along the lower reinforcement and diagonal directions from the top center was confirmed in around 0.1–0.3 ms, as shown in Figure 25(b), corresponding cracks at the central portion appeared, as shown in Figure 23(d).

Pressure distributions: (a) test case no. 1 (contact) and (b) test case no. 4 (Z = 0.30 m/kg1/3).
Residual displacement and reaction force–time history
The residual displacements calculated by the numerical analysis are compared to that of the experimental ones, as shown in Figure 26. The numerical results indicate that the numerical residual displacement increases as the scaled distance decreases, as it is similar to the test results. However, the numerical results were approximately 50% lower than the experimental ones of test cases no. 2–4, while the numerical result of test case no. 1 was approximately 10% greater. The comparison of the failure between experimental (Figure 7) and numerical results (Figure 23) indicate that the local failure regions using the numerical simulation in all test cases were slightly narrower than that of experimental ones. Hence, in test cases no. 2–4, the smaller partial loss of the sectional area using the numerical simulation could cause the small displacement. In addition, the combination of shear and flexural failures might affect the difference. However, in test case no. 1, the residual displacement became greater than the experimental one because the core concrete of the central portion was retained in the numerical results, although the part had completely failed in the experiment.

Comparison of residual displacements.
The reaction force–time histories are shown in Figure 27 with the experimental results. A moving average method with 10 data (40 μs) was applied to filter high-frequency noise in the experimental data. The test result indicates that the reaction forces of test cases no. 1 and no. 2 showed sharper rise after explosion as compared to that of the other cases and fell instantaneously after the peak. Thereafter, the second maximum wave generated at approximately 3 ms, and it showed subsequent increasing and decreasing forces. The numerical durations of test cases no. 1 and no. 2 showed reasonably good agreement with the test results. The numerical duration of test cases no. 3 and no. 4 was approximately 6–7 ms, which is shorter than that of test case no. 1 (approximately 25 ms). The duration of the reaction force was observed to increase with the decrease in the scaled distance because the natural period became longer due to the degraded flexural rigidity and increased local failure.

Comparison of reaction force–time histories: (a) test case no. 1 (contact), (b) test case no. 2 (Z = 0.10 m/kg1/3), (c) test case no. 3 (Z = 0.20 m/kg1/3), and (d) test case no. 4 (Z = 0.30 m/kg1/3).
Conclusion
This study presented a fundamental investigation of RC beams simply supported at both ends subjected to a close-in explosion. In this study, the pressure characteristics and failure mechanism were investigated. In addition, numerical simulations were also performed to investigate the failure characteristics of the RC beam. The conclusions of this study are summarized as follows:
The experimental results showed that the pressure waveform closer to the center of the RC beam had considerable peak pressure and sharp rise-time. The loading duration of the incident pressure at the beam end increased compared to that of the center of the beam. The experimental result showed that the peak pressure and impulse at the central part were extremely high as the scaled distance decreased.
The intensity of the local failure region and residual displacement at the center of the beam increased as the scaled distance decreased. By comparing the failure modes of the RC beams with the previous studies, two prediction methods for the local failure of the concrete slab and RC column were compared to the test results. The local failure of the RC beam might show inconsistencies between the prediction methods and test data.
The numerical simulations could reasonably reproduce crater and spall failures for test cases no. 1 and no. 2, wherein the scaled distance were 0.045 m/kg1/3 (contact) and 0.10 m/kg1/3, respectively. The failure state was reproduced to some extent for test cases no. 3 and no. 4, wherein the scaled distance were 0.20 and 0.30 m/kg1/3, respectively. The inconsistency was due to the difference in the pressure distributions.
Footnotes
Declaration of Conflicting Interests
The author(s) declared no potential conflicts of interest with respect to the research, authorship, and/or publication of this article.
Funding
The author(s) disclosed receipt of the following financial support for the research, authorship, and/or publication of this article: This work was supported by Japan Society of the Defense Facility Engineers (JSDFE).