
Abstract
As terrorist attacks continue all over the world and, therefore, the alarming rate of countries governments as well as the awareness of people about danger is significantly increasing, in recent years high explosive airblast effects assessment and protection have become a fundamental concern for structural designers. In this article, the implementation of an original predictive tool based on the literature empirical data to develop analyses of blast loading consequent to a bomb explosion is described. The in-house developed model enables the fast calculation of the distribution of the main blast wave parameters around and over three-dimensional complex geometries virtually reproducing potential attractive targets for terrorists. Considering these capabilities, the use of the proposed novel methodology is desirable in the preparatory and retrofit design in view of evaluating blast-induced adverse consequences and, accordingly, to identify and effectively set up the most appropriate protective strategies and countermeasures.
Introduction
The amount and intensity of international terrorist activities have heightened the preoccupation towards the safety of civil infrastructure systems such as highway bridges, airports, iconic buildings, train and metro stations, as well as congested urban environments. The public concern is even more increased by some factors like the ease in gathering materials (often out of ordinary chemicals) and information for the construction of bomb device, the explosive portability and other aspects such as system accessibility without restrictions as in the case of many transportation infrastructures.
The aforesaid systems are considered attractive targets by terrorists mainly because of potential negative impacts they may achieve in terms of human casualties and economic consequences.
Nowadays, lots of analytical and numerical techniques can be employed by defence agencies, research organisations and professional designers to efficiently support counter-terrorist security in quantifying loads on structures when a terrorist bomb attack occurs. With specific reference to airblast loading induced by deliberate bomb explosions, in most cases to enhance the structural resilience a tailored solution is required because of several contrasting needs. As a matter of fact, since blast design and countermeasures shall be integrated in the framework of the risk analysis procedures, the identified solutions have to be assessed also accounting for the requirements and constraints of other aspects like interior and building services design and cost-effectiveness ratio.
Characterisation of a high explosive blast wave
An explosive is any chemical compound, mixture or device built up with the intent to generate an explosion. Explosions can be classified as mechanical, nuclear and chemical. We focused our study on the latter typology because it is typically used by terrorists to manufacture an overwater bomb. Such explosives exploit the extremely quick conversion of a specific compound (solid or liquid) into hot gases having a volume much greater than the generating substances. The sudden expansion of hot gases produces a shock wave (blast wave) that moves outward through the surrounding air at high velocity and, as a consequence, it is capable of inducing damage to a generic acceptor system such as a structure, person and valuable equipment.
Phenomenologically, a point invested by this wave experiences a sensible sharp rise in pressure
Considering what stated, the simplified pressure–time profile measured at a given point located beyond a certain distance from the explosion ideal centre of a high explosive is qualitatively reproduced by the free-field (incident) pressure profile
Profiles of the incident, reflected and dynamic pressure over time at a given fixed location.
Two other characteristics of the blast wave are the dynamic pressure and the specific impulse (per unit of area). The dynamic pressure
For unconfined blast environment, the theoretical transient profiles of the incident pressure
As far as the blast loads on structures are concerned, they can be divided into two main groups (United States Department of Defence, 2008) according to the confinement of the explosive charge (unconfined and confined explosions). These groups, in turn, can be subdivided depending on whether the blast loading is produced internally or externally with respect to the structure. Since almost all bomb threats of interest for this article are located either on or very close to the ground, the blast load environment is treated as induced by a surface burst. Coherently with this load environment, at detonation the blast wave is instantly reflected and reinforced by ground surface and, during its expansion, appears hemispherical and travels in proximity to the ground nearly parallel to it.
Methods for predicting bomb blast effects
Conventional structures typically are not designed to resist blast loads and so they turn out to be rather vulnerable to damage from explosions. As such, to build up a blast-resistant structure or retrofit an existing one so as to protect personnel and valuable equipment, the main blast wave characteristics (both peak values and transient profiles) are required to be gained.
In order to predict the blast loading pattern relative to each exposure of the surface of a structure, many techniques are available. These procedures can be collected in three groups with an incremental level of complexity and accuracy, namely, empirical (or analytical), semi-empirical and numerical methods (Remennikov, 2003). Empirical methods essentially make use of experimental data, semi-empirical ones utilise simplified models to mimic physical phenomena, while numerical methods virtually reproduce physical phenomena by solving the corresponding governing system of equations including opportune constitutive relationships of materials. Examples of numerical method tools are advanced computational fluid dynamics (CFD) or hydrocodes codes.
Implemented model description
Main characteristics
The implemented novel model, called BomBlast3D (BB3D), is founded on some major assumptions. The first is that, considering what was previously asserted, BB3D uses the data referring to hemispherical surface burst for predicting blast wave characteristics.
Moreover, according to the best practice adopted by blast designers, it is able to consider both the positive and negative phase contribution to airblast loads on acceptor systems which are supposed to behave as perfectly rigid. The last basic hypothesis is that it takes into account the reflection on surfaces at the first impact only and, therefore, it is not able to reproduce containment effects caused by multiple reflections on surfaces except for some simple specific scenarios (as that described hereafter).
The principal advantage of the approach is the intrinsically stable and fast computing, while the major drawbacks are that the blast quantities are not available at the surface not facing the detonation point and that the calculation is not suitable to detail specific blast-related phenomena such as the blast load reinforcement due to the impact of different shock fronts created by multi-reflecting surfaces (e.g. containment effects) except for some simple specific scenarios (as that described hereafter).
BB3D blast computing reference data
BB3D belongs to empirical methods and it is principally based on the United States Department of Defence Unified Facilities Criteria (UFC) manual (United States Department of Defence, 2008). This documentation was produced with the principal objective to establish blast-resistant design procedures and construction techniques utilising the scaling laws approach and taking trinitrotoluene (TNT) as a reference explosive. This document was intended to supersede the US Army Technical Manual TM 5-1300 (United States Department of the Army, 1990) that, in turn, was conceived to improve the earlier US Army Technical Manual TM 5-855-1 (United States Department of the Army, 1986).
By interpolating the profiles reported in UFC design charts, the BB3D model is capable of providing airblast-related parameters distributions in air as well as over rigid surfaces constituting the model to be studied.
In particular, as far as the incident data are concerned, BB3D refers to the profiles shown in Figure 2 defining the positive phase shock wave parameters for a hemispherical surface TNT burst at sea level.
Positive phase shock wave parameters for a hemispherical TNT explosion on the surface at sea level.
These profiles are plotted in a bi-logarithmic representation as a function of the value of the scaled distance
Regardless of the peak reflected overpressure and reflected specific impulse (reflected data), the charts accounting for the influence of the angle of incidence
Reflected overpressure ratio versus incidence angle.
At
Reflected scaled specific impulse versus angle of incidence.
To supply the pressure transient data, unlike TM 5-855-1 where an approximate equivalent triangular pulse is proposed to represent the decay of pressure, BB3D utilises a more realistic methodology assuming an exponential decay of the relative pressure with time commonly referred to as the Friedlander (United States Department of the Army, 1990) equation, that is
for
To account for the contribution of the negative phase as well, the simplified parameter expressions for the negative peak reflected underpressure
and that could be very important for well-designed glazing.
In order to determine blast effects from a high explosive different from TNT, the real mass of the charge has to be converted into a TNT equivalent mass by multiplying the mass of the explosive by a conversion factor representing the ratio of energy output of the explosive materials. Table 1 lists some among the high explosives that can be analysed (Baker et al., 1983; Cormie et al., 2009).
Conversion factors for selected explosives.
TNT: trinitrotoluene; RDX: Research Department Explosive; PETN: pentaerythritol tetranitrate; HMX: high melting explosive.
To supply a first estimate of the amount of injury of people invested by blast wave, curves reporting man’s response to fast rise pressure of short duration are used. These profiles are illustrated in Figure 5 for different values of the percentage of survival, in a bi-logarithmic chart with the scaled impulse (scaled through the quantity
Survival curves for lung damage.
The percentage of survival refers to lung damage because, as far as people mortality is concerned, this is the most critical organ in blast pressure injuries.
BB3D implementation
The BB3D model has been implemented by means of the FORTRAN programming language and, to ease its use, an intuitive and user-friendly graphical user interface (GUI) has been developed. BB3D calculates blast wave characteristics and related quantities in a fast and intrinsically stable manner by definition, and allows to visualise them by means of the open source visualisation tool Paraview® both in air, namely, on nodes not belonging to surface mesh, and over solid reflecting surfaces, that is, on nodes belonging to surface mesh.
Air values are available at nodes belonging to a structured cubic mesh equally spaced along the three axes of the global Cartesian system of the model, whereas solid wall blast values are computed and supplied at triangle centroids of the surface mesh.
According to the commonly recognised computer-aided engineering (CAE) analysis, the block diagram in Figure 6 synthesises all steps required to accomplish a full consistent blast analysis in a proper time-saving way. The calculation procedure foresees the availability of a discretised model (in stereolithography (.stl) ASCII format) constituted by triangles only. With particular reference to shapes constraints typology, the presence of internal surfaces, holes as well as intersecting surfaces is allowed because of the capability of the preprocessor to select only external visible triangles. To enable this feature, a surface recognition method has been integrated into the model. This technique derives the parametric equation of point
Steps of the proposed methodology.
Conventions of the adopted technique for triangle–segment intersection.
By this way, the code turns out to be cleaner, compact and very fast in computing. This approach bypasses the simplification proposed by other authors (Badouel, 1990; O’Rourke, 1998) for which the point and triangle are projected onto a two-dimensional (2D) coordinate plane where inclusion is tested so as to reduce the 3D problem to a simpler 2D problem.
According to the proposed technique, if the segment of the view line connecting the explosion ideal centre
Using this approach, during the set-up of model parameters the view factor distribution on the whole model is then quickly established and provided to the user in conjunction with other characteristics (absolute distance, incidence angle, part database address), to enable checking the correctness of the assignments before computing.
It is worth to express two considerations that are related to the practical use of the presented model. The first is that BB3D assumes that all surfaces behave as perfectly rigid, while the second one concerns the resolution of the achievable numerical results. In fact, taking into account the triangle centroid–based calculation, the local value of a blast wave characteristic parameter is not influenced by triangular area provided that the angle of incidence has the same value. However, the finer is the triangular mesh of the model to study, the more detailed are the blast wave parameters contour maps available at the end of the calculation.
Other two important features that have been implemented are the definition of gauges to locally record the time histories of the pressure and the automatic calculation of the total load and impulse acting on subsets of triangles of the model (parts). The latter capability, in particular, envisages that the subdivision in parts with different names is performed before generating the model to be imported.
Containment effects calculation
In many cases, the evaluation of the contribution to blast due to containment effects is of relevant interest and, hence, it is required to be accounted.
In this view, a specific feature has been implemented adopting a simplification. According to that, the model adds at the triangles of specific parts of the model different from the ground (defined containment receivers) the contribution due to Mach stem that is supposed to develop over some other parts (defined containment sources) as if the explosion was an air explosion.
To determine the blast characteristics to be added, that is, peak reflected overpressure and reflected specific impulse, the height of the triple point that corresponds to the centroids of the triangles of the surface mesh of the vertical walls adjacent to the ground has to be determined. To gain this value, the scaled height of the triple point chart is used. This chart, depicted in Figure 8, reports the value of this quantity
Scaled height of the triple point.
Variation of reflected overpressure versus incidence angle.
Variation of scaled reflected impulse versus incidence angle.
Both containment sources and receivers shall be defined as parts in the native discretised model (.stl file), and their imposition can be accomplished through GUI. Given this procedure, the user is supposed to be suitably aware in advance of the blast wave expansion and impose accordingly both containment sources and receivers.
Model validation
With the purpose of assessing the accuracy of the implemented model, two specific scenarios, for which numerical and experimental data are available in the literature, have been analysed by means of BB3D. These scenarios are termed office block and urban environment and the related results are, respectively, reported in the following sections.
Office block
The first calculation aims at predicting the blast loads induced by an explosion of 100 kg of TNT located in a street at 15 m from a single isolated office building (Remennikov, 2003). Specifically, the interest is focused on a double-glazed window with the dimensions of 1.5 m by 2 m, the centre of which is positioned at 12 m from the ground in the middle of the office block having the dimensions of 20, 20 and 10 m in height, width and depth, respectively.
Figure 11 shows the entire imported model to be studied coloured according to its different constituting parts. In this image, the location of the explosive device (detonation point), as well as of the three gauges, respectively, identified as ground, window and roof, is indicated. In Table 2, the values of the blast wave parameters calculated by means of BB3D are compared with those numerically obtained through the use of the numerical model AUTODYN (ANSYS, 2017). The value of peak reflected overpressure determined by BB3D is less than 8.6% of the value obtained with AUTODYN for the window and roof gauges, whereas that predicted for the ground gauge is about 56.4% (thus, the average value is about 21.6%). As far as the reflected specific impulse is concerned, the average value discrepancy is about 11.6% with a substantial difference of 21.8% for the window gauge. Finally, the average variations for the predicted values of time of arrival and positive phase duration are, respectively, 4.2% and 9.7%. Considering the negative phase contribution on the window,
Geometrical model of the first validation case.
Comparison between the numerical outputs of BB3D and AUTODYN (Remennikov, 2003).
Urban environment
The objective of the second validation test is to perform a blast study of a typical street geometry reproducing a small-scale experiment built up by Feng (1997). The plan of the real-scale geometry used to carry out the computational investigation is shown in Figure 12 and consists of two side buildings of 0.15 m height with two cubic buildings opposite to the end of the street. As depicted in Figure 12, an explosion of 0.008 kg of TNT occurs halfway along the street on the street centerline. In the laboratory-scale model, the blast parameters of interest were measured by locating a gauge point in correspondence to the mid-length of the front face of the cubic building opposite to the end of the street as indicated in Figure 12.
Geometrical plan of the urban environment model for BB3D computing.
The aim of the study is also to compare the BB3D results in terms of overpressure and positive phase specific impulse, with the experimental ones measured by Feng (1997) and by Fairlie (1997) that were obtained using different tools. These tools are AUTODYN and other empirical codes as Conwep (Hyde, 1992) and Kinney and Graham (1985) (hereafter referred to as K&G for simplicity). In this work, in particular, three configurations were analysed. The first configuration (Case 1) foresaw the study of a model with no buildings, the second one (Case 2) did not consider side buildings but included the buildings opposite to the end of the street and the final one (Case 3) took into account all buildings. With regard to the results, for Case 1 only computational data are available, whereas for the remaining cases both computational and experimental data are reported.
As concerns BB3D runs, one single model was used. This model, illustrated in Figure 13, has two gauges near the basis of the cubic building, one positioned on the ground and another located on the front face in order to monitor the side-on (Case 1) and face-on (Cases 2 and 3) blast wave parameters, respectively. Specifically, for face-on parameters, the results of Cases 2 and 3 can be, respectively, obtained by disabling and enabling the containment effects calculation. In the latter case, the front faces of the building at the end of the street have been imposed as containment receivers, while to the faces of the side buildings adjacent to the street have been assigned the containment sources.
Geometrical model of the second validation case.
Table 3 summarises for the configuration of Case 1 the comparison of numerical outputs in terms of the face-on (incident) blast wave characteristics. This comparison highlights how all outputs favourably approximate each other. In Table 4, the comparison of the reflected blast wave parameters gained through BB3D and experimental data is shown. In both cases, BB3D properly reproduces the physical phenomenon of blast wave reflection and thus provides a good estimation of the reflected parameters of interest. In particular, for Case 1 differences between the predictions of BB3D and experimental results for the peak reflected overpressure and specific impulse are 0.3% and 1.3%, respectively. Relating to Case 3 where the containment effects are considered in computing, the results show an agreement with 7.9% for the peak reflected overpressure, whereas the difference is rather sensitive for the reflected specific impulse (49.1%).
Comparison of Case 1 computational outputs.
Comparison between the BB3D and experimental data.
Figures 14 and 15 show a comparison of the peak reflected overpressure distribution on the cubic building (imposed as a receiver in BB3D computing) calculated, respectively, without and with the containment effects due to blast wave flow channelling.
Peak reflected overpressure distribution on the front face of the building at the end of the street (no containment).
Peak reflected overpressure distribution on the front face of the building at the end of the street (with containment).
It is worth mentioning that for Case 3, that is, when the channelling effects are supposed to be accounted, the Conwep code dangerously underpredicts the blast wave parameters since it provides for the peak reflected overpressure a value of 83.65 kPa and for the positive phase impulse a value of 23.3 kPa ms (Fairlie, 1997). As previously stated, this fact is the consequence of a typical drawback of empirical codes, that is, the lack of the capability to properly include in calculation the contribution caused by the proximity of multi-reflecting surfaces.
Applications of industrial relevance
The principal objective which pushed the development of the BB3D model was to provide the blast designers with a fast computing tool to be utilised in many circumstances, such as the preliminary blast vulnerability assessment or the redesign of a civil infrastructure with the purpose of improving its blast physical resilience. To name two examples of practical significance, the results achievable through the implemented code can support the quantification of the structural resistance required for an infrastructure component (such as protective barrier) or the verification of the effectiveness of blast countermeasures to be adopted in specific environments depending on the type and the localisation of the explosive.
In order to evidence the usefulness of the predictions achievable by means of the proposed methodology, critical scenarios of a real application have been simulated. In particular, the airblast-induced loading due to two terrorist attacks towards a rail station has been assessed. The geometrical model of this study case is illustrated in Figure 16, and the otbained results are described in the following section.
Terminal model for the study case.
Rail terminal terrorist attack
The study case concerns a terrorist attack to a rail terminal station for two different critical scenarios. The model to be investigated, as well as the virtual explosion centre position for both configurations, is illustrated in Figure 16.
The final discretisation of the model constituting surfaces is composed of about 61,800 triangles and has been obtained by means of a free surface mesh algorithm.
As stated, two critical scenarios have been identified and considered for blast analysis. The first critical scenario of interest foresees the detonation of 160 kg of Semtex on the ground (equivalent to 200 kg of TNT) opposite to one of the minor side faces of the station (termed the side building case) to evaluate the total loads which some structures are subjected to. The second one considers the detonation of 20 kg of TNT on the central platform (termed the central platform case) with the main purpose of determining the injury to people depending on their localisation with respect to the explosion.
Figure 17 details the position of the Semtex charge for the side building case study as well as the eight glazing units (the bottom row includes the units numbered 1–4 that are visualised from left to right, while the top row includes the units numbered 5–8 that are visualised from left to right) and one 3-m-height blast protective barrier. In this figure is also depicted the numbering of glazing units that, together with the barrier, are the acceptor systems of interest. The number of visible triangles of the unstructured surface mesh is about 20,500.
Side building explosion location and monitored receivers.
The collected snapshots shown in Figure 18 summarise the transient distribution of the reflected pressure on the structures near the explosion adapting the visualisation value range.
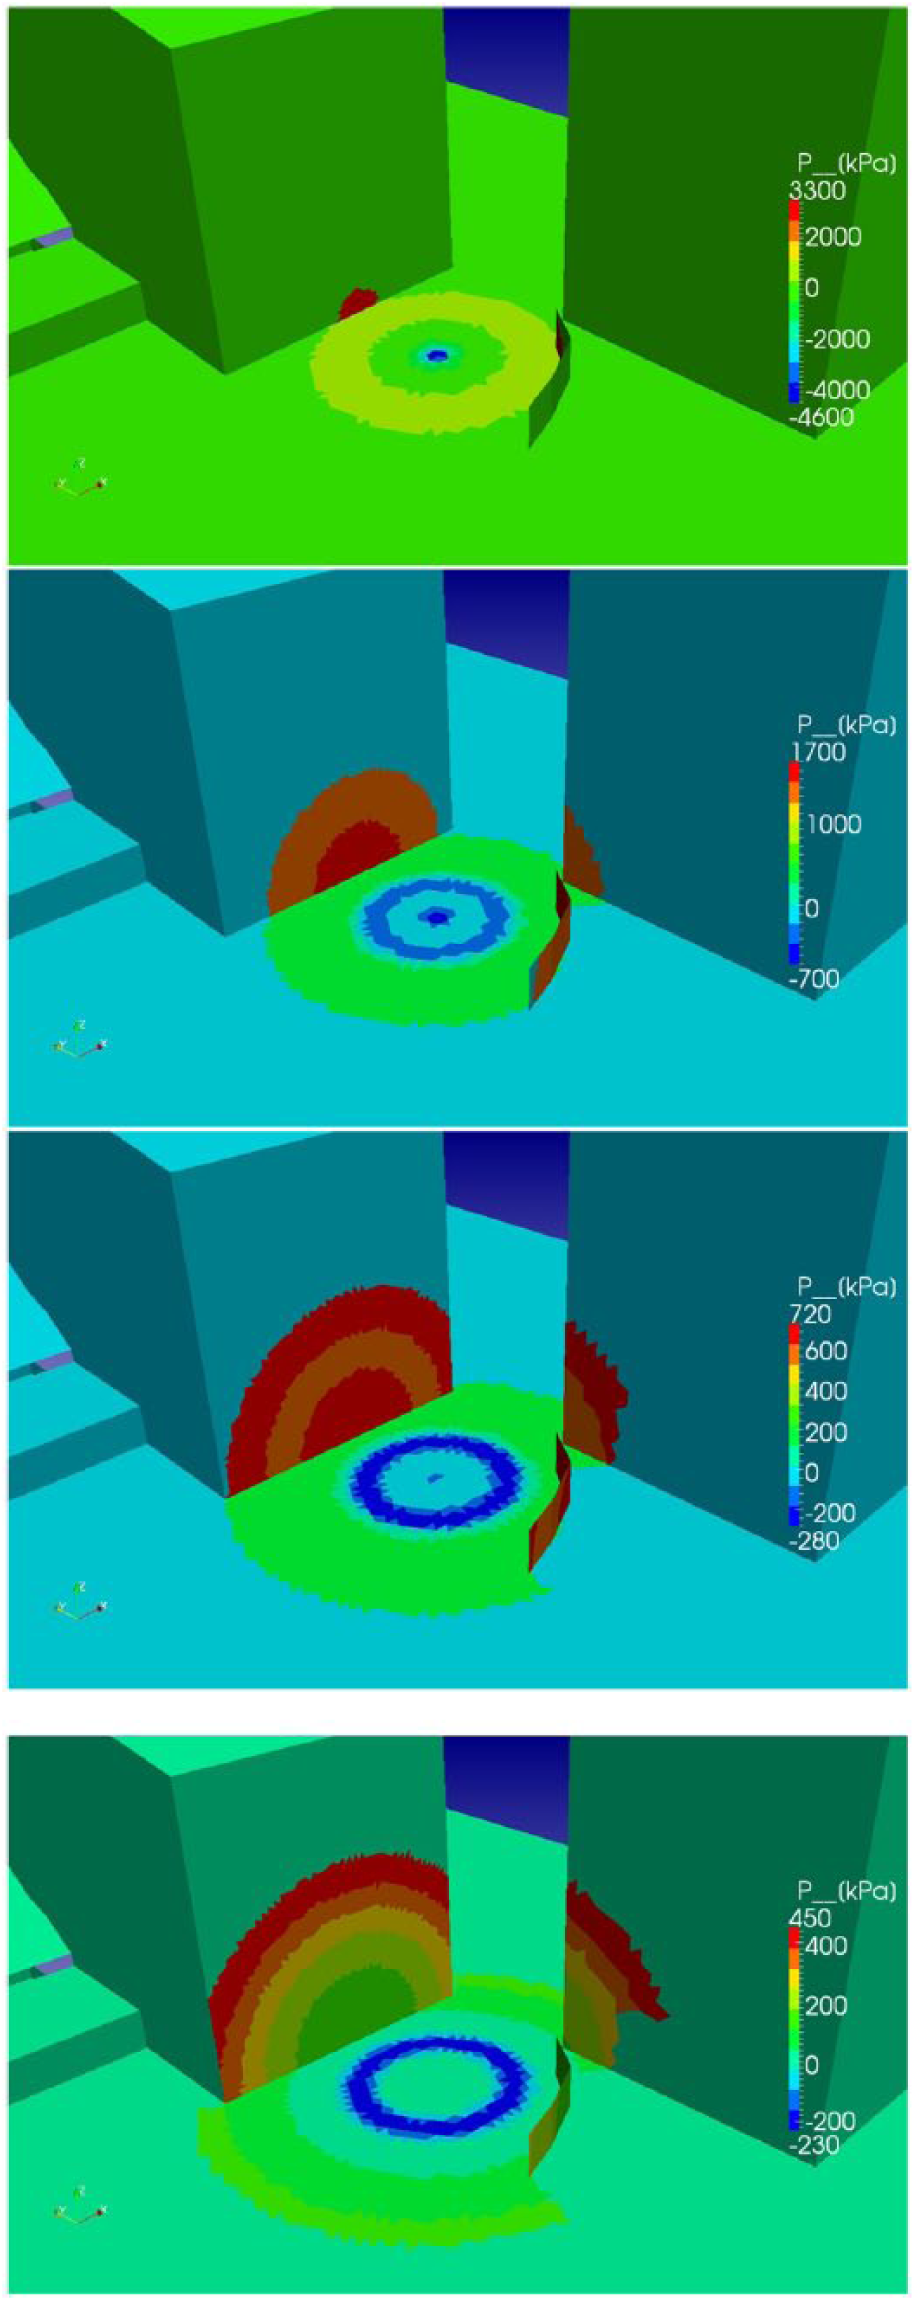
Transient distribution of the reflected relative pressure on structures near the explosion for the side building case.
The map of this blast wave characteristic is visualised from top to bottom through a sketch of images recorded from 5 to 20 ms with step 5 ms of time of simulation after detonation. These maps show how the blast wave front impacts and expands around the structures near the explosion and generates areas subjected to underpressure environment. The maximum predicted peak reflected overpressure value on the side building and on the protective barrier is about 35 bar for both.
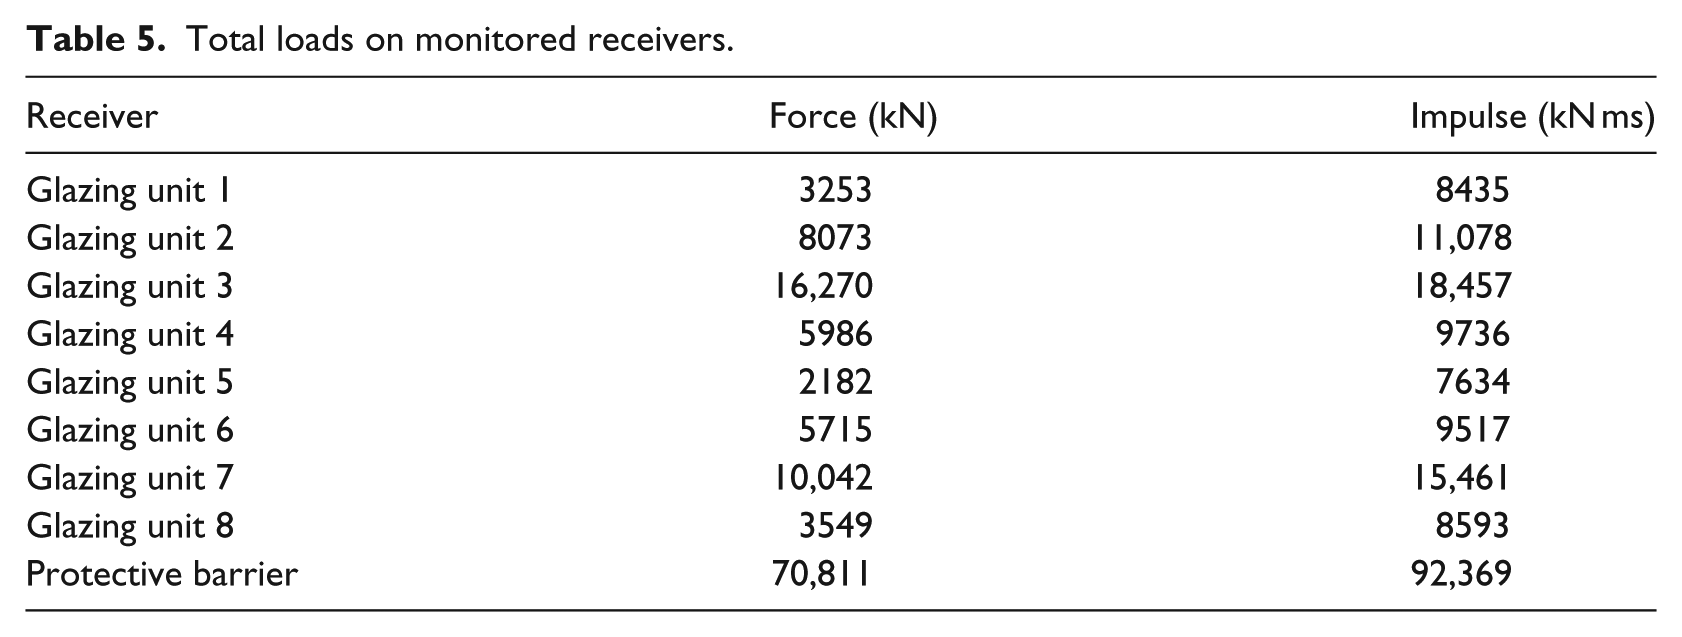
In Table 5, the predictions of total loads on the monitored receivers are summarised. In this case, however, another feature of the tool has been used, namely, the calculation of the total acting force accounting for the area of the glazing and the positive phase only. Through the knowledge of these values, an appropriate structural analysis can then be developed to assess the integrity risk of these structures.
Total loads on monitored receivers.
As far as the central platform case is concerned, taking into account its principal objective, a structured mesh enclosing platforms and platforms roof has been generated. The cubic structured volume mesh is constituted by about 21,000 nodes, of which about 14,000 are effectively visible from the detonation centre, whereas regardless of unstructured surface mesh the number of triangles visible is about 10,700.
Figure 19 reports the peak incident distribution on a vertical plane cutting the air structured mesh passing through the detonation centre. The plotted values have a spherical shape and are visualised until 10 bar. Figure 20 shows the survival percentage distribution on a horizontal cutting plane of the air structured mesh, positioned 1 m on the plaftform ground level. The survival percentage refers to people with an average weight of 65 kg accidentally standing nearby.
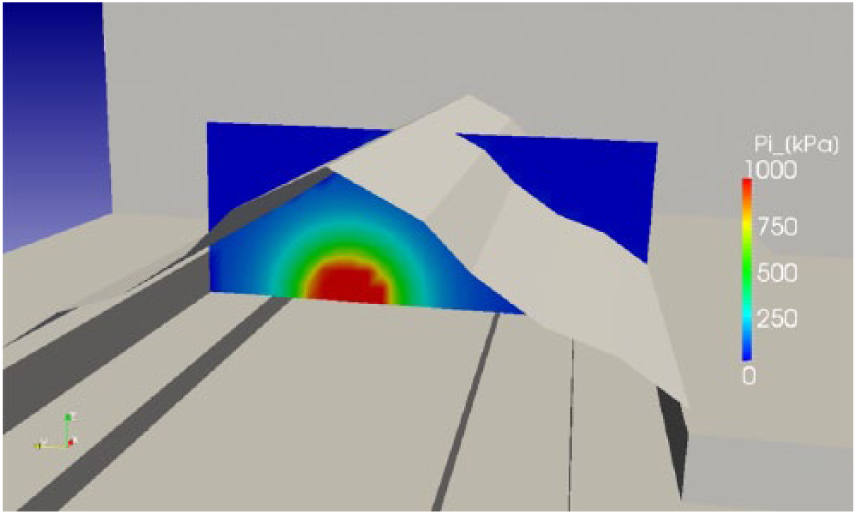
Peak incident distribution on a vertical cutting plane passing through the detonation centre.
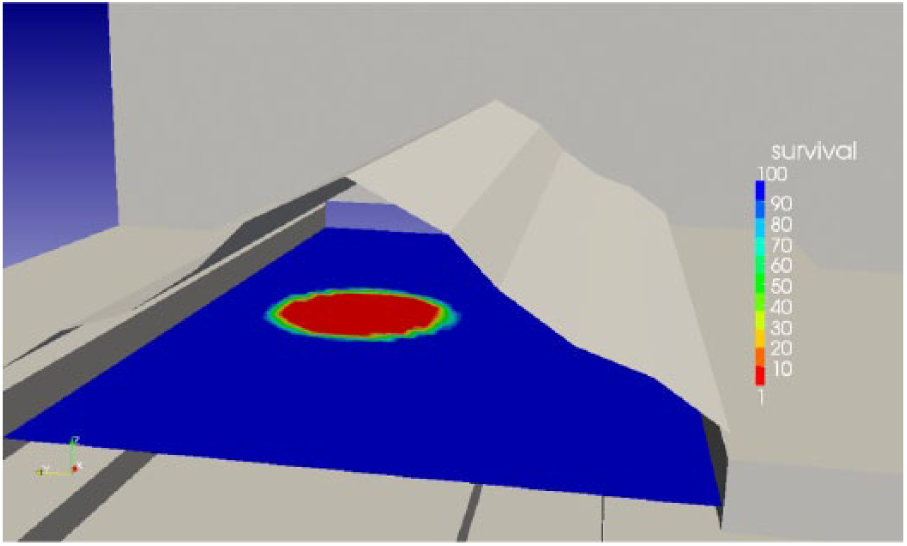
Survival percentage distribution for an average weight of 65 kg on a horizontal cutting plane.
Table 6 summarises the computational averaged time in hours required to run the above-described models and compares them with an estimate of those characterising the standard advanced numerical techniques.
Comparison between the time required for blast study by BB3D and advanced techniques.
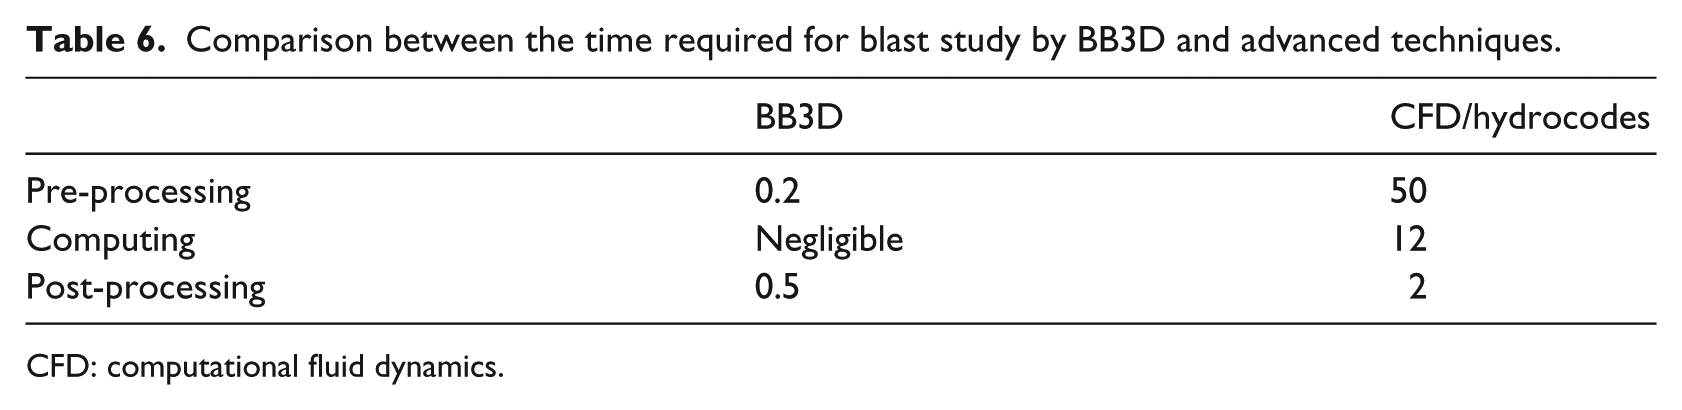
CFD: computational fluid dynamics.
In particular, for the pre-processing step, a .stl ASCII file was available at the start of BB3D run, while a cleaned-up model was supposed to be available for CFD/hydrocodes computing. An average quality workstation and parallel computation have been employed during the computation. Considering these times, the advantage of using BB3D turns out to be quite evident.
Conclusion
The development of a novel empirical tool to perform full consistent 3D bomb blast analysis has been established and described. Based on the experimental data, the proposed procedure timely supplies the distribution of blast wave parameters both in space and over solid surface.
The presented tool has been positively validated against both the numerical and experimental data present in the literature and, then, it is proposed as a mature and efficient new means to perform sufficiently accurate blast studies on complex model geometries.
By providing a preliminary but sensitive estimate of the operative environmental loading, such a means represents a good alternative to the more powerful but time-consuming numerical tools, the use of which can thus be limited to the final phase of the blast design.
Considering its distinctive capabilities, it is promoted as a good candidate for the retrofit design activity of industrial engineering programs for which the prevention of blast effects to structures, equipment and people as well is of relevance and also to perform threats to facilities and plan sites for new construction and evacuation protocol strategies.
Footnotes
Acknowledgements
The proposed new tool has been developed within the SECURESTATION (European Commission, 2011) research project and has been properly conceived to provide the blast designer with a predictive instrument to perform blast resilience studies within a more general simulation-based design (SBD) secure approach, envisaging the use of other tools for the simulation of fire and smoke propagation, particle dispersion and people evacuation.
Declaration of conflicting interests
The author(s) declared no potential conflicts of interest with respect to the research, authorship and/or publication of this article.
Funding
The author(s) disclosed receipt of the following financial support for the research, authorship, and/or publication of this article: The author is grateful for the support from the SECURESTATION Project, SST-2010-RTD-1, of the 7th Framework Programme of the European Commission.