
Abstract
To predict the consequences of large-scale explosions, it is desirable to understand the response of various industrial and civil structures to blast loading. To this end, a numerical study was undertaken to investigate the sensitivity of response of one such class of structure, storage tanks, to the following factors: geometry, fill level and loading. In support of this study, a series of scaled tests was conducted. These tests were used to confirm key damage mechanisms and provide validation data. Output from subsequent simulations of the scaled tests showed good agreement with equivalent experimental results. An outline of the initial numerical study, a description of the experimental programme and an overview of the subsequent validation exercise are presented and discussed.
Introduction
Large-scale explosions – defined in this study as those with a high TNT equivalency (>∼0.1 kT) and a long positive phase duration (>∼100 ms) – have the capacity to cause damage over a widespread area. These types of explosions are often caused by industrial accidents, examples of which include the 2020 Beirut Port Explosion, 2015 Tianjin Port Explosions and 2005 Buncefield Disaster, with TNT equivalencies of 0.5-1.1 kt (Rigby et al., 2020), 0.39 kt (Fu et al., 2016) and 0.1 kt (Atkinson, 2011) respectively. Substantial structural damage was observed as a result of each of these events, with window breakage being reported kilometres away from the detonations (Al-Hajj et al., 2021; Huang and Zhang, 2015; British Geological Survey, n.d).
Infrastructure such as portal steel-framed warehouses and storage tanks are often found in locations where industrial accidents may occur. For example, during post-event analysis of the Buncefield disaster (Atkinson, 2011), these were the main types of structure that were assessed for damage due to their prevalence in the area. For this reason, it is important to understand how they respond structurally to blast from large-scale explosions.
A number of studies have explored the response of storage tanks to blast. For example, Lu et al. (2019) conducted both numerical analyses and scaled experimental tests on roofless storage tanks to explosions of 1500 kg and 380 kg TNT equivalent at a standoff of 25 m. Their findings showed that the tanks under consideration plastically deformed under the blast loading, but the liquid level acted to reduce the level of damage. Al-Yacouby et al. (2021) conducted a numerical study with a similar roofless tank and blast environment, varying both wall thickness and liquid level. Their findings, however, suggested that the influence of liquid level was minimal. Based on precedent, during large-scale blast events, the explosive yield would typically be at least 100 times greater than that considered in both aforementioned studies, which in turn may significantly alter the response of storage tanks in comparison.
The study discussed herein explored the response of cylindrical fluid storage tanks to blast events more akin to large-scale industrial accidents. This included the design of a typical fluid storage tank followed by a full-scale numerical investigation of tank structural response to blast with variations in fill-level, tank diameter and standoff distance, through which key damage mechanisms were identified. To confirm the validity of these mechanisms, a series of scaled experimental tests were also conducted. Finally, model validation, using data from the tests, was undertaken. All initial modelling was carried out using an ‘uncoupled’ methodology, whereby the blast load on the tank was calculated using a hydrocode with a rigid representation of the structure. The pressures acting on the rigid representation were extracted and then mapped on to a deformable structure in a Finite Element (FE) code to solve for structural response. As a follow up to this study however, an alternative, coupled fluid-structure interaction (FSI), methodology was adopted to determine the key differences between, and advantages and limitations of, the two approaches. The results obtained using the coupled methodology are presented briefly at the end of this article.
Representative storage tank design
Storage tank design can vary greatly depending on the industry and contents for which they are intended. Even within a sub-category of tank, such as POL tanks, there may be a wide range of sizes, shapes and construction types. In order to avoid having to model large numbers of storage tank geometries, several representative, idealised, designs were developed. These designs were primarily based on British Standard, BS EN 14,015:2004 (British Standards Institute, 2004), however, as this did not provide detailed guidance on roof design, US Standard API 650 (American Petroleum Institute, 2021), was also consulted. The designs sought to capture the key structural features of typical cylindrical POL storage tanks. These included tapered walls, stiffening ribs, welded construction and a floating roof (with no structural connection to the walls). The representative designs were subsequently used in the full-scale numerical modelling study and were the basis for the tank design employed in the scaled trial. A schematic of a typical POL storage tank design is shown in Figure 1. Schematic of a typical POL storage tank design.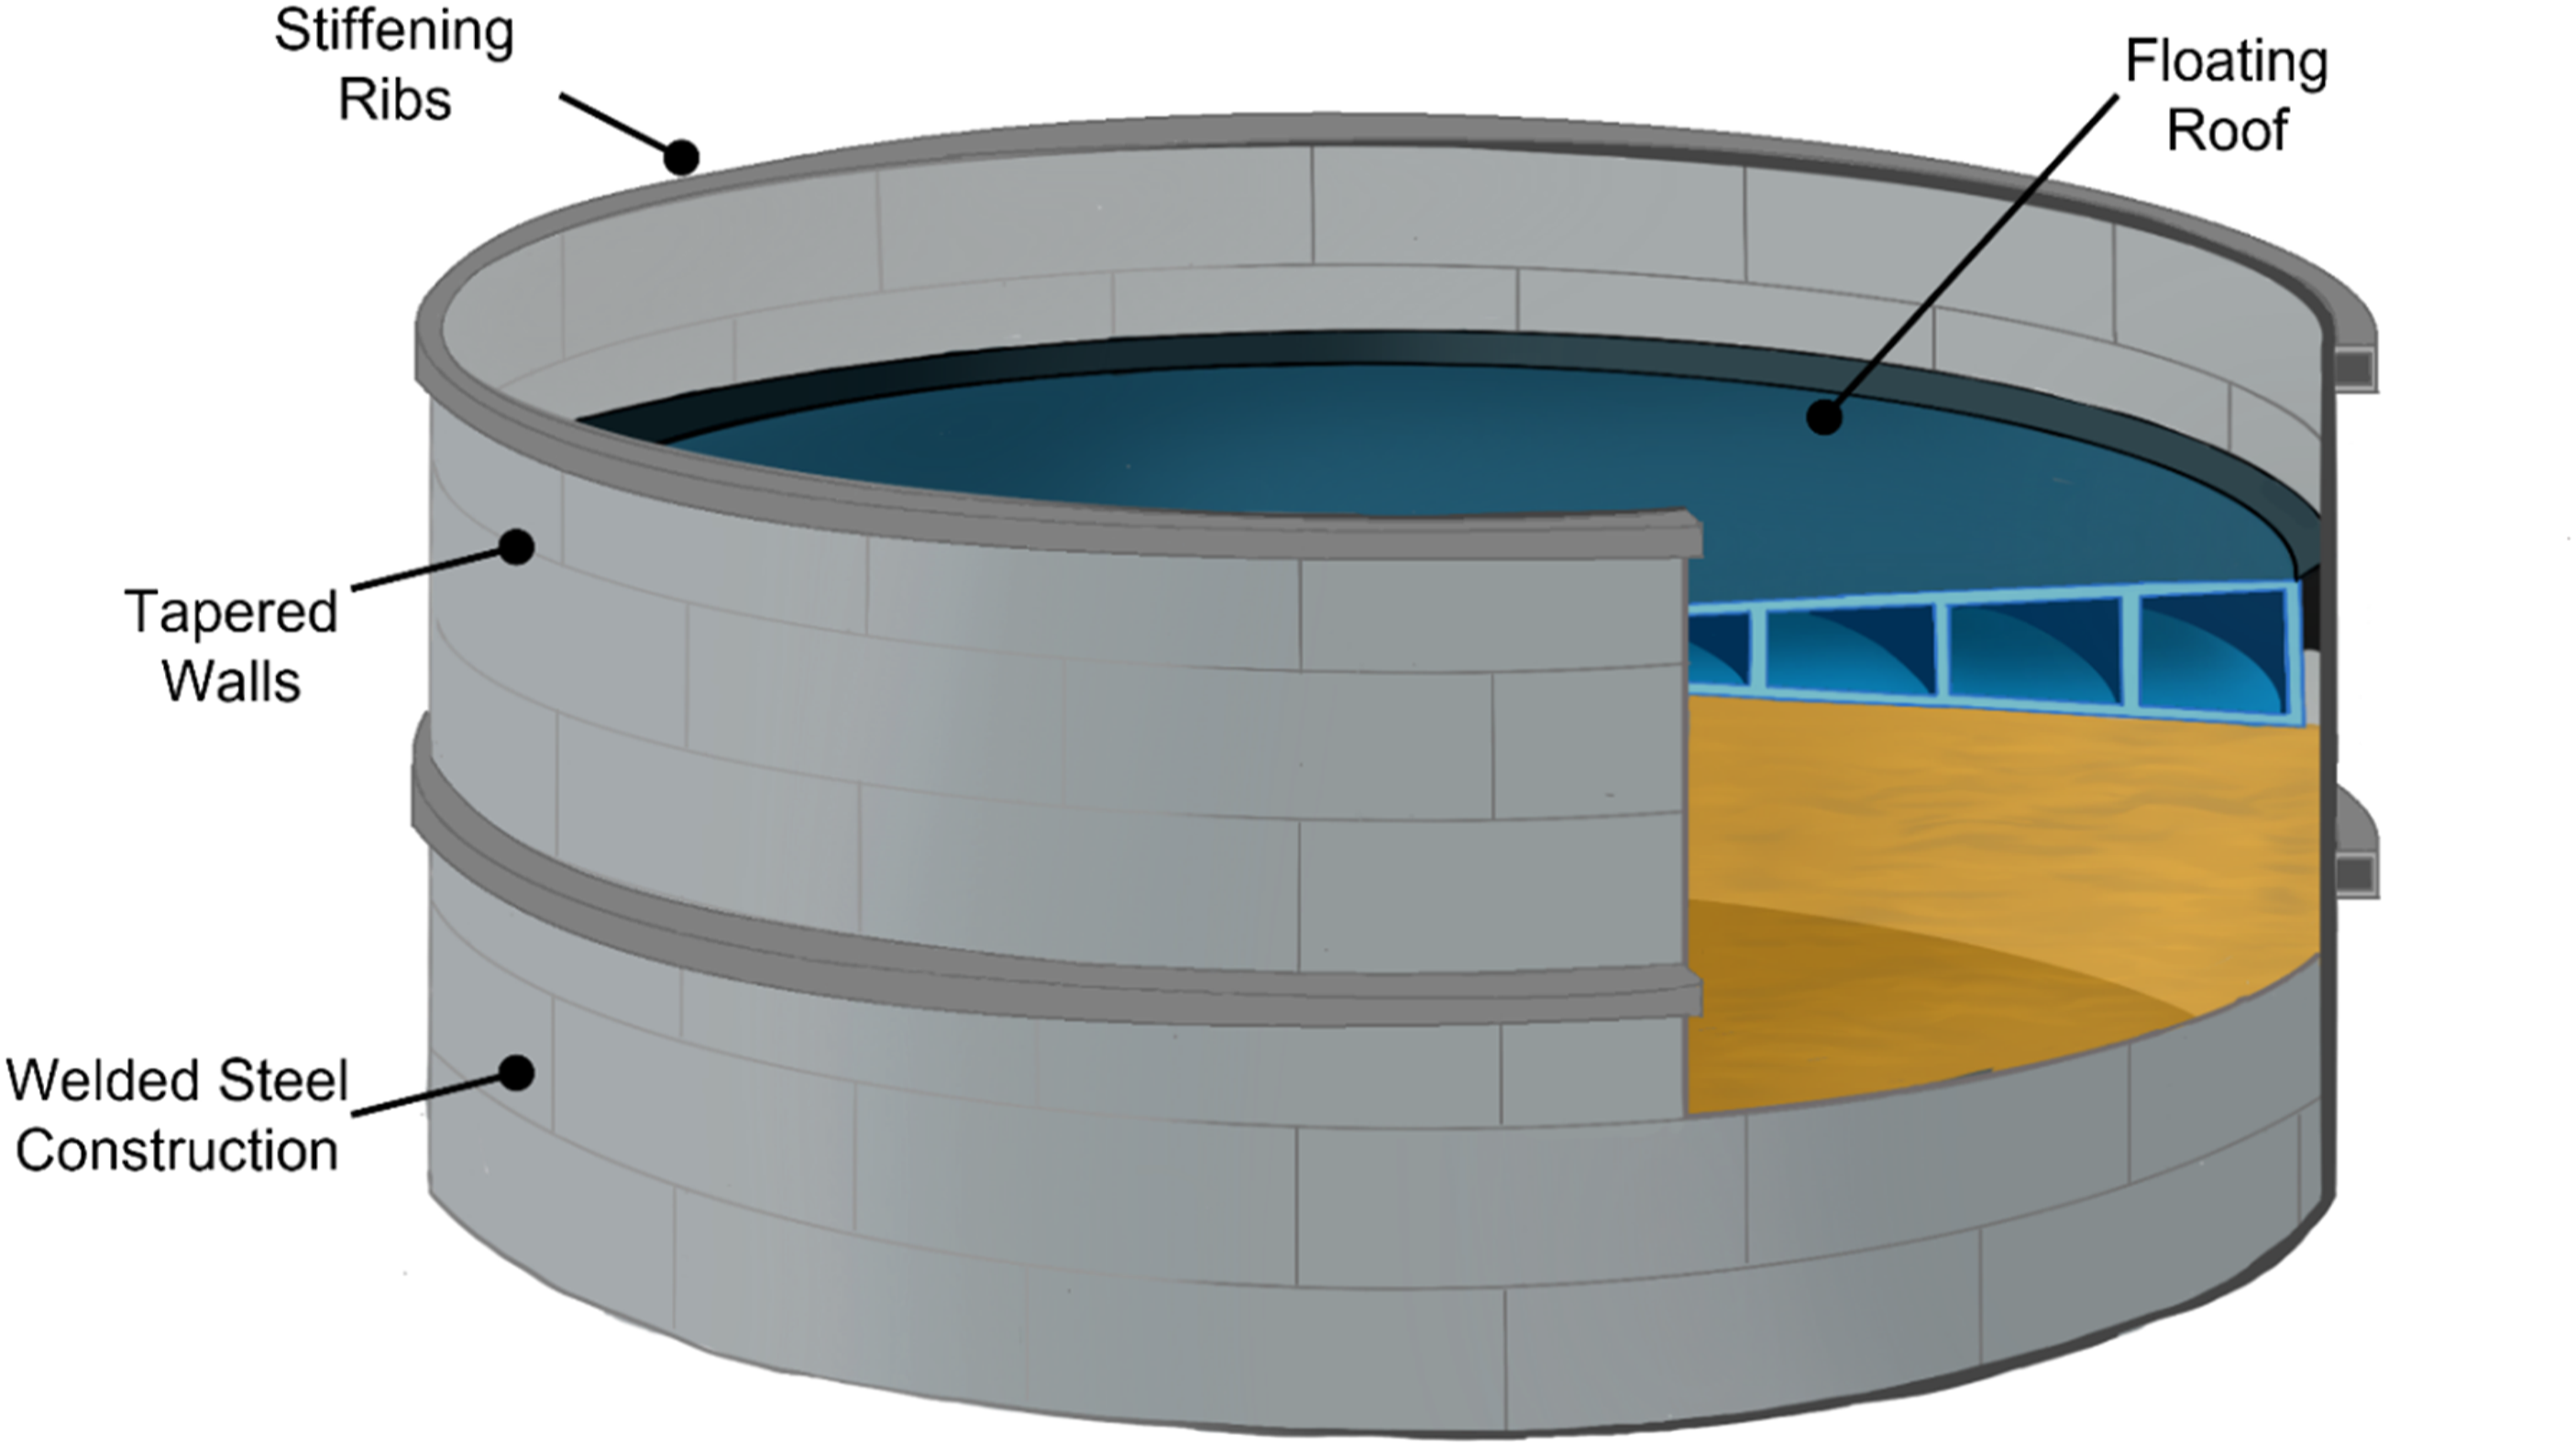
Full-scale numerical study
Approach
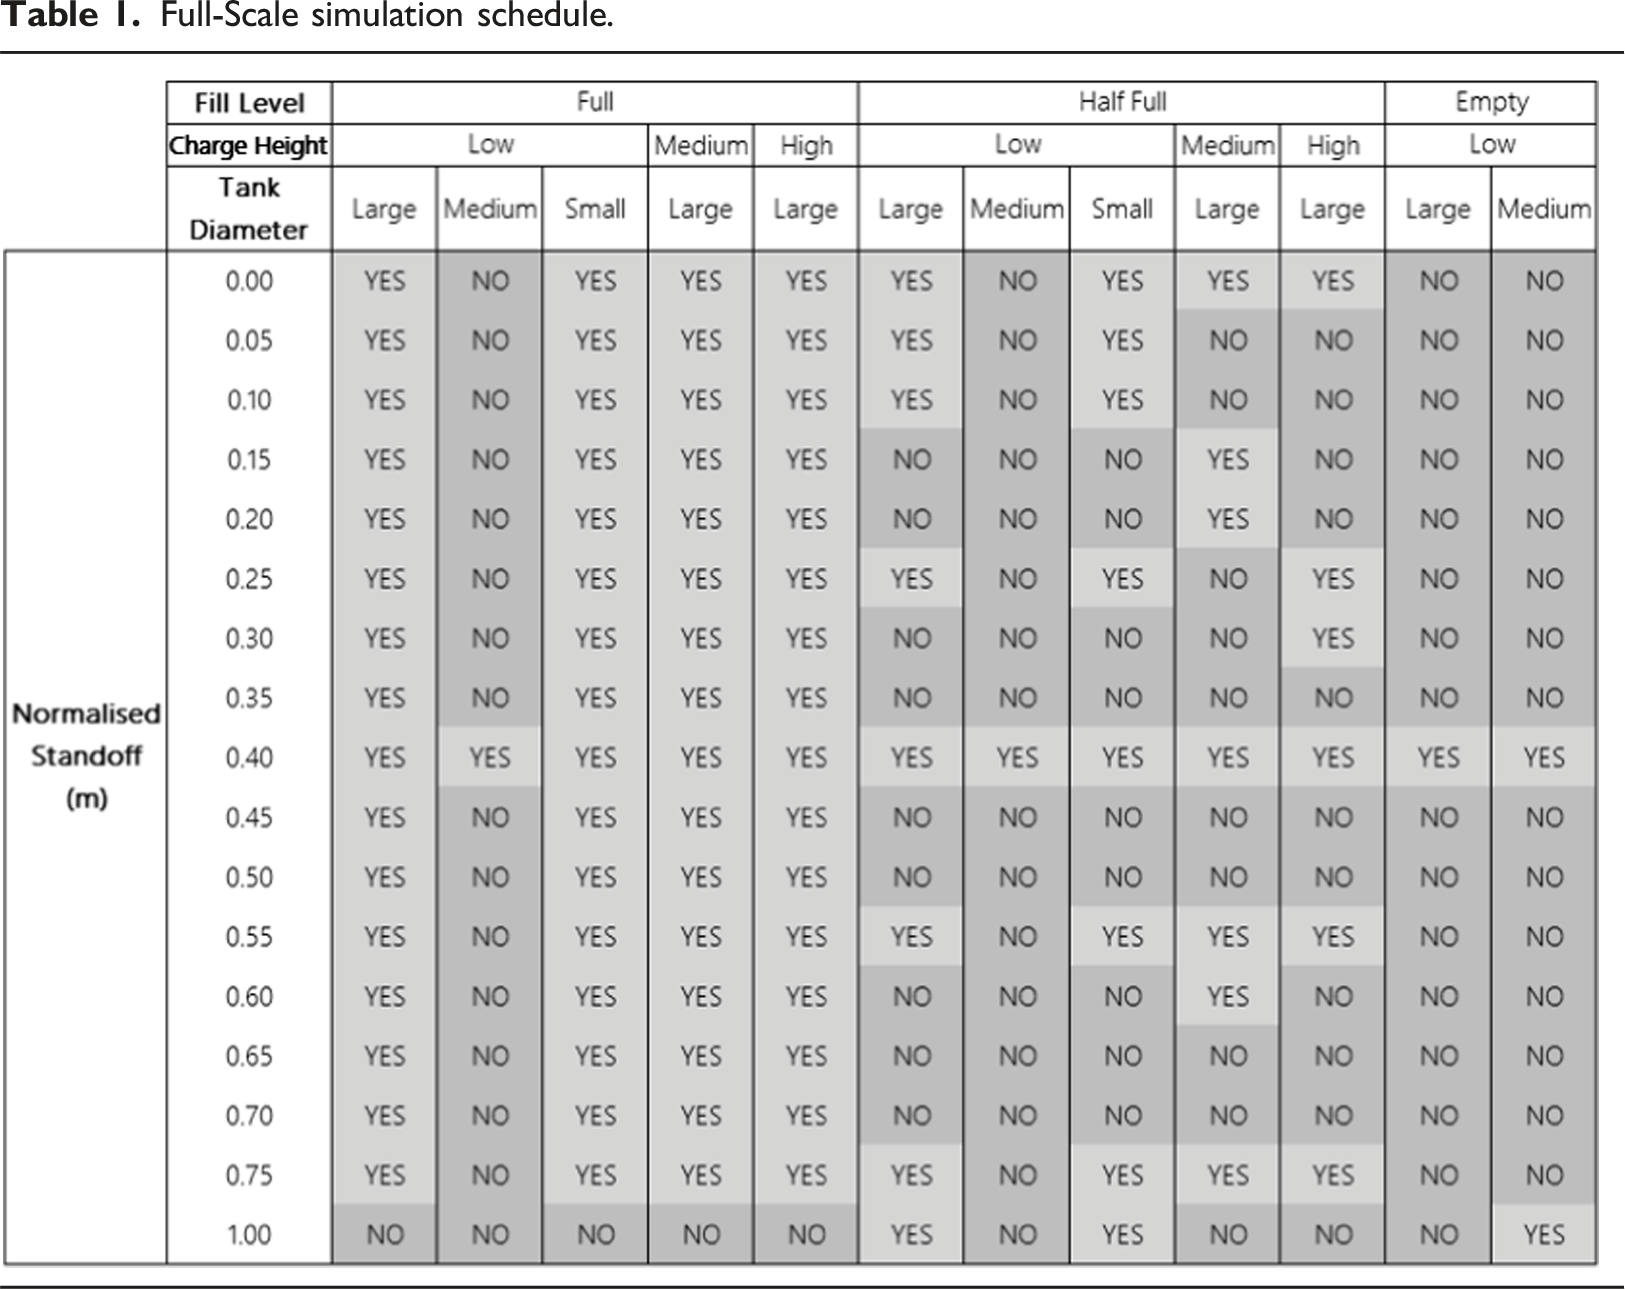
The numerical study was undertaken to gain an appreciation of the key mechanisms by which POL storage tanks may be damaged, and the thresholds, with respect to loading, at which they occur. Various standoff distances and charge height combinations for a single charge mass were simulated to produce a spectrum of loading conditions. The effects on tank structural response of fill level, tank diameter and corresponding wall thickness were then investigated.
Full-Scale simulation schedule.
An uncoupled modelling methodology was employed: blast loadings on rigid representations of the tanks were generated in a hydrocode; the resulting pressure-time histories were then applied to deformable representations of the corresponding tanks in a finite element code. This approach is predicated on the assumption that the level of structural deformation is small over the duration of the blast loading. Although this assumption does break down towards the latter stages of some simulations, it held for long enough to provide a good indication of the damage expected. A fully coupled Fluid-Structure Interaction (FSI) approach was subsequently pursued on select model configurations to provide greater accuracy and confirm previous results.
Blast loading methodology
The explicit hydrocode, SHAMRC (Applied Research Associates Inc., 2021), developed by Applied Research Associates (ARA) was used for calculation of the blast loadings. SHAMRC is well optimised for simulation of blast from both large-scale and conventional high explosive events. A schematic of the SHAMRC setup with the study variables defined is shown in Figure 2. Tank loading scenario schematic.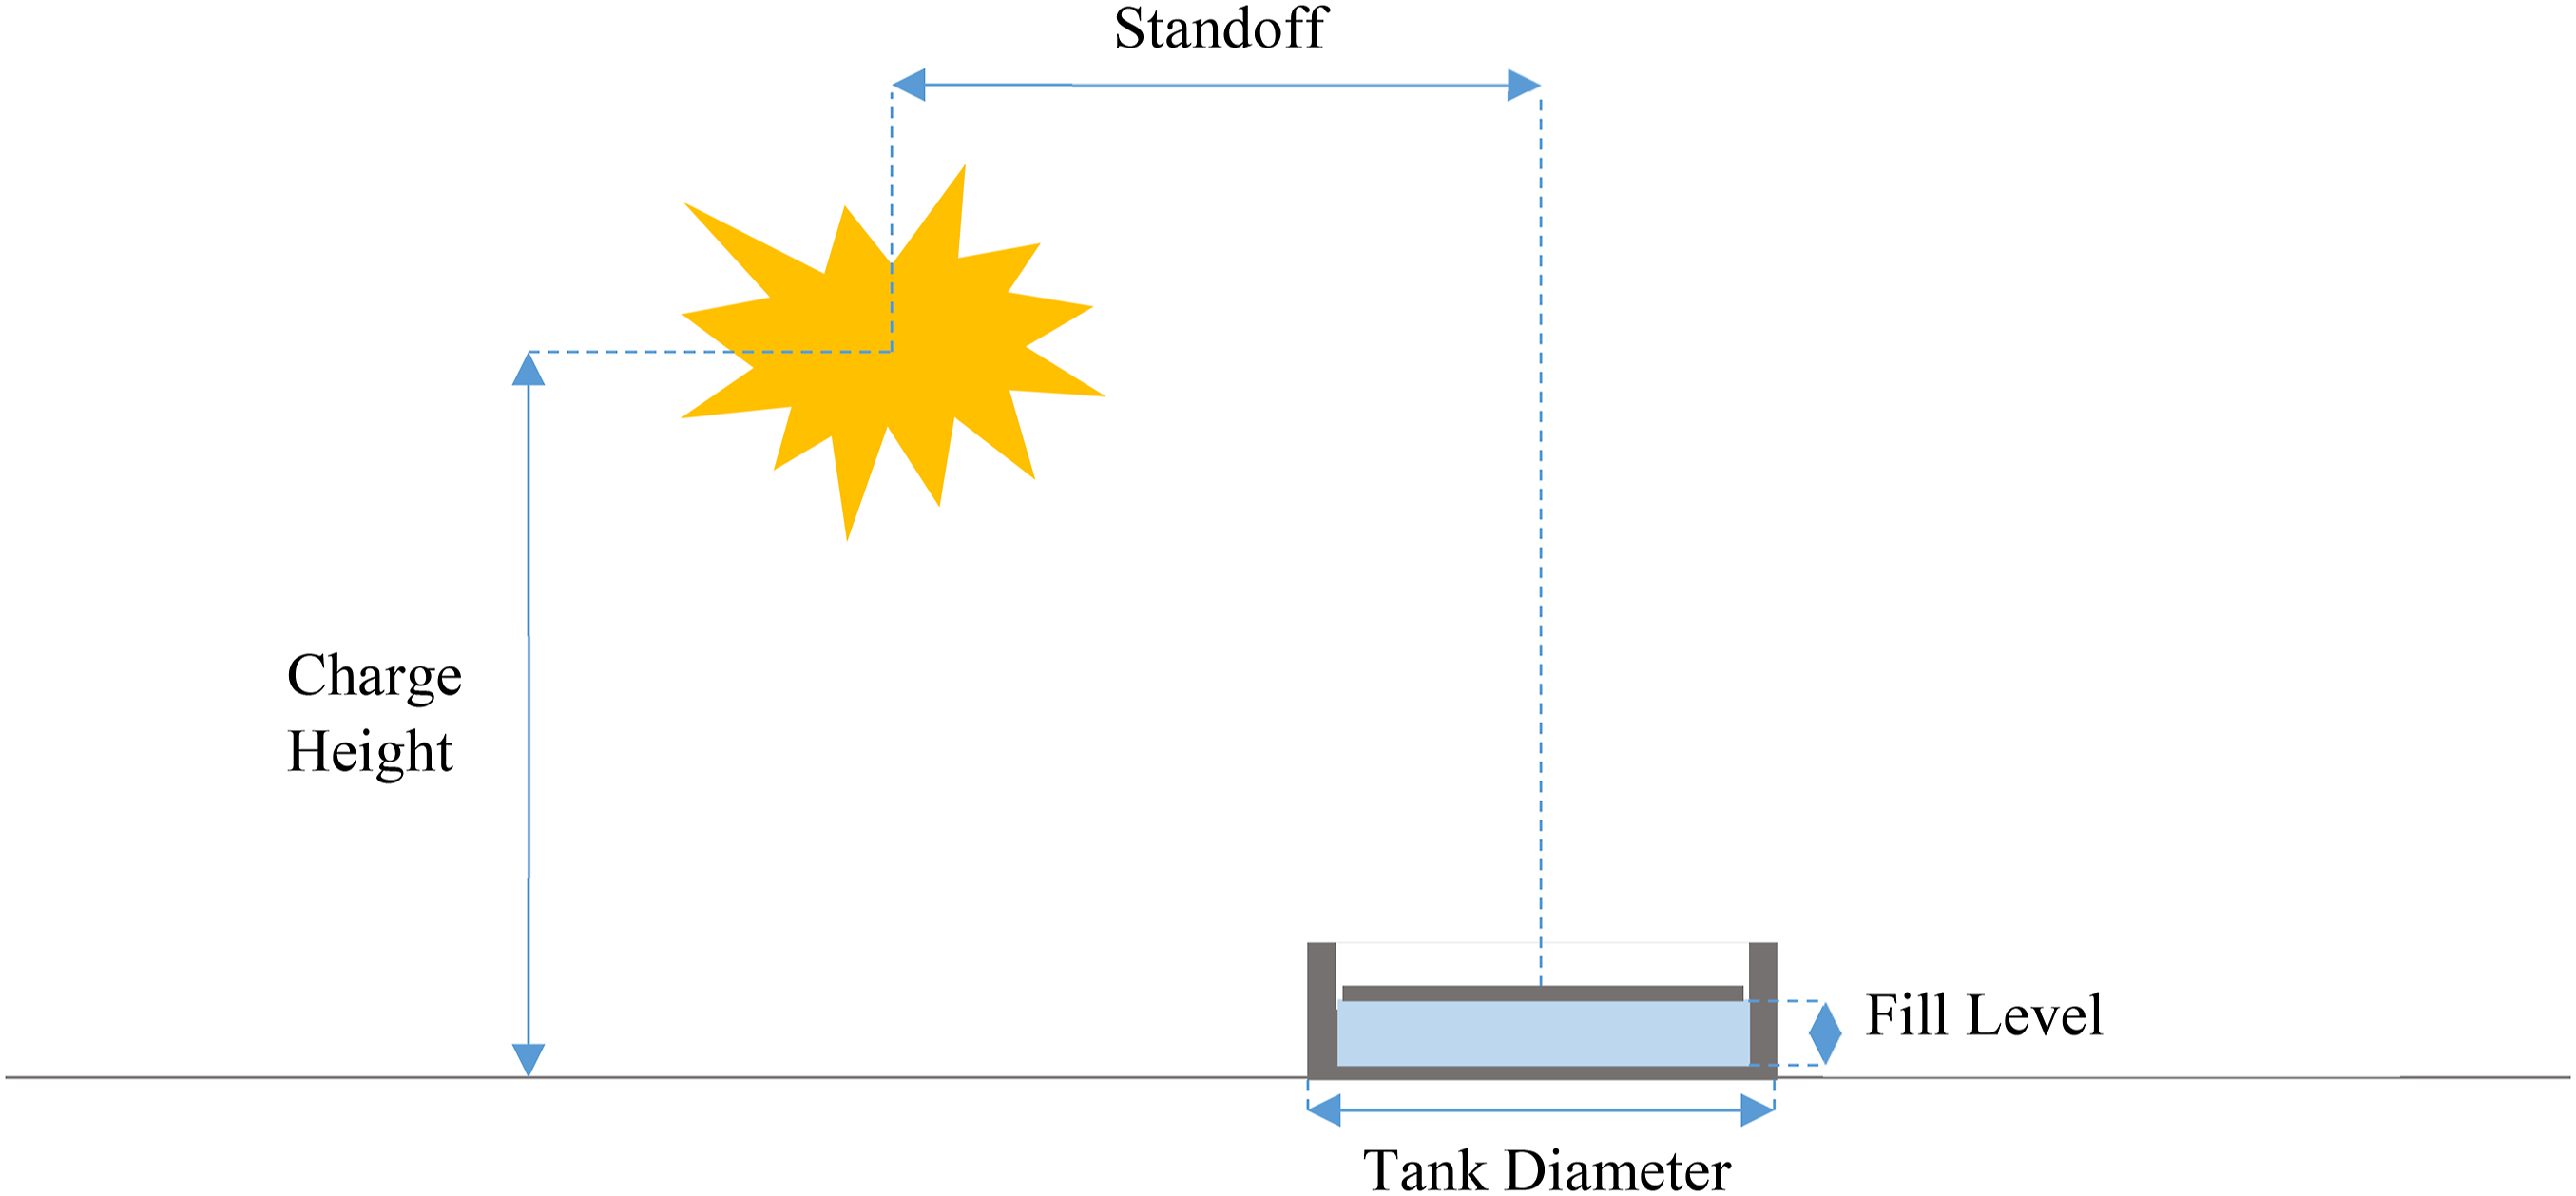
With the exception of the geometries and mesh, the same inputs were given to the full-scale SHAMRC models as the scaled SHAMRC validation models, and, as such, the full setup details can be found in the ‘Numerical Modelling of Trials for Validation’ section of this paper.
Structural response methodology
To simulate the structural response of the tanks to the blast loadings produced from SHAMRC, the Sandia National Laboratory (SNL) finite element code, Sierra/Solid Mechanics (SM) (Sandia National Laboratories, 2022), was used. The tank structures were initially created within the general-purpose pre-processor, Hypermesh (Altair Engineering Inc., 2019), developed by Altair, before being exported and converted into Sierra/SM format. The SHAMRC loads were applied over the surface of the structures using discretised ‘load patches’ as shown in Figure 3. Structural tank model showing pressure load patches.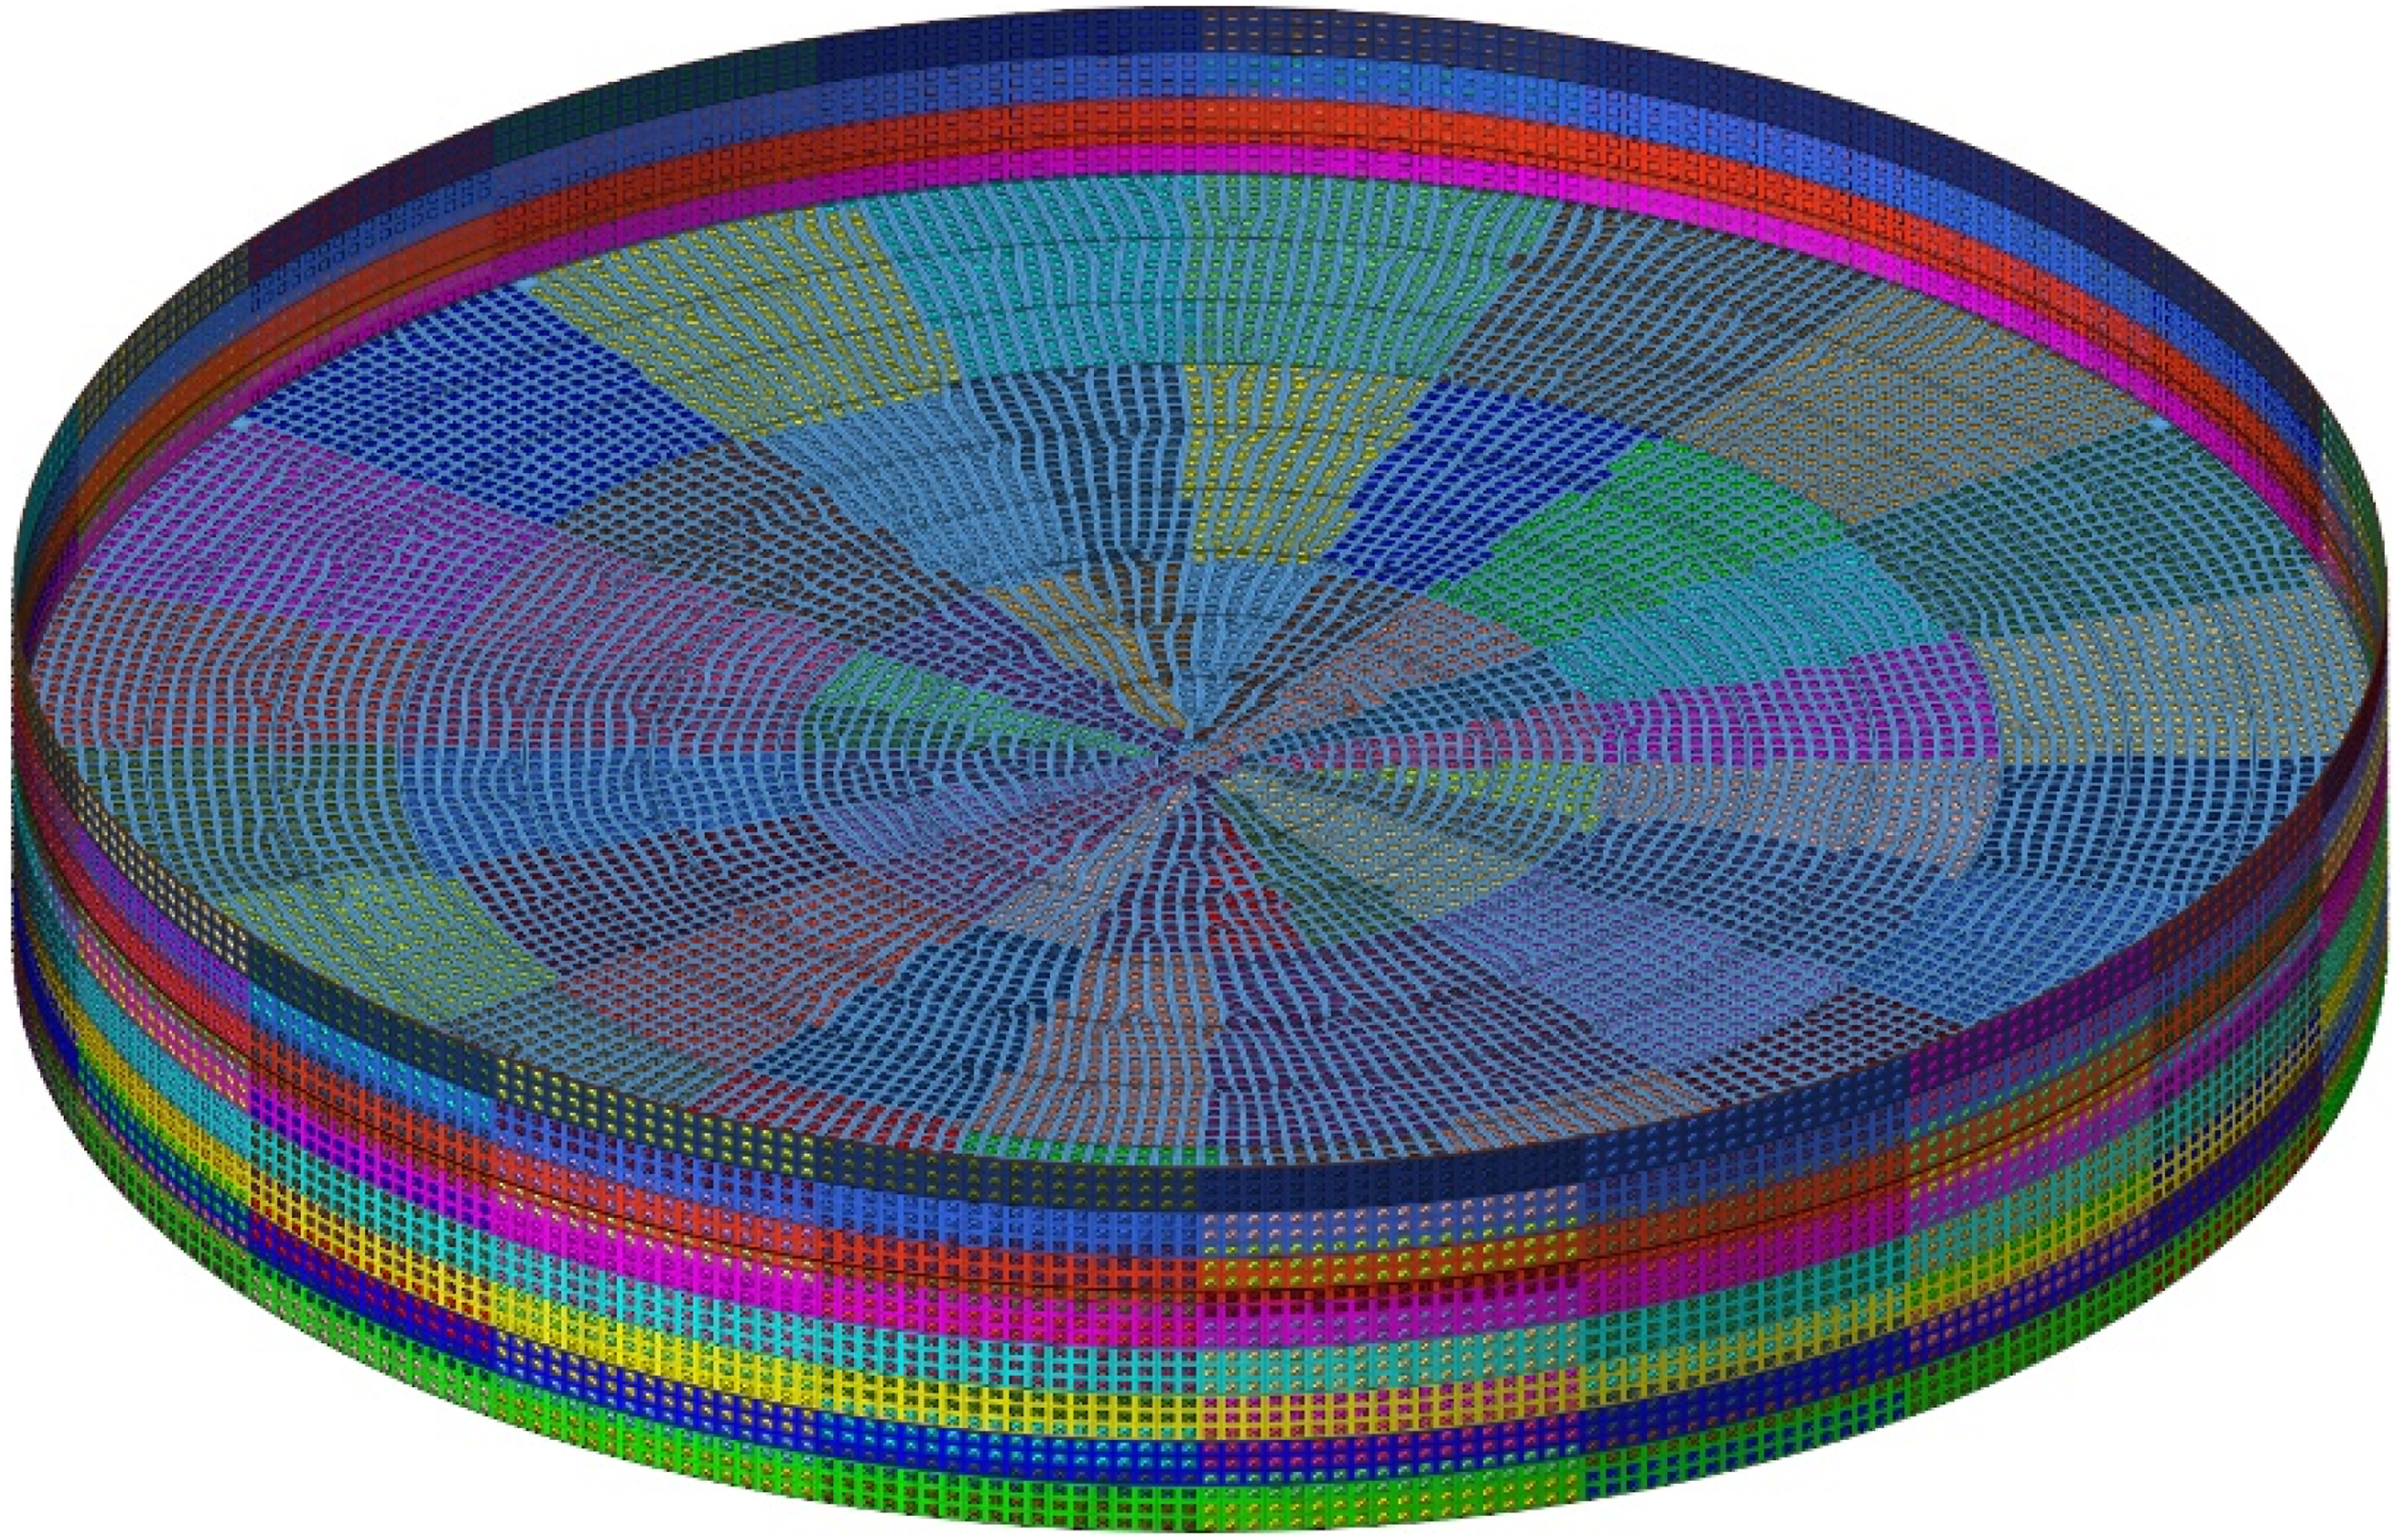
As with the SHAMRC models, the approach used for the full-scale Sierra models was the same as that used for the scaled Sierra validation models, the only differences being the geometries and mesh employed. Full details of the structural model setup are given in the validation section of this paper.
Results
A range of structural response was observed across the different simulations, and several key damage mechanisms were identified. Figure 4 summarises how the damage mechanisms of the full and half-full tanks change with standoff distance. Although not pictured here, select spot checks showed that the empty tanks exhibited a very similar trend to the half-full tanks, only with damage to the tank walls extending down to their base. Damage mechanisms of the full and half-full tanks for different standoff distances.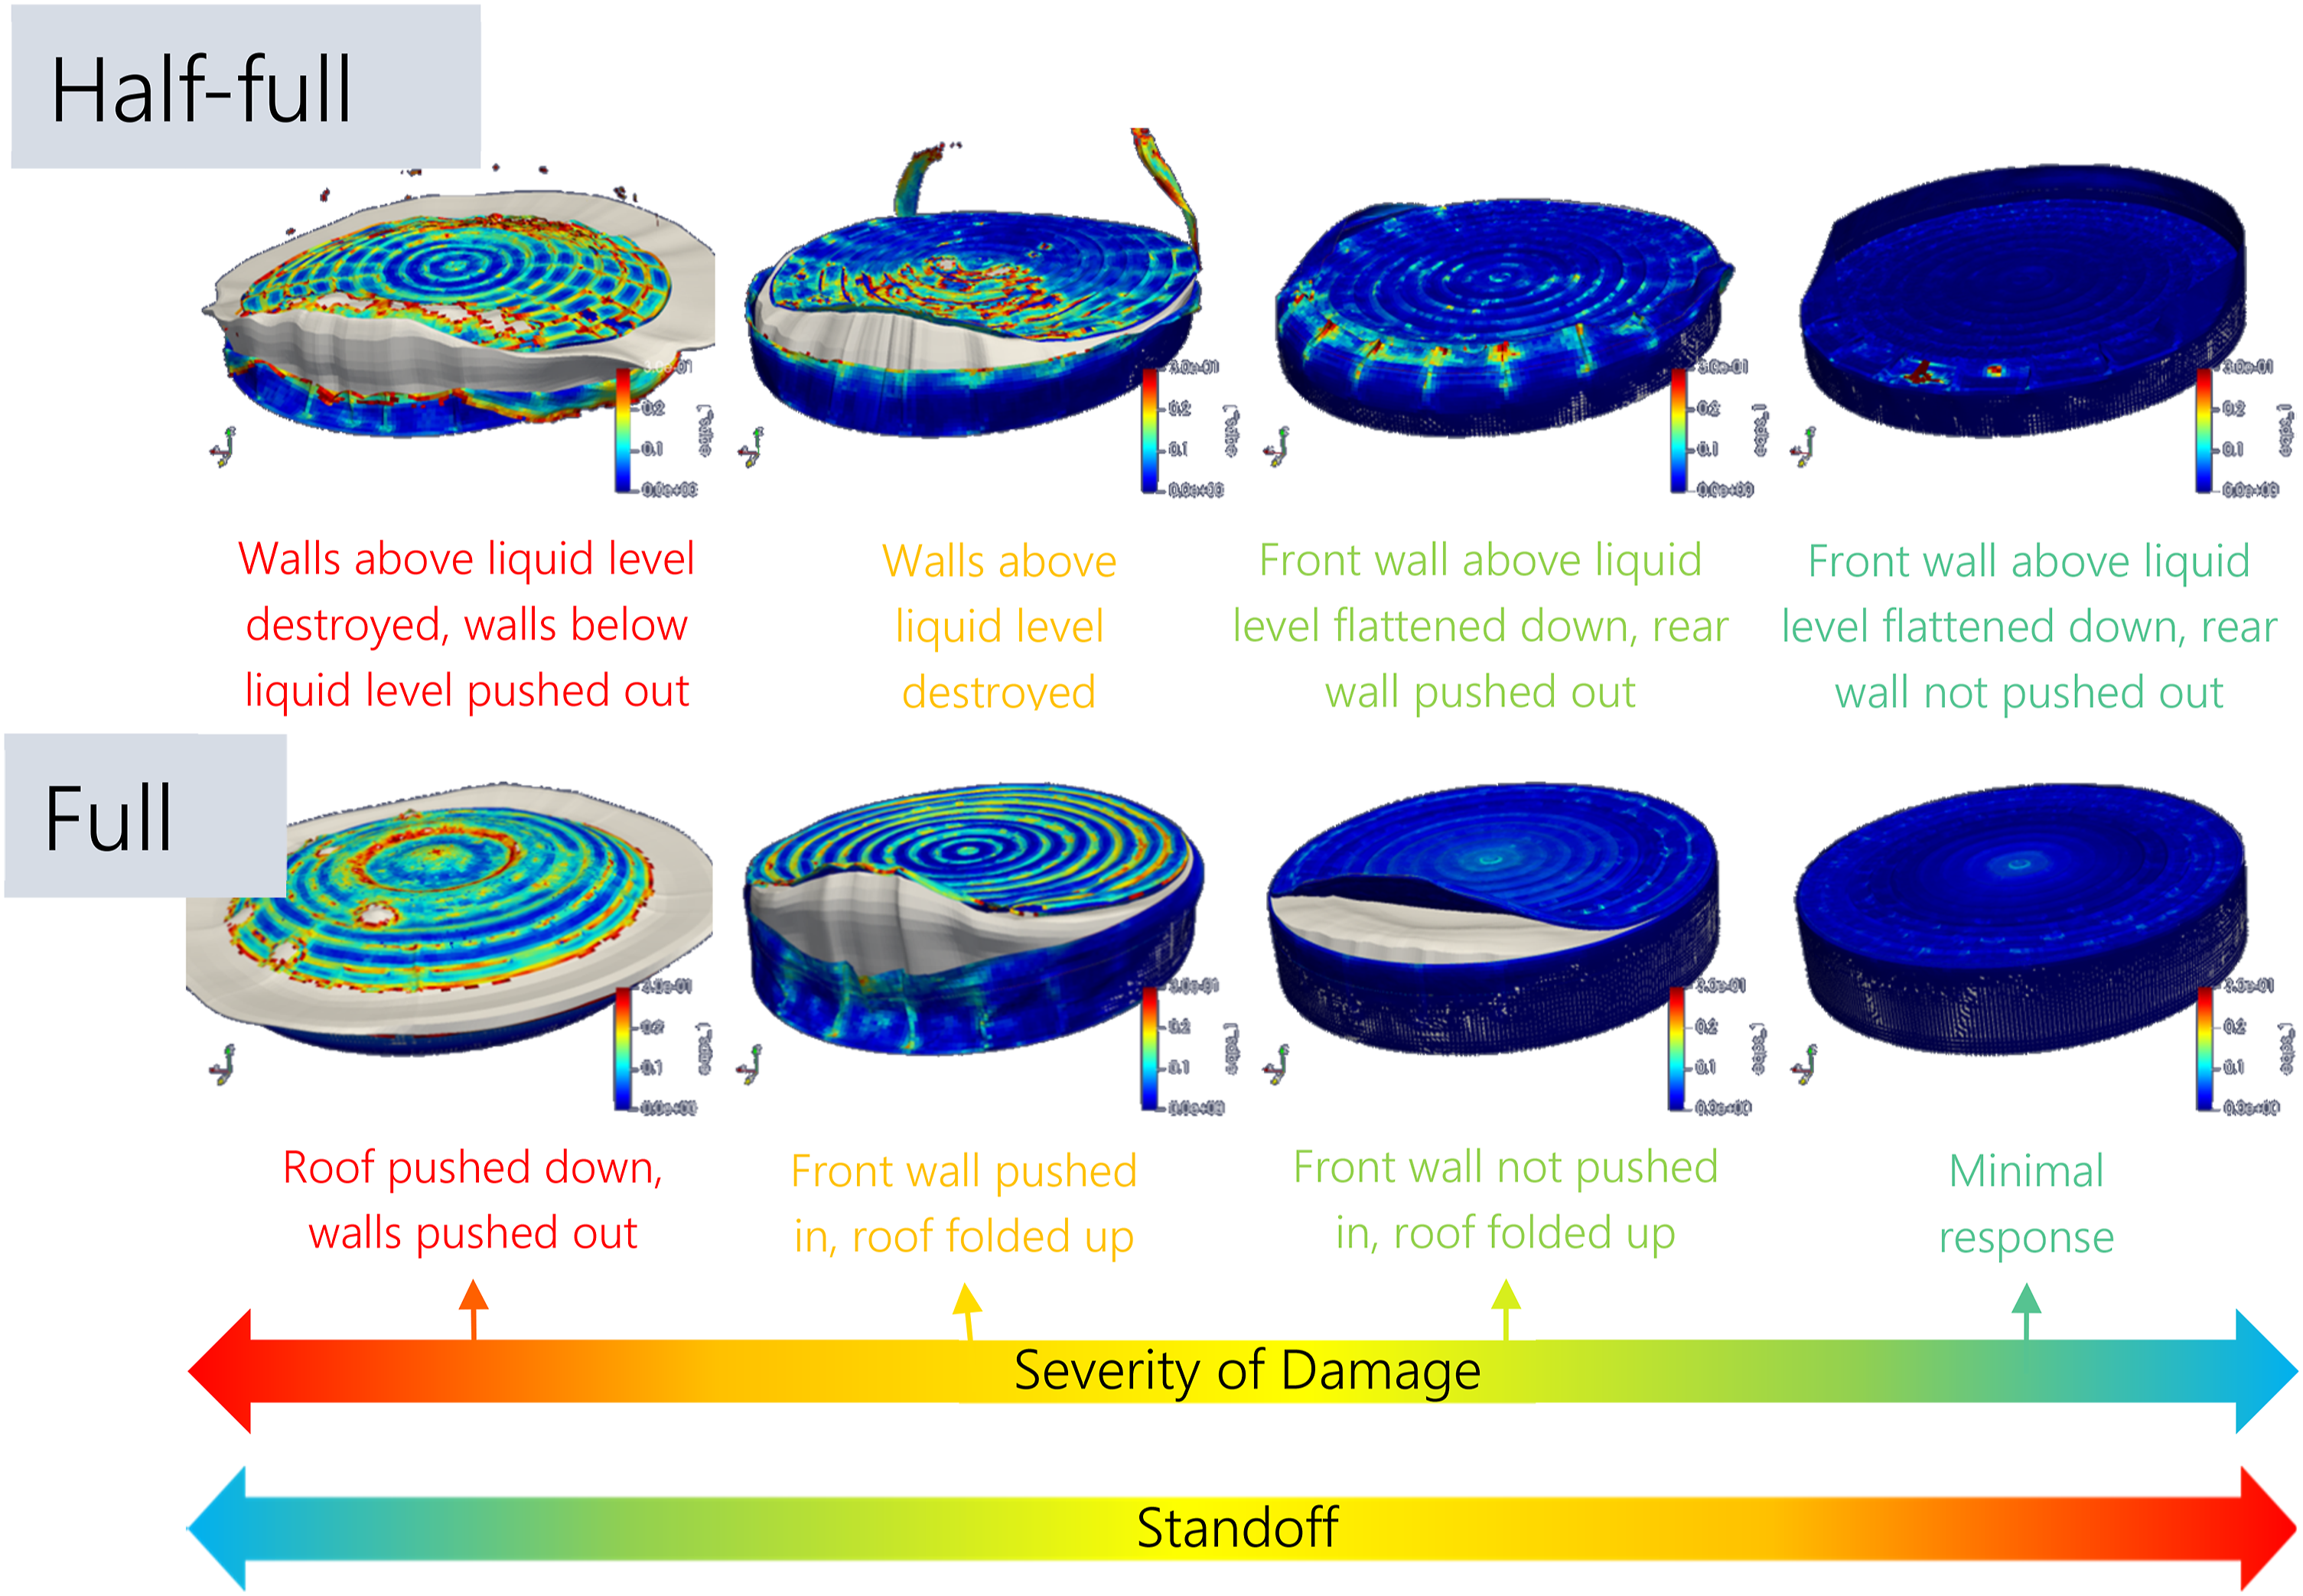
As would be expected, damage increases as standoff decreases. When the standoff is zero (charge directly over a tank), the walls above the rooves of the half-full tanks are destroyed, the rooves are pushed down, contents are ejected, and the lower walls are pushed out. As the standoff increases, the walls above the rooves transition from being destroyed, to being flattened, to only the front walls being flattened with the rear walls remaining upright.
For the full tanks, at a standoff of zero, the rooves are pushed down and the walls pushed out, again with contents being ejected. At close standoffs, the front of the rooves are folded up and the front walls crumple inwards. As standoff increases this damage to the rooves and front walls diminishes.
Scaled experimental trials
Although the full-scale numerical study provided good insight into the expected response of cylindrical POL storage tanks to large-scale blast, without physical data to confirm the predictions, the confidence that could be placed in the findings was limited. Therefore, an experimental trial was carried out to corroborate the damage mechanisms identified and provide validation data for the numerical models.
Seven tests were carried out in total at reduced scale. A schematic of the trial setup is shown in Figure 5, and a photo of the trial site in Figure 6. In each test, two deformable, non-instrumented tanks, and two non-deformable, instrumented tanks, were deployed at two different standoffs
1
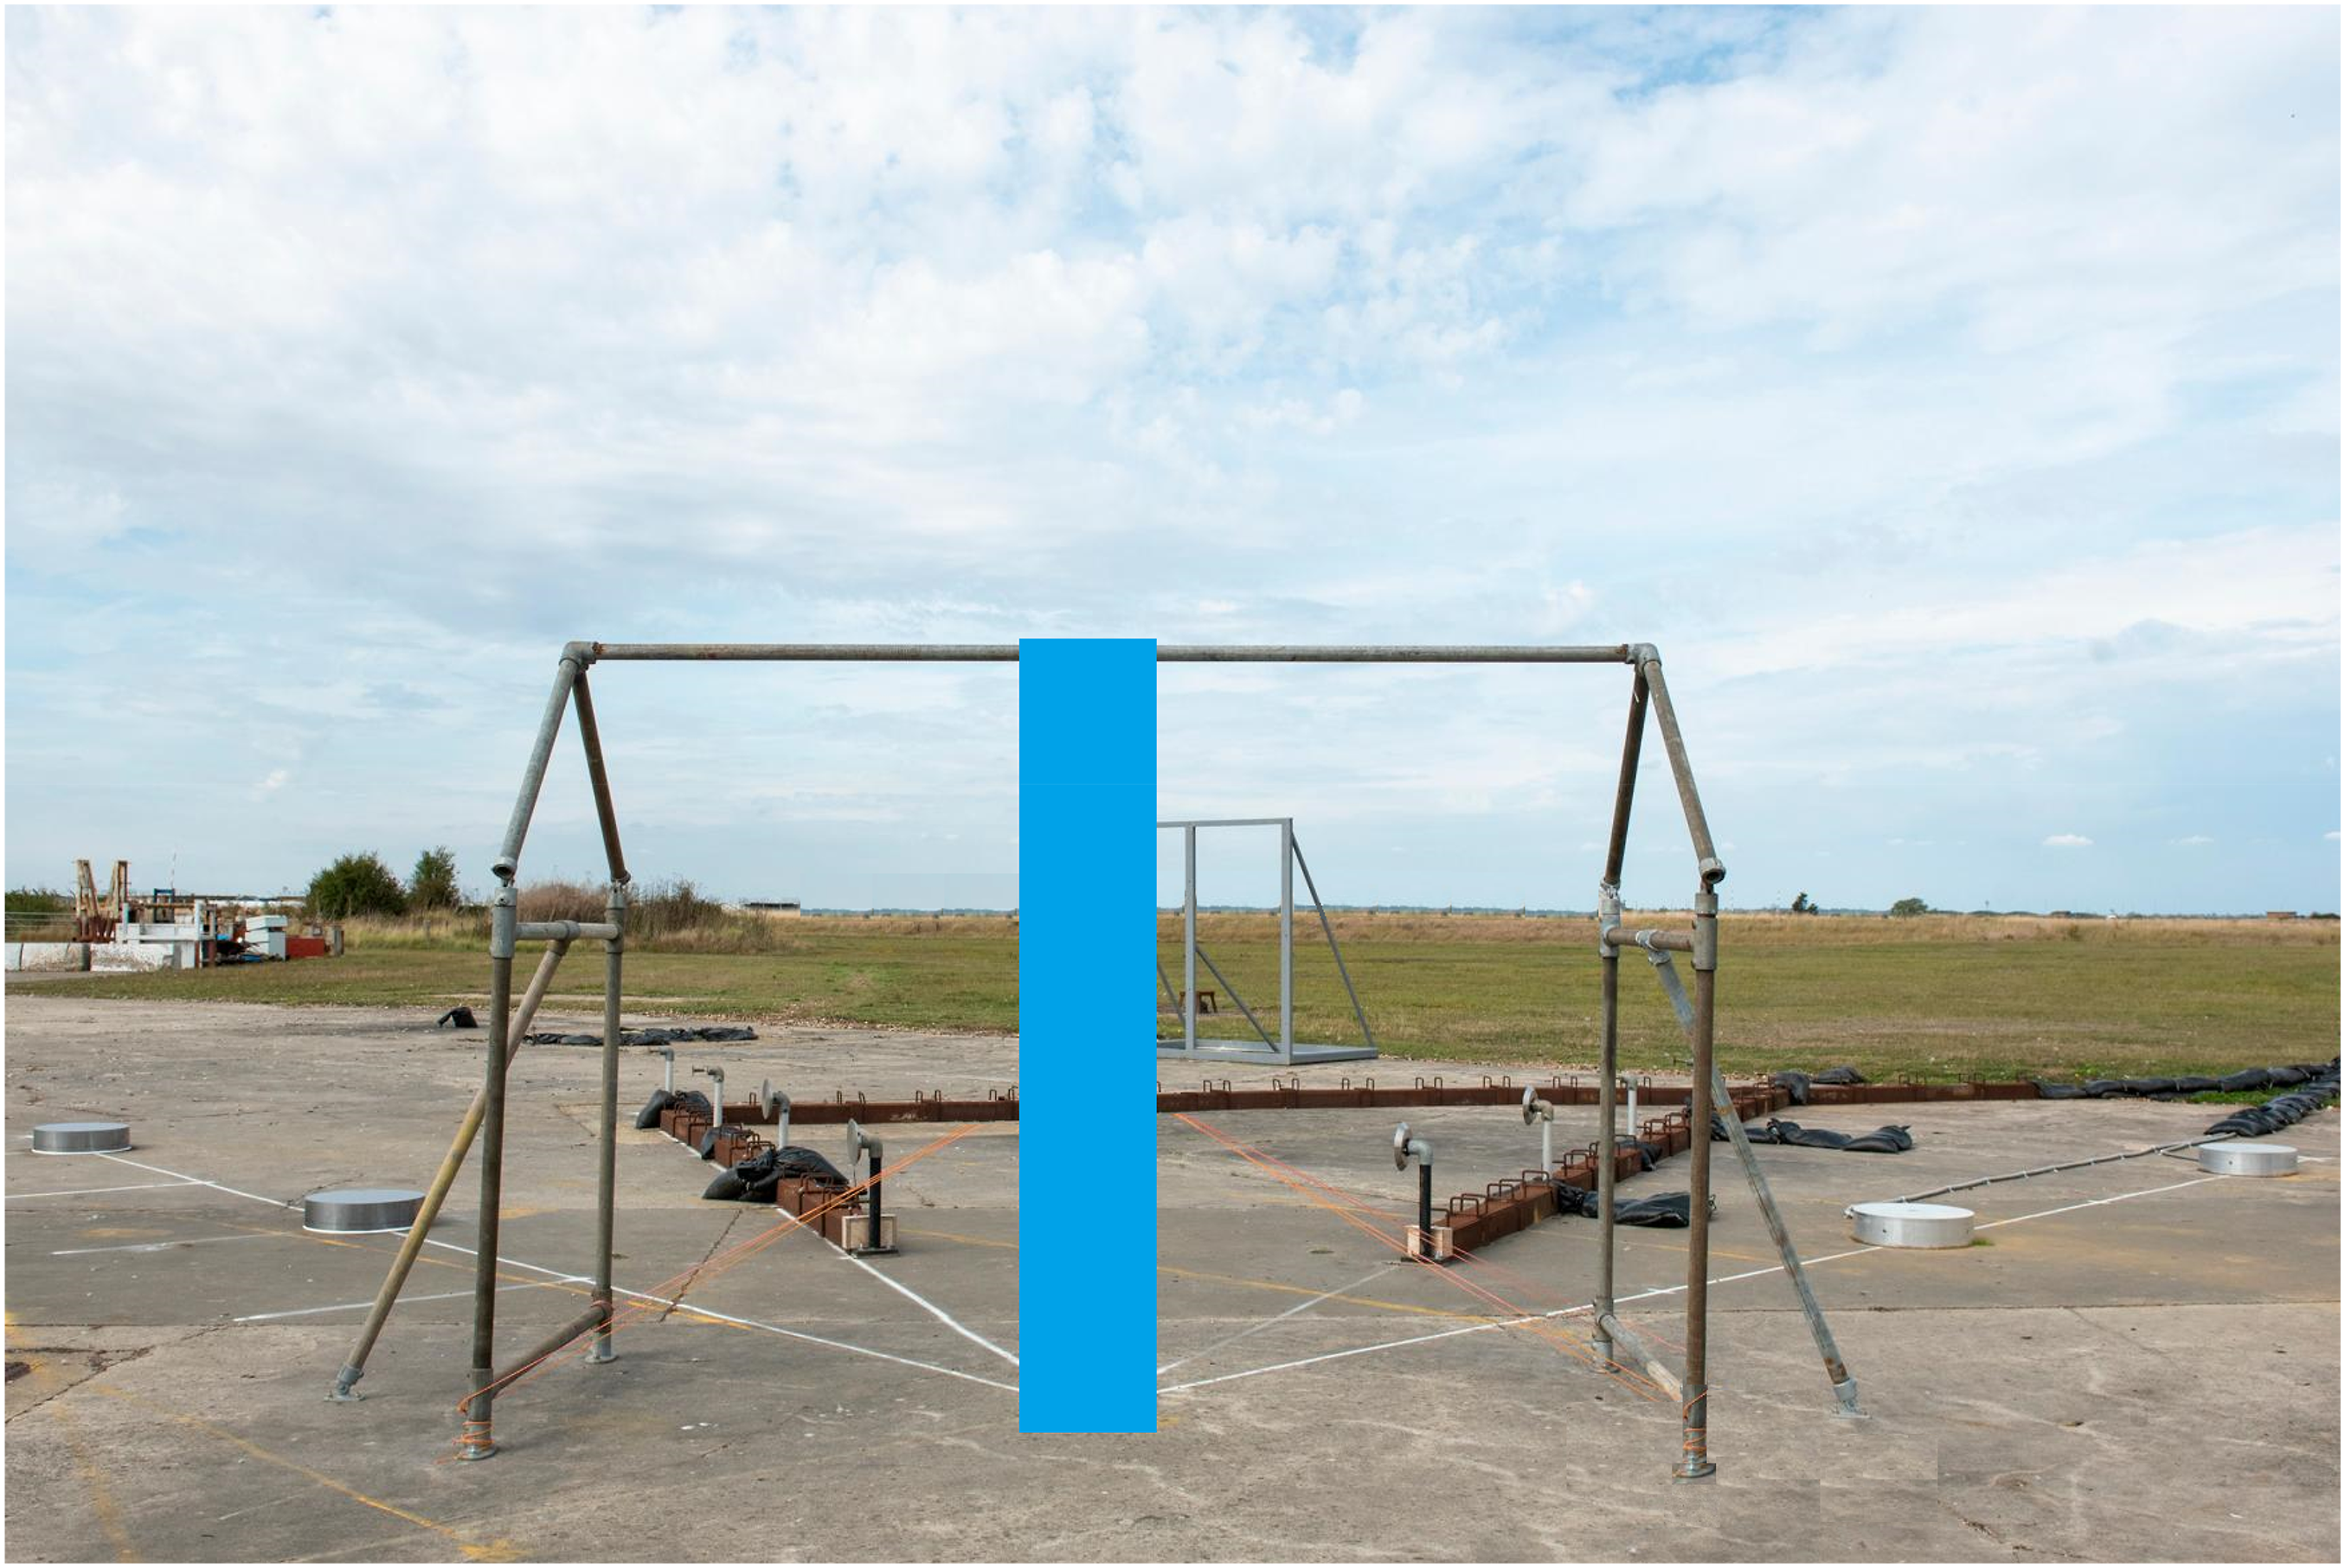
. The standoffs were chosen specifically to invoke the different damage mechanisms predicted by the numerical simulations. Two tests were conducted with the deformable tanks empty, two with them filled to the half-full level and three with them full – all with water as the fill liquid. The charge used was a sphere of PE4 suspended above the ground and the trial considered just a single tank geometry. Schematic of trial setup. Image of the test site pre-shot (charge obfuscated).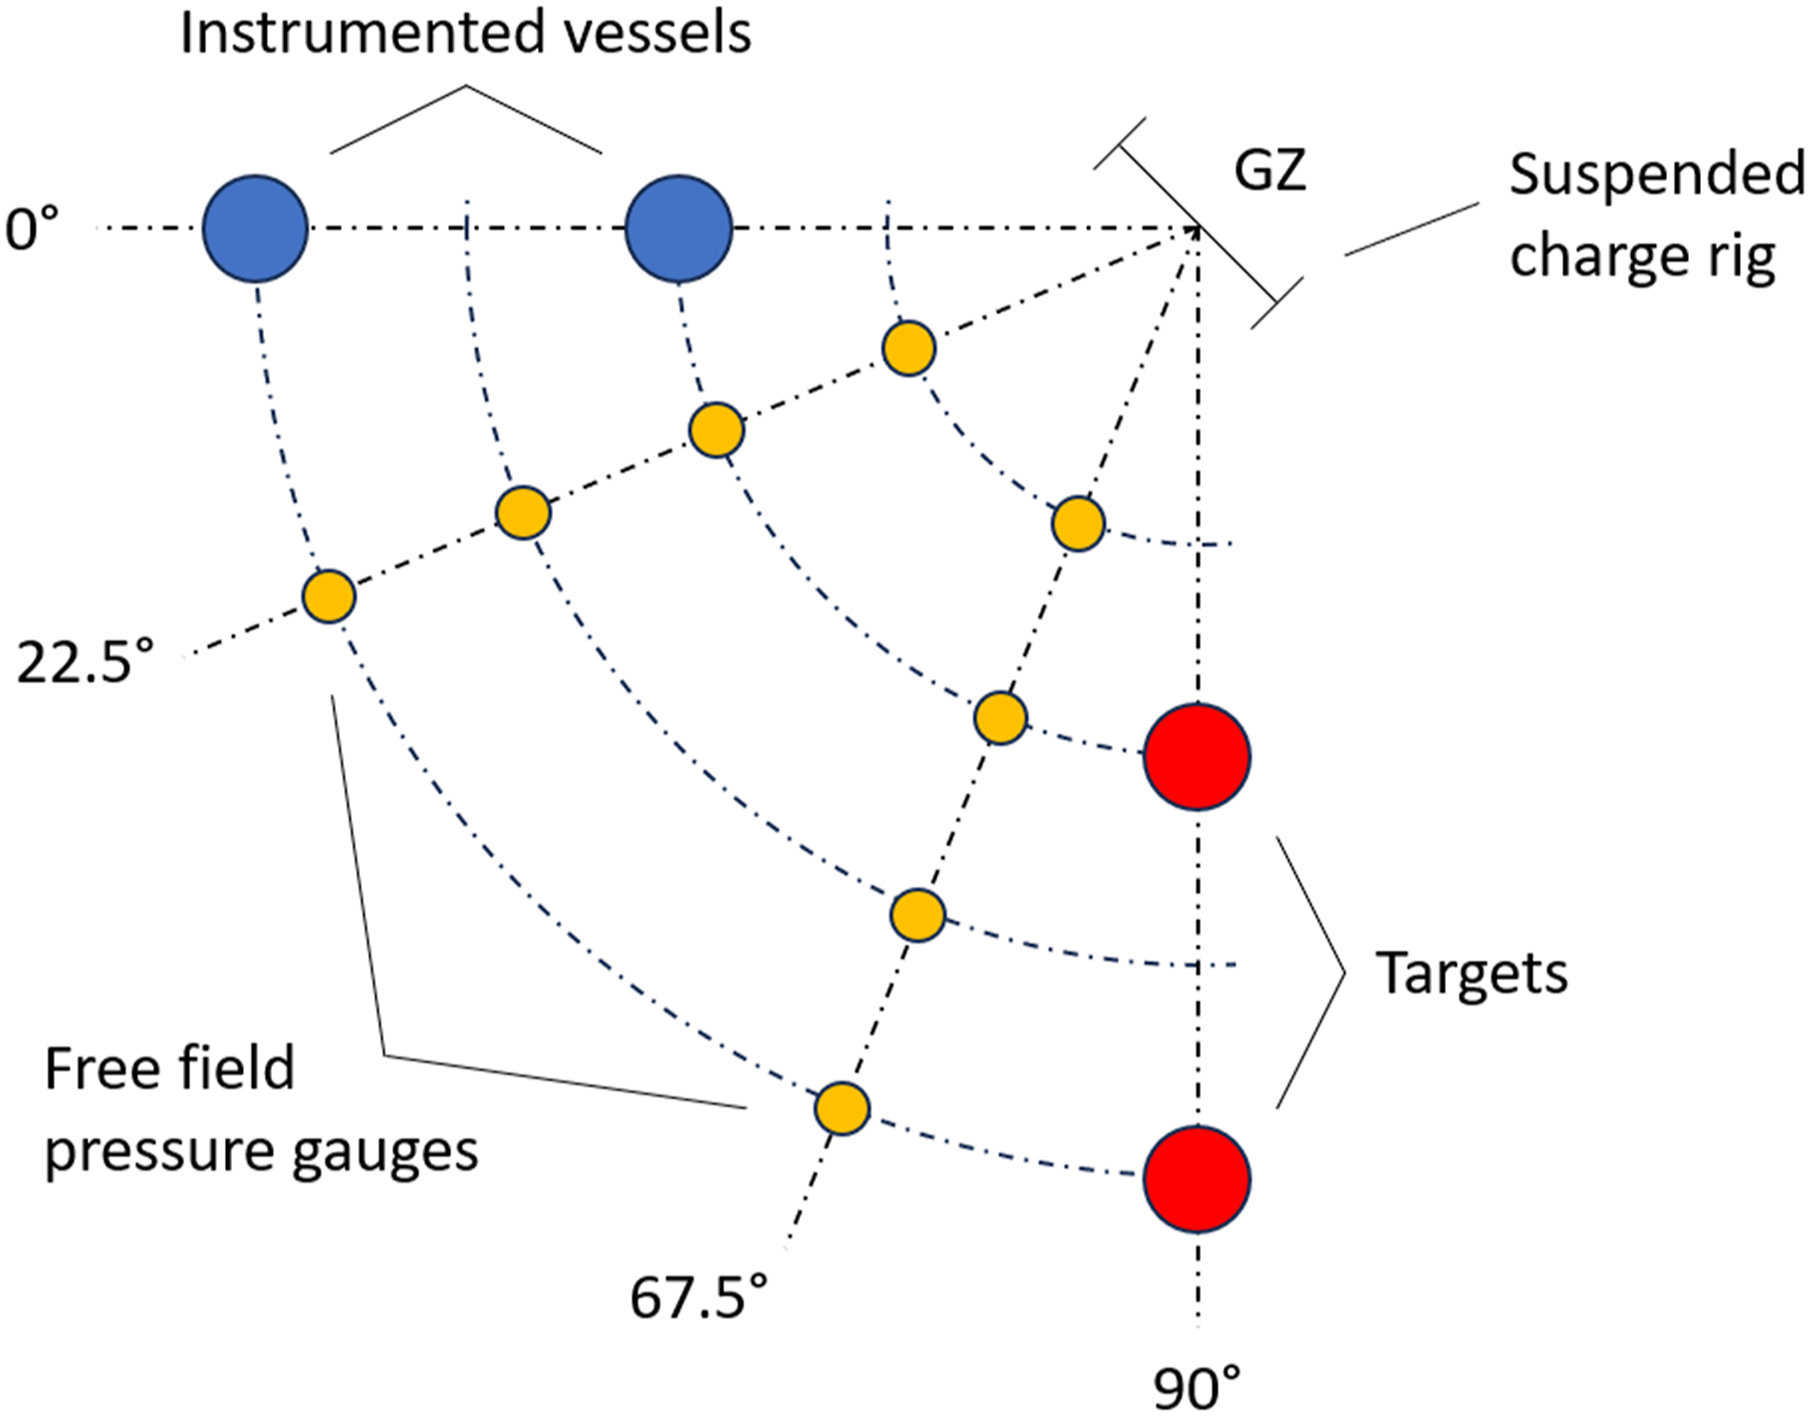
The instrumented tanks each accommodated five pressure gauges, four at 90-degree intervals around the vertical centre of the external face of the walls, and one on the top. Two arrays of four free-field pressure gauges were also fielded, offset at four different distances from the charge. High Speed Video (HSV) and laser scanning were employed to capture the transient response and final deformation of the deformable tanks respectively. Full details of the trial setup and results, including the scaling method used, are provided in (Fay et al., 2023).
Numerical modelling of trials for validation
Approach
The trial was conducted at reduced scale in a way that, as much as possible, allowed for the transposition of the findings to the full-scale study through the concept of similitude. However, due to limitations in the construction of the tanks, they were not perfect scaled replicas. Consequently, although qualitative comparison could be made between the damage mechanisms observed in the trial and those predicted in the full-scale study, bespoke simulation of the exact trial setup was required to enable quantitative comparison of numerical and physical results.
The trial was therefore modelled using the same methodology, tools and techniques as those used in the full-scale numerical study. This ensured that validation of the modelling methodology was equally attributable to the reduced-scale and full-scale simulations. Output from the reduced-scale models was compared to the trial results over three metrics: free-field overpressure/impulse, non-responding tank overpressure/impulse and deformable tank structural response.
Blast loading methodology
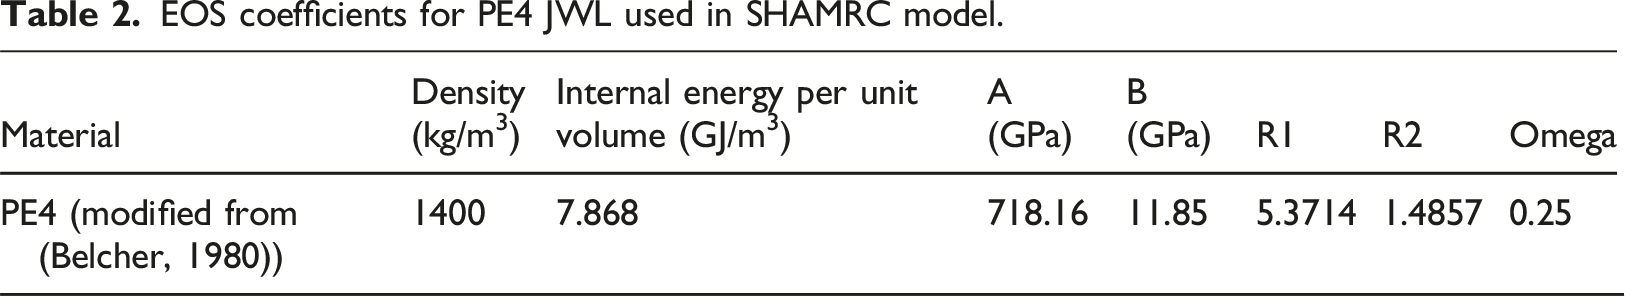
EOS coefficients for PE4 JWL used in SHAMRC model.
For computational efficiency each scenario was modelled across three stages. At each subsequent stage (as the blast expanded, and the pressure gradients reduced) data from the previous stage was remapped into a larger domain at lower element resolution. The first stage was run in a 2D axisymmetric domain that expanded, or ‘rezoned', from 0.1 cm initially to 0.2 cm just before the interaction of the shock front with the ground, where the simulation terminated. The second stage again exploited 2D axisymmetry, but at a resolution of 0.65 cm; it extended until just before the interaction of the shock front with the front tank. The final stage was run in a half-symmetry 3D domain. For further efficiency, the final stage incorporated a graded mesh. This consisted of a constant, smallest, cell size of 0.325 cm surrounding the tanks, this then graded up to another constant, larger, cell size of 0.65 cm away from the tanks, before grading out again to a cell size of 1.393 cm that continued to the edges of the domain. The setup of the 3D domain is illustrated in Figure 7. 3D SHAMRC model domain setup.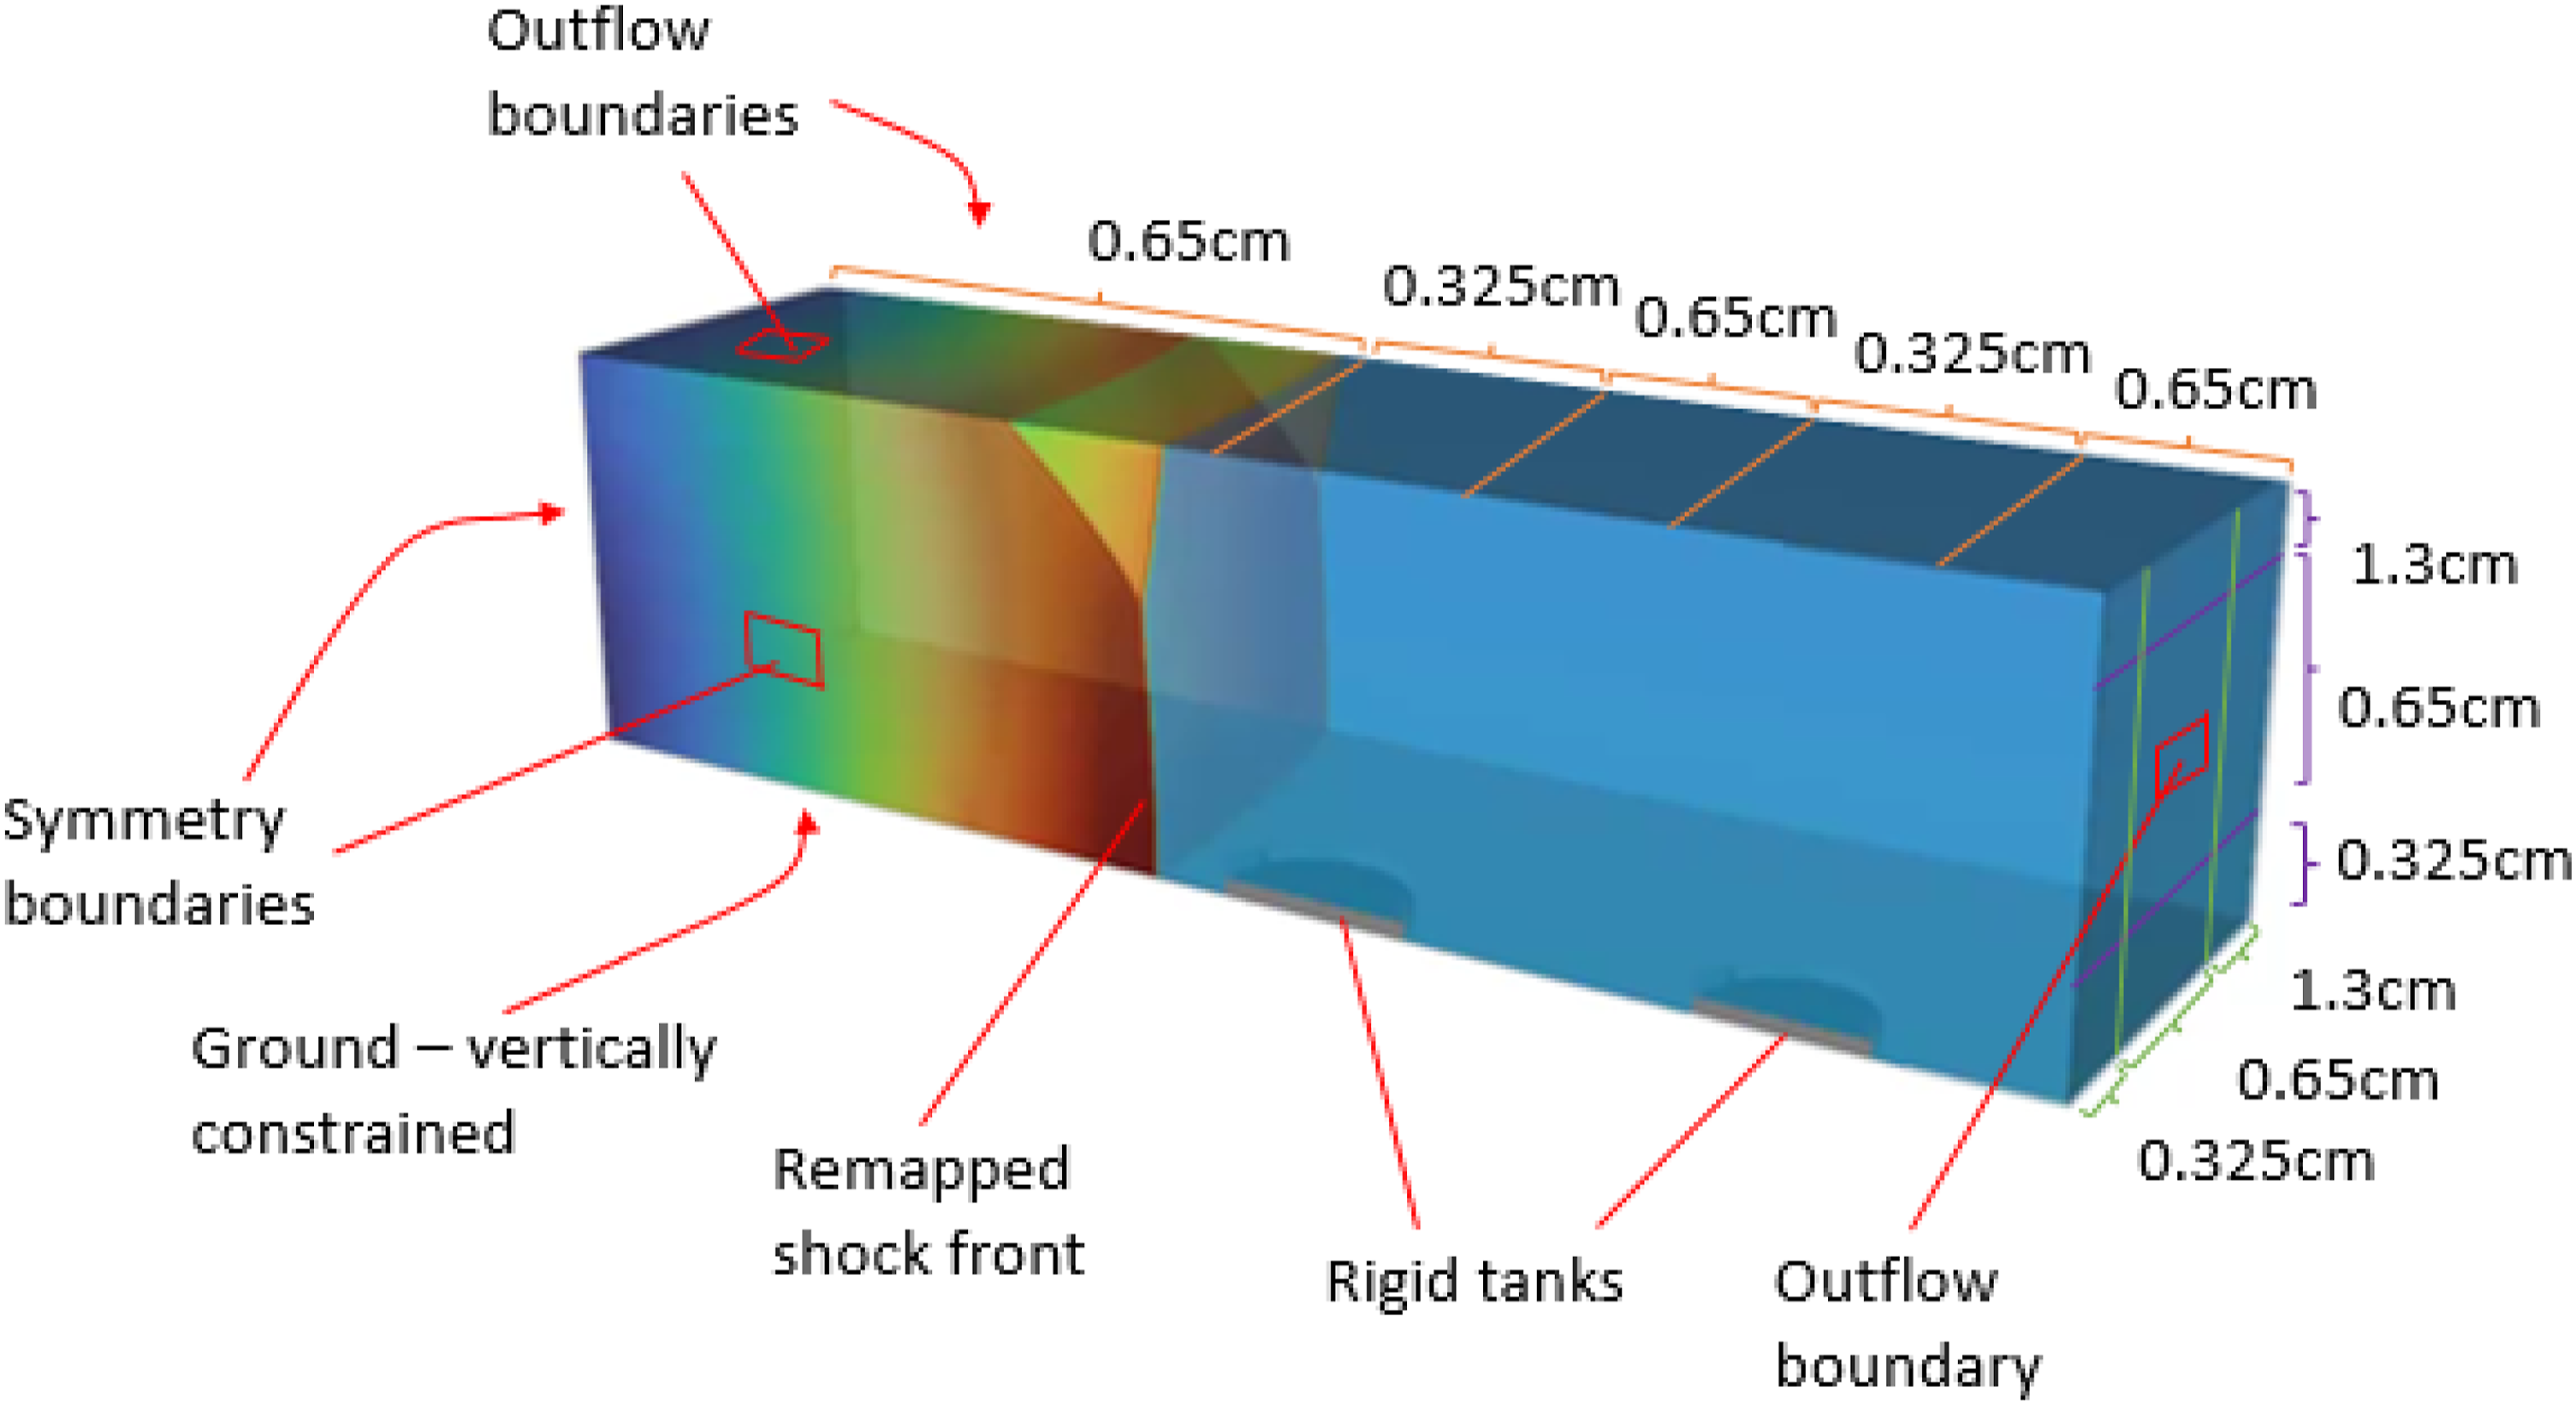
A convergence study was undertaken on the 2D stages, in which the cell sizes were reduced by a factor of 2 and 4; the results from these simulations confirmed that these models were converged at the initial resolution. At the time of writing, a comprehensive resolution study was yet to be completed on the 3D stage.
The tank structures represented in SHAMRC were rigid, non-responding bodies of the appropriate dimensions. Overpressure gauges were placed around the walls and rooves of the tanks to record pressure histories across their surfaces. For all three fill levels, vertical columns of 10 uniformly spaced gauges were placed up the exterior of the wall of each tank at 18-degree intervals circumferentially, giving 110 external wall gauges per tank. 33 gauges were also placed on the roof of each tank – radials of three gauges, again spaced at 18-degree intervals circumferentially. Additionally, gauges were placed on the internal faces of the walls mirroring the spacing of the external gauges, though the number varied due to the different fill levels. For the empty tanks, nine gauges were present in each internal column, resulting in an additional 99 gauges per tank. For the half-full tanks only five gauges ran up the internal walls in each column due to the reduced internal wall area, meaning only an extra 55 gauges were added per tank. For the full tank, no internal gauges were required. Gauge locations for each fill level are shown in green in Figure 8. Cross-section views of (left to right) empty, half-full, and full tanks with gauge locations shown in green.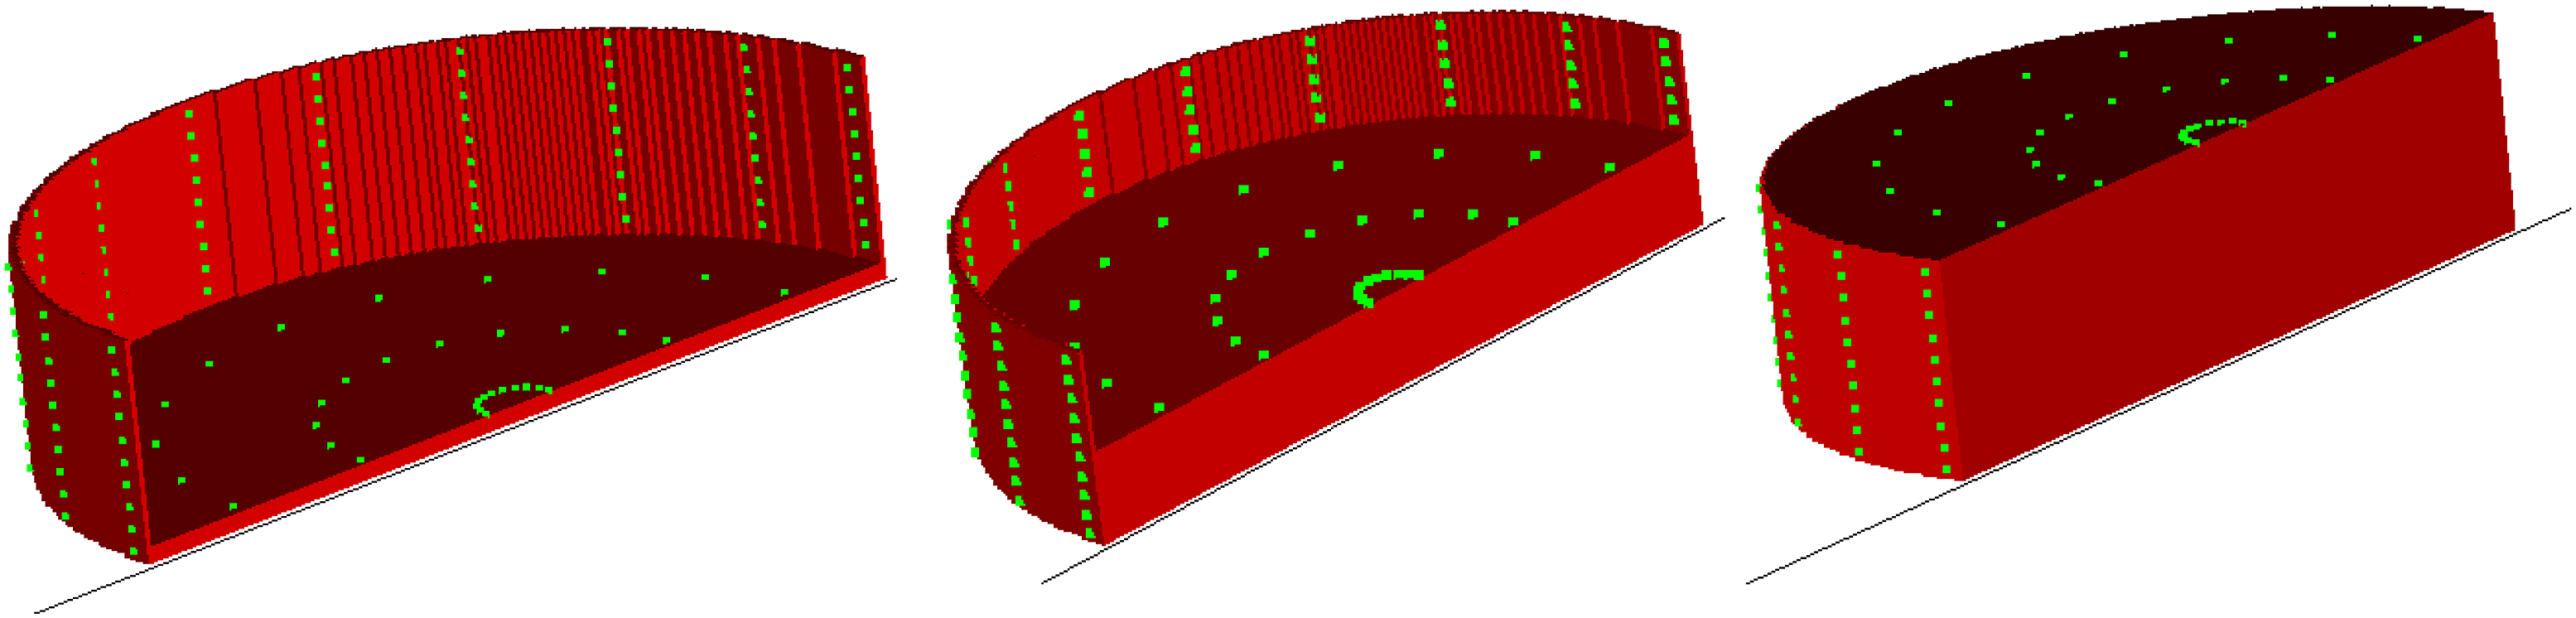
Structural response methodology
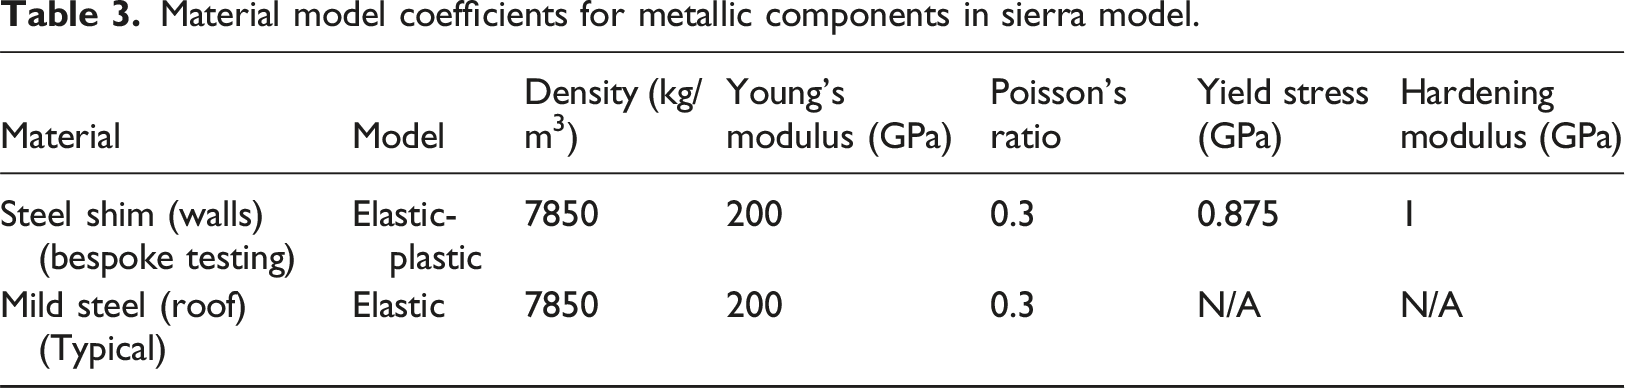
Material model coefficients for metallic components in sierra model.
EOS coefficients for water in sierra model.

Initial work, involving implicit preloading, was undertaken to investigate the influence of gravity on tank response, and found it to be negligible.
Across the faces of the tank, a load patch was generated for each of the gauges included in the SHAMRC model, with each patch centred around the location of a gauge. The pressure-time histories from the gauges were then applied uniformly across their corresponding patches. Noting that the walls were represented as shells, where a pressure loading was recorded on both sides (internal and external), the difference between the two was calculated and applied to a single patch. Thus, a net load acting inwards normal to the wall would be positive, and a net load acting outwards would be negative.
In SHAMRC, as the tanks were non-responding, the pressure momentarily stagnated inside the half-full and empty tanks after the blast wave had passed over them. This resulted in the pressures on the internal walls being higher than those on the external walls and led to a net outward load. This manifested itself in the Sierra simulations as the tank walls beginning to return back up after they had been flattened. Engineering judgement therefore had to be exercised to identify the most appropriate point at which to record ‘final’ tank deformation in these cases. This was generally taken just after the wall towards the front of the tank had reached its greatest extent of flattening. Simulations implementing a fully coupled Fluid-Structure Interaction (FSI) approach were subsequently pursued to examine the significance of this limitation.
Results
Figure 9 shows a comparison of the trial and simulation free-field peak overpressures and peak positive impulses for the four gauge locations. Data from all seven tests is plotted. Very good agreement is seen in terms of peak overpressure, particularly at the closest standoff. Similarly good agreement is seen in terms of peak positive impulse, with the simulation data falling in the middle of the range of trial data for all gauges. Figure 10 shows a comparison of a typical free-field overpressure-time history from the trial against the equivalent numerical model result. It can be seen that there is some overshoot in the numerically predicted peak due to numerical dispersion. Therefore, a polynomial fit was used to estimate the peaks shown in Figure 9. Comparison of normalised experimental and numerical free-field peak overpressures (left) and peak positive impulses (right). A typical free-field overpressure-time history from the trial compared to the equivalent numerical model result.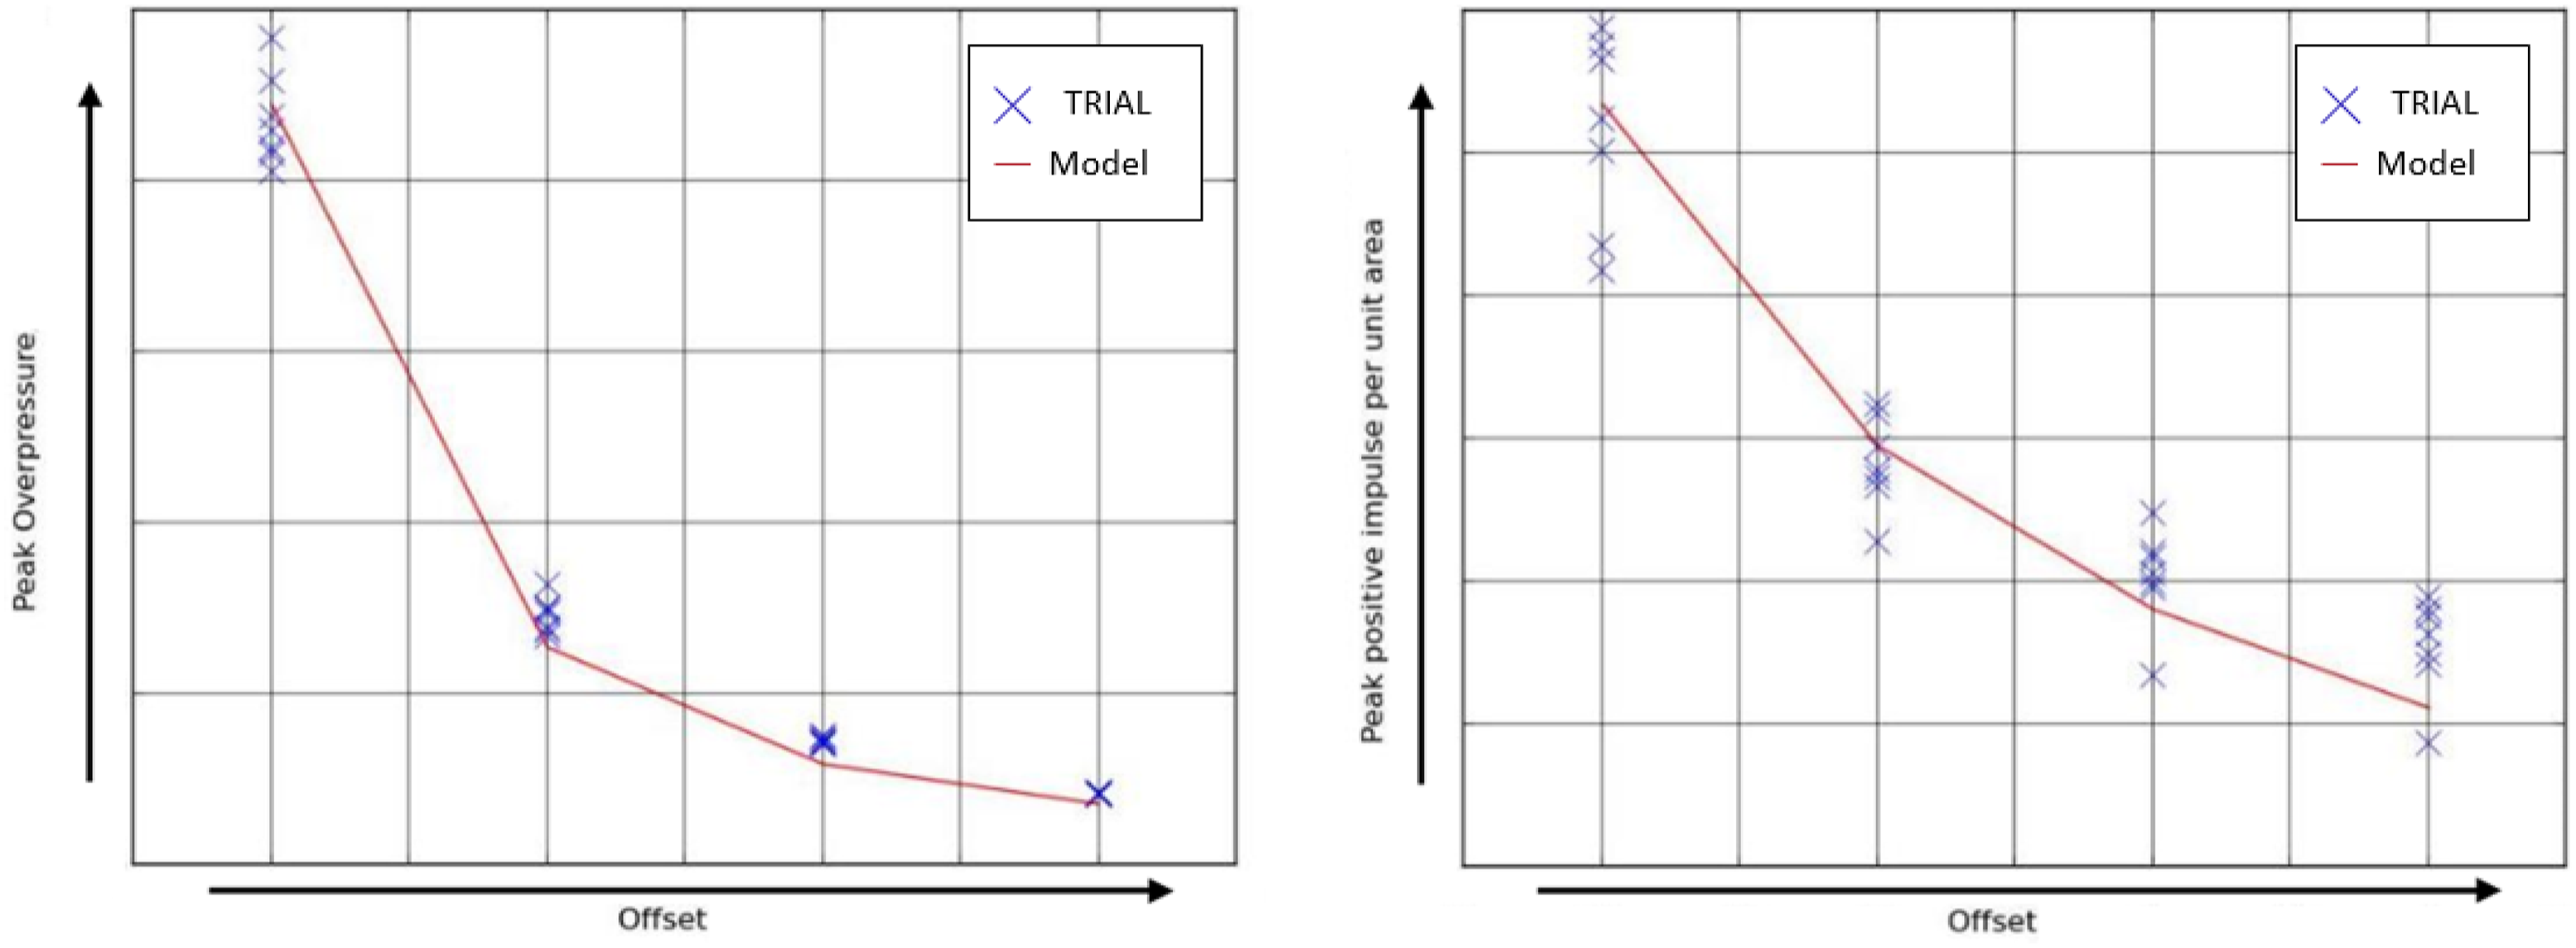
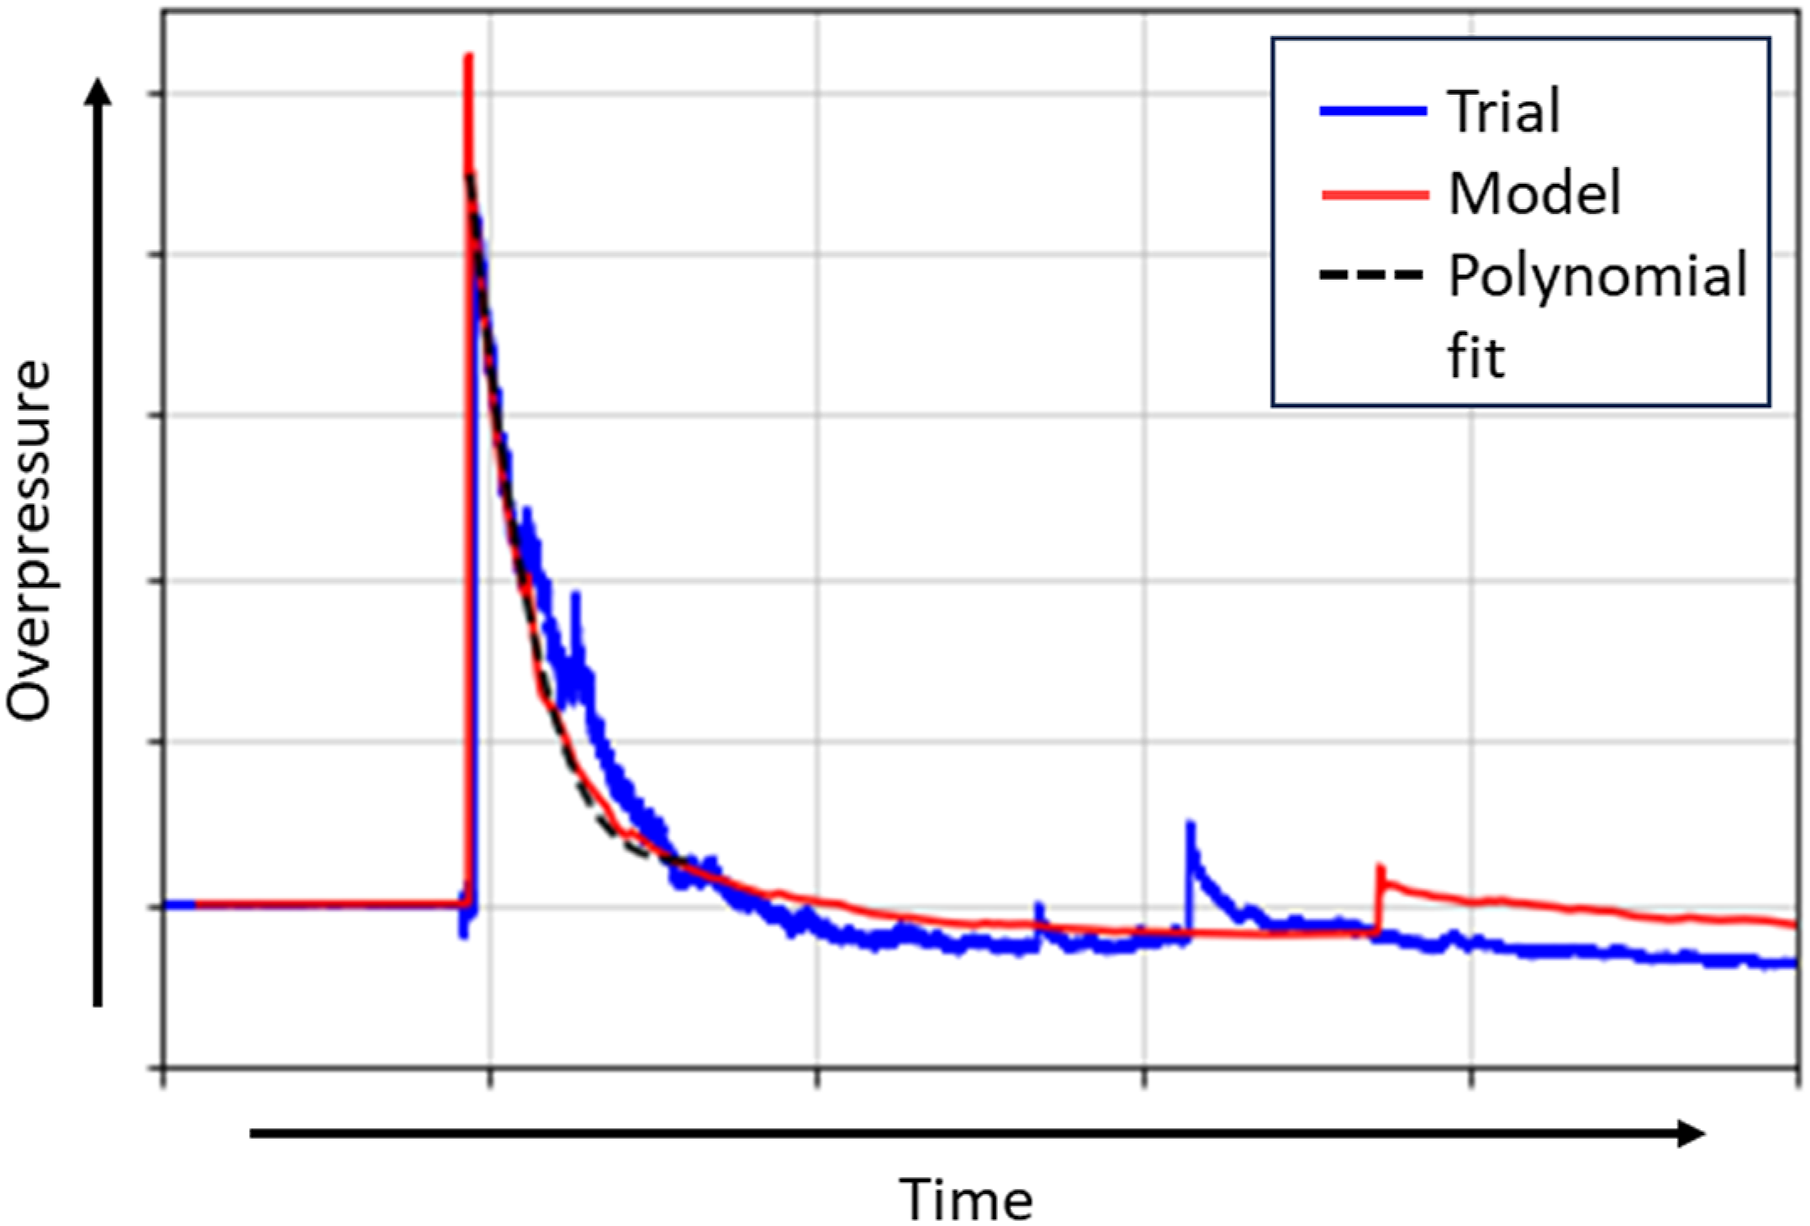
Figure 11 shows the numbering convention used to identify the location of the gauges on the non-responding tanks relative to the charge. The peak overpressures and peak positive impulses from the trial and simulation are shown in Figure 12 for these gauges. Figure 13 shows a comparison of typical overpressure and specific impulse-time histories from gauges 1 and two and the equivalent model results. Non-responding tank gauge numbering convention. Comparison of normalised experimental and numerical non-responding tank peak overpressures (left) and peak positive impulses (right). Typical overpressure (left) and specific impulse-time histories (right) from gauge 1 (top) and gauge 2 (bottom) compared to the equivalent numerical results. Note that due to the boundary conditions used in the model, post-peak specific impulse should be disregarded.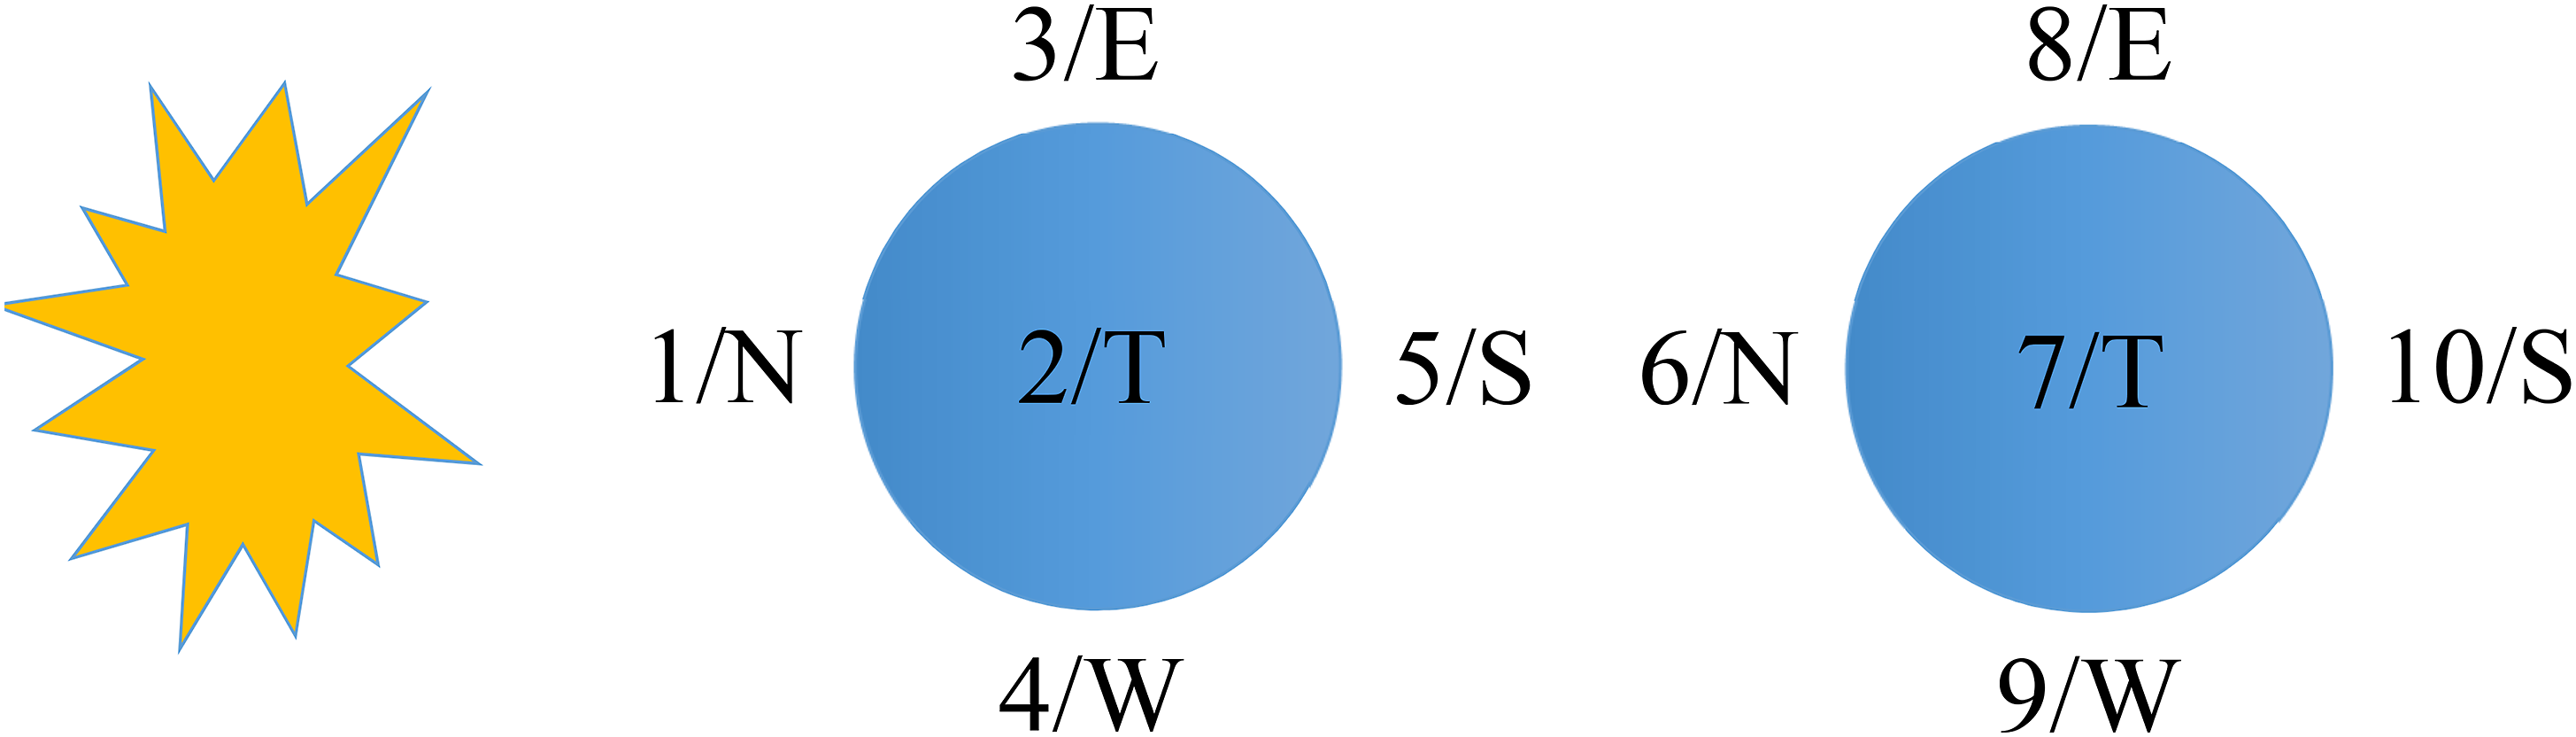
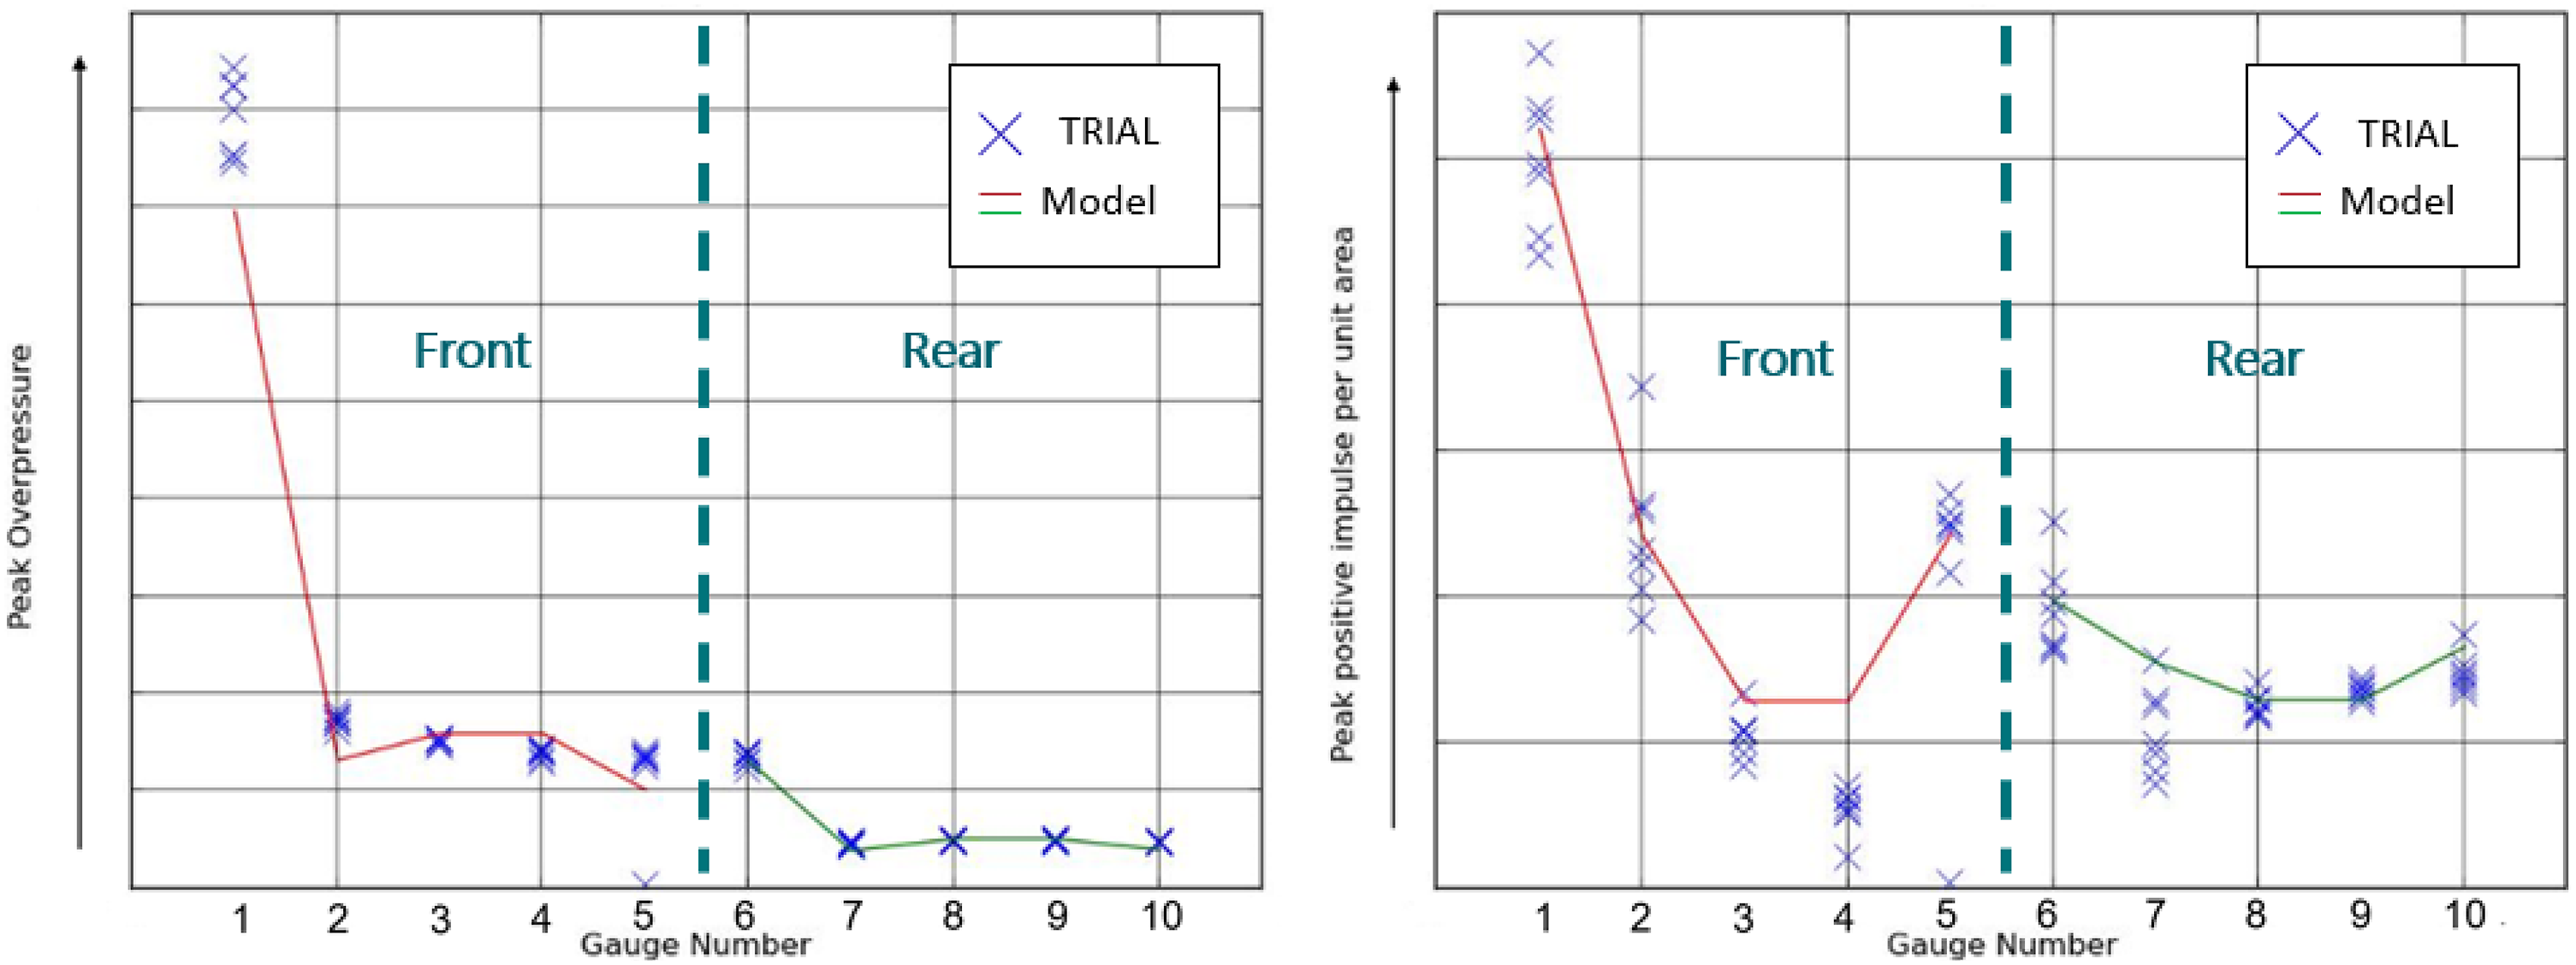

Overall, fairly good agreement can again be seen for peak overpressure between the trial and simulation, though there is some discrepancy observed, particularly on the front tank. The weakest agreement is observed at the closest gauge but it can be seen in Figure 13 that gauge response may potentially be exaggerating the experimental peaks in some cases. This is partially responsible for the difference in magnitudes of the second shocks, which can also be observed in Figure 13. The remaining discrepancy in the second shocks is thought to be due to limitations of the EOSs employed in the model.
The peak positive impulse results agree very well. This is perhaps with the exception of gauge four, which is an interesting result. Gauges three and four were on the East and West sides of the same tank, and, due to symmetry, would be expected to record the same pressure. Yet, consistently across all seven tests they differed, with no overlap at all between the range of the impulses seen. This indicates that there may have been some sort of systemic error in the trial setup in this respect. In one test, gauge five did not work properly and this can be seen on both graphs where a value of zero is registered. Beyond the peaks of the impulse curves, the model and experimental data begin to diverge. This is due to boundary effects in the model and data post-peak should be disregarded.
Comparison of structural responses of trial front tanks and simulation front tanks.
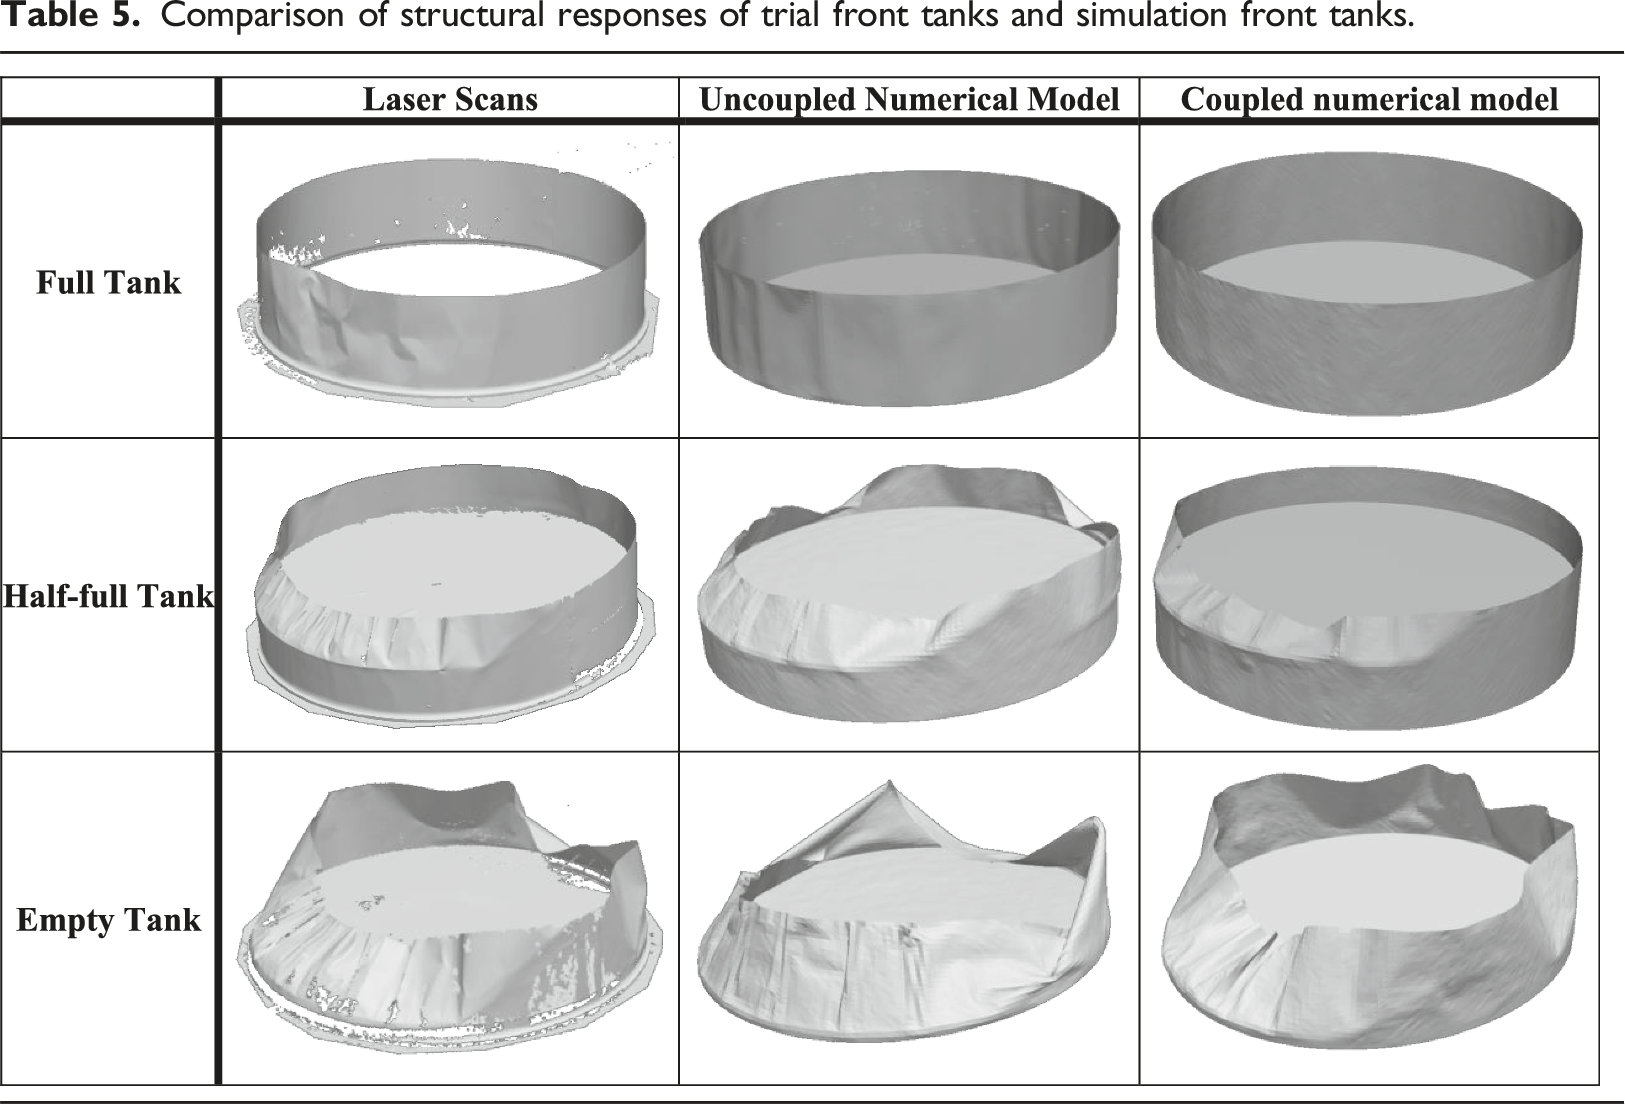
However, some discrepancies are evident. The model of the half-full tank exhibits slightly greater deformation of the tank walls round the sides and towards the rear. Greater deformation of the tank walls round the sides of the empty tank is also observed in the model. The primary reason for these discrepancies is believed to be due to the limitations associated with the uncoupled modelling methodology discussed previously. This is substantiated by the results produced from fully coupled simulations undertaken using CTH (Sandia National Laboratories, 2017) and Sierra through Zapotec. Employing a fully coupled methodology removes the issues around stagnating pressures on the interior of the non-responding tanks inherent in the uncoupled approach. The results from the fully coupled models compare very favourably with the equivalent trial results.
Conclusions and recommendations
The close agreement between the damage mechanisms exhibited by the tanks during the trial and the output from the full-scale numerical models gives good qualitative assurance that the simulations were reliable. Additionally, comprehensive quantitative analysis of the trial data and comparison to the equivalent model results in terms of overpressure, impulse and structural deformation demonstrates very good agreement across all metrics. This provides high confidence in the modelling methodology employed and further increases the credibility of the full-scale numerical study. Where minor discrepancy in final tank structural deformation was observed, the reason for this has been identified, and an alternative, fully coupled, approach presented that eliminates the underlying issue and improves accuracy. Simulation of the structural deformation of the rear tanks in the trial should be completed to confirm these findings. In addition, exploration of the mesh sensitivity of the non-responding tank pressure loadings is required to improve their accuracy. Further trials may also be pursued at a larger scale so that the trial tanks could be made more representative of the full-scale tanks.
Footnotes
Acknowledgements
Special thanks are extended to Chris Tilbury and the rest of the team at Spurpark Ltd For their delivery of the trial.
Declaration of conflicting interests
The author(s) declared no potential conflicts of interest with respect to the research, authorship, and/or publication of this article.
Funding
The author(s) received no financial support for the research, authorship, and/or publication of this article.