
Abstract
Background:
Prediabetes comprises three heterogeneous glucometabolic phenotypes and is associated with an increased risk of metabolic dysfunction-associated fatty liver disease (MAFLD). However, the association of different prediabetes phenotypes with the presence of MAFLD and liver fibrosis remains underexplored.
Objectives:
To examine the association of different prediabetes phenotypes with MAFLD and liver fibrosis.
Design:
Population-based cross-sectional study.
Methods:
Prediabetes was stratified as an isolated defect (impaired fasting glucose (IFG), impaired glucose tolerance (IGT), or impaired hemoglobin A1c (IA1c)), two defects (IFG + IGT, IFG + IA1c, or IGT + IA1c), or all three defects (IFG + IGT + IA1c). Hepatic steatosis and liver fibrosis were assessed by vibration-controlled transient elastography. Multivariate logistic regression analysis was conducted to estimate the odds ratio (OR) and 95% confidence interval (CI) for different prediabetes phenotypes associated with MAFLD and liver fibrosis.
Results:
A total of 1599 subjects (394 with normal glucose tolerance (NGT) and 1205 with prediabetes) were included. The prevalence of MAFLD and liver fibrosis was higher in prediabetes than in NGT. The odds of MAFLD in prediabetes with two or three glucometabolic defects were increased compared with those with a single glucometabolic defect, with insulin resistance as a possible mediator. Compared with isolated IA1c, isolated IGT had an increased prevalence of MAFLD (p < 0.05). Moreover, glucose-defined prediabetes had higher odds of MAFLD than HbA1c-defined prediabetes (OR 1.72, 95% CI 1.00–2.96). However, there was no significant difference in the odds of liver fibrosis across different prediabetes phenotypes (p = 0.58).
Conclusion:
The odds of MAFLD but not liver fibrosis were increased with the increasing number of glucometabolic defects in participants with prediabetes.
Trial registration:
Not applicable.
Plain language summary
Prediabetes is closely associated with MAFLD; however, the association between different prediabetes phenotypes with MAFLD and liver fibrosis has not been fully elucidated. This study was aimed to examine their associations. Design: Population-based cross-sectional study. Prediabetes was stratified as an isolated defect (IFG, IGT, or IA1c], two defects (IFG + IGT, IFG + IA1c, or IGT + IA1c), or all three defects (IFG + IGT + IA1c). Multivariable logistic regression analysis was performed to examine the associations of different prediabetes phenotypes with MAFLD and liver fibrosis. Results indicated that the odds of MAFLD in prediabetes with two or three glucometabolic defects were increased compared with those with a single glucometabolic defect, with insulin resistance as a possible mediator. Furthermore, among individuals with a single defect, those with isolated IGT exhibited higher odds of MAFLD compared to those with isolated IA1c or isolated IFG. However, there was no significant difference in the odds of liver fibrosis across different prediabetes phenotypes.
Keywords
Introduction
Prediabetes, an intermediate state between normoglycemia and diabetes, affects nearly 720 million individuals worldwide in 2021. 1 It comprises three heterogeneous glucometabolic phenotypes, including impaired fasting glucose (IFG), impaired glucose tolerance (IGT), and impaired hemoglobin A1c (IA1c).2,3 Recent studies suggest that these phenotypes differ in the mechanisms underlying glucose homeostasis. 4 For example, a prior study found that isolated IFG was characterized by diminished basal and first-phase insulin release and reduced insulin sensitivity, whereas isolated IGT was featured by a more pronounced degree of insulin resistance (IR). 4 In contrast, IA1c was associated with a mild degree of IR and β-cell dysfunction compared to IGT. 5 Moreover, glucose-defined prediabetes (i.e., isolated IGT or combined IFG + IGT) exhibited more severe inflammation and endothelial dysfunction.6,7 In addition to the pathophysiological difference, clinical outcomes also vary across different prediabetes phenotypes. A meta-analysis showed that individuals with isolated IFG had an increased risk of diabetes by 18% after 5 years of follow-up, while individuals with isolated IGT exhibited a doubled risk by approximately 39%. 8 Furthermore, the benefit of lifestyle intervention on diabetes prevention has reportedly been achieved only in individuals with IGT, but not in those with IFG. 9 Taken together, these findings highlight the importance of understanding the heterogeneity of prediabetes to facilitate early screening and timely interventions in this population, particularly from a precision medicine perspective.
Metabolic dysfunction-associated fatty liver disease (MAFLD), formerly known as nonalcoholic fatty liver disease (NAFLD), is characterized by abnormal hepatic lipid accumulation in the presence of metabolic dysfunction (e.g., overweight/obesity, or metabolic dysregulation).10 –12 Due to the shared pathological pathways, including IR, lipid dysregulation, and inflammation,13 –15 MAFLD is suggested to be closely related to prediabetes. 16 Epidemiological evidence shows that approximately 60% of the individuals with prediabetes may have NAFLD.17,18 However, the association of different prediabetes phenotypes with MAFLD has not yet been fully elucidated. A previous study suggested that isolated IFG, IGT, and IA1c were all associated with increased odds of NAFLD, 19 while another study found that IGT but not IFG had an elevated risk of NAFLD. 20 Furthermore, few studies have assessed the extent to which the prediabetes phenotypes, defined by the numbers or types of glucometabolic defects, would affect the odds of MAFLD or liver fibrosis in participants with prediabetes.
An understanding of the relationship between prediabetes phenotypes and MAFLD and liver fibrosis may advance the concept of “precision hepatology” in the context of early screening and timely intervention. Therefore, the primary aim of this study was to investigate the association between different prediabetes phenotypes and MAFLD and liver fibrosis. The secondary aim was to explore whether IR may mediate this association.
Methods
Study design and participants
This study was a population-based cross-sectional analysis and was reported in accordance with the Strengthening the Reporting of Observational Studies in Epidemiology (STROBE) guidelines for cross-sectional studies 21 (Supplemental Table 6).
Participants in this study were from the recruitment stage of an ongoing cluster randomized controlled trial that aimed to assess the influence of a primary-care led, prescription-guided, personalized exercise intervention program for diabetes prevention (Trial registration number: ChiCTR2400081848). Participants at high risk for diabetes were recruited from 13 primary healthcare centers in Jiangsu Province, China, from March 2024 to June 2024. All the participants were asked to have a 75-g oral glucose tolerance test (OGTT) and the measurement of hemoglobin A1c (HbA1c) to ascertain the presence of prediabetes for the eligibility for inclusion in the trial. Moreover, some participants were further invited to assess hepatic steatosis and fibrosis by vibration-controlled transient elastography consecutively in a random order.
For the present study, only participants with normal glucose tolerance (NGT) and prediabetes who have undergone vibration-controlled transient elastography were included. The exclusion criteria were as follows: (1) incomplete data of fasting plasma glucose (FPG), 2-h plasma glucose (2-h PG), and/or HbA1c, (2) diagnosed with diabetes or using hypoglycemic agents. The flow chart is shown in Supplemental Figure 1.
Clinical and laboratory measurements
Demographic characteristics, medical history, physical activity, diet quality, and lifestyle habits (including smoking and drinking history) were collected via electronic questionnaires. Specifically, physically active was defined as engaging in ⩾75 min/week of vigorous-intensity or ⩾150 min/week of moderate-to-vigorous physical activity based on the Short International Physical Activity Questionnaire. High-quality diet was defined as the answer of “100% compliant” or “80% compliant” to the question—“Is your daily diet mainly composed of whole grains, vegetables, fruits, nuts and legumes, low-fat dairy products, and olive oil, with minimal consumption of sweets, processed meats, full-fat dairy products, or alcohol?” Height, body weight, waist circumference (WC), and blood pressure were measured using standardized protocols. Body mass index (BMI) was calculated as body weight in kilograms divided by the square of height in meters. Peripheral blood samples were collected after 10 h of overnight fasting. These samples were processed on site within 30 min of collection and sent to a standardized central clinical laboratory (Nanjing Adicon Clinical Laboratories; Nanjing, Jiangsu, China) for further measurement of FPG, HbA1c, total cholesterol (TC), triglyceride (TG), high-density lipoprotein cholesterol (HDL-C), low-density lipoprotein cholesterol (LDL-C), and high-sensitivity C-reactive protein (hs-CRP). A 2-h blood sample was collected following the 75 g-OGTT to measure 2-h PG.
Vibration-controlled transient elastography
Vibration-controlled transient elastography was performed by an experienced examiner using Fibro Touch (Wuxi Hisky Medical Technologies; Wuxi, Jiangsu, China). Following the manufacturer’s instructions, participants were lying in the supine position with the right upper abdomen fully exposed. The liver area was defined through the intercostal space, and the probe was positioned vertically to the skin surface to initiate measurements. Hepatic steatosis was quantitatively assessed by ultrasound attenuation parameter (UAP). Liver stiffness was measured by capturing the propagation speed of shear waves in hepatic tissue, with liver stiffness measurement (LSM) being reported. 22 These tests were successfully performed 10 times, and the median data were used for analysis.
Definitions
According to the diagnostic criteria from the American Diabetes Association, 3 prediabetes was defined as: FPG 5.6–6.9 mmol/L (IFG), 2-h PG during 75 g-OGTT 7.8–11.0 mmol/L (IGT), and/or HbA1c 5.7%–6.4% (IA1c). NGT was defined as: FPG <5.6 mmol/L, 2-h PG <7.8 mmol/L, and HbA1c <5.7%. In this study, we defined IFG, IGT, and IA1c each as an individual glucometabolic defect for a better description of prediabetes phenotypes. Following this, prediabetes was further defined as: a single glucometabolic defect (isolated IFG, IGT, or IA1c), two glucometabolic defects (IFG + IGT, IFG + IA1c, IGT + IA1c), and all three glucometabolic defects (IFG + IGT + IA1c). Moreover, we referred to glucose-defined prediabetes as IFG, IGT, or IFG + IGT.
MAFLD was defined as the presence of hepatic steatosis in combination of overweight/obesity, and/or metabolic dysregulation. 23 Specifically, hepatic steatosis was defined as an UAP ⩾244 dB/m. 24 Overweight/obesity was defined as a BMI ⩾23 kg/m2 in Asians. 23 Metabolic dysregulation was defined as at least two metabolic risk abnormalities, including: (1) WC ⩾90 cm for Asian men and ⩾80 cm for Asian women, (2) blood pressure ⩾130/85 mmHg, and/or use of anti-hypertensive drugs, (3) TG ⩾1.70 mmol/L, and/or use of lipid-lowering drugs, (4) HDL-C <1.0 mmol/L for men and <1.3 mmol/L for women, (5) the presence of prediabetes, or (6) hs-CRP >2 mg/L. 23 Moreover, liver fibrosis was defined as a LSM ⩾7.85 kPa. 24
IR was assessed using the triglyceride-glucose index (TyG index), which was calculated as ln (TG (mg/dL) × FPG (mg/dL)/2). 25 Hypertension was defined as systolic blood pressure (SBP) ⩾140 mmHg, diastolic blood pressure (DBP) ⩾90 mmHg, use of anti-hypertensive medication, or medical history. 26 Dyslipidemia was defined as TC ⩾6.2 mmol/L, TG ⩾2.3 mmol/L, HDL-C <1.0 mmol/L, or LDL-C ⩾4.1 mmol/L, use of lipid-lowering medication, or medical history. 27
Sample size calculation
Given that this study was a cross-sectional analysis of collected data derived from a cluster randomized controlled trial, a formal sample size calculation or a priori power analysis was not conducted. 28 However, we included all participants who were assessed for eligibility in that cluster randomized controlled trial, which may enhance the statistical power to allow for a reliable estimate.
Statistical analysis
Normality of data distribution was assessed using the Kolmogorov–Smirnov test. Skewed variables were logarithmically transformed before analysis. Continuous data were shown as the mean ± standard deviation (SD), and categorical variables were as frequencies (percentages). Continuous data were analyzed by an independent t test and categorical data were by Chi-square test (χ2 test). Multivariate logistic regression analyses, which generate odds ratio (OR) and 95% confidence interval (CI), were used to examine the factors associated with MAFLD or liver fibrosis in participants with prediabetes, as well as to assess the association between different glucometabolic defects and prediabetes phenotypes with the presence of MAFLD or liver fibrosis. Subgroup analysis was conducted to assess whether age, sex, and BMI could moderate the association of different glucometabolic defects with MAFLD and liver fibrosis. In this study, age, sex, education status, hypertension, dyslipidemia, physical activity, diet quality, and history of drinking and smoking were used for multivariable adjustment. Multicollinearity across these covariables was assessed using the variance inflation factor (VIF), 29 which later showed no evidence of multicollinearity (the VIF for all the covariables was <5, Supplemental Table 1).
Mediation analysis based on a generalized structural equation model was conducted to assess the total, direct, and indirect effects of different glucometabolic defects on the presence of MAFLD or liver fibrosis with TyG index as a mediator. 30 In this approach, the “total effect” was decomposed into a “direct effect” (not mediated by TyG index) and an “indirect effect” (mediated by TyG index). The mediation effect was calculated as the indirect effect/total effect × 100%.
Statistical analyses were performed using SPSS statistical software (Version 21.0; SPSS Inc., Chicago, IL, USA) and Stata version 14.0 (Stata-Corp LP, College Station, TX, USA). For all statistical tests, p values <0.05 were considered statistically significant.
Results
Demographic and clinical characteristics
A total of 1599 participants (394 with NGT and 1205 with prediabetes) were included in this study, with their characteristics shown in Table 1. Compared with NGT, prediabetes was associated with older age and higher BMI, WC, blood pressure, FPG, 2-h PG, HbA1c, TG, TC, LDL-C, hs-CRP, and TyG index (all p < 0.05). Moreover, participants with prediabetes were more likely to be male and drinker.
Comparisons on the characteristics of participants stratified by glycemic status. a

Data are presented as mean ± SD or n (%).
The number of participants with missing information was 1 for age, sex, SBP, DBP, 5 for current drinkers and high-quality diet, 6 for education, ethnicity, current smokers, and hypertension, and 9 for dyslipidemia.
Physically active was defined as engaging in ⩾75 min/week of vigorous-intensity or ⩾150 min/week of moderate-to-vigorous physical activity.
High-quality diet was defined as the regular consumption of whole grains, vegetables, fruits, nuts and legumes, low-fat dairy products, and olive oil, with minimal consumption of sweets, processed meats, full-fat dairy products, or alcohol.
They were logarithmically transformed before analysis.
2-h PG, 2-h plasma glucose; BMI, body mass index; DBP, diastolic blood pressure; FPG, fasting plasma glucose; HbA1c, hemoglobin A1c; HDL-C, high density lipoprotein cholesterol; hs-CRP, high-sensitivity C-reactive protein; LDL-C, low-density lipoprotein cholesterol; NGT, normal glucose tolerance; SBP, systolic blood pressure; SD, standard deviation; TC, total cholesterol; TG, triglyceride; TyG index, triglyceride-glucose; WC, waist circumference.
MAFLD and liver fibrosis in prediabetes and its associated factors
The LSM value was higher in prediabetes than in NGT (7.02 ± 2.09 vs 6.48 ± 1.8 kPa, p < 0.001). Compared with NGT, participants with prediabetes showed a higher prevalence of MAFLD and liver fibrosis (Figure 1(a) and (b), both p < 0.05). Multivariable logistic analysis showed that factors associated with the prevalence of MAFLD in participants with prediabetes included: BMI (per SD increment, OR 5.76), TG (per SD increment, OR 1.76), 2-h PG (per SD increment, OR 1.37), hypertension (OR 1.44), and dyslipidemia (OR 2.26; Supplemental Table 2). Similarly, factors associated with the prevalence of liver fibrosis included: BMI (per SD increment, OR 1.85), TG (per SD increment, OR 1.21), hypertension (OR 1.50), and dyslipidemia (OR 1.39).
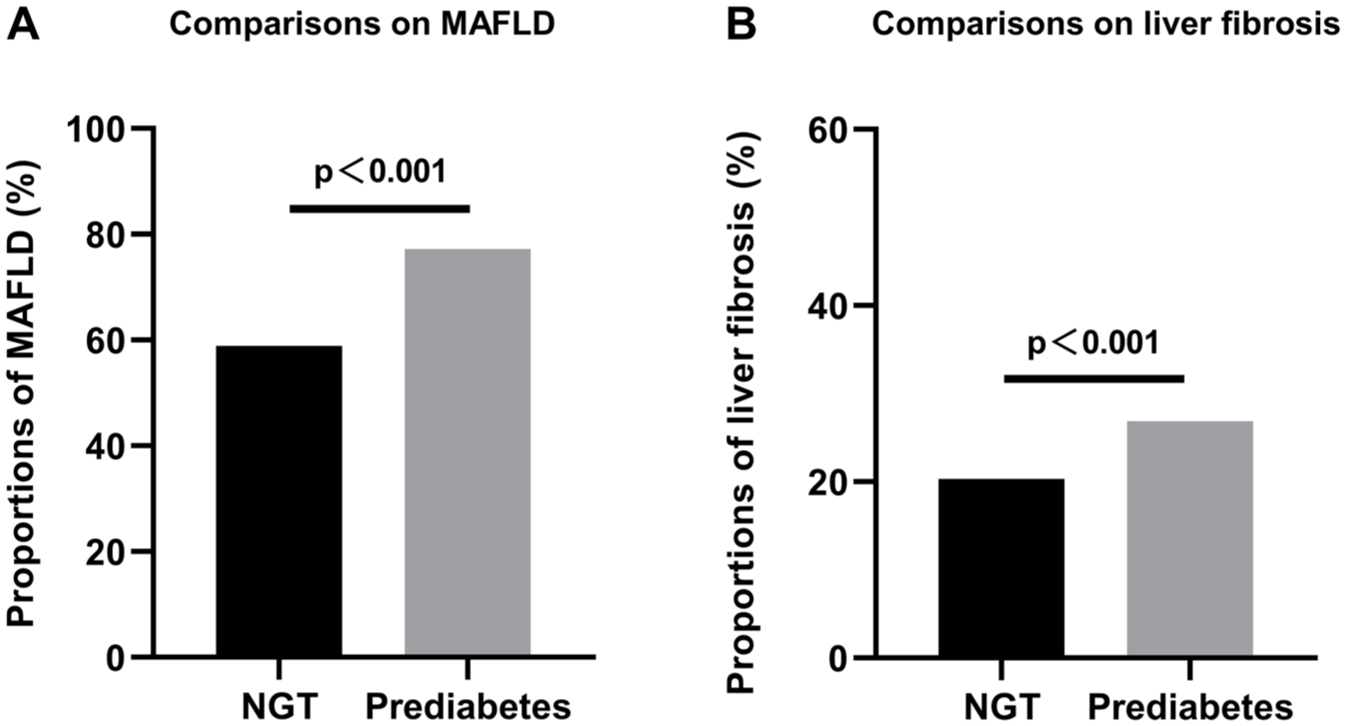
Comparisons of the proportions of MAFLD and liver fibrosis between NGT and prediabetes. (a) Comparison of proportions of MAFLD. (b) Comparison of proportions of liver fibrosis. Data were compared using χ2 test.
Association of glucometabolic defects with MAFLD and liver fibrosis
The prevalence of MAFLD in prediabetes was increased with the growing numbers of glucometabolic defects (Figure 2(a), p < 0.01). After multivariable adjustment, the ORs of MAFLD in prediabetes were increased with the increasing numbers of glucometabolic defects (Figure 3(a), p < 0.01). Compared with participants with a single glucometabolic defect, the odds of MAFLD were increased by 39% (OR 1.39, 95% CI 1.01–1.89) and 117% (OR 2.17, 95% CI 1.43–3.29) for those with two and three glucometabolic defects, respectively (Figure 3(a)). Subgroup analysis showed that the association between increasing numbers of glucometabolic defects and MAFLD was unlikely to be affected by age, sex, and BMI (all pinteraction ⩾0.25, Supplemental Table 3). Mediation analysis showed that the TyG index may mediate the association between increased numbers of glucometabolic defects and the presence of MAFLD, with the mediating effect being calculated to be 18.76% (Figure 4).

Comparisons of the proportions of MAFLD and liver fibrosis across different numbers of glucometabolic defects. (a) Comparisons of the proportions of MAFLD. (b) Comparisons of the proportions of liver fibrosis. Data were compared using χ2 test.

MAFLD in relation to different prediabetes phenotypes. (a) ORs of MAFLD in individuals with different numbers of glucometabolic defects. (b) ORs of MAFLD in individuals with a single glucometabolic defect. (c) ORs of MAFLD in individuals with two glucometabolic defects. Analysis was adjusted for age, sex, education status, hypertension, dyslipidemia, physical activity, diet quality, and history of drinking and smoking.
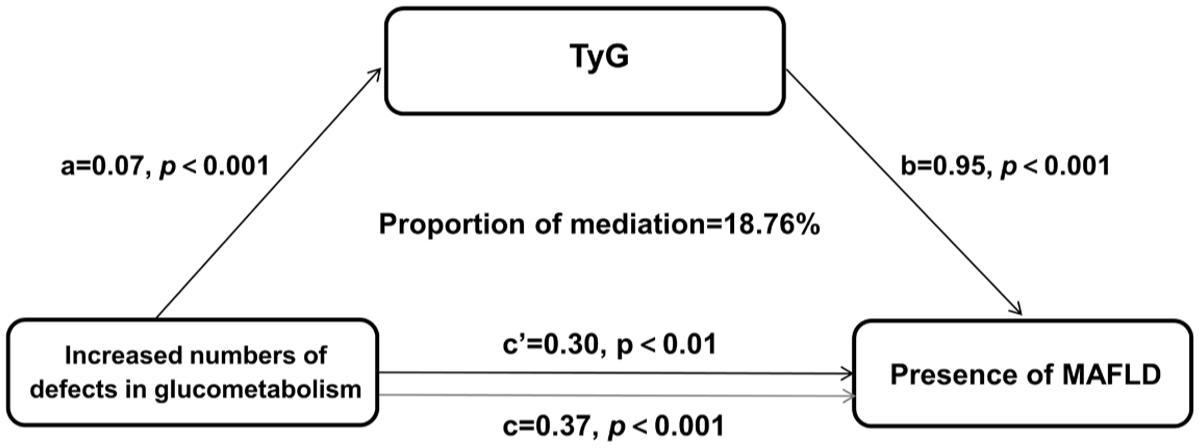
Mediation analysis. Indirect effect = a × b, Direct effect = c’, Total effect (c) = c’ + a × b, proportion of mediation = a × b/c × 100%.
However, no significant difference was observed in the prevalence of liver fibrosis across different numbers of glucometabolic defects (Figure 2(b)). The odds of liver fibrosis were not related to the increasing numbers of glucometabolic defects (Supplemental Figure 2(A)), and the mediation analysis was therefore not performed. Subgroup analysis did not reveal any significant findings across different subgroups (Supplemental Table 4).
Association of prediabetes phenotypes with MAFLD and liver fibrosis
In participants with a single glucometabolic defect, the prevalence of IFG was the highest (26.05%), followed by IGT (12.03%) and IA1c (5.73%, Supplemental Figure 3). The prevalence of MAFLD was obviously higher in IFG and IGT than in the IA1c (Supplemental Figure 4(A), all p < 0.05). Compared with IA1c, the odds of MAFLD in IFG and IGT were increased by 28% (OR 1.28, 95% CI 0.72–2.27) and 138% (OR 2.38, 95% CI 1.22–4.66), respectively, after multivariable adjustment (Figure 3(b)). However, there was no significant difference in the odds or the prevalence of liver fibrosis across isolated glucometabolic defects (Supplemental Figures 2(B) and 4(B)).
In participants with two glucometabolic defects, the most common phenotype was IFG + IGT (18.17%, Supplemental Figure 3). However, the odds of MAFLD or liver fibrosis were comparable across different phenotypes in participants with two glucometabolic defects after multivariable adjustment (Figure 3(c) and Supplemental Figure 2(C)).
When categorizing prediabetes phenotypes as HbA1c-defined and glucose-defined prediabetes, the prevalence of MAFLD was higher in FPG- and/or 2-h PG-defined prediabetes than in HbA1c-defined prediabetes (Supplemental Figure 5(A), p < 0.05). After multivariable adjustment, the odds for MAFLD in glucose-defined prediabetes were increased by 72% (OR 1.72, 95% CI 1.00–2.96) compared with HbA1c-defined prediabetes. However, the odds for liver fibrosis were comparable between glucose-defined prediabetes and HbA1c-defined prediabetes.
Discussion
In this cross-sectional study with a large sample size that assessed the association between prediabetes phenotypes with MAFLD and liver fibrosis, we found that: (1) the prevalence and the odds of MAFLD were increased with the growing numbers of glucometabolic defects, with IR being a potential mediator; (2) isolated IGT had higher odds of MAFLD than isolated IA1c, and glucose-defined prediabetes showed higher odds of MAFLD than HbA1c-defined prediabetes; (3) there was no significant difference in the odds of liver fibrosis across different prediabetes phenotypes.
Previous studies showed that elevated BMI, hyperglycemia, hypertension, and dyslipidemia were risk factors for MAFLD in the general population.31,32 Similarly, we found that higher BMI, TG, and 2-h PG, as well as hypertension, were associated with a higher probability of having MAFLD in participants with prediabetes. Moreover, BMI and TG levels, along with hypertension and dyslipidemia, were also related to liver fibrosis in participants with prediabetes. These findings highlight the importance of integrated management of body weight, glucose, lipids, and blood pressure in terms of the prevention of MAFLD or liver fibrosis in participants with prediabetes, at least partly. They also provide evidence supporting the recommendation of incorporating MAFLD into multidisciplinary care (e.g., from endocrinologists, cardiologists, and nutritionists) in clinical practice, 33 in particular considering the high prevalence of MAFLD in participants with prediabetes observed in our study and others,17,34 as well as the prevalent complications and comorbidities related to MAFLD (e.g., cardiovascular diseases). 34
Our study showed that after multivariable adjustment, the odds of prediabetes with MAFLD were increased with the increased numbers of glucometabolic defects, indicative of a graded association between the deteriorated glucose metabolism and MAFLD. This outcome could be supported by the observation that the larger the number of glucometabolic defects, the higher the BMI, WC, blood pressure, and blood glucose (Supplemental Table 5). However, our subgroup analysis showed that this association was unlikely to be moderated by differences in age, sex, or BMI. Yet, our subsequent analysis showed that IR, as reflected by the TyG index, 35 might be a mediator for this association. This finding, on one hand, indicates that amelioration of IR may help to lower the risk of MAFLD among individuals with prediabetes. On the other hand, it is in support of the notion that IR is a critical factor related to the development of MAFLD.36,37
However, our study found that the odds of liver fibrosis did not differ across participants with different numbers of glucometabolic defects, nor between different phenotypes with an isolated defect. This may be attributable to insufficient statistical power due to the small sample size of participants with liver fibrosis. Alternatively, prediabetes is primarily characterized by abnormalities in glucose metabolism that may not yet reach the threshold required for the development of liver fibrosis, suggesting a threshold effect potentially. Therefore, future studies with larger sample sizes are warranted to validate our findings, in particular regarding the association with liver fibrosis.
In our study, isolated IGT was associated with 138% and 90% higher odds of MAFLD compared with isolated IA1c and IFG, respectively. In consistent with this result, a previous study showed that IGT, rather than IFG, was related to an increased risk of NAFLD, 20 a condition that shares similar biological mechanisms and management approaches with MAFLD but has lower rates of overall and cardiovascular mortality during follow-up compared with MAFLD. 38 A possible explanation for this discrepancy could be that isolated IGT is more relevant to IR, a pathophysiological factor underlying the development of MAFLD. 36 In contrast, IFG is characterized by impaired basal and first-phase insulin secretion, 4 while IA1c exhibits less impairment in islet secretion function compared with IGT. 5 These findings suggest that incorporating 2-h PG in addition to HbA1c and FPG may help better identify individuals at high risk for MAFLD. Furthermore, our results showed that glucose-defined prediabetes was associated with higher odds of MAFLD than HbA1c-defined prediabetes. Taken together, it is likely that glucose-defined prediabetes, particularly IGT, may reflect a metabolically higher-risk phenotype for MAFLD. Therefore, greater attention should be given to glucose-defined prediabetes when initiating liver health check-ups in clinical practice.
Strengths and limitations
The strengths of this study include the first attempt to assess the association between different prediabetes phenotypes and the presence of MAFLD and liver fibrosis, the use of a comprehensive definition of prediabetes that includes FPG, 2-h PG, and/or HbA1c, 3 and the application of vibration-controlled transient elastography to detect hepatic steatosis.39,40 However, there are several limitations in our study. First, the cross-sectional study design cannot determine causality, and the association observed in our study might be bidirectional, since impaired glucose metabolism may contribute to hepatic steatosis, while MAFLD itself may, in turn, aggravate IR and glucose dysregulation. 33 Second, because of the lack of data on fasting and 2-h postprandial insulin levels, our study was not able to assess the contribution of insulin secretion to the association between prediabetes subtypes and MAFLD. Nonetheless, our study used the TyG index, a previously validated indicator of IR. 41 Third, despite the efforts to control for multivariable factors, including diet and physical activity, residual confounding effects cannot be excluded due to the unmeasured factors, such as environmental toxin exposure 42 (e.g., Microcystin-LR) and genetic predisposition 43 (e.g., PNPLA3 and TM6SF2). Fourth, our study explored the association of MAFLD and liver fibrosis in relation to prediabetes phenotypes based on the numbers and types of different glucometabolic defects, but not the association with prediabetes phenotypes generated by machine learning models and artificial intelligence-based large models, both of which are shown to be effective for liver disease prediction.44,45 Finally, the participants enrolled in our study were predominantly Chinese adults with Han ethnicity. This may limit the generalization of the outcomes to other populations. Future longitudinal cohort studies in populations with other ethnicities/races from other countries are required to validate our findings.
Conclusion
In conclusion, our study showed that the odds of MAFLD were related to the worsening of glucometabolic defects in participants with prediabetes. While glucose-defined prediabetes (particularly isolated IGT) was more likely to capture the presence of MAFLD than HbA1c-defined prediabetes, liver fibrosis was not related to the phenotypes of prediabetes. Our study supports the observation that the pathophysiological characteristics of prediabetes are heterogeneous across different phenotypes. On the other hand, our study suggests that a hierarchical intervention or screening program that is tailored to the phenotypes of prediabetes (defined based on the number or type of glucometabolic defects) is recommended for the prevention or detection of MAFLD.
Supplemental Material
sj-docx-1-tae-10.1177_20420188261457476 – Supplemental material for Association of prediabetes phenotypes with metabolic dysfunction-associated fatty liver disease and liver fibrosis: a population-based study
Supplemental material, sj-docx-1-tae-10.1177_20420188261457476 for Association of prediabetes phenotypes with metabolic dysfunction-associated fatty liver disease and liver fibrosis: a population-based study by Miao He, Yan Liu, Tianyun Gao, Jinjin Gu, Xiaoying Zhou, Zilin Sun and Shanhu Qiu in Therapeutic Advances in Endocrinology and Metabolism
Footnotes
References
Supplementary Material
Please find the following supplemental material available below.
For Open Access articles published under a Creative Commons License, all supplemental material carries the same license as the article it is associated with.
For non-Open Access articles published, all supplemental material carries a non-exclusive license, and permission requests for re-use of supplemental material or any part of supplemental material shall be sent directly to the copyright owner as specified in the copyright notice associated with the article.