






Abstract
Background:
Overactive bladder (OAB) is a common condition that affects both men and women, but its relationship with central obesity and the dietary intake has not been adequately elucidated.
Objectives:
Our study aims to investigate associations between central obesity replacement indices, dietary intake of sugar and lipids, and OAB risk using National Health and Nutrition Examination Survey 2005–2016 data.
Design:
Cross-sectional study.
Methods:
This study analyzed 24,675 adults (4848 OAB cases). Weight, body mass index, and other central obesity replacement indices (waist circumference, weight-adjusted waist index, waist-to-height ratio (WHtR), body roundness index (BRI)) and dietary nutrients intake (carbohydrate, sugars, fat, saturated fatty acids, monounsaturated fatty acids, polyunsaturated fatty acids (PUFAs), and cholesterol) were assessed. Propensity score matching (1:2) balanced covariates. Multivariable logistic regression and generalized additive models evaluated dose-response relationships.
Results:
All central obesity indices showed significant positive associations with OAB (p < 0.001), with WHtR and BRI demonstrating the strongest effects (adjusted odds ratio (OR) = 2.04, 95% confidence interval: 1.80–2.30). Nonlinear relationships were observed, particularly for WHtR (degrees of freedom = 3.30–6.16). Dietary analysis revealed that OAB patients had significantly higher consumption of total energy, carbohydrates, and sugars (all p < 0.05), and higher sugar intake increased OAB risk (OR = 1.32, p = 0.0016), while PUFAs were protective (OR = 0.79, p = 0.0159).
Conclusion:
Central obesity replacement indices, especially WHtR and BRI, strongly predict OAB risk. Dietary modifications, including reducing sugars and increasing PUFAs intake, may complement abdominal fat reduction for OAB prevention. These findings highlight the importance of combined weight management and dietary modifications for OAB prevention in high-risk populations.
Plain language summary
Overactive bladder (OAB) can seriously affect daily life. Using data from over 24,000 U.S. adults, this study found that people with more belly fat were more likely to have OAB, especially when their waist-to-height ratio and body roundness index were high. Diet also mattered—those who ate more sugars had higher OAB risk, while consuming more healthy fats, such as polyunsaturated fatty acids (PUFAs), was linked to lower risk. Managing abdominal fat and improving diet may help prevent or relieve OAB symptoms.
Introduction
Overactive bladder (OAB) is a clinical syndrome characterized primarily by urinary urgency, usually accompanied by increased urinary frequency and nocturia. As defined by the International Continence Society guidelines, OAB was categorized into wet or dry subtypes, with the former showing urgency incontinence and indicating more severe symptoms. 1 Epidemiological studies show that OAB affects approximately 16% of the male population, and 2.6% experience urinary incontinence, while in women, the prevalence of OAB is estimated at approximately 17%–24%, with urge incontinence affecting 21.9%.2 –5 Aging is significantly correlated with both higher prevalence and worsening symptoms of OAB. This condition adversely leads to multiple health problems, including impaired sleep quality, increased anxiety, reduced work productivity, and greater susceptibility to urinary tract infections,3,6,7 causing multifaceted health complications and social burdens.
The pathogenesis of OAB is multifactorial, with risk factors including aging, tobacco use, alcohol consumption, history of urinary tract infections, hypertension, and diabetes mellitus.8 –11 Recent studies have demonstrated a significant correlation between obesity and OAB. 12 Obesity, a chronic metabolic disorder characterized by profound dysregulation of glucose/lipid metabolism and energy homeostasis, may influence lower urinary tract function through multiple pathophysiological mechanisms, including autonomic and peripheral neuropathies, chronic ischemia, proinflammatory status, dysregulation of nutrient-sensing pathways.8,13 It is known that the central obesity is more harmful than general obesity, which underlies various chronic diseases and markedly elevates the incidence of metabolic syndrome, cardiovascular diseases (CVD), and malignancies.14 –16
However, the associations between central obesity and OAB risk require further validation through large-scale cohort studies. Body mass index (BMI) was the most commonly used metric to define obesity previously, with a threshold of over 30 kg/m2. 17 It only reflects the ratio of weight to height and cannot measure body fat percentage, muscle mass, or fat distribution, factors that may have a greater impact on health than the BMI value alone. Therefore, a series of central obesity replacement indices such as waist circumference (WC), weight-adjusted waist index (WWI), 18 waist to-height ratio (WHtR), 19 and body roundness index (BRI) 20 were analyzed. Additionally, the metabolism of dietary glucose and lipids plays a pivotal role in adipogenesis and obesity progression. Notably, increasing attention has been paid to the consumption of different fatty acid subtypes, primarily including saturated fatty acids (SFAs), monounsaturated fatty acids (MUFAs), and polyunsaturated fatty acids (PUFAs).21,22 Therefore, the mechanistic links between OAB and dietary intake, particularly nutrients reflecting glycolipid metabolism, remain to be elucidated.
This study utilized data of the National Health and Nutrition Examination Survey (NHANES) 2005–2016 to investigate the potential associations between obesity and OAB, aiming to evaluate the central obesity replacement indices and dietary factors as potential risk assessment tools for OAB, and provide evidence to inform early screening and dietary intervention strategies for OAB prevention.
Materials and methods
Study population
The NHANES database (https://www.cdc.gov/nchs/nhanes) is a continuous, stratified, multistage probability sampling, cross-sectional survey designed to assess the health and nutritional status of the U.S. population by the National Center for Health Statistics of the Centers for Disease Control and Prevention. It encompasses comprehensive data including demographic characteristics, physical examinations, laboratory tests, and health questionnaire surveys. This study was conducted and reported in accordance with the Strengthening the Reporting of Observational Studies in Epidemiology (STROBE) guidelines. 23
Based on the NHANES database, this study enrolled 24,675 participants from 2005 to 2018. Participants finished the questionnaire of Kidney Conditions-Urology and completed body measurements were included in our analysis. The following patients were excluded: (1) missing data related to the definition of OAB (n = 26,586), (2) missing data on weight, height, and WC (n = 2253), (3) missing data on covariates such as education, marital status, diabetes, hypertension, CVD, cancer, stroke, drinking, and smoking (n = 7422). An overall flowchart of the research process is shown in Figure 1. As the study relied on an open-access online database, ethical compliance was ensured by following the Helsinki Declaration rather than obtaining institutional ethics review.
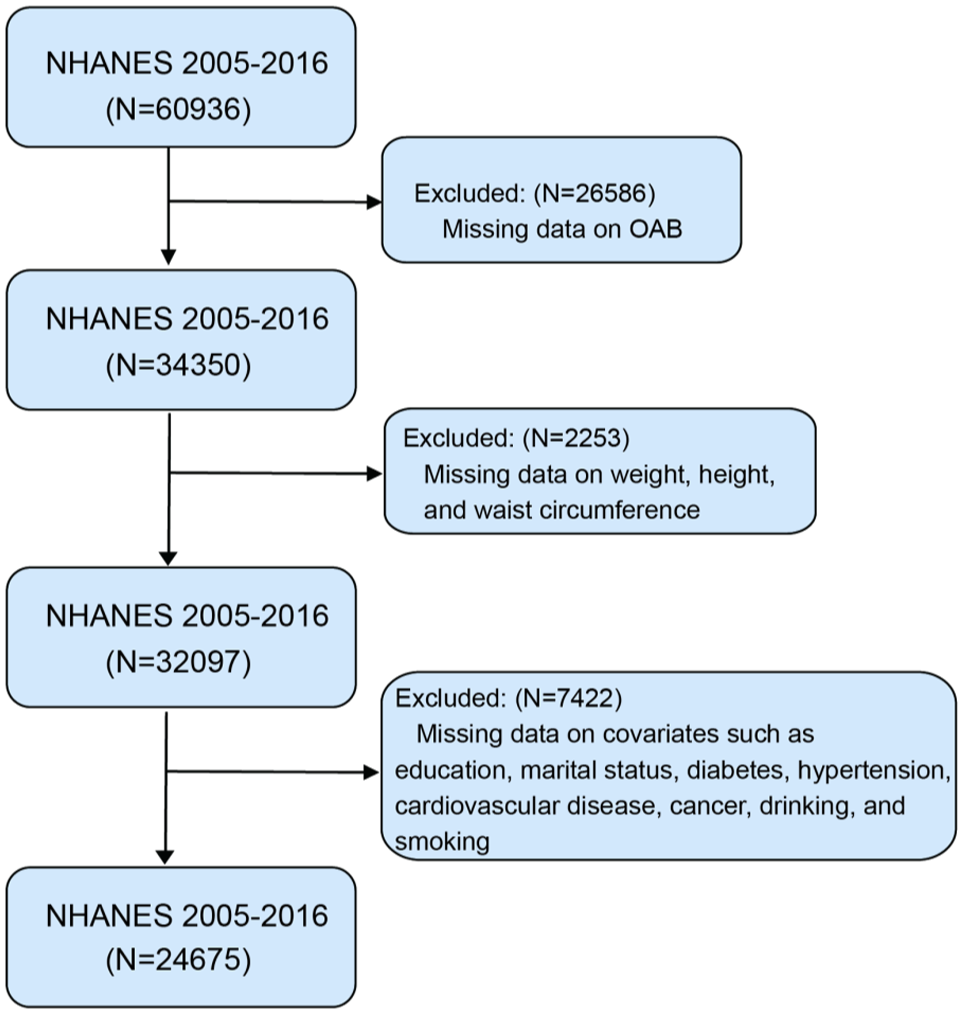
Flowchart of patient selection.
Definition of OAB
OAB was evaluated using the Overactive Bladder Symptom Score 24 as a criterion combined with participants’ responses to questionnaires about UUI and nocturia. The specific scoring criteria are displayed in Supplemental Table 1. Based on previous studies, participants were diagnosed with OAB by adding the scores of the two components and totaling ⩾3.25 –27
Calculation of central obesity replacement indices
Six physical examination metrics (weight, BMI, WC, WWI, WHtR, and BRI) were included for assessing obesity and were analyzed using interquartile range. The values of weight, BMI, and WC were obtained directly from body measure data of the NHANES database. The WWI was calculated as WC (cm) divided by weight0.5 (cm). The WHtR was calculated as WC (cm) divided by height (cm). The BRI was calculated based on a published equation by previous articles. 20 The detailed equations of obesity-related metrics can be obtained in Supplemental Table 2.
Assessment of covariates
The total energy intake, and the total intake of carbohydrate, sugars, fat, SFAs, MUFAs, PUFAs, and cholesterol were the primary exposures and were determined using a food frequency questionnaire in the NHANES database. The initial 24-h dietary recall was administered during the Mobile Examination Center visit, with a subsequent telephone-based recall interview performed 3–10 days following the first assessment. The intake of the aforementioned sugars and fats was calculated as the mean of the two dietary recalls. Each exposure was stratified into quartiles based on data distribution characteristics.
A variety of baseline covariates were collected through the NHANES questionnaires, including age, gender, race, poverty income ratio, education level, marital status, hypertension, diabetes, CVD, cancer, stroke, smoking status, alcohol intake, physical activity. For male participants, we additionally included the variable of benign prostatic hyperplasia (BPH). BPH was assessed based on participants’ responses to the question: “Have you ever been told by a doctor or health professional that you had an enlarged prostate gland?”
Statistical analysis
The data were tested for normal distribution using the Kolmogorov–Smirnov test. The normally distributed variables were presented as mean (standard deviation) and were evaluated using Student’s t-test. Variables not normally distributed were reported as medians (interquartile range) and were evaluated using the Kruskal–Wallis test. Categorical variables were described as frequencies (percentages). Then, Chi-square or Fisher’s exact tests were performed to compare categorical variables. Propensity score matching (PSM; 1:2 nearest neighbor with 0.02 SD caliper) was applied to balance baseline characteristics between OAB and control groups. Logistic regression models (univariate and multivariate) were then used to compare outcomes between matched cohorts. Generalize additive models (GAM) were performed to assess the dose-effect correlations between central obesity replacement indexes with OAB. Considering the association between BPH and OAB in males, we also performed a sensitivity analysis to investigate whether BPH influences the correlation between central obesity replacement indexes and OAB. All analyses were conducted using R (version 4.4.1) software and SPSS (v23.0; IBM, Armonk, NY, USA). p Value < 0.05 was used as a cutoff for statistical significance.
Results
Patient characteristics
A total of 24,675 participants were finally enrolled in our analysis, 4848 with a diagnosis of OAB and 19,827 controls. The demographic and clinical characteristics of the patients are summarized in Table 1. Compared to controls, OAB prevalence was significantly higher in females versus males (59.49% vs 40.51%). OAB patients were older (61 vs 45 years), more frequently non-Hispanic Black (28.07% vs 19.07%); and had lower socioeconomic status, evidenced by fewer individuals with poverty-income ratio >3.0 (21.53% vs 34.22%); had lower college education attainment (42.82% vs 55.92%); lived alone than married or living with partner (43.67% vs 33.79%); and lower occurrence in those engaging in moderate or vigorous physical activity; with notable prevalence among tobacco users and non-drinkers. Furthermore, OAB was more commonly observed in patients with comorbidities including hypertension (54.76% vs 30.36%), diabetes (27.21% vs 11.64%), CVD (7.03% vs 3.10%), and cancer (18.84% vs 7.93%). After PSM, 3923 pairs were successfully matched with 13 balanced covariates. The baseline characteristics after PSM are shown in Table 2.
Baseline characteristics before propensity score matching.
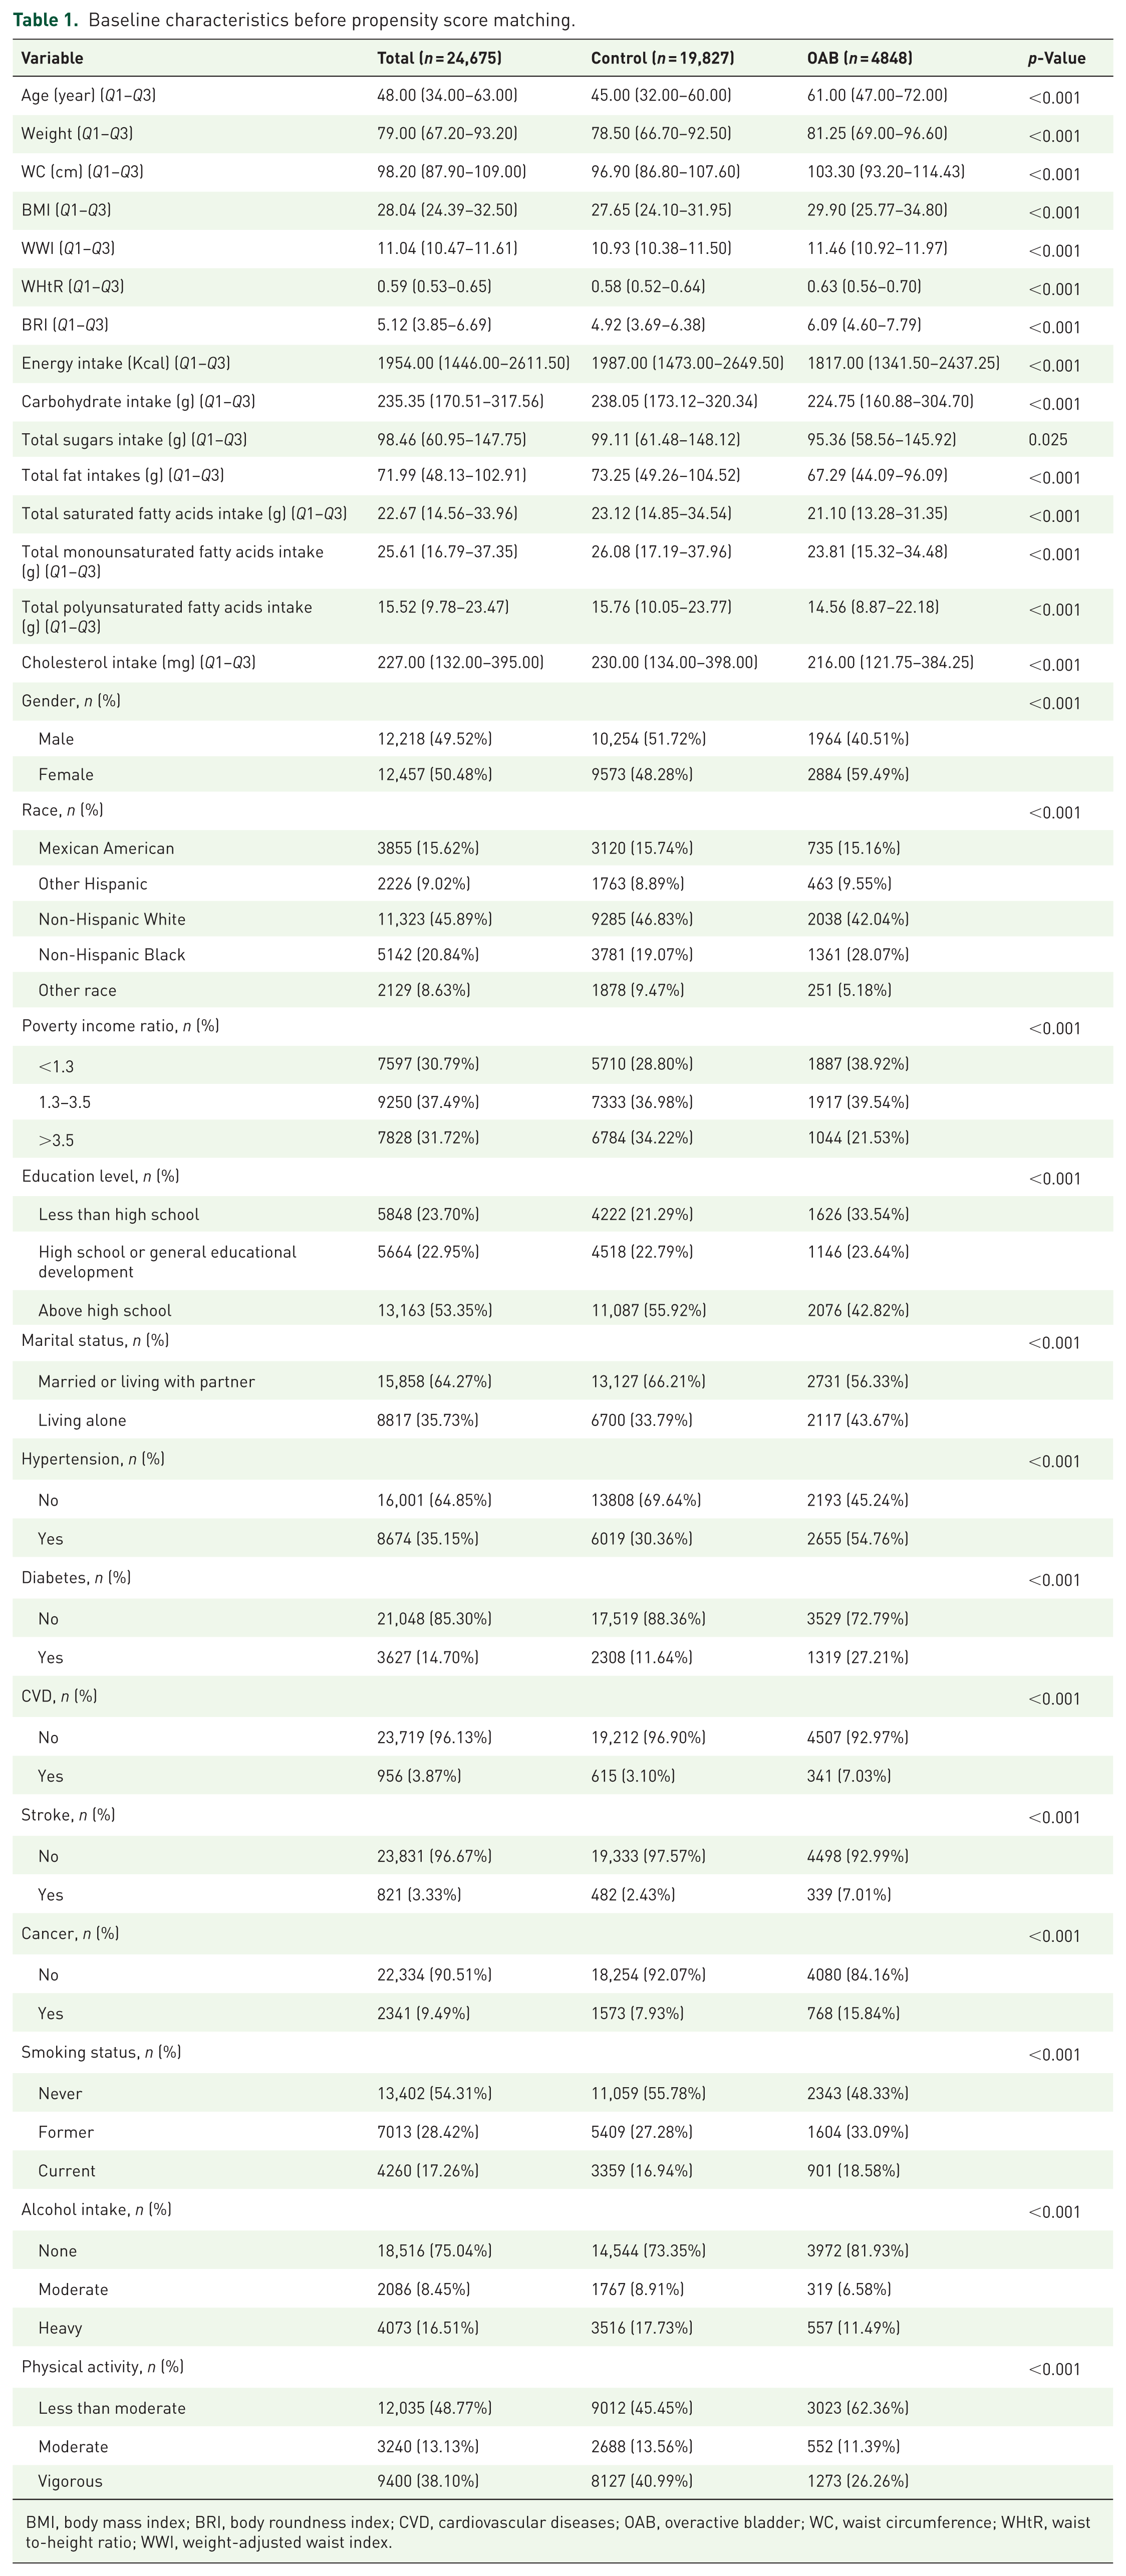
BMI, body mass index; BRI, body roundness index; CVD, cardiovascular diseases; OAB, overactive bladder; WC, waist circumference; WHtR, waist to-height ratio; WWI, weight-adjusted waist index.
Baseline characteristics after propensity score matching.
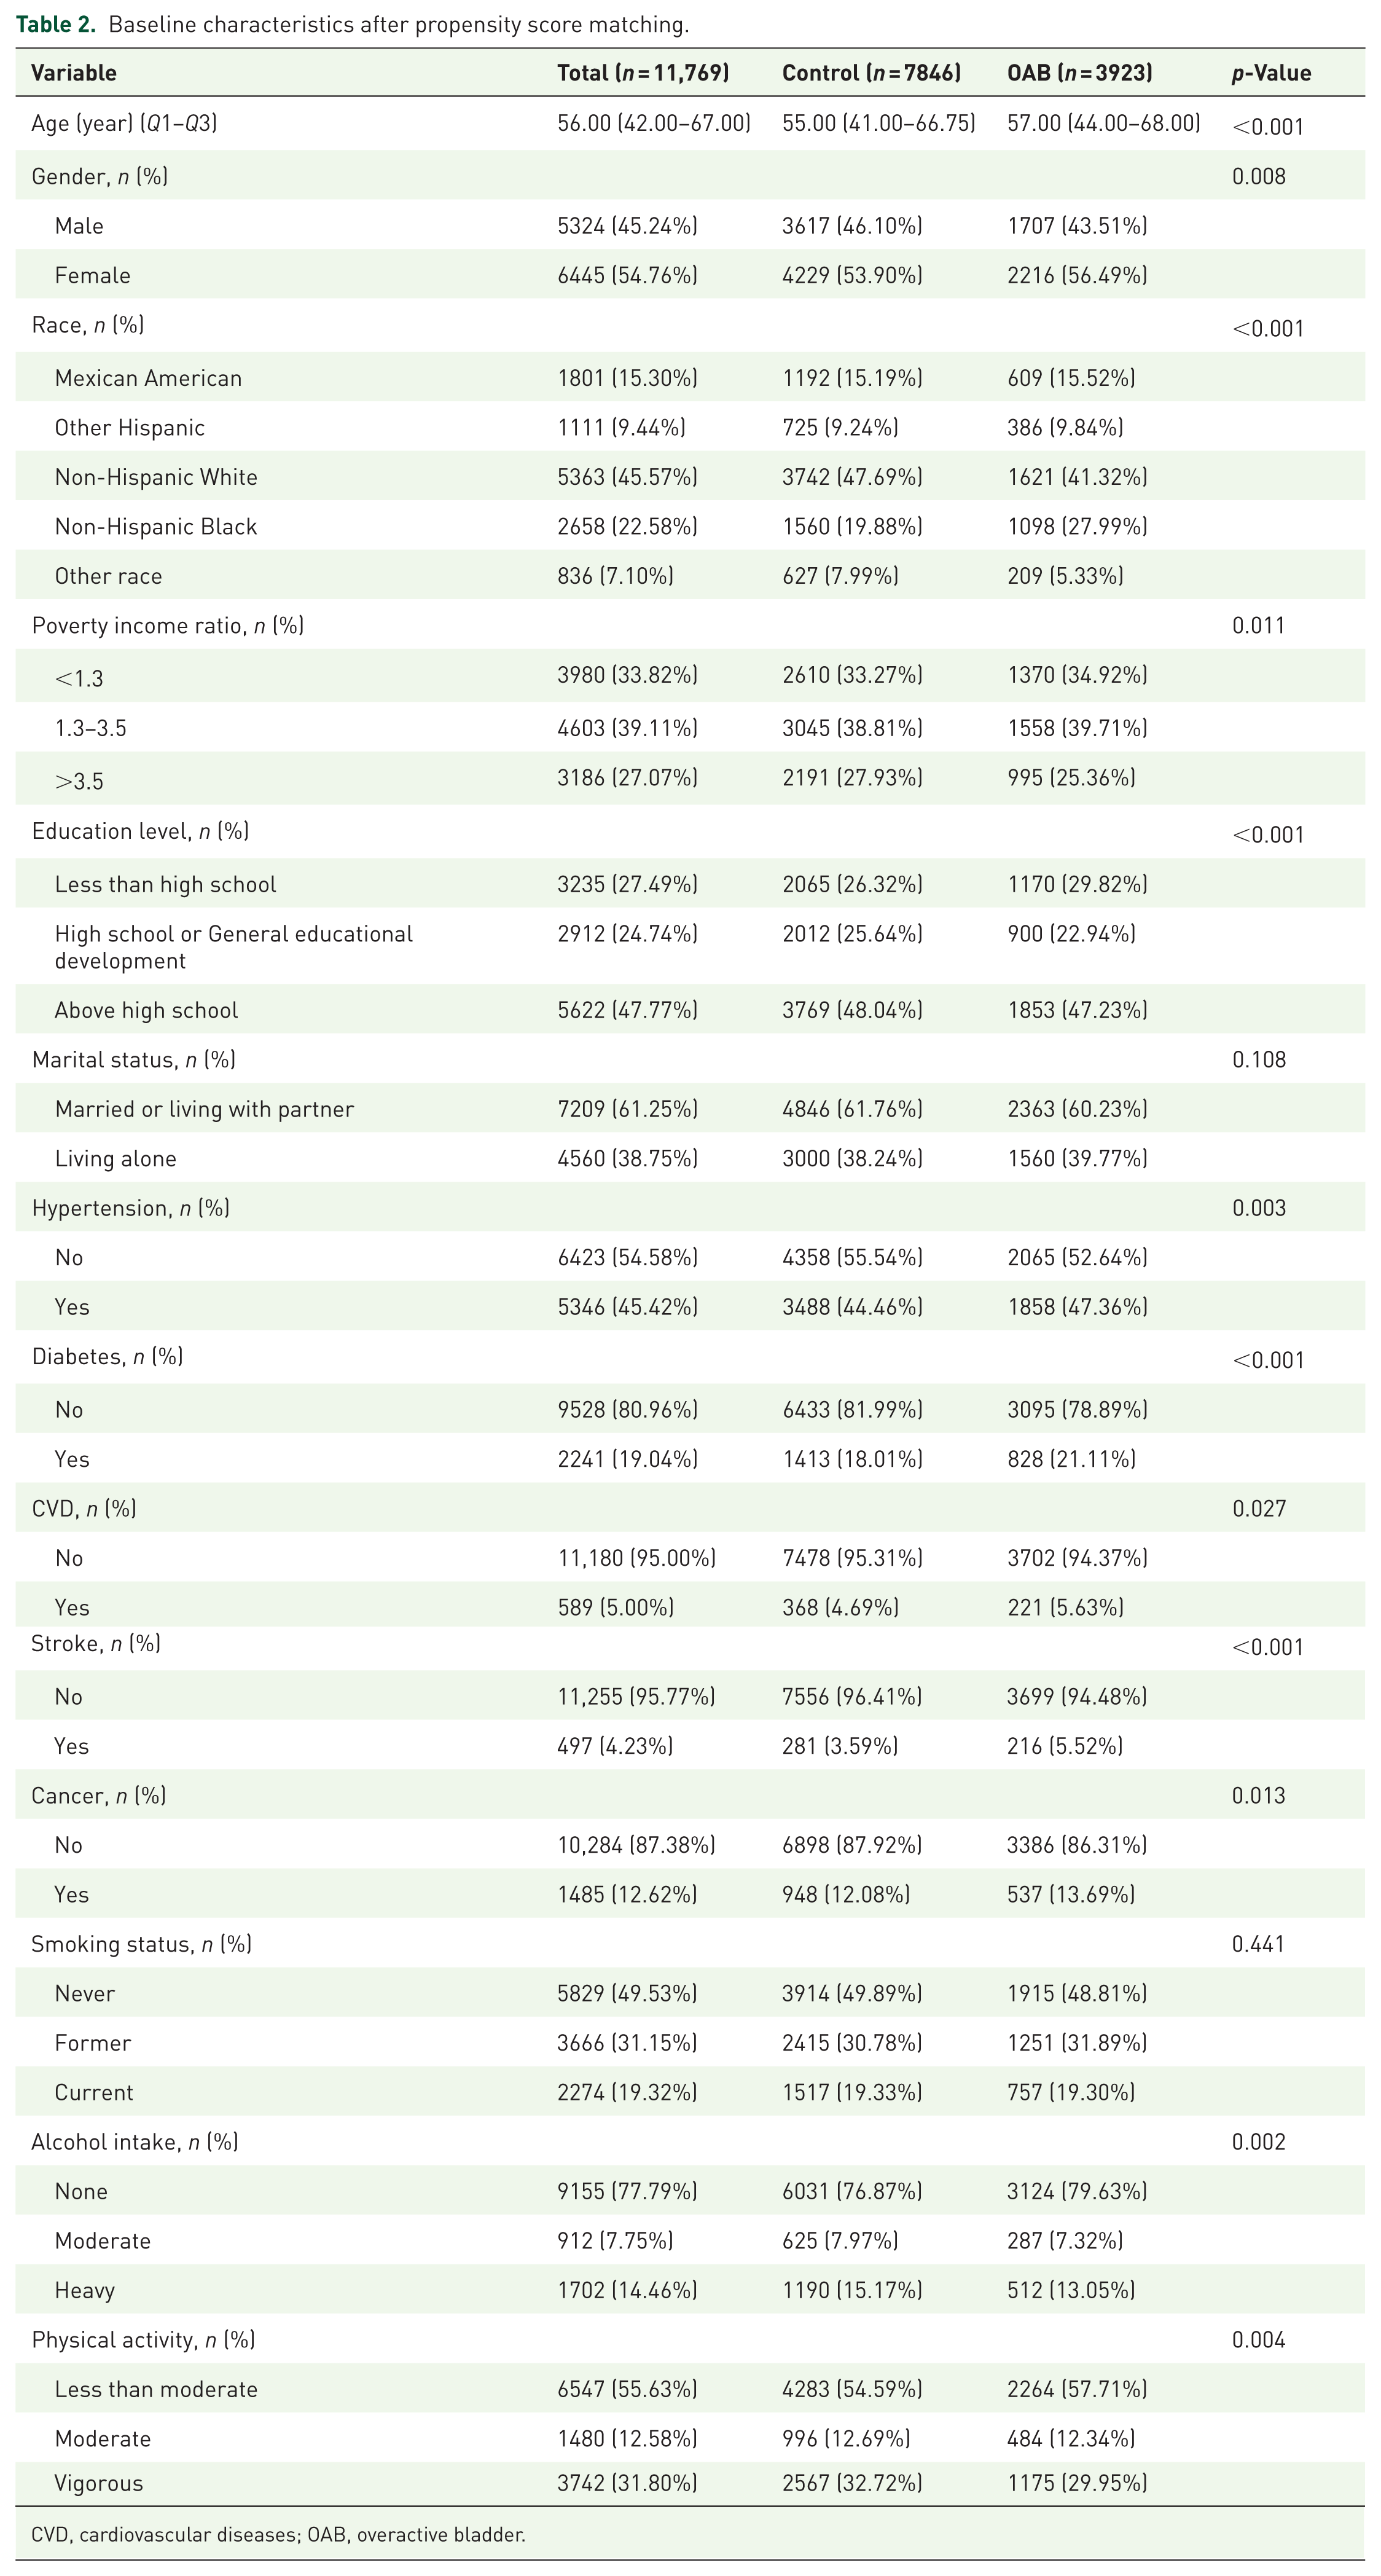
CVD, cardiovascular diseases; OAB, overactive bladder.
The differences in central obesity replacement indices between OAB and the controls
The differences in each central obesity replacement index between OAB patients and controls are summarized in Table 3. After PSM, compared with patients in the control group, Weight, BMI, WC, WWI, WHtR, and BRI were significantly higher in the OAB group (all p < 0.05).
Comparison of central obesity replacement indices after propensity score matching.
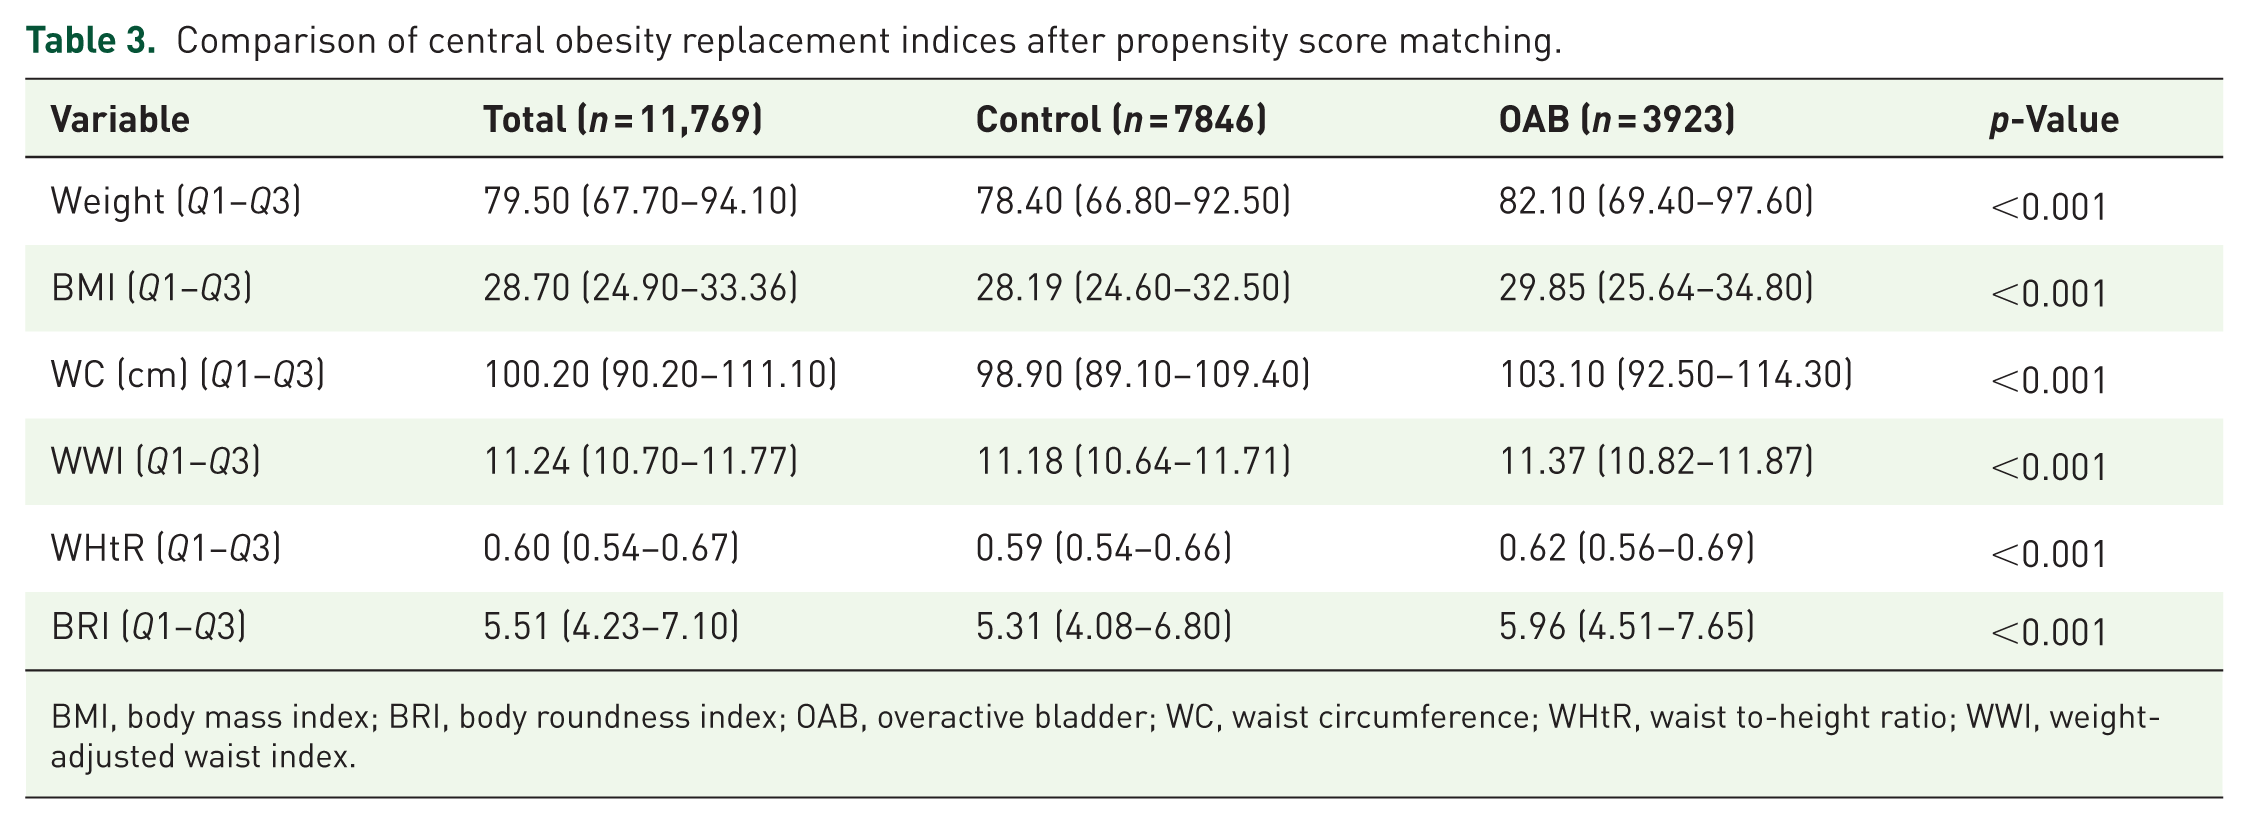
BMI, body mass index; BRI, body roundness index; OAB, overactive bladder; WC, waist circumference; WHtR, waist to-height ratio; WWI, weight-adjusted waist index.
The differences in dietary intakes between OAB and the controls
The differences in dietary intakes between OAB patients and controls are summarized in Table 4. After PSM, compared with patients in the control group, the intake of total energy, carbohydrate, and total sugars was significantly higher in the OAB group (all p < 0.05). OAB patients appeared to have more intake of fat, SFAs, MUFAs, PUFAs, and cholesterol, although the difference did not reach statistical significance.
Differences in various dietary intakes after propensity score matching.
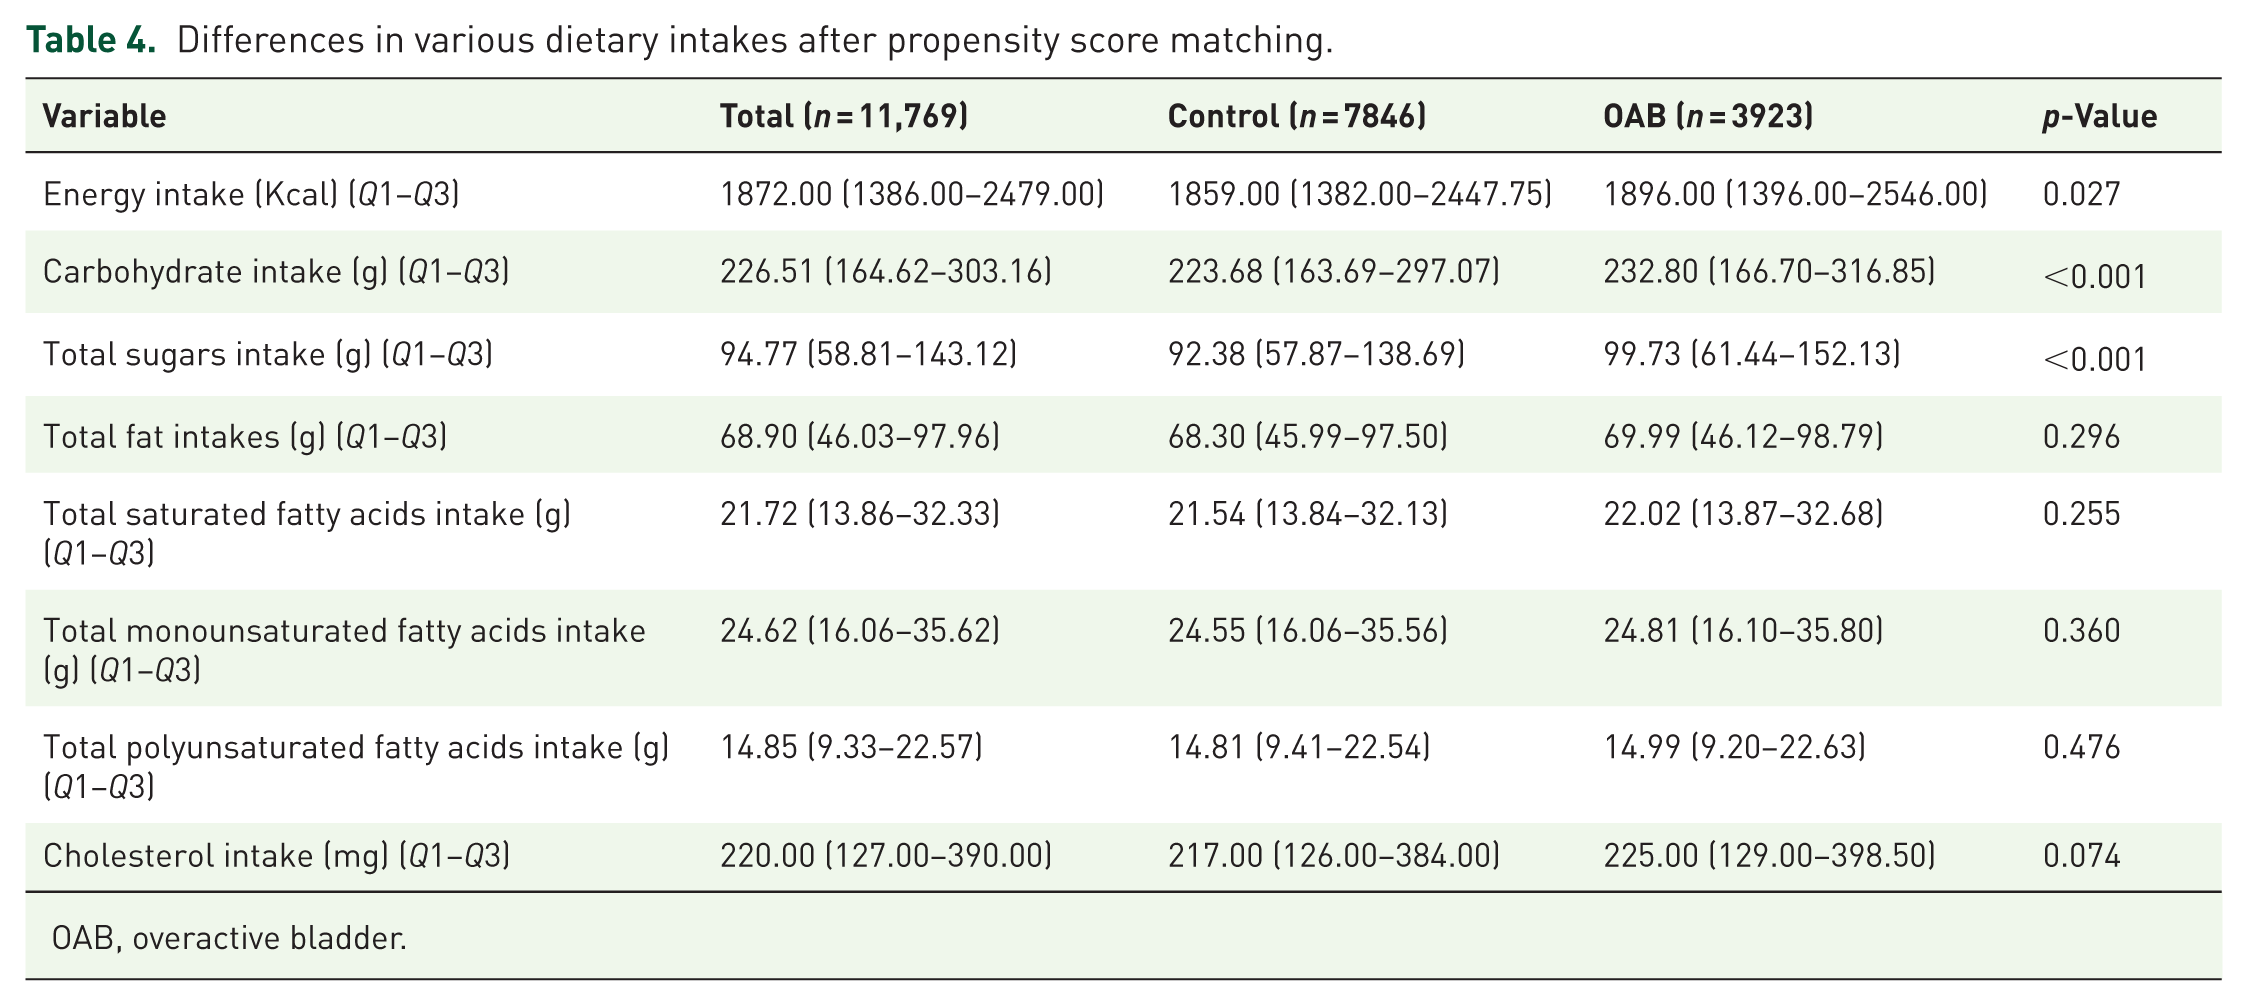
OAB, overactive bladder.
Logistic regression analysis of dietary intake
As shown in Figure 2, univariable logistic regression was employed to preliminarily screen dietary intake factors that might influence OAB. After adjusting for covariates, the results showed that higher intakes of total energy, carbohydrates, total sugars, total fat, total SFAs, total MUFAs, and cholesterol were all significantly associated with an increased risk of OAB. Subsequently, multivariate regression analyses were performed. After adjusting for covariates, the results showed that higher intakes of total sugars are positively associated with OAB (odds ratio (OR) = 1.32, 95% confidence interval (CI): 1.11–1.56, p = 0.0016). Then, higher PUFAs intakes were correlated with a reduced risk of OAB (OR = 0.79, 95% CI: 0.66–0.96, p = 0.0159), as shown in Figure 3.
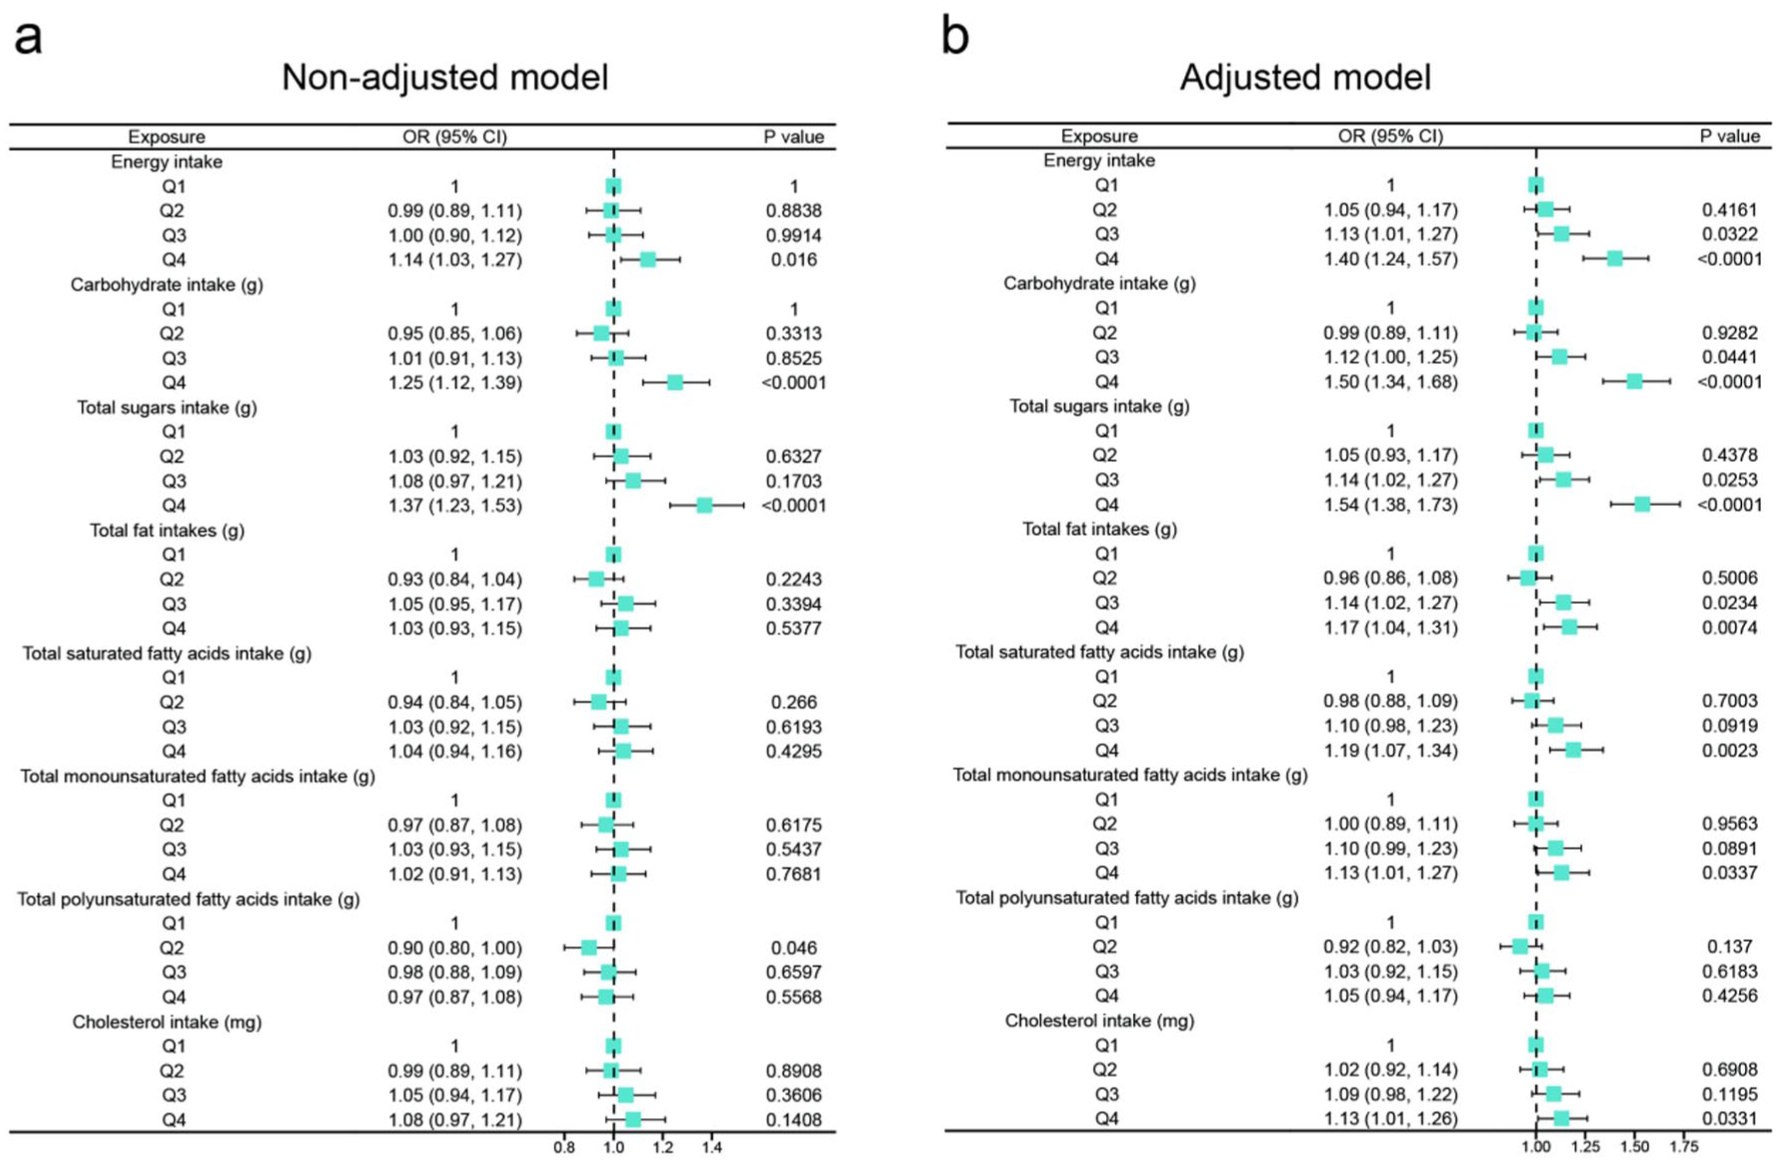
Forest plot shows the results of the univariate analysis of the relationship between dietary intake and OAB. (a) Non-adjusted model adjusted for None. (b) Adjusted model adjusted for gender, age, race, poverty income ratio, education level, marital status, diabetes, cardiovascular disease, cancer, smoking status, and physical activity.
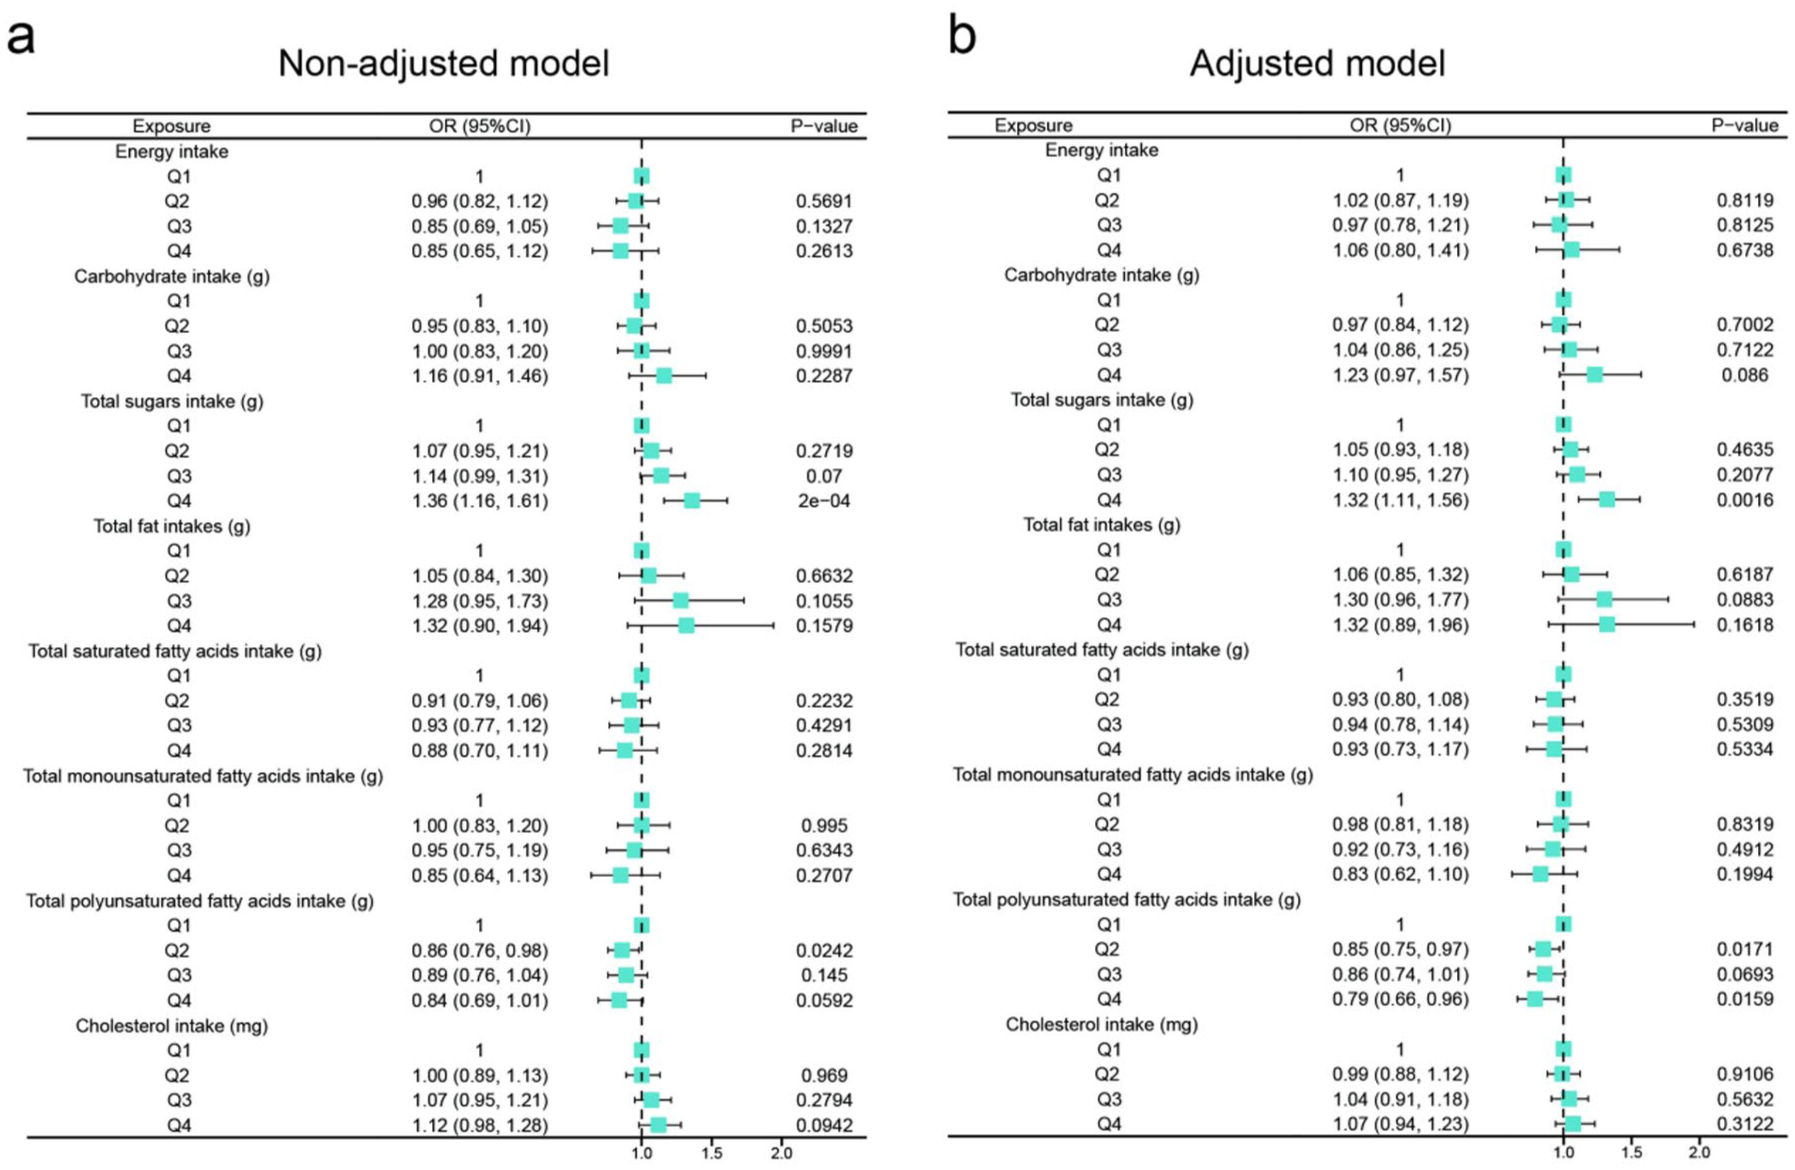
Forest plot shows the results of the multivariate analysis of the relationship between dietary intake and OAB. (a) Non-adjusted model adjusted for None. (b) Adjusted model adjusted for gender, age, race, poverty income ratio, education level, marital status, diabetes, cardiovascular disease, cancer, smoking status, and physical activity.
Association between central obesity replacement indexes and OAB
The positive relationship between central obesity replacement indexes and OAB was confirmed through logistic regression models, as shown in Figure 4. Weight at 4th quartile: Unadjusted OR = 1.65, 95% CI: 1.48–1.84, p < 0.001; Less adjusted OR = 1.76, 95% CI: 1.57–1.98, p < 0.001; Full adjusted OR = 1.86, 95% CI: 1.65–2.10, p < 0.001. BMI at 4th quartile: Unadjusted OR = 1.84, 95% CI: 1.65–2.05, p < 0.001; Less adjusted OR = 1.74, 95% CI: 1.56–1.95, p < 0.001; Full adjusted OR = 1.90, 95% CI: 1.69–2.14, p < 0.001. WC at 4th quartile: Unadjusted OR = 1.88, 95% CI: 1.69–2.10, p < 0.001; Less adjusted OR = 1.83, 95% CI: 1.63–2.04, p < 0.001; Full adjusted OR = 1.91, 95% CI: 1.70–2.15, p < 0.001. WWI at 4th quartile: Unadjusted OR = 1.75, 95% CI: 1.57–1.95, p < 0.001; Less adjusted OR = 1.75, 95% CI: 1.55–1.97, p < 0.001; Full adjusted OR = 1.62, 95% CI: 1.43–1.83, p < 0.001. WHtR at 4th quartile: Unadjusted OR = 2.08, 95% CI: 1.86–2.32, p < 0.001; Less adjusted OR = 1.95, 95% CI: 1.74–2.18, p < 0.001; Full adjusted OR = 2.06, 95% CI: 1.83–2.32, p < 0.001. BRI at 4th quartile: Unadjusted OR = 2.08, 95% CI: 1.86–2.32, p < 0.001; Less adjusted OR = 1.95, 95% CI: 1.74–2.18, p < 0.001; Full adjusted OR = 2.06, 95% CI: 1.83–2.32, p < 0.001.
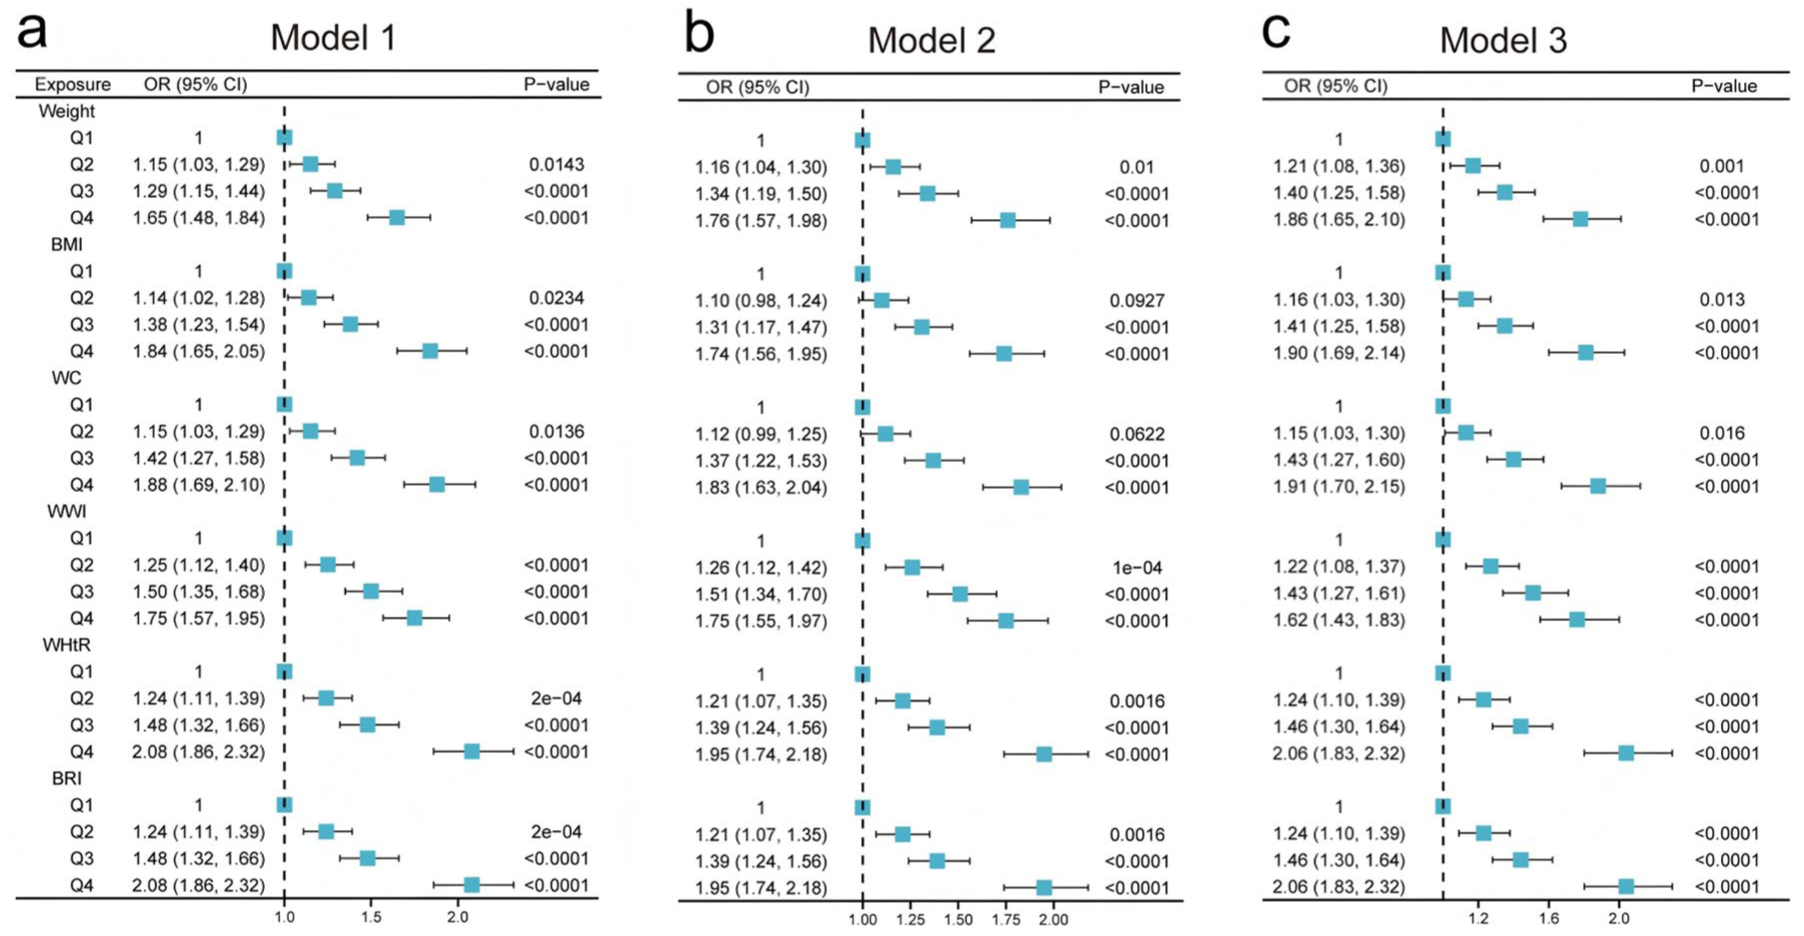
Forest plots show the associations between central obesity replacement indexes and OAB. (a) Model 1: Unadjusted. (b) Model 2 (Less adjusted): gender, age, race, poverty income ratio, education level, and marital status. (c) Model 3 (Fully adjusted): gender, age, race, poverty income ratio, education level, marital status, hypertension, diabetes, cardiovascular disease, cancer, stroke, smoking status, alcohol intake, physical activity, energy intake, carbohydrate intake, total sugar intake, total fat intake, total saturated fatty acids intake, total monounsaturated fatty acids intake, total polyunsaturated fatty acids intake, and cholesterol intake.
Nonlinear associations between central obesity replacement indexes and OAB
We employed a logistic regression model using GAM to assess the relationship between central obesity replacement indexes and the probability of OAB, as shown in Figure 5. By estimating degrees of freedom (Edf) for the smooth terms in Model 1, Model 2, and Model 3, we found that all anthropometric measures showed significant nonlinear associations (all p < 0.05) with varying degrees of complexity: WHtR exhibited the strongest nonlinearity (Edf = 6.16 in Model 1, decreasing to 3.30 in Model 3), followed by BRI (Edf = 3.69–3.20), BMI (Edf = 3.44–2.98), WC (Edf = 3.31–3.17), and weight (Edf = 2.72–3.14), while WWI demonstrated the most near-linear relationships (Edf = 1.04–1.58).
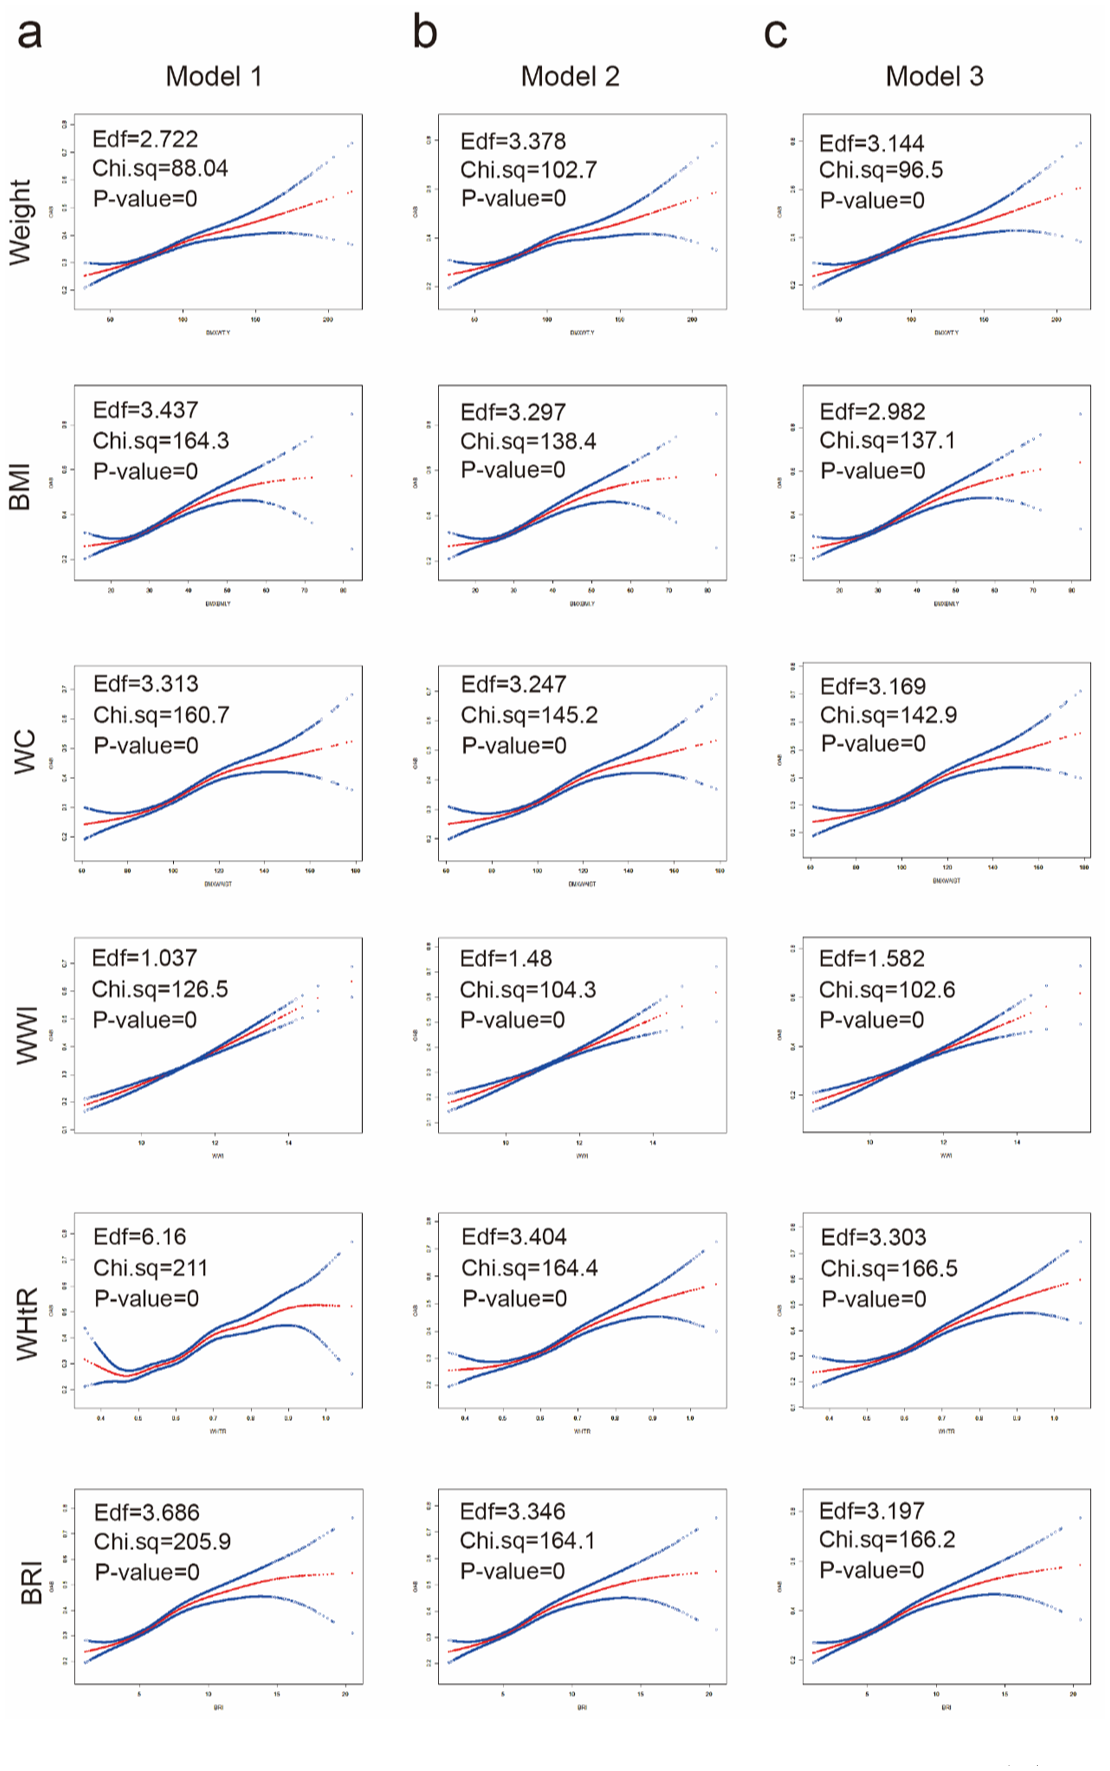
Nonlinear relationship of central obesity replacement indices with OAB. (a) Model 1: Unadjusted. (b) Model 2 (Less adjusted): gender, age, race, poverty income ratio, education level, and marital status. (c) Model 3 (Fully adjusted): gender, age, race, poverty income ratio, education level, marital status, hypertension, diabetes, cardiovascular disease, cancer, smoking status, alcohol intake, physical activity, energy intake, carbohydrate intake, total sugar intake, total fat intake, total saturated fatty acids intake, total monounsaturated fatty acids intake, total polyunsaturated fatty acids intake, and cholesterol intake.
Sensitivity analysis
To exclude the influence of BPH on the association between central obesity and OAB in males, we conducted a sensitivity analysis (Supplemental Table 3). A total of 2544 participants with complete information were included in the analysis. In the unadjusted model, WWI, WHtR, and BRI were significantly positively associated with OAB, with the risk of OAB increasing as these indices increased; all p for trend were <0.001. In Model 2, which adjusted only for BPH, the positive associations between central obesity replacement indexes and OAB remained significant. These findings indicate that our results are robust and that BPH does not substantially affect the relationship between central obesity and OAB in males.
Discussion
Our analysis of U.S. community population data demonstrated that central obesity was significantly associated with OAB. Increased OAB risk was observed with higher levels of body weight, WC, BMI, WWI, WHtR, and BRI. Furthermore, dietary analysis revealed that both excessive sugar consumption and insufficient PUFAs intake were independently associated with an increased risk of OAB.
OAB, a subset of lower urinary tract symptoms (LUTS), is primarily characterized by urinary urgency with or without urge incontinence, 1 which exerts negative impacts on both physical and mental health and reduces the quality of life. OAB has a multifactorial etiology, primarily involving detrusor muscle overactivity and hypersensitivity of bladder sensory nerves. 28 It was noticed that men with metabolic alterations showed faster OAB development and higher BPH surgery rates. 29 Emerging evidence indicates a significant association between impaired glucose metabolism and the development of OAB. Diabetes leads to autonomic bladder neuropathy and dysfunction of bladder smooth muscle.30,31 Additionally, the occurrence of OAB or BPH was positively associated with the number of Metabolic Syndrome components. 32 Obese men have a higher risk of persistent OAB after prostatectomy. 33 And young women with obesity are more likely to have OAB. 12 However, the clinical evidence regarding the association between obesity and OAB remains inconsistent across studies. A study of middle-aged Korean men found that obesity, particularly in those with hypertriglyceridemia, was associated with a lower likelihood of moderate-to-severe LUTS. 34 Another study of middle-aged men in a health screening population similarly suggested that obesity might be associated with reduced OAB. 35 Obesity, especially central obesity, is frequently associated with marked insulin resistance and dyslipidemia disorders, relating to a variety of metabolic disorders and total mortality.36,37 Therefore, this study aimed to analyze the association between central obesity replacement indexes and OAB to elucidate the potential role of central obesity in OAB pathogenesis.
We found that in addition to weight and BMI as measures of overall body weight status, other central obesity replacement indexes—including WC, WWI, WHtR, and BRI—were significantly associated with the occurrence of OAB, in a nonlinear manner. After fully adjusting for covariates, WHtR and BRI demonstrated a stronger association with OAB, both with an adjusted OR of 2.04 (95% CI: 1.80–2.30). Our analysis revealed that WHtR and BRI exhibited significantly better predictive performance compared to WWI, corroborating existing literature. 38 Notably, WC alone demonstrated superior predictive value than WWI. From a biomechanical perspective, WC provides a direct measure of abdominal adiposity along the horizontal axis, while height represents the vertical dimension. This fundamental difference explains why height-adjusted indices (WHtR and BRI) offer greater clinical utility than weight-adjusted measures (WWI). Interestingly, in research on BPH, WC has been proposed as a more clinically pertinent metric. 39 The observed variations in predictive efficacy among studies likely reflect differences in population characteristics and study designs.40 –42 Collectively, all the central obesity replacement indexes significantly predict OAB, supporting their combined use in risk stratification. Encouragingly, existing studies have shown that reducing central obesity may lower the risk of OAB. A study by Hagovska et al. 43 reported that after 12 weeks of exercise, BMI, visceral abdominal fat, WHtR, and WC decreased to varying degrees, accompanied by significant relief of OAB symptoms in patients. Furthermore, several clinical studies have shown that in obese women undergoing sleeve gastrectomy, OAB symptoms improved concurrently with weight loss.44,45 These findings suggest that future prospective studies with broader scopes could explore the potential of targeting central obesity in the treatment of OAB. Notably, these analyses were not adjusted for BMI due to inherent collinearity. The comparatively stronger effects of WHtR and BRI implicate visceral fat distribution, rather than overall adiposity, as the more relevant factor in OAB risk.
The pathophysiological mechanisms linking obesity and OAB require further elucidation. Physiologically, central obesity increases abdominal pressure, which directly bladder pressure and urethral mobility. 46 Obesity exerts chronic mechanical stress on pelvic floor components, potentially leading to muscular hypotonia, neuropathic changes, and structural laxity. 47 Additionally, obesity may exacerbate age-related urinary incontinence by accelerating degenerative changes. 48 Mechanistically, leptin secreted by white adipose tissue facilitates the sympathetic nerves. 49 Excessive adipose load may impair bladder neuromuscular function by affecting mitochondrial respiration-mediated H2O2 emission. 50 Moreover, obesity may disrupt electrophysiological homeostasis, consequently altering the excitability and contractility of detrusor smooth muscle.51,52 While chronic inflammation, impairment of the antioxidative and nitrosative stress system mediated by obesity may also impair bladder function.53,54 Therefore, additional studies are needed to elucidate the precise mechanisms through which obesity influences OAB.
After verifying the correlation between central obesity and OAB, we further assessed if dietary components might play a causal role, intending to explore their association with OAB. After adjusting for gender, age, race, poverty income ratio, education level, marital status, diabetes, CVD, cancer, smoking status, and physical activity, the results of the multivariate analysis showed that higher dietary sugar consumption correlated with increased OAB risk (OR = 1.32, p = 0.0016), whereas greater PUFAs intake was protective (OR = 0.79, p = 0.0159).
The pathophysiology of hyperglycemia or diabetes-associated bladder dysfunction is multifactorial, relating to an alteration in the physiology of the detrusor smooth muscle cells, bladder innervation, extracellular matrix, or urothelial dysfunction.31,55 It promotes a pro-inflammatory state, characterized by upregulation of systemic inflammatory markers and elevated circulating inflammatory mediators,13,56 showing lower expression of urothelial adhesion and higher urothelial inflammation. 57 Current research consistently acknowledges the significant impact of blood glucose levels on OAB.8,13,55 Therefore, reducing carbohydrate intake may reduce the risk of OAB.
However, epidemiological evidence regarding the association between dietary lipid consumption and OAB remains limited. Dietary lipids primarily exist as triglycerides, consisting of a glycerol backbone esterified with SFAs, MUFAs, PUFA, along with minor components including sterols and other kinds of lipids. Stearic acid and palmitic acid, the two most abundant SFAs, upregulate cyclooxygenase-2 expression in prostate epithelial cells through TLR4/NF-κB signaling pathway activation, thereby promoting chronic inflammatory responses. 58 Additionally, previous in vitro investigations have established that palmitic acid compromises viability and contractile function in cultured human detrusor smooth muscle cells. 59 This lipotoxic effect is mediated through suppression of mitochondrial enzyme activity and impairment of antioxidant defenses, mechanistically involving dysregulation of the JAK2/STAT3/PI3K-AKT signaling axis. 59 Previous serum metabolomics studies have identified a positive association between fatty acids (22:1), erucic acid, and palmitoleic acid (all were MUFAs) and OAB; while gondoic acid (MUFA) and linoleic acid (PUFA) were protective for OAB in males. 60 No significant associations were observed between SFAs/MUFAs and OAB in our study, warranting larger-scale investigations to clarify these relationships.
PUFAs are categorized into ω-3 and ω-6 fatty acids according to the position of the first unsaturated bond. 22 Multiple randomized controlled trials have established that ω-3 fatty acids mediate early cardiovascular protection through anti-inflammatory and lipid-modifying pathways.21,61 Elevated PUFAs consumption showed a significant inverse association with OAB incidence in our cohort, though ω-3/ω-6 ratios were not assessed. Higher ω-6/ω-3 ratios were found to promote cardiovascular, neoplastic, osteoporotic, and autoimmune pathologies, while higher ω-3 PUFA levels exert protective effects. 62 Excessive intake of ω-6 fatty acids has been demonstrated to promote inflammatory responses. 63 ω-3 fatty acids exhibit multifaceted biological effects, including anti-inflammatory and antioxidant properties, maintenance of cell membrane homeostasis, reduction of insulin resistance, and improvement of energy metabolism. 64 Therefore, we propose that higher intake levels of PUFAs, particularly ω-3 fatty acids, may provide partial prevention against the development of OAB.
Strengths and limitations
Our study has several notable strengths. First, we conducted an in-depth analysis of the relationship between central obesity indices, dietary intake of fatty acids, and OAB using a large population-based dataset, and to the best of our knowledge, few studies of this kind currently exist. Second, we found that central obesity indices were positively associated with OAB risk, and dietary analysis further revealed that excessive sugar intake and insufficient PUFA intake were also positively associated with OAB risk. These findings provide new insights into the comprehensive understanding of the relationship among obesity, metabolism, and OAB, while also offering feasible preventive strategies from a dietary perspective. However, several limitations should be acknowledged. Due to the cross-sectional design, causal relationships cannot be established. In addition, the assessment of OAB relied on patient self-reported symptoms, which may introduce bias. Moreover, the study population consisted of American individuals, and thus the findings may not be generalizable to other countries. Additionally, no a priori sample size calculation was performed, as we included all eligible participants from the NHANES database. Nevertheless, the relatively large sample size derived from multiple NHANES cycles likely provided adequate power to detect clinically meaningful associations, although the possibility of insufficient power to detect small effect sizes cannot be completely ruled out. Future studies with larger sample sizes, more comprehensive indicators, and more rigorous designs are needed to validate our conclusions.
Conclusion
In conclusion, central obesity is significantly associated with an increased risk of OAB. Higher values of body weight, WC, BMI, WWI, WHtR, and BRI demonstrated a progressive elevation in OAB risk. These findings suggest that body shape management, particularly abdominal fat reduction, may help mitigate OAB risk. Furthermore, dietary modifications involving reduced sugar intake and increased consumption of PUFAs, especially ω-3 fatty acids, could provide additional protective benefits. The current study not only offers novel insights into weight management and dietary adjustments for OAB prevention in high-risk populations but also establishes an evidence-based foundation for developing targeted nutritional interventions and informs future longitudinal research investigating causal relationships between dietary fatty acid profiles, obesity-related indices, and OAB pathogenesis.
Supplemental Material
sj-docx-1-tae-10.1177_20420188261461860 – Supplemental material for Association between dietary intake of fatty acids, central obesity, and OAB: insights from a prospective cohort for weight management and dietary prevention
Supplemental material, sj-docx-1-tae-10.1177_20420188261461860 for Association between dietary intake of fatty acids, central obesity, and OAB: insights from a prospective cohort for weight management and dietary prevention by Bo Chen, Jialu Wu, Jinbao Wang, Jie Chen, Jinze Li, Qiyou Wu, Zhe Yan, Liangren Liu and Hui Huang in Therapeutic Advances in Endocrinology and Metabolism
Supplemental Material
sj-docx-2-tae-10.1177_20420188261461860 – Supplemental material for Association between dietary intake of fatty acids, central obesity, and OAB: insights from a prospective cohort for weight management and dietary prevention
Supplemental material, sj-docx-2-tae-10.1177_20420188261461860 for Association between dietary intake of fatty acids, central obesity, and OAB: insights from a prospective cohort for weight management and dietary prevention by Bo Chen, Jialu Wu, Jinbao Wang, Jie Chen, Jinze Li, Qiyou Wu, Zhe Yan, Liangren Liu and Hui Huang in Therapeutic Advances in Endocrinology and Metabolism
Footnotes

References
Supplementary Material
Please find the following supplemental material available below.
For Open Access articles published under a Creative Commons License, all supplemental material carries the same license as the article it is associated with.
For non-Open Access articles published, all supplemental material carries a non-exclusive license, and permission requests for re-use of supplemental material or any part of supplemental material shall be sent directly to the copyright owner as specified in the copyright notice associated with the article.
