
Abstract
Background:
Warfarin and selective serotonin reuptake inhibitors (SSRIs) are frequently co-prescribed in clinical practice, particularly among elderly patients with comorbid cardiovascular and psychiatric conditions. Although theoretical pharmacological mechanisms suggest an increased bleeding risk from their concurrent use, real-world evidence remains conflicting.
Objectives:
To comprehensively evaluate drug-drug interaction signals for bleeding events and international normalized ratio (INR) elevation associated with warfarin-SSRI combinations using large-scale pharmacovigilance databases from different healthcare systems (FDA Adverse Event Reporting System (FAERS) and Canada Vigilance Adverse Reaction Database (CVARD)).
Design:
A retrospective pharmacovigilance study.
Methods:
Adverse event reports from the FAERS (2004–2025) and the CVARD (1965–2025) were systematically analysed. Six warfarin-SSRI combinations were examined. Disproportionality and network analyses were utilized to characterize adverse event profiles. Multiple complementary signal detection algorithms were employed for interaction assessment, including the Omega shrinkage model, Additive Model, Multiplicative Model, and combination risk ratio (CRR) model, further supported by sensitivity analyses.
Results:
Disproportionality analysis revealed that the SSRIs&Warfarin group exhibited a significantly higher reporting odds ratio for international normalized ratio increased compared to the Warfarin-single group. However, regarding interaction signals, in the FAERS database, five of the six warfarin-SSRI combinations demonstrated consistent negative Ω values for bleeding events (range: −1.04 to −0.75), indicating no synergistic interaction. While the warfarin-fluvoxamine combination showed isolated positive signals in secondary models, the primary Ω shrinkage measure remained statistically nonsignificant (95% CI: encompassed zero). Results for international normalized ratio increased largely paralleled these findings. Network analysis confirmed a safety profile predominantly shaped by warfarin-associated risks rather than a synergistic amplification. The CVARD database corroborated these patterns with regional variations.
Conclusion:
Contrary to theoretical pharmacological expectations, this large-scale, cross-database pharmacovigilance analysis failed to detect positive safety signals for bleeding events or INR elevation associated with warfarin-SSRI combinations. Clinical vigilance and individualized risk assessment remain warranted, but routine combinations do not show synergistic bleeding risks at the population level.
Trial registration:
This study is a real-world pharmacovigilance investigation based on publicly accessible databases. As such, it does not involve a formal clinical trial, and therefore, no clinical trial registration number is applicable.
Plain language summary
Warfarin is a widely used blood thinner that prevents dangerous clots in patients with heart conditions. Selective serotonin reuptake inhibitors (SSRIs) are common antidepressants prescribed for depression and anxiety. Many patients, especially older adults, need both medications together. Based on how these drugs work in the body, doctors have worried that combining them might increase bleeding risk. This study analyzed over 900,000 reports from the US FDA adverse event database (2004–2025) and over 57,000 reports from the Canadian database (1990–2025). We used advanced statistical methods to detect whether combining warfarin with any of six SSRIs (escitalopram, citalopram, sertraline, paroxetine, fluvoxamine, or fluoxetine) increased reports of bleeding or elevated INR (a measure of blood thinning). Contrary to theoretical concerns, we found no consistent evidence that combining warfarin with SSRIs increases bleeding risk. Most combinations actually showed negative signals, meaning fewer bleeding reports than expected. When patients took both medications, their side effect profile closely resembled that of warfarin alone—not a combination of warfarin and SSRI effects. These findings were consistent across both US and Canadian databases. This suggests that real-world clinical practices—such as regular INR monitoring, careful dose adjustments, and heightened doctor awareness—may effectively manage any potential risks. However, this population-level finding does not mean individual patients face no risk. Doctors should still monitor patients starting or changing these medications, particularly those with additional risk factors like kidney problems or advanced age. This research provides reassuring evidence that necessary antidepressant treatment should not be withheld from patients taking warfarin due to bleeding concerns, while emphasizing that appropriate monitoring remains essential.
Keywords
Introduction
Warfarin remains one of the most widely prescribed oral anticoagulants for thromboembolic disorders, 1 while selective serotonin reuptake inhibitors (SSRIs) represent first-line therapy for depression and anxiety. 2 The concurrent use of these medications is common in clinical practice, particularly among elderly patients with comorbid cardiovascular and psychiatric conditions.3,4 Theoretical concerns exist regarding potential bleeding risk through drug-drug interactions (DDIs), yet clinical evidence has been inconsistent. 5
Large-scale pharmacovigilance databases, such as the FDA Adverse Event Reporting System (FAERS) and the Canada Vigilance Adverse Reaction Database (CVARD), provide valuable real-world data for evaluating drug safety signals.6,7 Advanced signal detection algorithms, including the Omega shrinkage model and combination risk ratio model, enable robust assessment of DDIs beyond traditional disproportionality analysis.8,9
This study systematically evaluated DDI signals for bleeding events and international normalized ratio (INR) elevation associated with six warfarin-SSRI combinations using data from both FAERS and CVARD databases. By employing multiple signal detection algorithms and comparing findings across different healthcare systems, this analysis aims to provide evidence-based insights for clinical decision-making regarding the safety of warfarin-SSRI co-prescription.
Methods
Data sources and acquisition
This retrospective pharmacovigilance study utilized large-scale real-world data from two distinct spontaneous reporting systems (SRS) to ensure cross-population validity: FAERS and the CVARD database. The reporting periods covered January 2004 to December 2025 for FAERS and 1965 to September 2025 for CVARD. These windows were specifically chosen based on database characteristics: the CVARD database was established in 1965, providing the earliest available records for Canadian pharmacovigilance, while the FAERS database has publicly released quarterly data since 2004. Although the CVARD database extends back to 1965, the SSRI-related reports accumulated after their respective market approvals in the late 1980s and early 1990s. Therefore, the selected periods capture the full longitudinal range of available post-marketing data for the six target SSRIs in each region, ensuring comprehensive and comparable analysis across the two databases. Prior to signal detection analyses, a rigorous data cleaning and normalization procedure was implemented; specifically, free-text drug names and regional generic variants were standardized by mapping them to the RxNorm controlled vocabulary to resolve synonym ambiguity and ensure accurate exposure classification.
To capture a comprehensive safety profile and avoid inadvertently discarding complex interaction signals, all reports involving patients receiving warfarin and SSRIs were included in the analysis, regardless of the drug’s role assignment. Specifically, reports were retained whether the drugs were categorized as Primary Suspect (‘PS’), Secondary Suspect (‘SS’), Concomitant (‘C’) or Interacting (‘I’). 10 This inclusive approach is particularly crucial for evaluating DDIs, as interacting medications are frequently coded as ‘concomitant’ or ‘interacting’ rather than the ‘primary suspect’ by reporters. Restricting the analysis solely to primary suspect drugs would introduce significant selection bias and critically reduce the sensitivity of DDI signal detection.
Adverse events were defined using Preferred Terms (PTs) and Standardised MedDRA Queries (SMQs; MedDRA version 28.0). 11 Bleeding events were identified using the narrow SMQ for Haemorrhage (SMQ code: 20000038), which is specifically designed to capture reports of bleeding. The primary outcome indicative of enhanced anticoagulation was identified using the PT ‘International normalized ratio increased’ (PT code: 10022595). 12 Furthermore, for predefined secondary sensitivity analyses, an additional clinical term, ‘Prothrombin time prolonged’ (PT code: 10037104), as well as a composite endpoint combining ‘International normalized ratio increased’ and ‘Prothrombin time prolonged’, were established. 13 The reporting of this study conforms to the Strengthening the Reporting of Observational Studies in Epidemiology (STROBE) statement. 14
Data retrieval and cohort characteristics
The data retrieval and cohort stratification process is illustrated in Figure 1. First, a deduplication process was implemented following FDA recommendations, retaining only the most recent and complete report for cases with multiple submissions based on CASEID and FDA_DT. Subsequently, prior to cohort assignment, reports completely lacking any target drug exposure were systematically excluded. After applying inclusion criteria based on the target drugs designation, three mutually exclusive study cohorts were established. In FAERS, the Warfarin-single group comprised 201,864 reports, the SSRIs-single group comprised 689,743 reports, and the SSRIs&Warfarin group comprised 18,141 reports. In CVARD, the corresponding figures were 14,256, 42,372 and 1063 reports, respectively.
Flowchart of study.
Cohort stratification and drug combinations
Based on the exposure patterns identified in the processed data, the study population was stratified into three mutually exclusive cohorts to facilitate comparative analysis. The Warfarin-single group included patients exposed to warfarin without concurrent SSRI usage, while the SSRIs-single group consisted of patients exposed to any of the six target SSRIs without warfarin. The SSRIs&Warfarin comprised patients with concomitant exposure to warfarin and at least one of the targeted SSRIs. The evaluation encompassed all six currently marketed SSRIs: escitalopram, citalopram, sertraline, paroxetine, fluvoxamine and fluoxetine. To ensure baseline comparability and enable a comprehensive safety assessment, demographic characteristics, including age, sex and reporting year, were systematically extracted for each group. To maintain the integrity of the real-world dataset and avoid artificial bias introduced by imputation methods, missing demographic data were neither imputed nor excluded from the denominators; instead, they were categorized and analysed as a distinct ‘Missing’ group. Furthermore, clinical outcomes were classified according to FDA serious criteria, covering events such as hospitalization, life-threatening conditions and death.
Statistical analysis and signal detection
Statistical analyses were performed using Python 3.10.12 (Python Software Foundation, Wilmington, DE, USA), utilizing the pandas library for large-scale data manipulation, numpy for numerical matrix computations and scipy for statistical testing and modelling.
First, individual drug-event associations were assessed using four disproportionality algorithms based on 2 × 2 contingency tables (Table S4): reporting odds ratio (ROR), proportional reporting ratio (PRR), Bayesian confidence propagation neural network (BCPNN) and multi-item gamma Poisson shrinker (MGPS). A positive safety signal was defined by specific thresholds: ROR (lower 95% confidence interval (CI): >1, N ⩾ 3), PRR (PRR ⩾2, χ² ⩾ 4, N ⩾ 3), BCPNN (IC025 >0) and MGPS (EBGM05 >2), as detailed in Table S5.
To characterize and compare the overall safety profiles across the cohorts, the top 30 most frequently reported PTs for each group were identified. A network analysis was constructed to visualize the overlapping adverse events among the three groups. Furthermore, to quantify between-cohort differences, direct statistical comparisons of ROR values (using 95% CIs and p values) for shared top PTs were conducted between the SSRIs&Warfarin group and the Warfarin-single group.
Second, DDIs were evaluated using 4 × 2 contingency tables (Table S6) and four specialized models: the Ω Shrinkage Measure, Additive Model, Multiplicative Model and Combination Risk Ratio Model. To robustly define a positive synergistic interaction and minimize false positives, the Ω Shrinkage Measure was designated as the primary confirmatory standard; a positive interaction was determined if the lower bound of the 95% CI for Ω was greater than zero. The Additive, Multiplicative and CRR Models served as complementary exploratory analyses. Finally, to ensure the robustness of the primary findings for INR increased, predefined sensitivity analyses applied the four interaction models to the secondary PT ‘Prothrombin time prolonged’ and a composite endpoint combining INR elevation with prothrombin time prolongation. Detailed mathematical formulas and signal detection criteria for these interaction models are provided in Table S7.
Results
Basic characteristics of the study population
This study included reports from FAERS and CVARD, classified into Warfarin-single, SSRIs-single and combination groups. Reports spanning from 2004 to 2025 (FAERS) and 1965 to 2025 (CVARD) were included. Consistent across both databases, the SSRIs-single group comprised the largest population, followed by the Warfarin-single and combination groups. Demographic analysis revealed significant heterogeneity. The SSRIs-single population was notably younger, concentrated in the 18–59 age range, whereas the Warfarin-single and combination groups were predominantly geriatric, peaking at 60–74 years. Females represented the majority in the SSRIs-single and combination groups (FAERS: 63.01% and 57.96%; CVARD: 68.34% and 59.74%, respectively), while the Warfarin-single group showed a more balanced gender distribution. Regarding outcomes, although hospitalization was frequent, the SSRIs&Warfarin group exhibited the highest mortality rates (11.12% in FAERS; 10.72% in CVARD) compared to either monotherapy group, indicating a potential elevated risk associated with concomitant use (Table 1; Table S1; Figure 2).
Baseline demographic and clinical characteristics of the study cohorts in the FAERS database (2004–2025).

Hospitalization includes initial hospitalization or prolonged hospitalization. Required intervention refers to the intervention to prevent permanent impairment or damage. Percentages may not sum to 100% due to missing data and rounding.
FAERS, FDA Adverse Event Reporting System; SSRI, selective serotonin reuptake inhibitor.

Demographic characteristics of patients. (a) The demographic distribution of patients across various age brackets; (b) The gender breakdown; (c) The distribution over reporting years; (d) Outcome of case reporters.
Adverse event spectrum and frequency distribution
Analysis of the top 30 adverse events (AEs) revealed distinct safety profiles across all three groups in both databases (Table 2; Tables S2 and S3; Figure 3). In FAERS, the Warfarin-single group predominantly showed anticoagulation-related and haemorrhagic events, including international normalized ratio increased (n = 15,634, ROR = 88.04), gastrointestinal haemorrhage (n = 5341, ROR = 4.90), epistaxis (n = 4074, ROR = 4.20) and cerebral haemorrhage (n = 2233, ROR = 4.84), alongside cardiovascular events such as atrial fibrillation (n = 6,034, ROR = 4.83), pulmonary embolism (n = 3245, ROR = 2.56), deep vein thrombosis (n = 3037, ROR = 3.52) and congestive cardiac failure (n = 4062, ROR = 3.75). The SSRIs-single group exhibited predominantly psychiatric and neurological events: anxiety (n = 31,198, ROR = 2.35), depression (n = 28,902, ROR = 2.76), suicidal ideation (n = 16,590, ROR = 4.25) and serotonin syndrome (n = 9126, ROR = 18.62). The SSRIs&Warfarin group demonstrated a hybrid pattern dominated by international normalized ratio increased (n = 1219, ROR = 22.28), cardiovascular complications (atrial fibrillation: n = 693, ROR = 3.67; congestive cardiac failure: n = 641, ROR = 3.99; pulmonary embolism: n = 556, ROR = 2.99; deep vein thrombosis: n = 521, ROR = 4.08), renal dysfunction (renal failure: n = 727, ROR = 2.77) and persistent haemorrhagic events (gastrointestinal haemorrhage: n = 423, ROR = 2.55; rectal haemorrhage: n = 341, ROR = 4.08).
Top 30 frequency of AEs in the FAERS.
AE, adverse event; EBGM, empirical Bayes geometric mean; FAERS, FDA Adverse Event Reporting System; IC, information component; PRR, proportional reporting ratio; ROR, reporting odds ratio; SSRI, selective serotonin reuptake inhibitor.
Network graph of the top 30 reported AEs for the three groups. (a) Network graph for the FAERS database; (b) Network graph for the CVARD database.
The CVARD database largely corroborated these patterns. Similarly, the Warfarin-single group showed prominent anticoagulation and haemorrhagic signals: international normalized ratio increased (n = 826, ROR = 88.78), gastrointestinal haemorrhage (n = 446, ROR = 6.39) and epistaxis (n = 266, ROR = 4.05), as well as cardiovascular events including pulmonary embolism (n = 408, ROR = 5.39), deep vein thrombosis (n = 381, ROR = 10.44) and congestive cardiac failure (n = 191, ROR = 4.72). The SSRIs-single group maintained a consistent psychiatric profile: anxiety (n = 2155, ROR = 2.52), depression (n = 1,855, ROR = 3.22) and serotonin syndrome (n = 411, ROR = 16.30). The SSRIs&Warfarin group likewise exhibited international normalized ratio increased (n = 64, ROR = 32.24) as the dominant signal, alongside cardiovascular events – pulmonary embolism (n = 53, ROR = 6.63), deep vein thrombosis (n = 32, ROR = 7.78) and congestive cardiac failure (n = 31, ROR = 7.33) – and haemorrhagic events (rectal haemorrhage: n = 27, ROR = 4.20), consistent with FAERS findings. These cross-database consistencies reinforce the reliability of our results. Notably, some regional differences were observed: the CVARD SSRIs&Warfarin group did not feature renal failure prominently among the top 30 PTs, and unique PTs such as confusional state (n = 50, ROR = 2.94) and nightmare (n = 19, ROR = 6.33) appeared in CVARD but not in the FAERS top 30 list, likely reflecting regional prescribing practices and population differences.
The network analysis (Figure 3) visualizes the top 30 PTs for each cohort to elucidate the overlap in safety profiles. Nodes representing specific AEs are linked to the study groups. A connection between an AE node and a group node indicates that the AE occurred in that group. If an AE node is connected to multiple group nodes, it indicates that the AE was observed across those groups. Notably, in the top 30 PTs, the SSRIs&Warfarin group shared overlapping PTs with the Warfarin-single group – including haemorrhagic events (e.g. gastrointestinal haemorrhage, rectal haemorrhage) and cardiovascular-renal events (e.g. atrial fibrillation, pulmonary embolism, renal failure) – while no shared top 30 PTs were identified between the SSRIs&Warfarin group and the SSRIs-single group. This pattern confirms that the SSRIs&Warfarin group’s safety profile is predominantly shaped by warfarin-associated risks rather than a synergistic amplification, effectively representing an extension of the Warfarin-single profile with additional intersectional complexity.
To further quantify the between-cohort differences in signal strength for shared AEs, we conducted a direct statistical comparison of ROR values with 95% CIs between the SSRIs&Warfarin group and the Warfarin-single group at the PT level. Among the top 30 most frequently reported PTs in the SSRIs&Warfarin group, 14 PTs were shared with the Warfarin-single group in FAERS, and 9 PTs were shared in CVARD; no overlapping PTs were identified between the SSRIs&Warfarin group and the SSRIs-single group in either database. The comparative ROR analyses are presented in Table 3 (FAERS) and Table 4 (CVARD).
Between-cohort comparison of ROR (95% CI) for shared top 30 adverse events between the SSRIs&Warfarin group and the Warfarin-single group in the FAERS database.
This table presents the 14 PTs shared by the SSRIs&Warfarin group and the Warfarin-single group among the top 30 most frequent adverse drug reactions in the SSRIs&Warfarin group. No overlapping PTs were identified between the SSRIs& Warfarin group and the SSRIs-single group among the top 30 adverse drug reactions of the SSRIs&Warfarin group.
FAERS, FDA Adverse Event Reporting System; PT, Preferred Terms; ROR, reporting odds ratio; SSRI, selective serotonin reuptake inhibitor.
Between-cohort comparison of ROR (95% CI) for shared top 30 adverse events between the SSRIs&Warfarin group and the Warfarin-single group in the CVARD database.
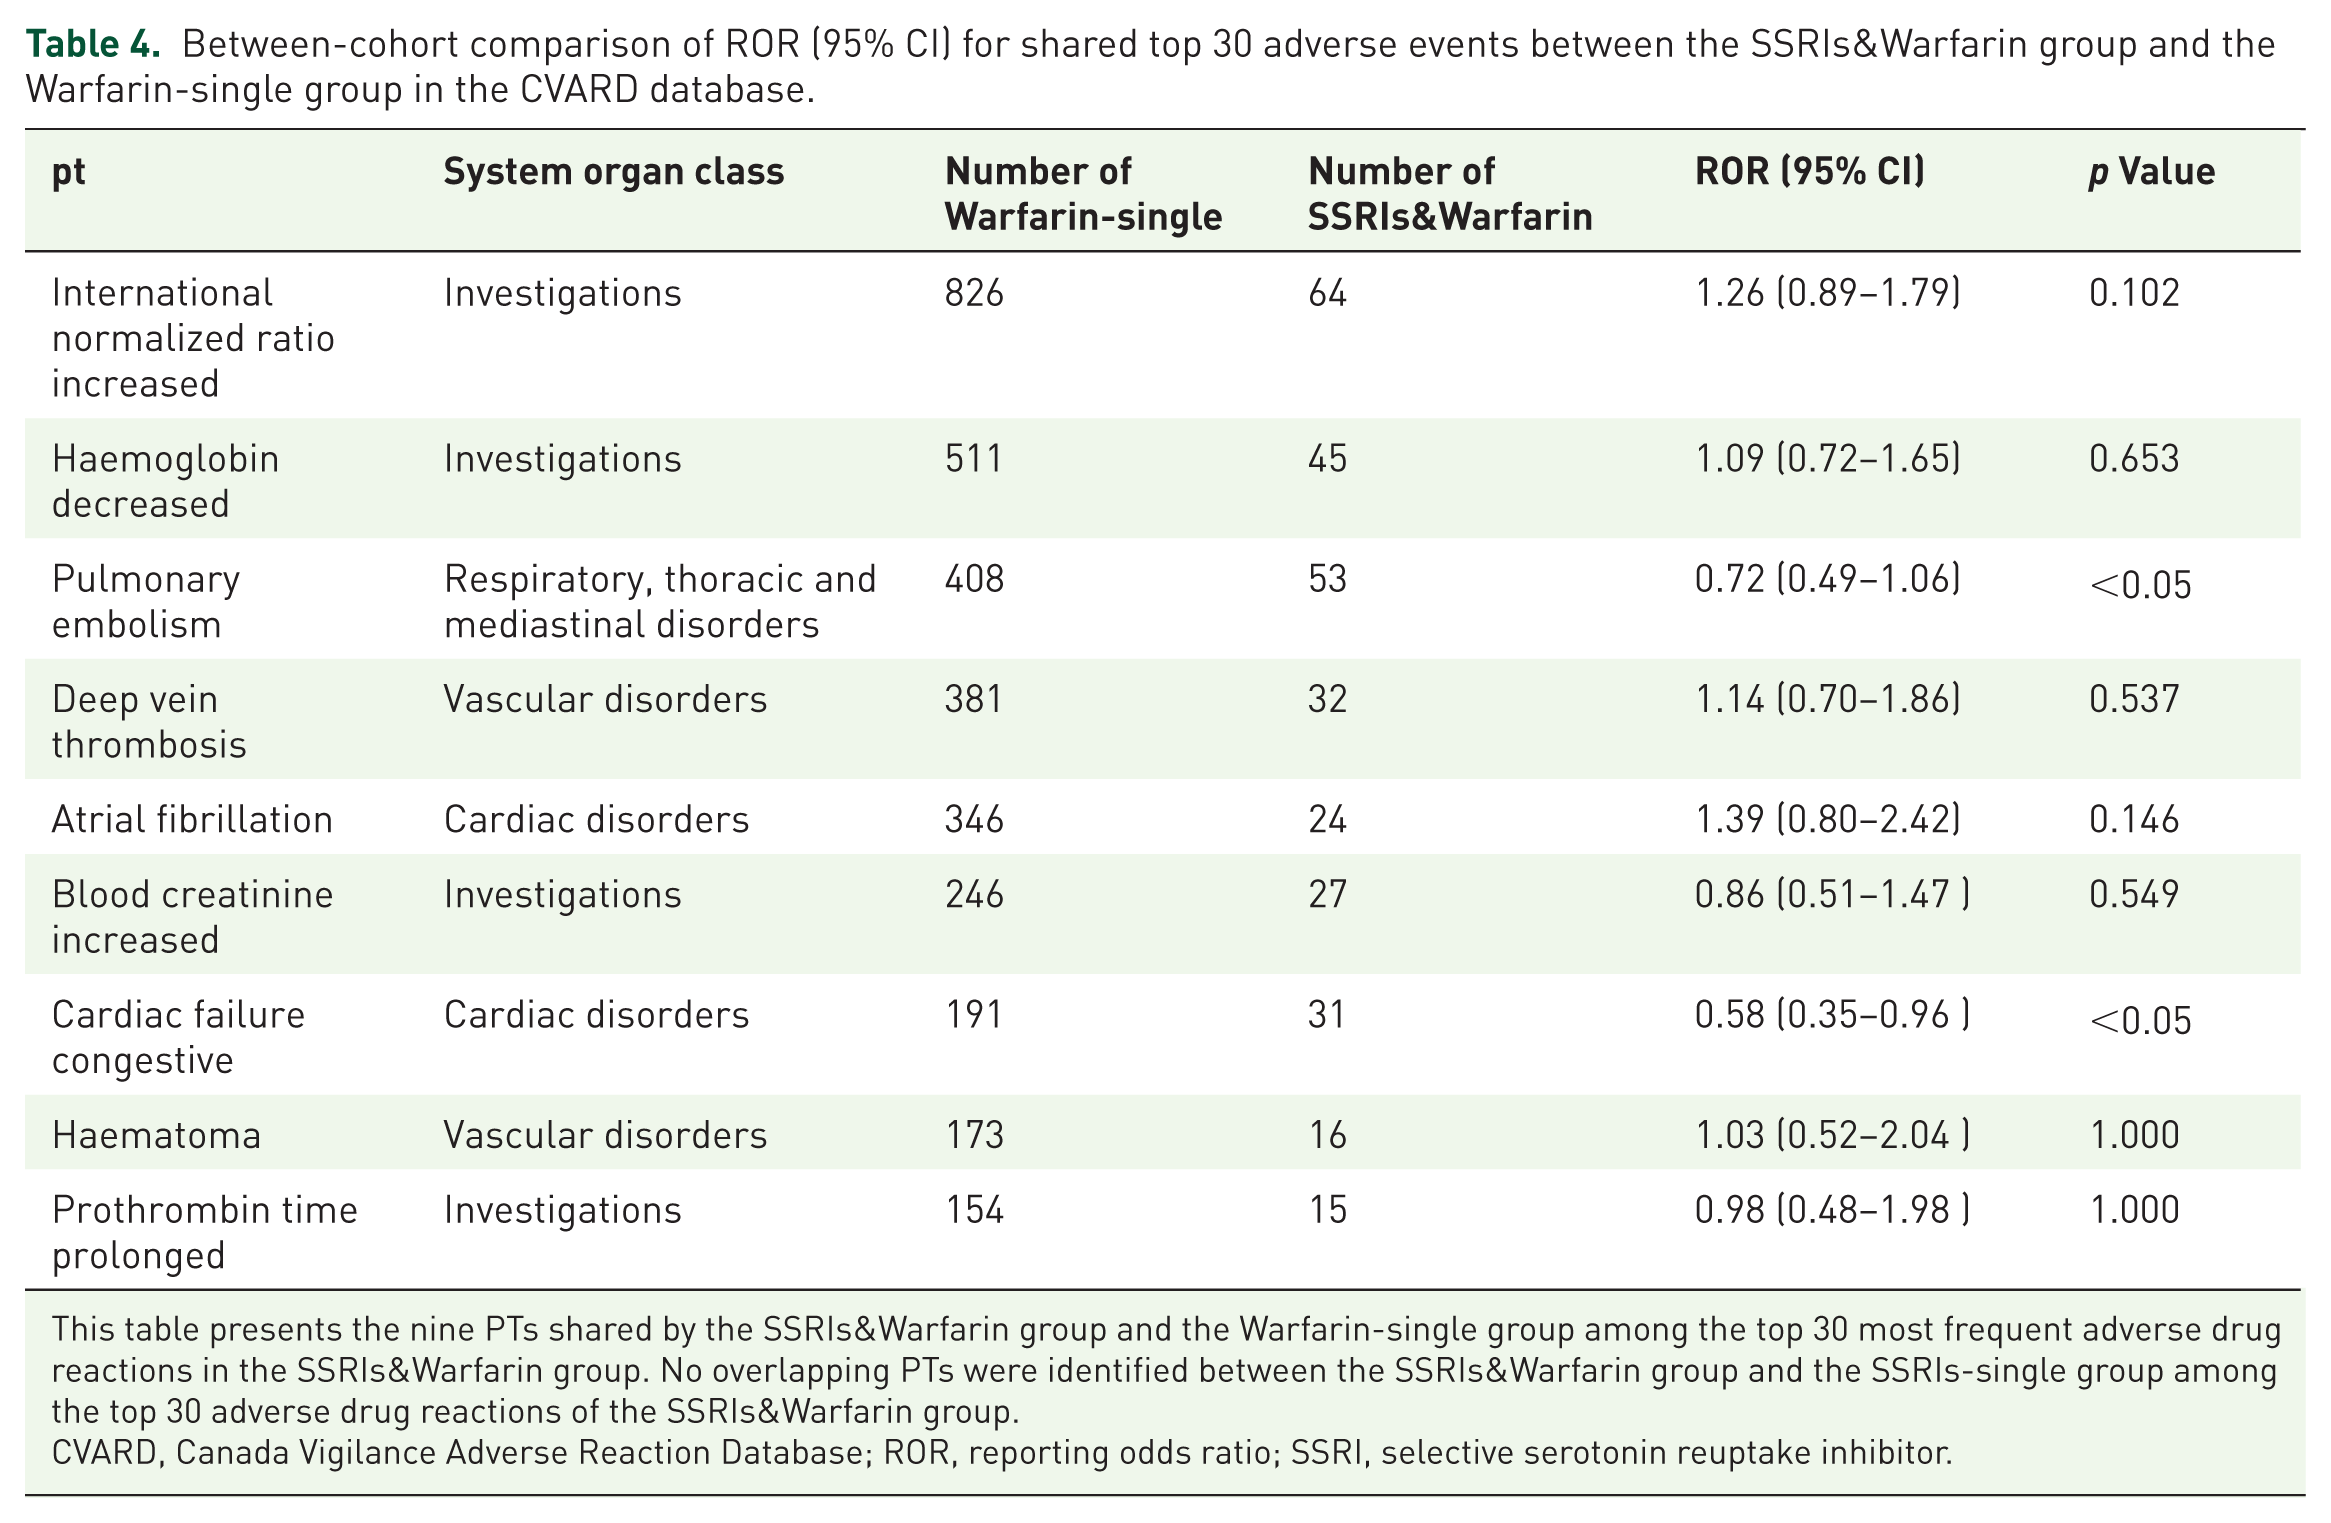
This table presents the nine PTs shared by the SSRIs&Warfarin group and the Warfarin-single group among the top 30 most frequent adverse drug reactions in the SSRIs&Warfarin group. No overlapping PTs were identified between the SSRIs&Warfarin group and the SSRIs-single group among the top 30 adverse drug reactions of the SSRIs&Warfarin group.
CVARD, Canada Vigilance Adverse Reaction Database; ROR, reporting odds ratio; SSRI, selective serotonin reuptake inhibitor.
In FAERS, the SSRIs&Warfarin group demonstrated significantly elevated ROR for ‘International normalized ratio increased’ compared to the Warfarin-single group (ROR = 1.56, 95% CI: 1.44–1.70; p < 0.001), as well as for haematuria (ROR = 1.45, 95% CI: 1.19–1.77; p < 0.001) and cerebral haemorrhage (ROR = 1.44, 95% CI: 1.17–1.78; p < 0.001), suggesting a modestly augmented anticoagulation and select haemorrhagic reporting signal in the combination group. Crucially, while this elevated ROR indicates a higher proportional reporting burden when these drugs are co-prescribed, it does not inherently prove a synergistic DDI. Formal interaction modelling (detailed in Section ‘Signal detection for bleeding events and INR elevation’) is strictly required to differentiate cumulative safety burdens from true pharmacological synergy. Conversely, several cardiovascular and thromboembolic PTs – including pulmonary embolism (ROR = 0.62, 95% CI: 0.55–0.70; p < 0.001), deep vein thrombosis (ROR = 0.62, 95% CI: 0.55–0.71; p < 0.001) and congestive cardiac failure (ROR = 0.67, 95% CI: 0.60–0.76; p < 0.001) – showed significantly lower ROR in the SSRIs&Warfarin group relative to the Warfarin-single group. In CVARD, the overall directional pattern was broadly consistent (e.g. ROR >1 for international normalized ratio increased), though most between-group differences did not reach statistical significance.
Adverse event profiles of individual SSRIs in combination therapy
To characterize the reporting patterns of individual SSRIs within the combination therapy cohort, we analysed the frequency distribution of reports for specific SSRI agents (Figure 4). Heterogeneity was observed in the reporting frequencies of different SSRIs across the two databases.

Frequency distribution of adverse event reports for individual SSRI agents within the SSRIs&Warfarin group. (a) Distribution in the FAERS database; (b) Distribution in the CVARD database.
In the FAERS database, citalopram exhibited the highest reporting frequency, closely followed by sertraline. Escitalopram ranked third, while fluoxetine (n = 2751) and paroxetine showed moderate reporting rates. Fluvoxamine had the lowest number of reports. In contrast, while citalopram remained the most frequently reported agent in the CVARD database, the ranking of other SSRIs differed. Paroxetine and sertraline followed with nearly identical frequencies. Notably, escitalopram, which was prominent in FAERS, ranked lower in CVARD, falling behind fluoxetine. Similar to FAERS, fluvoxamine consistently showed the lowest reporting frequency.
The observed heterogeneity in SSRI reporting frequencies between the two databases likely reflects regional differences in prescribing practices and drug approval timelines rather than systematic bias, and is consistent with known variations in psychotropic drug utilization patterns across different healthcare systems.
Signal detection for bleeding events and INR elevation
The Ω Shrinkage Measure Model primarily indicated an absence of significant synergistic interactions for bleeding events across the evaluated combinations. In FAERS, five of the six warfarin-SSRI combinations demonstrated consistent negative Ω values for bleeding events (range: −1.04 to −0.75), indicating a negative interaction. For the warfarin-fluvoxamine combination, although the Ω point estimate was positive (Ω = 0.32) and the Multiplicative Model indicated a potential signal (2.55), the 95% CI for the Ω model (−0.40 to 1.04) encompassed zero, indicating that the synergistic signal was not statistically significant. These findings were largely corroborated by the CVARD database, where Ω values for bleeding remained negative for most combinations, with isolated positive point estimates failing to reach statistical significance.
Regarding ‘International normalized ratio increased’, results largely paralleled the bleeding outcomes. Most combinations exhibited negative Ω values. The warfarin-fluvoxamine combination showed a marginally positive signal in the Additive Model (0.00005) and a positive Ω point estimate (0.03 in FAERS; 1.32 in CVARD); however, the 95% CIs for the Ω model broadly encompassed zero (FAERS: −1.20 to 1.27; CVARD: −0.36 to 3.01), confirming these findings were statistically non-significant.
In summary, while complementary analyses using the Additive and Multiplicative Models identified sporadic positive signals (e.g. warfarin-fluvoxamine), these were not consistently supported by the robust Ω Shrinkage Measure Model (where CIs crossed zero) or the CRR Model (all CRR <2). Therefore, no consistent and robust evidence of synergistic pharmacovigilance signals was detected across the varied statistical approaches. The primary FAERS signal detection results are summarized in Table 5.
Signal detection for bleeding events and INR elevation in the FAERS database.

The interaction models and signal detection criteria are described in Section ‘Statistical analysis and signal detection’ and Table S7, based on established methodologies.10,13,27
CI, confidence interval; CRR, combination risk ratio; FAERS, FDA Adverse Event Reporting System; INR, international normalized ratio; n111, number of reports with the combination and the target event; n11+, total number of reports with the combination.
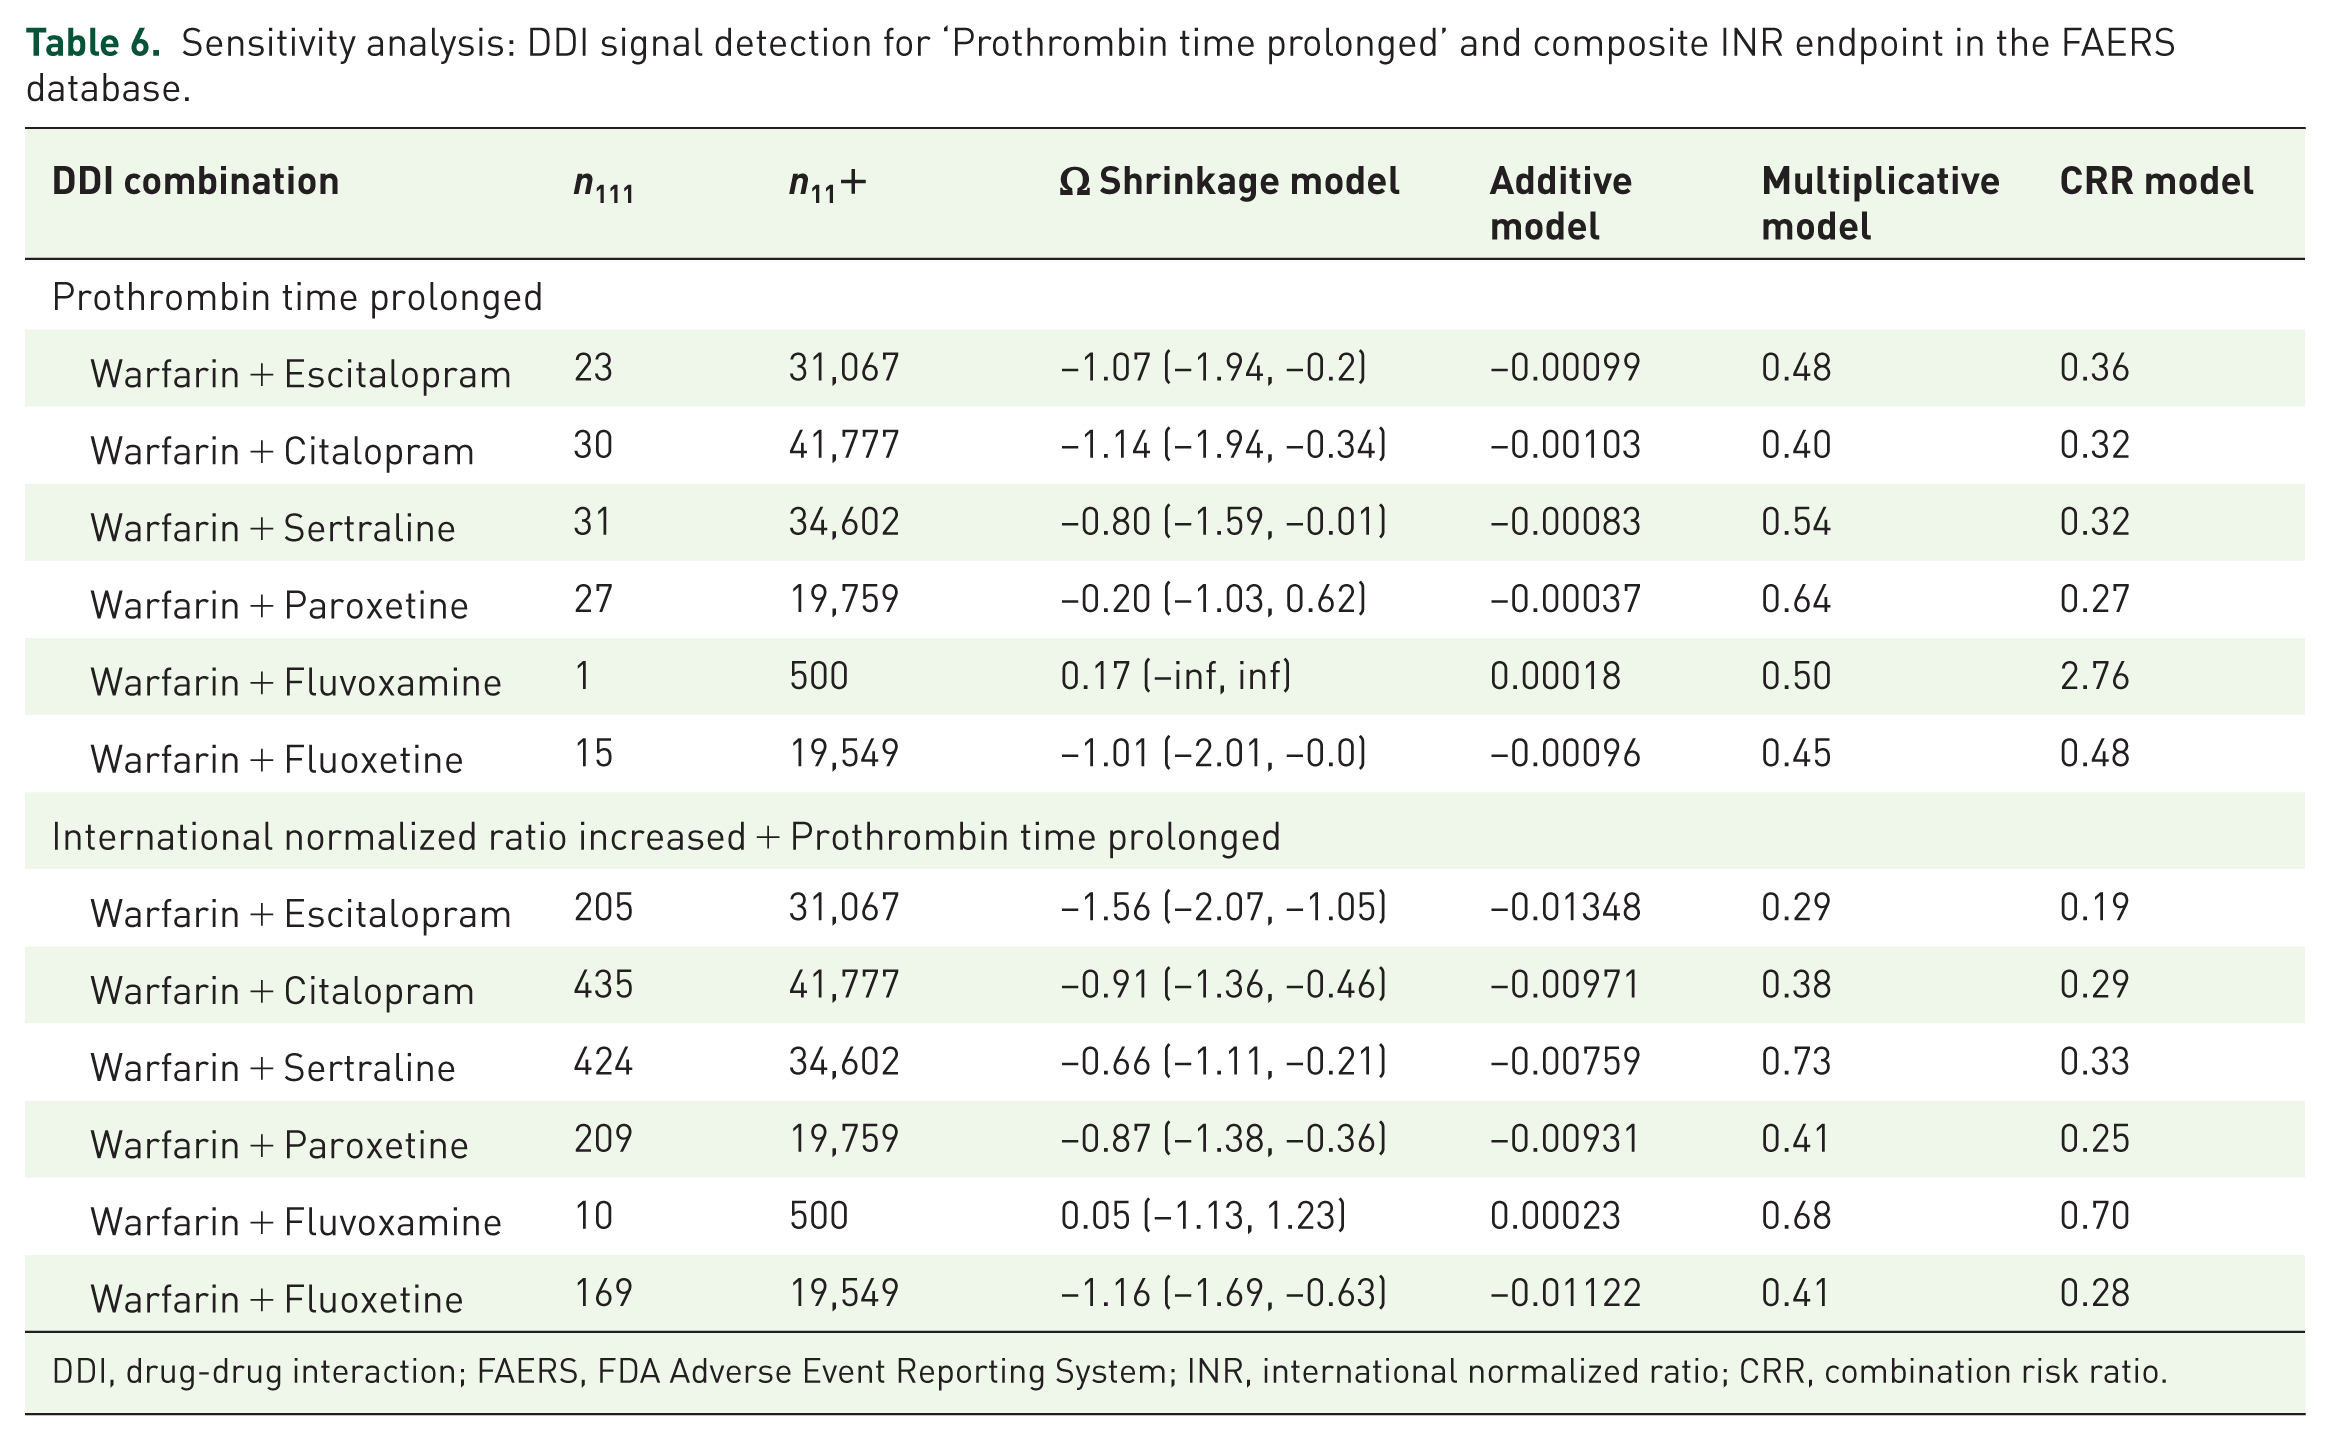
As a pre-specified sensitivity analysis, DDI signal detection was further extended to the PT ‘Prothrombin time prolonged,’ and the composite endpoint combining ‘International normalized ratio increased’ with ‘Prothrombin time prolonged’, to verify the robustness of the primary INR-related findings. The results are presented in Table 6 (FAERS) and Table 7 (CVARD). Consistent with the primary analysis, most warfarin-SSRI combinations yielded negative Ω values for ‘Prothrombin time prolonged’ in FAERS (e.g. warfarin + escitalopram: Ω = −1.07, 95% CI: −1.94 to −0.20; warfarin + citalopram: Ω = −1.14, 95% CI: −1.94 to −0.34), with the exception of warfarin + fluvoxamine (Ω = 0.17, 95% CI: −∞ to +∞), which remained statistically non-significant due to the extremely small case count (n111 = 1). For the composite INR endpoint, all six combinations demonstrated negative Ω values in FAERS (range: −1.56 to −0.66), and this pattern was directionally corroborated in CVARD, where most combinations similarly showed negative or non-significant Ω values. These sensitivity analyses collectively confirm that the absence of synergistic pharmacovigilance signals for anticoagulation-related outcomes is robust across alternative PT definitions.
Sensitivity analysis: DDI signal detection for ‘Prothrombin time prolonged’ and composite INR endpoint in the FAERS database.
DDI, drug-drug interaction; FAERS, FDA Adverse Event Reporting System; INR, international normalized ratio; CRR, combination risk ratio.
Sensitivity analysis: DDI signal detection for ‘Prothrombin time prolonged’ and composite INR endpoint in the CVARD database.
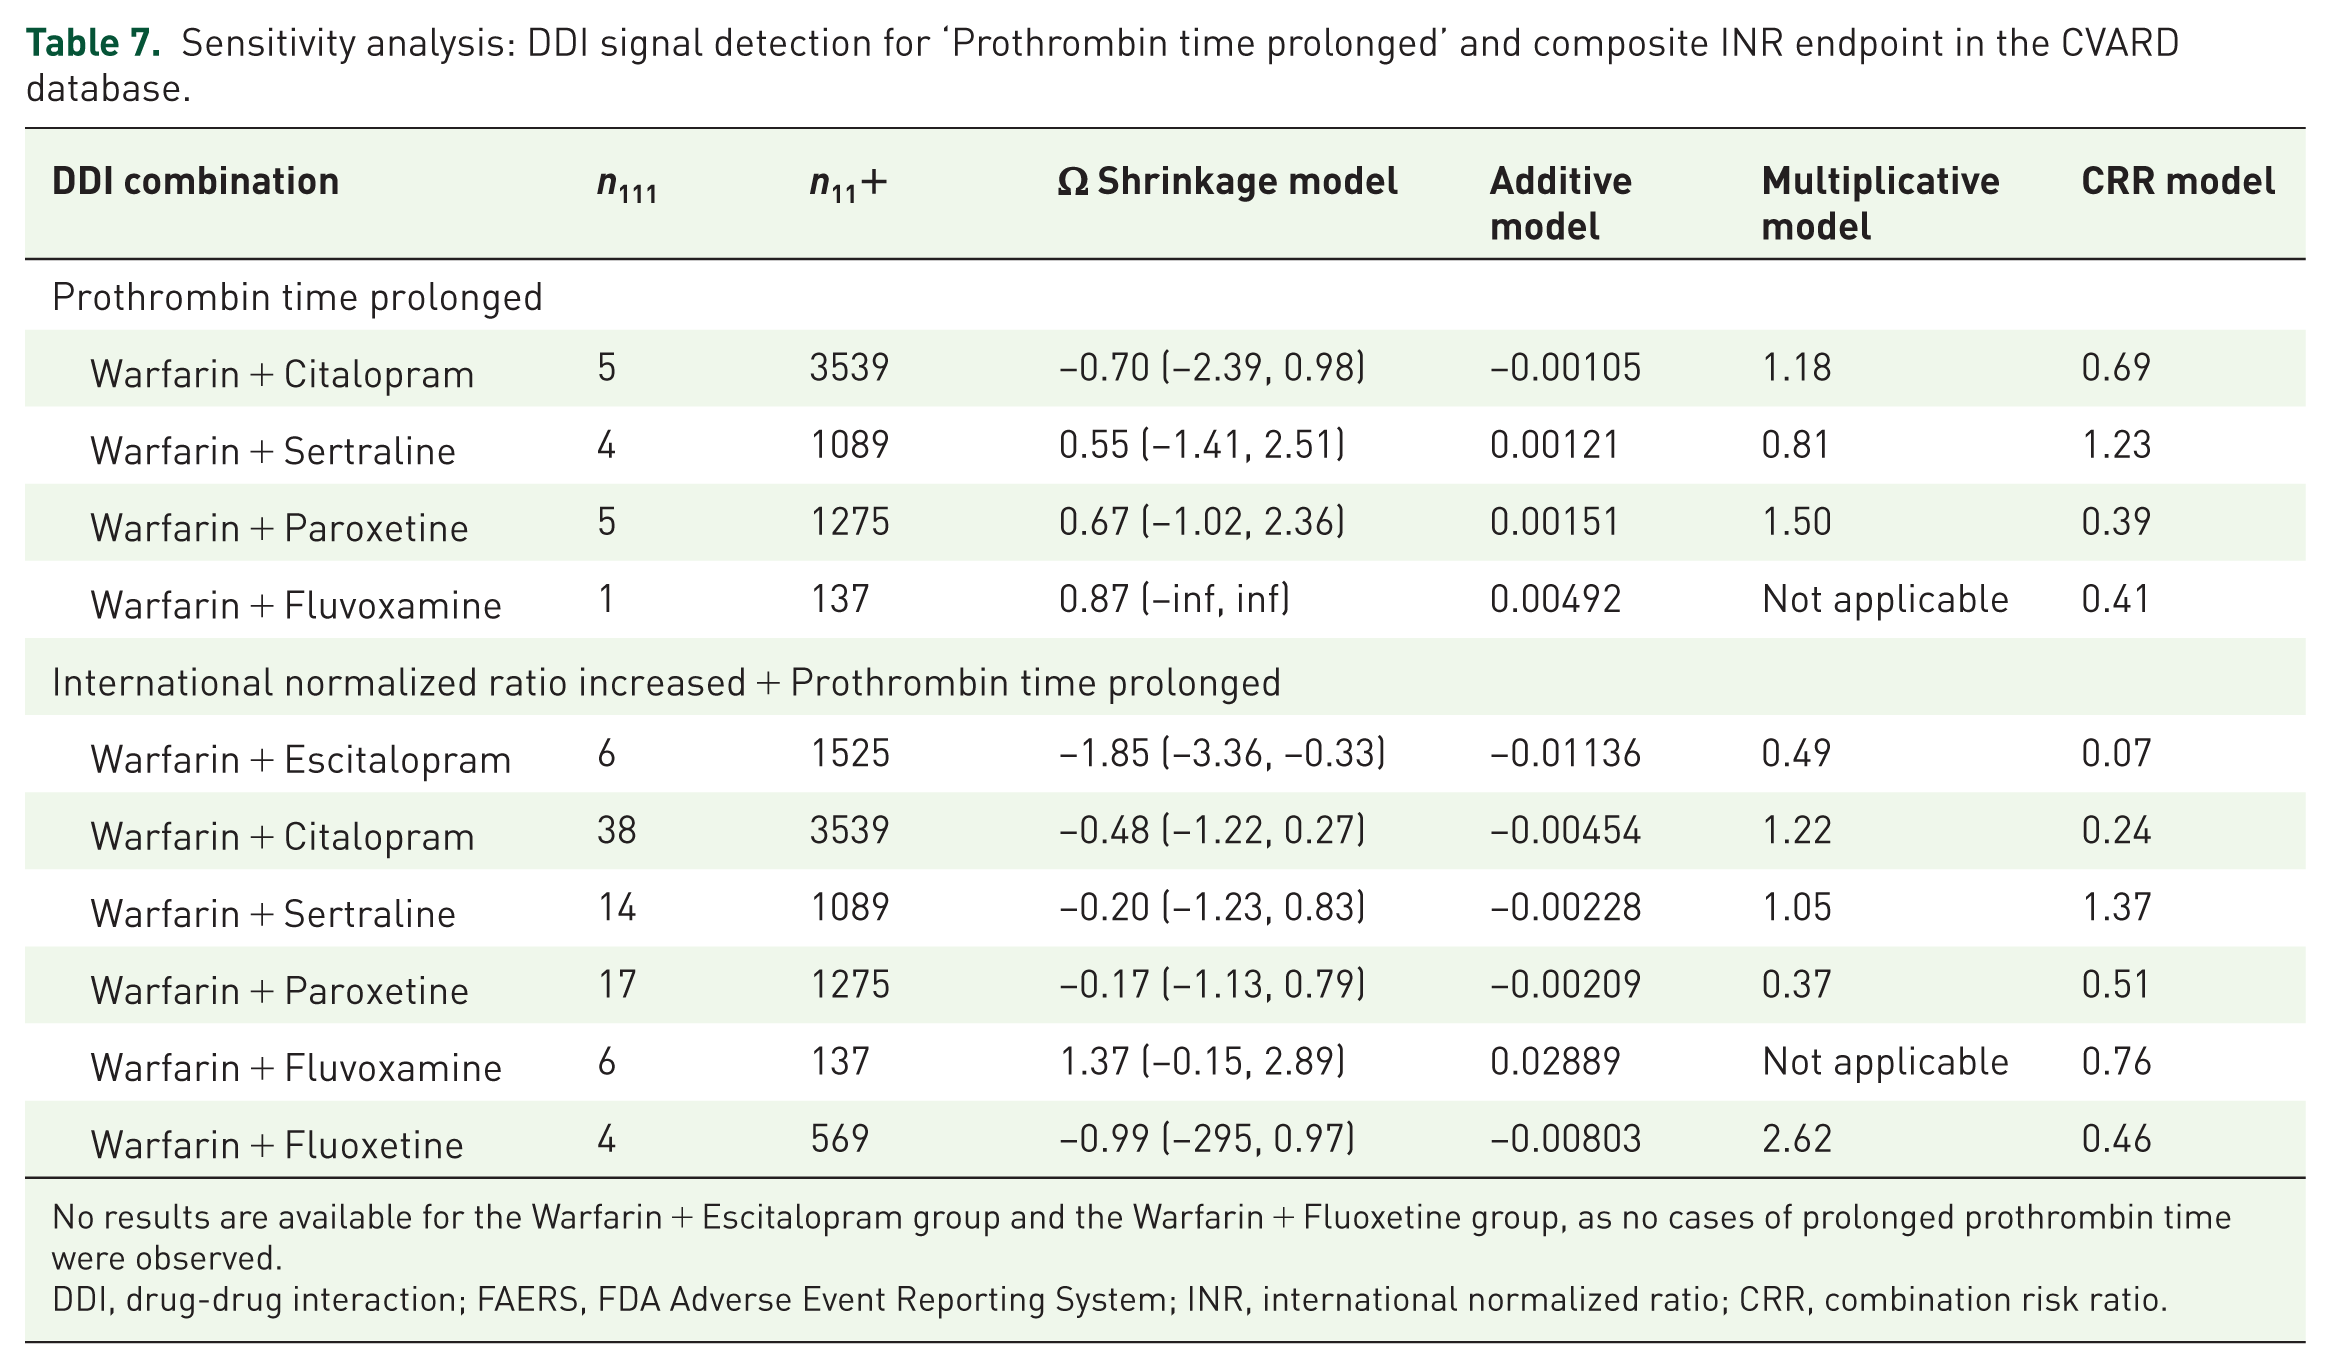
No results are available for the Warfarin + Escitalopram group and the Warfarin + Fluoxetine group, as no cases of prolonged prothrombin time were observed.
DDI, drug-drug interaction; FAERS, FDA Adverse Event Reporting System; INR, international normalized ratio; CRR, combination risk ratio.
Discussion
This pharmacovigilance study systematically evaluated bleeding events and ‘International normalized ratio increased’ associated with warfarin-SSRI combinations using FAERS (>900,000 reports) and CVARD (57,691 reports) databases. Contrary to theoretical pharmacological expectations, robust statistical modelling primarily indicated an absence of clinically significant synergistic interactions, with most combinations exhibiting negative Ω values indicative of a negative interaction. Although the warfarin-fluvoxamine combination displayed isolated positive signals in secondary models (Multiplicative and Additive), the robust Ω Shrinkage Measure consistently showed 95% CIs broadly encompassing zero (e.g. FAERS bleeding: −0.40 to 1.04), suggesting that these signals likely stem from variations in statistical methodology or small sample sizes rather than true synergy. This conclusion is further elucidated by the network analysis of the top 30 PTs, which demonstrated that the SSRIs&Warfarin group shares overlapping haemorrhagic and cardiovascular PTs with the Warfarin-single group, while no shared top 30 PTs were identified with the SSRIs-single group. This pattern confirms that the combination therapy’s safety profile is predominantly shaped by warfarin-associated risks rather than a synergistic amplification of bleeding risks.
The negative findings may be attributed to multiple interacting factors. First, CYP2C9 genetic polymorphism heterogeneity across populations may dilute pharmacokinetic interaction effects at the population level.15 –17 Second, intensified INR monitoring and prompt dose adjustments in clinical practice may effectively buffer potential risks, consistent with Schelleman et al.’s finding of no significant bleeding risk increase with SSRIs in 2408 warfarin users (adjusted HR = 0.96, 95% CI: 0.67–1.37). 18 Third, SSRIs’ bidirectional effects on platelet function (prolonged bleeding time via serotonin reuptake inhibition vs prothrombotic tendencies of certain agents) may generate offsetting effects.19 –21 However, our findings diverge from certain recent observational studies and case reports. For instance, a 2024 population-based cohort study by Rahman et al. utilizing UK electronic health records indicated that the concomitant use of SSRIs and oral anticoagulants was associated with a 33% increased risk of major bleeding. 22 This discrepancy likely arises from methodological differences: while cohort studies capture absolute incidence and hazard ratios in specific clinical settings, our disproportionality analysis focuses on the relative reporting frequency within a global safety database, which may prioritize different types of safety signals. Therefore, these findings are complementary rather than contradictory. Our negative results suggest that while an absolute risk may exist in real-world cohorts, it does not reach the threshold of generating a disproportionate safety signal in SRS. This implies that current clinical practices, particularly routine INR monitoring, are largely effective at controlling and mitigating this risk before it translates into reportable severe AEs. Similarly, Makris et al. reported five severe bleeding cases with warfarin-citalopram, 23 while Milosavljevic et al. described INR elevation from 2.5 to 8.9 after adding sertraline. 24 These discrepancies primarily stem from publication bias and lack of confounding control in case reports, whereas our large-scale, cross-database validated analysis better reflects population-level safety. Notably, although Hemeryck et al. demonstrated fluvoxamine increased the area under the concentration–time curve (AUC) of S-warfarin by 65%, 25 this combination failed to reach statistical significance in our study, highlighting the non-linear relationship between pharmacokinetic alterations and clinical outcomes. A recent review by Dobrea et al. 26 emphasized that the magnitude of DDIs between SSRIs and anticoagulants is heavily influenced by individual CYP450 genotypes (e.g. CYP2C9 and CYP2D6). Since such genetic data are unavailable in SRS, our population-level analysis might wash out significant interactions that only occur in specific metabolic subgroups.
This study holds significant theoretical and practical value. Theoretically, it challenges the simplified paradigm of inferring clinical risks solely from pharmacological mechanisms, emphasizing the central role of large-scale real-world data in drug safety assessment and providing a methodological exemplar for pharmacovigilance development.27 –29 Clinically, negative findings provide evidence-based support for prescribing decisions, helping avoid excessive restrictions on necessary antidepressant therapy due to theoretical risks – particularly important for depression management in cardiovascular disease patients. However, results do not imply that monitoring can be neglected; rather, consistent with the 2025 clinical consensus on anticoagulant safety, 30 our study emphasizes the critical role of routine INR monitoring as a primary safety buffer. From a public health perspective, findings provide a scientific basis for optimizing risk classification in drug interaction databases and clinical decision support systems, suggesting reclassification of this combination from ‘high-risk’ to ‘requiring monitoring’ for more precise drug safety management.
Limitations
Several limitations warrant consideration. First, SRS inherent limited by underreporting and the potential for notoriety bias, where media attention or safety warnings artificially inflate reporting rates for certain AEs. Furthermore, the lack of exposure denominators in SRS data precludes the calculation of absolute incidence rates, restricting our analysis to disproportionate reporting. In addition, despite rigorous deduplication procedures, the presence of residual duplicate reports cannot be entirely ruled out, which may marginally skew signal strengths. Future research should integrate electronic health records and insurance claims data for precise risk quantification. Second, our methodology cannot fully account for critical confounders, including unmeasured demographic disparities (e.g. the significant age and sex differences observed between our cohorts), confounding by indication, severe comorbidities and concurrent high-risk medications (e.g. non-steroidal anti-inflammatory drugs or antiplatelets). Furthermore, while including all target medication reports regardless of suspect role is essential to maximize interaction detection sensitivity, this inclusive approach inherently introduces background noise that may influence signal magnitude. Future prospective studies using electronic health records must rigorously control for these clinical and demographic variables. Third, small sample sizes for fluvoxamine may cause false negatives, necessitating dedicated large-sample studies. Fourth, dose-response relationships and CYP2C9 genotype influences remain unexplored. Due to the inherent limitations of SRS – which frequently lack granular, standardized data on medication dosages and duration of therapy – the potential dose-dependent effects of SSRIs on warfarin interactions could not be systematically evaluated in this cohort. Future prospective studies utilizing electronic health records with precise dosing information are required to clarify whether high-dose SSRI exposure presents a distinct risk profile. Lastly, temporal differences in the reporting periods (FAERS 2004-2025 vs CVARD 1965-2025) and the heterogeneity in individual SSRI reporting frequencies between the databases reflect regional prescribing differences, regulatory timelines and distinct pharmacovigilance cultures. These variations complicate direct cross-database comparisons of absolute signal strengths, and caution is warranted when interpreting these metrics across different healthcare systems. Nonetheless, rather than undermining our study, the parallel absence of synergistic bleeding signals across two distinct national databases over an extended temporal span enhances confidence in the overall consistency of our findings. Future directions include: integrating pharmacogenomics for individualized risk prediction, applying machine learning and natural language processing to enhance signal detection, conducting international multicentre collaborations to strengthen external validity, and employing comprehensive safety frameworks to evaluate both anticoagulation inadequacy and excess risk.
Conclusion
In conclusion, through systematic analysis of over 900,000 adverse event reports, this study provides critical real-world safety evidence for warfarin-SSRI interactions. Negative findings challenge traditional theoretical assumptions, emphasize the central role of clinical monitoring and dose management, and provide a scientific basis for optimizing prescribing decisions and drug management policies, ultimately contributing to improved depression treatment accessibility in cardiovascular disease patients while ensuring safety.
Supplemental Material
sj-docx-1-taw-10.1177_20420986261454180 – Supplemental material for Absence of pharmacovigilance signals for bleeding events associated with warfarin-SSRI drug interactions: a comparative analysis of FAERS and CVARD databases
Supplemental material, sj-docx-1-taw-10.1177_20420986261454180 for Absence of pharmacovigilance signals for bleeding events associated with warfarin-SSRI drug interactions: a comparative analysis of FAERS and CVARD databases by Pan Zhang, Siyuan Cheng, Junlin Diao and Haoran Zhu in Therapeutic Advances in Drug Safety
Supplemental Material
sj-docx-2-taw-10.1177_20420986261454180 – Supplemental material for Absence of pharmacovigilance signals for bleeding events associated with warfarin-SSRI drug interactions: a comparative analysis of FAERS and CVARD databases
Supplemental material, sj-docx-2-taw-10.1177_20420986261454180 for Absence of pharmacovigilance signals for bleeding events associated with warfarin-SSRI drug interactions: a comparative analysis of FAERS and CVARD databases by Pan Zhang, Siyuan Cheng, Junlin Diao and Haoran Zhu in Therapeutic Advances in Drug Safety
Supplemental Material
sj-docx-3-taw-10.1177_20420986261454180 – Supplemental material for Absence of pharmacovigilance signals for bleeding events associated with warfarin-SSRI drug interactions: a comparative analysis of FAERS and CVARD databases
Supplemental material, sj-docx-3-taw-10.1177_20420986261454180 for Absence of pharmacovigilance signals for bleeding events associated with warfarin-SSRI drug interactions: a comparative analysis of FAERS and CVARD databases by Pan Zhang, Siyuan Cheng, Junlin Diao and Haoran Zhu in Therapeutic Advances in Drug Safety
Supplemental Material
sj-docx-4-taw-10.1177_20420986261454180 – Supplemental material for Absence of pharmacovigilance signals for bleeding events associated with warfarin-SSRI drug interactions: a comparative analysis of FAERS and CVARD databases
Supplemental material, sj-docx-4-taw-10.1177_20420986261454180 for Absence of pharmacovigilance signals for bleeding events associated with warfarin-SSRI drug interactions: a comparative analysis of FAERS and CVARD databases by Pan Zhang, Siyuan Cheng, Junlin Diao and Haoran Zhu in Therapeutic Advances in Drug Safety
Supplemental Material
sj-docx-5-taw-10.1177_20420986261454180 – Supplemental material for Absence of pharmacovigilance signals for bleeding events associated with warfarin-SSRI drug interactions: a comparative analysis of FAERS and CVARD databases
Supplemental material, sj-docx-5-taw-10.1177_20420986261454180 for Absence of pharmacovigilance signals for bleeding events associated with warfarin-SSRI drug interactions: a comparative analysis of FAERS and CVARD databases by Pan Zhang, Siyuan Cheng, Junlin Diao and Haoran Zhu in Therapeutic Advances in Drug Safety
Supplemental Material
sj-docx-6-taw-10.1177_20420986261454180 – Supplemental material for Absence of pharmacovigilance signals for bleeding events associated with warfarin-SSRI drug interactions: a comparative analysis of FAERS and CVARD databases
Supplemental material, sj-docx-6-taw-10.1177_20420986261454180 for Absence of pharmacovigilance signals for bleeding events associated with warfarin-SSRI drug interactions: a comparative analysis of FAERS and CVARD databases by Pan Zhang, Siyuan Cheng, Junlin Diao and Haoran Zhu in Therapeutic Advances in Drug Safety
Supplemental Material
sj-docx-7-taw-10.1177_20420986261454180 – Supplemental material for Absence of pharmacovigilance signals for bleeding events associated with warfarin-SSRI drug interactions: a comparative analysis of FAERS and CVARD databases
Supplemental material, sj-docx-7-taw-10.1177_20420986261454180 for Absence of pharmacovigilance signals for bleeding events associated with warfarin-SSRI drug interactions: a comparative analysis of FAERS and CVARD databases by Pan Zhang, Siyuan Cheng, Junlin Diao and Haoran Zhu in Therapeutic Advances in Drug Safety
Supplemental Material
sj-docx-8-taw-10.1177_20420986261454180 – Supplemental material for Absence of pharmacovigilance signals for bleeding events associated with warfarin-SSRI drug interactions: a comparative analysis of FAERS and CVARD databases
Supplemental material, sj-docx-8-taw-10.1177_20420986261454180 for Absence of pharmacovigilance signals for bleeding events associated with warfarin-SSRI drug interactions: a comparative analysis of FAERS and CVARD databases by Pan Zhang, Siyuan Cheng, Junlin Diao and Haoran Zhu in Therapeutic Advances in Drug Safety
Footnotes
References
Supplementary Material
Please find the following supplemental material available below.
For Open Access articles published under a Creative Commons License, all supplemental material carries the same license as the article it is associated with.
For non-Open Access articles published, all supplemental material carries a non-exclusive license, and permission requests for re-use of supplemental material or any part of supplemental material shall be sent directly to the copyright owner as specified in the copyright notice associated with the article.