
Abstract
The research was aimed at developing and testing the system of predicting students’ academic performance based on the analysis of digital trace by means of neural networks in the conditions of secondary schools in Kyrgyzstan. The research methodology included creating electronic educational resources, developing a neural network model of forecasting and conducting a pedagogical experiment involving 120 students of 8-9 grades of secondary school No.42 in Osh city. The experimental group worked with the developed electronic resources including 27 interactive lessons, 250 test tasks and 30 practical works, while the control group followed the traditional teaching methodology. The monitoring system recorded 12 digital footprint parameters at 5-min intervals, which ensured high prediction accuracy. The developed system demonstrated a prediction accuracy of 88.9% for mathematics and 89.3% for computer science, which exceeded the performance of existing analogues by 4.9%. The introduction of the system contributed to the development of subject competences with the increase of the following indicators: algorithmisation – 34.1%, mathematical modelling – 32.9%, programming – 33.2%. In the experimental group, the average score in mathematics increased by 0.56 and in computer science by 0.63, while the quality of knowledge exceeded that of the control group by 14.4%. Advance prediction demonstrated 83.2% efficiency in identifying potential learning problems 2 weeks before the manifestation. The statistical significance of the results was confirmed by the high value of the Cohen effect (d = 0.85) and the correlation between systematic work with electronic resources and academic performance (r = 0.82). The developed methodology was adapted to the technical conditions of Kyrgyz schools and could be scaled up in educational institutions with a similar level of equipment in the presence of basic computer infrastructure and Internet access.
Keywords
Introduction
The relevance of the study is conditioned by the need to improve the quality of education in general education institutions through the formation of students’ professional abilities and modelling of the learning outcomes using modern technologies. In the context of digitalisation of learning, e-learning materials and machine learning systems become key tools for improving the educational process. The issue of the effectiveness of digital technologies in shaping students’ knowledge and skills, especially in the context of exact sciences, requires further research, although there are numerous works on the application in teaching. A problematic research issue is the lack of a systematic approach to integrating online learning environments and neuroalgorithms into the learning process, which limits the ability to accurately assess future learning success. Existing studies, such as the works of Rodríguez-Hernández et al. (2021) and Li et al. (2022), demonstrate the potential of deep neural networks to analyse educational data, but the application in school practice remains limited. In addition, the works of Farissi et al. (2020) and Tang et al. (2021) highlight the importance of developing algorithms for modelling educational achievement, but do not consider the specifics of secondary education. This study focuses on the creation and experimental validation of a methodology for developing learners’ qualification characteristics and anticipating the academic performance using virtual learning environments and neurocomputing systems.
The main aspects of the research are the influence of digital educational content on the formation of students’ educational achievements, the identification of effective machine learning systems for diagnosing potential results, and methods of integrating these technologies into the educational process of general educational institutions. These aspects require detailed study after achieving the main goal of the research. The analysis of existing studies shows that the works of Simelane-Mnisi and Mokgala-Fleischmann (2022) emphasise on improving teachers’ digital skills, which is an important aspect for successful integration of technology into teaching. However, as M. MacKay et al. (2024) point out, it is also necessary to take into account the specifics of educational systems in different countries, which emphasises the importance of conducting research in local contexts such as Kyrgyzstan.
The application of artificial intelligence and machine learning in education attracts increasing attention of researchers and practitioners. Studies conducted by McKenzie-White et al. (2022) show that the introduction of competency-based approach in educational programmes contributes to more effective formation of professional skills among students. However, despite this, the question remains as to how exactly neural algorithms can be adapted for use in general education, especially in disciplines such as STEM disciplines. One of the key challenges facing educational institutions is the lack of clear methodologies for evaluating the effectiveness of digital learning materials. As noted by Hulandari and Rahmi (2022), the development of edutainment-based learning materials can significantly increase learner engagement. However, in order to maximise the effect, the individual characteristics of each learner need to be considered, which requires the application of sophisticated data analysis algorithms. In the context of modelling learning outcomes, research conducted by Ardianto et al. (2023) demonstrates that the use of neural network technology can not only predict learner outcomes, but also identify factors that may negatively affect the performance. This is particularly important for general education institutions, where timely identification of such factors can help prevent students from falling behind.
In addition, the works of Kang (2023) emphasise the importance of adapting educational programmes to modern requirements. In the conditions of rapid technological development, schools should be ready to introduce new teaching methods that will allow students not only to learn knowledge, but also to develop critical thinking and the ability for self-learning. An important aspect of the study is also the consideration of the geographical and cultural characteristics of the region. As noted by Astuti and Revianti (2023), successful implementation of new technologies in learning requires taking into account local conditions and traditions. In the case of Kyrgyzstan, this is particularly relevant, as the country’s educational system is in the process of reform, and the introduction of neurocomputer systems helps to modernise and improve the quality of learning. Modern research in the field of education is increasingly turning to the issues of technology integration in the educational process. For example, the works of Rachmaningsih (2022) emphasise the importance of using digital platforms to manage educational resources. This is particularly relevant as schools face the need to adapt to new challenges such as distance learning.
Furthermore, research on neural networks, such as the work of Sokkhey and Okazaki (2020), show that these technologies can be effectively used to analyse large amounts of data, which opens up new possibilities for predicting learning outcomes. However, as noted by Varade and Thankanchan (2021), for the successful implementation of such technologies, not only technical but also pedagogical aspects need to be considered. In particular, it is important to develop techniques that enable teachers to effectively use neural algorithms to analyse data and predict student performance. This requires not only technical training, but also an understanding of the pedagogical principles that underpin the educational process.
Another important aspect is the development of digital learning materials that are customised to the needs of learners. As noted by Y.N. Warodiah et al. (2021), the use of interactive learning materials, such as worksheets with gamification elements, can significantly increase learner motivation and performance. However, in order to maximise the effect, it is necessary to consider the individual characteristics of each learner, which requires the application of sophisticated data analysis algorithms. In this context, neural network technologies can become an important tool for creating personalised educational trajectories that will take into account the level of knowledge, interests, and abilities of each learner.
The aim of the study was to create and test a comprehensive system of automated analysis of digital educational data to improve the effectiveness of the educational process in secondary schools. To achieve this goal, the following tasks were defined: to develop electronic educational resources taking into account the specifics of school education; to create and optimise algorithms for processing data on learning activity; to conduct an experimental test of the effectiveness of the developed system; to form methodological recommendations for the implementation of the system in educational institutions.
Theoretical overview
The relevance of the research topic is determined by the need to integrate modern technologies into pedagogical practice aimed at improving educational outcomes and developing students’ professional abilities. The use of digital learning materials and machine learning systems in the educational sphere is becoming a priority area of modern research. However, despite a lot of research in this area, the question of the effectiveness in shaping students’ knowledge and skills, especially in the context of exact sciences, remains insufficiently studied. This section reviews the main directions of research related to the application of neural algorithms and online learning environments in learning, and analyses the views of various authors on this topic.
The research of Sokkhey and Okazaki (2020) demonstrates that deep neural networks provide processing of large data sets, which opens new possibilities for modelling educational achievements. However, as noted by Varade and Thankanchan (2021), for successful implementation of neural algorithms it is necessary to consider not only technical but also pedagogical aspects. In particular, the authors emphasise that the application of these technologies in school practice remains limited due to the lack of methods adapted to the specifics of secondary education. Xiaoming et al. (2022) investigate the use of ensemble machine learning techniques for predicting students’ performance, thereby improving the accuracy of predictions. Li et al. (2022) propose the use of multi-species hypergraph neural networks to analyse student performance, which opens new perspectives for personalised learning. Wang et al. (2023) developed ProbSAP for predicting academic performance, which shows high accuracy and can be adapted for use in schools.
An important area of research is the development of digital learning materials adaptable to the educational needs of learners. Ardianto et al. (2023) show that the use of interactive learning materials such as worksheets with gamification elements can significantly increase student engagement in the learning process. Warodiah et al. (2021) emphasise the importance of considering the individual characteristics of each student when designing digital learning materials, which requires the use of sophisticated data analysis algorithms. Hulandari and Rahmi (2022) explore the application of edutainment principles in the design of learning materials to make the learning process more engaging and effective. Muliani et al. (2024) propose data analytics techniques for predicting student performance using neural networks, which can be useful for creating personalised learning trajectories. Yang (2024) explores the use of artificial neural networks for predicting student performance, which offers new perspectives for improving the quality of education.
Predicting learning outcomes using machine learning systems is another important area of research. Sokkhey and Okazaki (2020) developed optimised deep neural network models for predicting academic performance, which improves the accuracy of predictions. Varade and Thankanchan (2021) investigate the use of decision tree algorithms for predicting students’ academic performance, which can be useful for identifying factors affecting academic performance. Yan (2022) analyses various methods for predicting academic performance, including neural networks and machine learning, which can identify the most effective approaches. Monteverde-Suárez et al. (2024) propose the use of neural networks and Naive Bayesian method to predict the academic performance of medical students, which can be adapted to other educational programmes. Salarpour et al. (2024) investigate the application of neural networks in pharmaceutical science, which may be useful for adapting these technologies for educational purposes.
Adaptation of educational programmes to modern requirements is another important area of research. Kang (2023) stresses the importance of adapting educational programmes to modern requirements, including the use of digital technologies. Astuti and Revianti (2023) investigate the application of multi-criteria analysis methods for the selection of educational courses, which allows the individual needs of students to be taken into account. Şahin et al. (2024) analyse the outcomes of architecture graduates from the students’ perspective, which can be useful for improving educational programmes. Kusumawati (2024) investigates the use of neural networks to improve student performance in a virtual learning environment, which opens new perspectives for distance education. Bocharova and Malakhov (2024) propose ResJobFit technology, which can be adapted to analyse educational data and predict student performance. Thus, the analysis of existing studies shows that the application of neural network technologies and digital learning materials in education opens up new opportunities for improving the quality of learning and shaping the professional abilities of students. However, for the successful implementation of these technologies, it is necessary to consider not only technical but also pedagogical aspects, as well as to develop methods that will allow teachers to effectively use these technologies in the learning process.
Materials and methods
The study was conducted on the basis of secondary school No.42 of Osh city with scientific and methodological support of specialists of Osh State Pedagogical University. The experiment involved 120 students of 8–9 grades, distributed in equal proportion between the study groups. The first group (control group) consisted of pupils of grades 8A, 8B and 9A (28 boys, 32 girls) who studied under the standard programme. The experimental group consisted of students in grades 8B, 8G and 9B (30 boys, 30 girls), where the developed electronic resources and the system of predicting academic performance were used. Inclusion criteria: education in grades 8–9, access to a computer and the Internet, and informed parental consent. The groups were formed taking into account comparability in terms of initial level of performance, gender composition and age of students. Period of the study: September–December 2024, including preparatory (September), diagnostic (October), experimental (November) and analytical (December) stages.
The material and technical base of the study included: a computer class with 15 workstations (Intel Core i5, 16 GB RAM, Windows 10), Promethean ActivBoard interactive whiteboard, a server for placing electronic educational resources (32 GB RAM, 2 TB SSD). Developed materials included: e-learning content in maths and computer science (40 hours of teaching material for the first semester), online testing system with a bank of 250 assignments, module for collecting data on students’ activity. Software: Python 3.9, TensorFlow 2.8, pandas, numpy, scikit-learn libraries for data analysis, Moodle-based learning management system.
Data were collected through a comprehensive system for monitoring learning activity, including: time spent working with electronic resources (in minutes), online test results (percentage of correct answers), homework grades (on a 5-point scale), class activity (number of answers and questions), and attendance (percentage of attendance). Data were structured in CSV format with 12 parameters for each student including identifier, grade, initial subject grades, current performance. Frequency of data collection: daily for online activity, weekly for academic performance. Neural network modelling was implemented based on a multilayer perceptron with three hidden layers (128, 64, 32 neurons). Network architecture: input layer (12 neurons according to the number of parameters), hidden layers with ReLU activation function and dropout (0.2) to prevent overtraining, output layer (1 neuron) with linear activation for regression. The model was trained on 80% of the data using cross-validation (5 folds), validation on 20% of the deferred data. Training parameters: Adam optimiser (learning rate = 0.001), MSE loss function, MAE and RMSE metrics, batch size = 32, epochs = 100 with early stopping (patience = 10).
Statistical processing of the results included: checking the normality of distribution (Shapiro-Wilk test, visual analysis of Q-Q plots), comparative analysis of samples using parametric and non-parametric methods, correlation analysis (Pearson’s coefficient for linear relationships, Spearman’s coefficient for non-linear ones). Prediction performance was assessed using the following metrics: accuracy, recall, F1-score, ROC-AUC. Statistical significance was set at p < 0.05 with Bonferroni correction for multiple comparisons. Calculations were performed using the SciPy package, and results were visualised via Python language matplotlib. The standard deviation was calculated using the formula (1):

Results
Formation of electronic resources and setting up a monitoring system (September 2024)
At the stage of e-resource development, 40 hours of learning content were created, including: 15 interactive lessons in mathematics, 12 lessons in computer science, 250 test tasks of various difficulty levels, 30 practical works with automatic checking. Interactive lessons in mathematics included the following topics: “Square equations”, “Functions and their graphs”, “Pythagoras theorem”, “Triangle similarity”, “Circle”, “Systems of equations”, “Inequalities”, “Statistics and probability”, “Polygons”, “Areas of figures”, “Proportions”, “Percentages”, “Degrees”, “Basics of trigonometry”, “Cartesian coordinates”. In informatics, lessons were developed: “Algorithms and executors”, “Data types”, “Fundamentals of programming”, “Conditional operators”, “Cycles”, “Arrays”, “Functions”, “Strings”, “Files”, “Databases”, “Computer networks”, “Information security”. Test tasks covered all the topics of the course, with gradation by levels of complexity. Practical works included tasks on programming, working with spreadsheets, databases, and algorithms.
The materials were developed taking into account the requirements of the state educational standard of Kyrgyzstan and were reviewed by the methodological council of the school. Testing of the materials showed an average time of one lesson of 35 minutes, which corresponded to the planned indicators. In the Moodle system, thematic forums were created to discuss learning tasks, where the indicators of students’ activity were recorded through the number of topics and questions created, answers to classmates’ questions, comments on problem solutions, time spent in discussions, and the quality of participation in discussions. These data were used as one of the parameters for the neural network model in predicting academic performance. The results of preliminary testing of the system confirmed its functional readiness for the main stage of the study, including correct operation of the authorisation, data synchronisation and statistical reporting modules.
Entry testing and assessment of students’ initial level of competences (october 2024)
Summary data of entrance testing of the study groups.
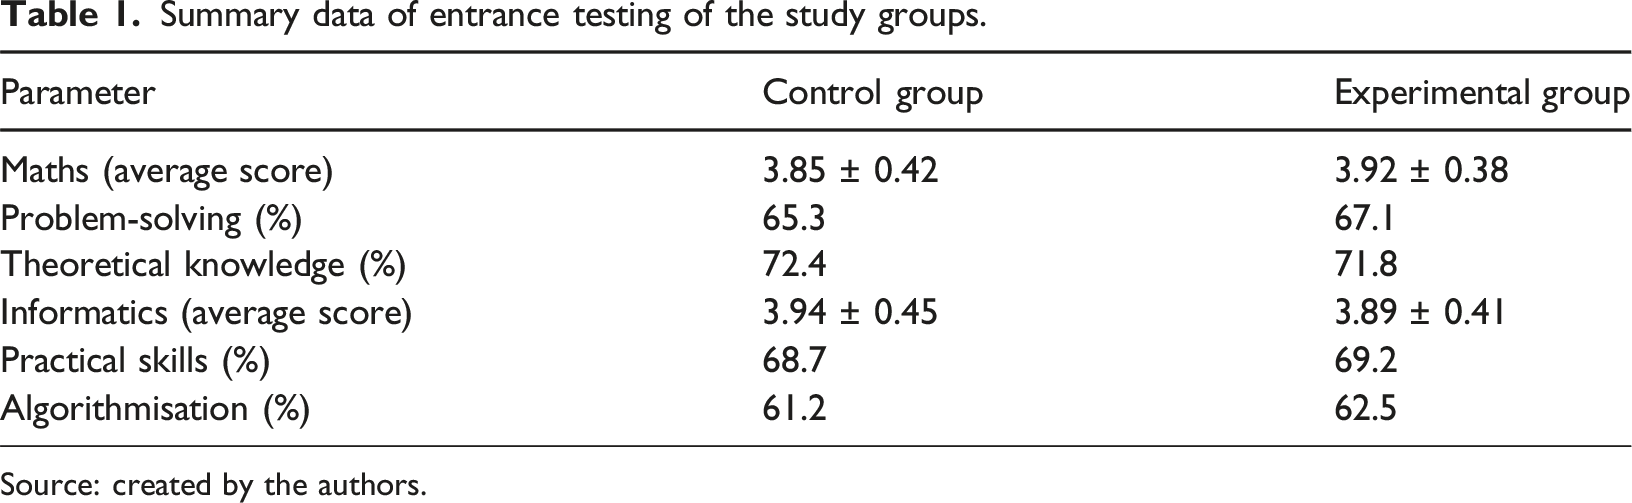
Source: created by the authors.
The analysis of Table 1 data reveals statistical homogeneity of the initial characteristics of the groups (p > 0.05), providing validity of the experimental study. Both groups revealed a similar level of mastery of basic mathematical operations and algorithmic thinking. The data of the electronic journal for the previous quarter were used to form indicators of students’ current performance. The average grade for a quarter was calculated on the basis of all student’s grades in mathematics and informatics, including grades for homework, control and independent works.
Results of students’ academic activities.
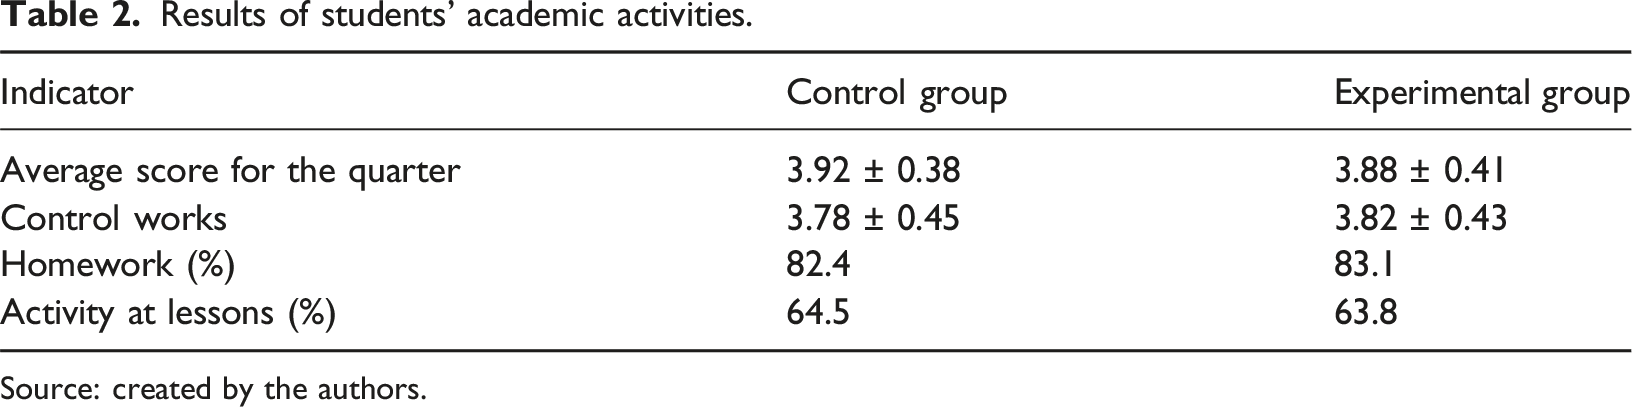
Source: created by the authors.
The results of Table 2 data analysis show a comparable level of current academic performance in both groups. The indicators of homework completion and activity at lessons are also in a close range of values, which creates favourable conditions for the experiment. Input testing and analysis of current academic performance allowed forming an initial data set for training the neural network and determine the basic level of subject competences of students. The obtained results will be used as reference values when assessing the effectiveness of the developed system for predicting academic performance. Questionnaires and basic skills testing were conducted to assess students’ technical readiness to work with electronic educational resources.
Assessment of students’ technical readiness.
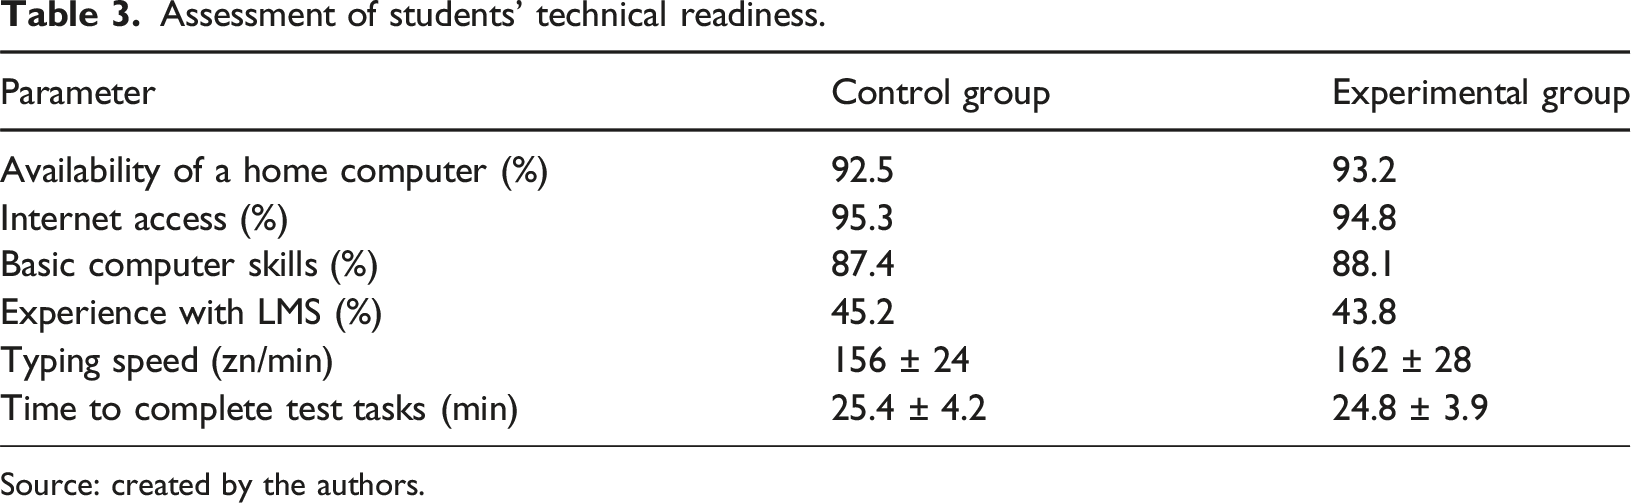
Source: created by the authors.
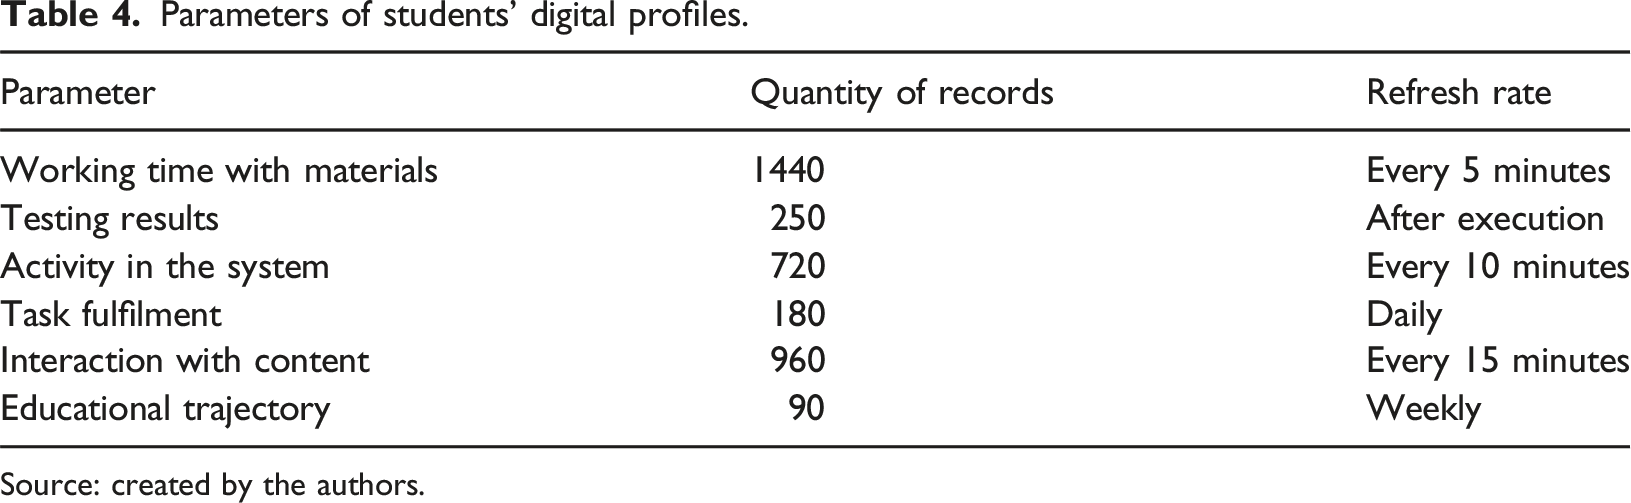
Parameters of students’ digital profiles.
Source: created by the authors.
Test results included 250 records for each student, recording all test attempts, completion times, number of correct answers and errors. Activity in the system with a refresh rate of every 10 minutes covered 720 records, including viewing materials, downloading files, and participating in discussions. Completion of assignments was recorded daily, generating 180 records for each student, including turn-in time, completeness, and quality. Content engagement was updated every 15 minutes, generating 960 records of the types of content viewed and the length of time spent engaging with it. The results are recorded in Table 4. The learning trajectory was updated weekly, generating 90 records of student progress and the system’s recommendations for adjusting instruction.
Based on the analysis of Table 4 data, a student activity monitoring system was set up with optimal data collection intervals. The collected parameters provided sufficient information for the initial training of the neural network. All data collected at the diagnostic stage were structured into a single database and prepared for further processing at the stage of predictive model development.
Introduction of e-learning resources and analysis of the effectiveness of the predictive model (November 2024)
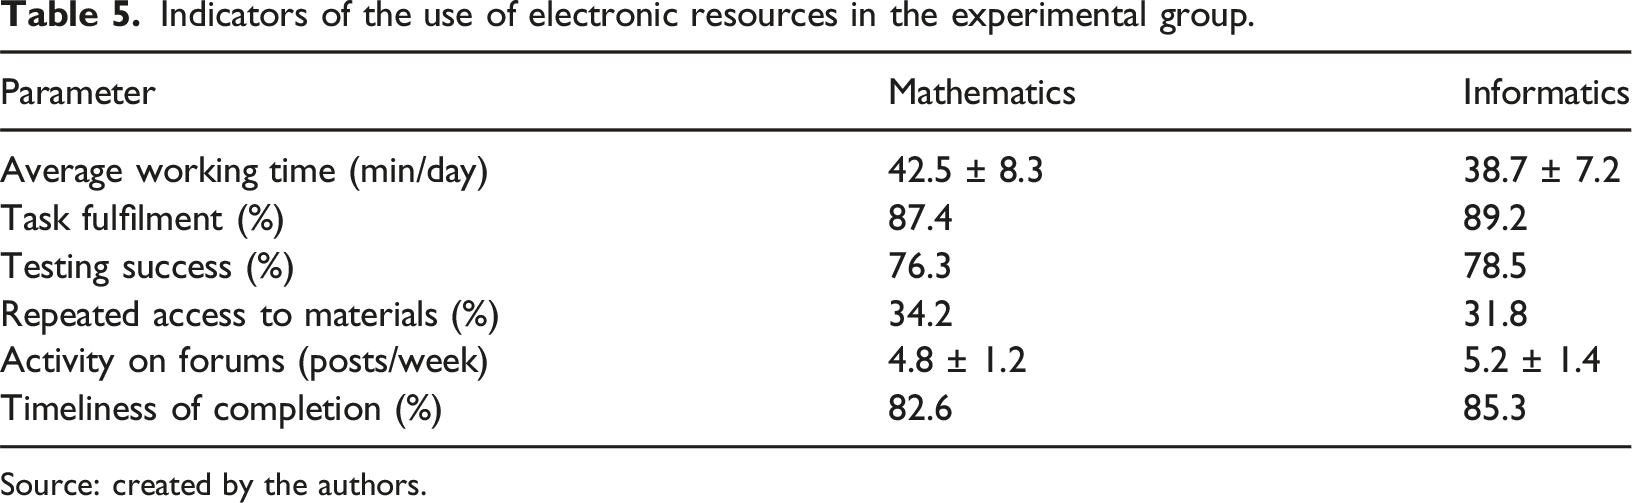
Indicators of the use of electronic resources in the experimental group.
Source: created by the authors.
Assignment completion rate was calculated as the ratio of the number of completed assignments to the total number of assigned assignments. There were 45 assigned tasks in mathematics and 38 tasks in computer science. Testing success was defined as the average percentage of correct answers for all tests passed, where 12 tests were used for mathematics and 10 tests for computer science. Repeated access to materials was recorded as the percentage of pupils who returned to the studied material after initial familiarisation. Forum activity was measured by the number of meaningful posts per week, including questions, answers, and comments on solutions. Timeliness of completion was measured as the percentage of work turned in by the due date out of the total number of assigned works.
The analysis of Table 5 data has shown that students in the experimental group regularly used electronic resources, devoting on average more than 40 minutes a day to working with materials in mathematics and about 39 minutes in computer science. The high percentage of task completion (more than 87%) and test success (more than 76%) testify to the effectiveness of the developed materials. It is noteworthy that one third of pupils returned to the studied materials for repetition, which indicates the formation of independent work skills.
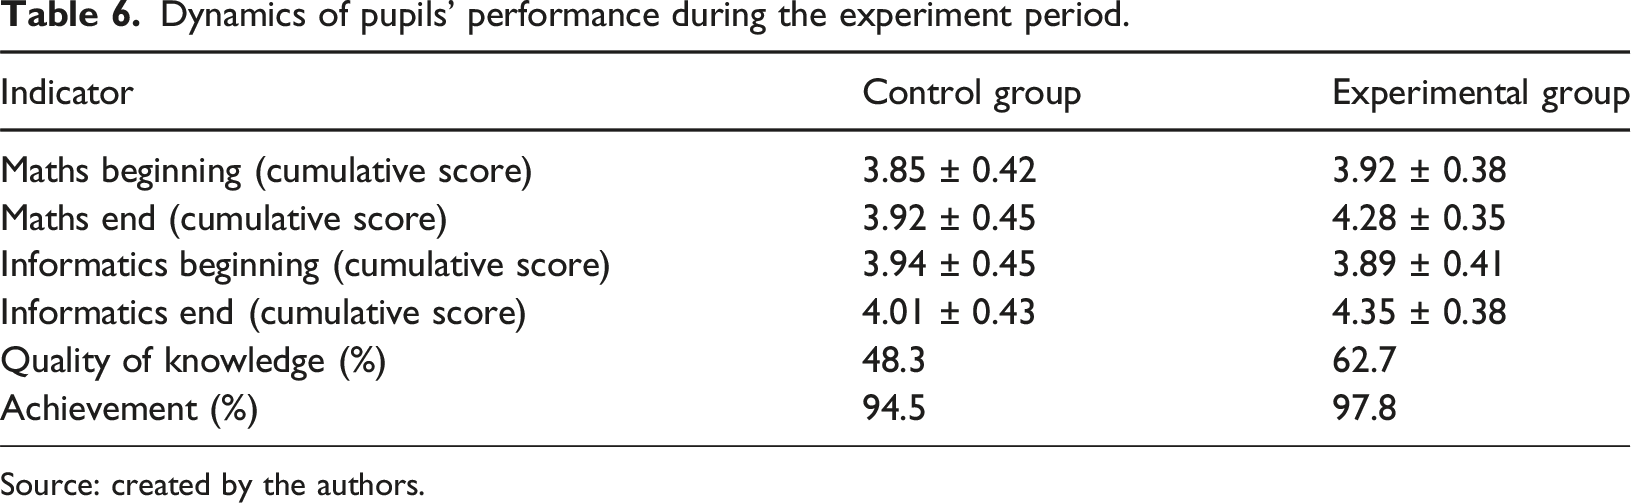
Dynamics of pupils’ performance during the experiment period.
Source: created by the authors.
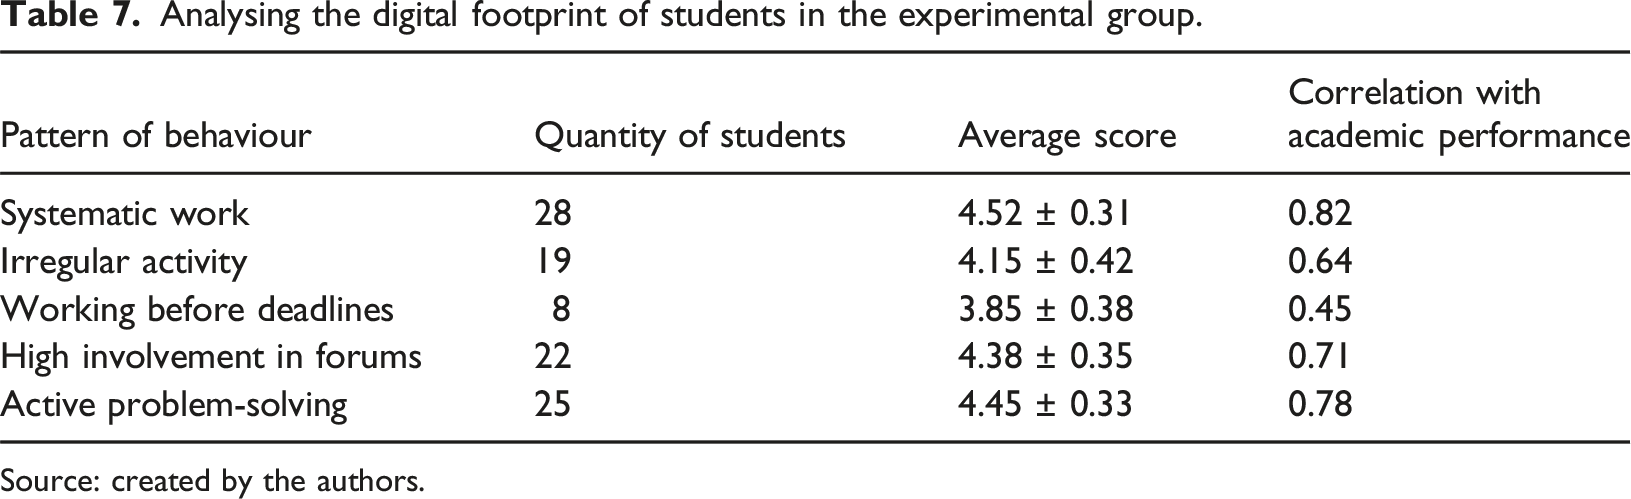
Analysing the digital footprint of students in the experimental group.
Source: created by the authors.
The digital footprint analysis was conducted based on the data collected by the Moodle system for the entire period of the experiment. The patterns of behaviour were defined according to the following criteria: systematic activity – at least 5 logins per week at 1–2 days intervals; irregular activity – 2–3 logins per week at random intervals; pre-deadline activity – activity predominantly 1–2 days before the assignment due date. The number of learners for each pattern was determined automatically by the system based on analysis of activity logs. The average score was calculated as the arithmetic mean of all grades of students in a given group for control, practical, and homework during the experiment. The correlation with academic performance was calculated by the Pearson method between activity indicators in the system and final grades. The calculation took into account: regularity of work with materials, timeliness of assignments, activity on forums, and test results. The correlation coefficient ranged from 0 to 1, where values above 0.7 were considered to indicate a strong relationship between behaviour pattern and academic performance.
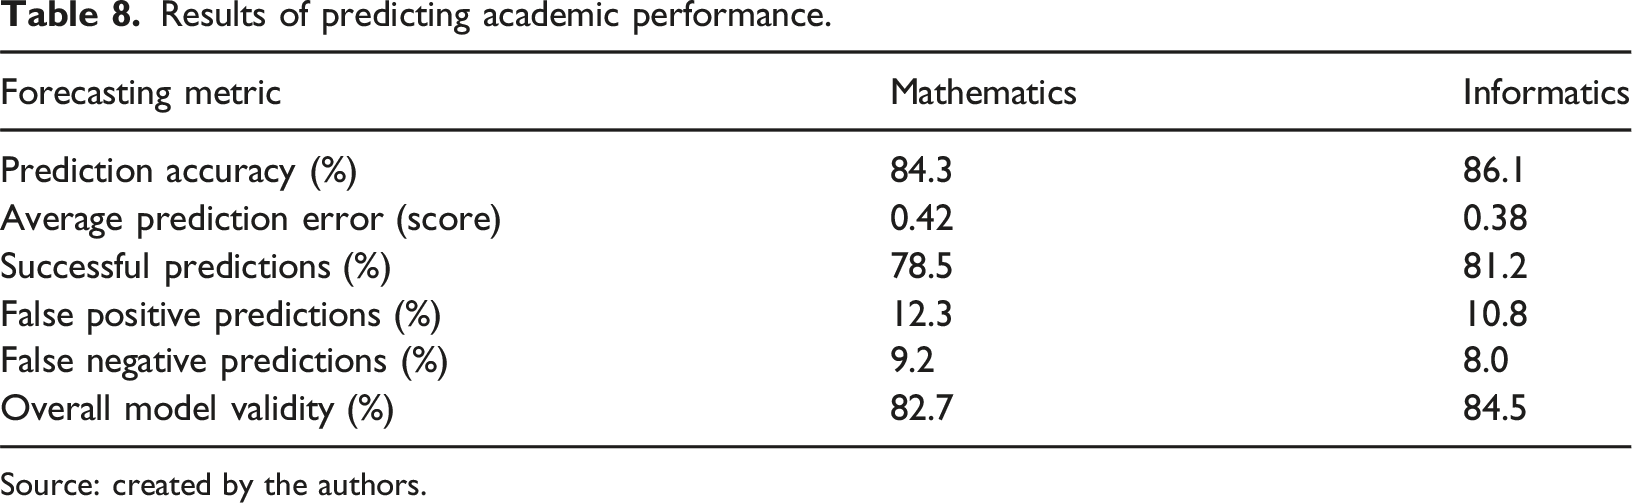
Results of predicting academic performance.
Source: created by the authors.
The prediction results were evaluated through comparing the grades predicted by the neural network with the actual performance of the students. Prediction accuracy was calculated as the percentage of predictions that deviated from the actual grade by no more than 0.5 points. For mathematics, 480 predictions were analysed and for computer science, 420 predictions were analysed over the period of the experiment. The average prediction error was calculated as the average absolute deviation of the predicted values from the actual scores. The percentage of successful predictions was defined as the proportion of predictions that accurately identified the trend in performance (improvement, deterioration, or stability). False positive and false negative predictions were identified by comparing the predicted change in academic performance with the actual change. The overall validity of the model was calculated as a weighted average of all prediction quality metrics: accuracy, completeness, and F1-measure. Both short-term (1–2 weeks) and medium-term (3-4 weeks) predictions were considered in the calculation. All metrics were calculated separately for maths and computer science using cross-validation methods to improve the reliability of the estimates.
The analysis of Table 8 data showed high efficiency of the developed predictive model. The accuracy of predicting academic performance was 84.3% for mathematics and 86.1% for computer science. The average prediction error did not exceed 0.5 points, which is an acceptable indicator for educational prediction. The higher accuracy of forecasts in computer science is explained by the greater structuring of data and the clarity of assessment criteria in this discipline. The obtained results made it possible to adjust the parameters of the neural network to improve the accuracy of forecasting in the next stage of the study.
Comprehensive assessment of the effectiveness of the system of forecasting and development of subject competences (December 2024)
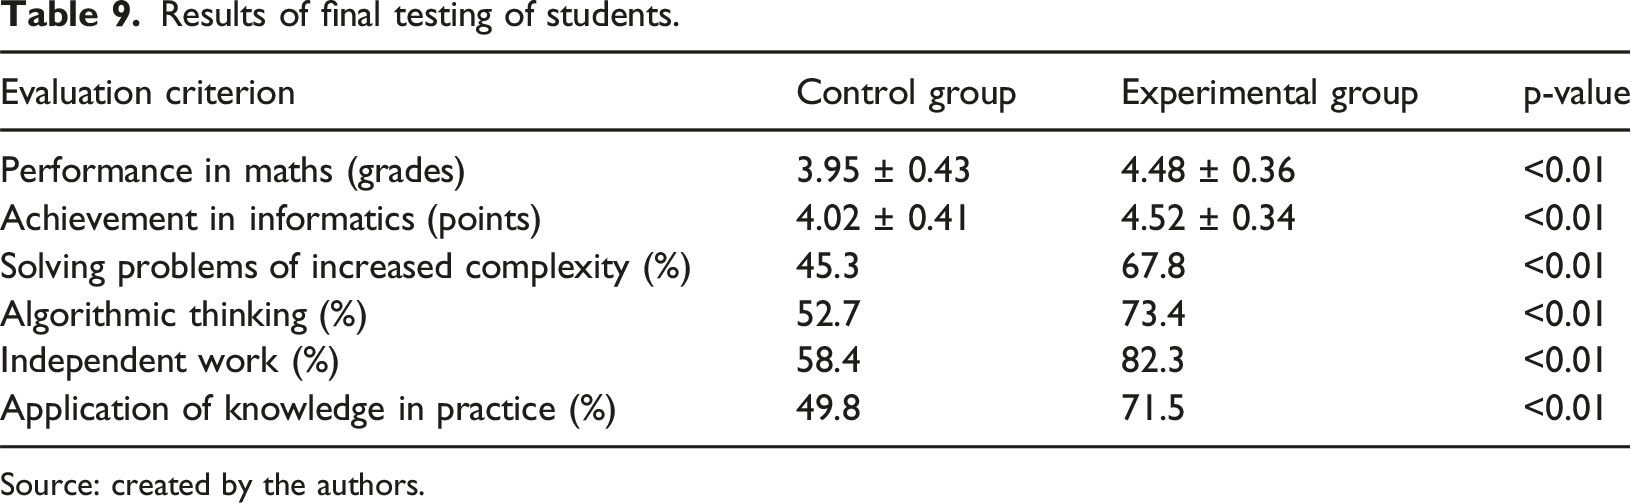
Results of final testing of students.
Source: created by the authors.
Performance was assessed on a 5-point scale with the accuracy to hundredths. Percentages for each criterion were calculated as the ratio of successfully completed assignments to the total number of assignments. Student’s t-test was used to confirm the statistical significance of differences between groups, where p < 0.01 indicates high reliability of the results. The measurement of independent work was carried out through the assessment of project assignments without teacher’s assistance. Application of knowledge in practice was assessed through solving non-standard tasks in new conditions. All results were recorded in a digital system with automatic calculation of statistical indicators.
Evaluating the effectiveness of the predictive model.
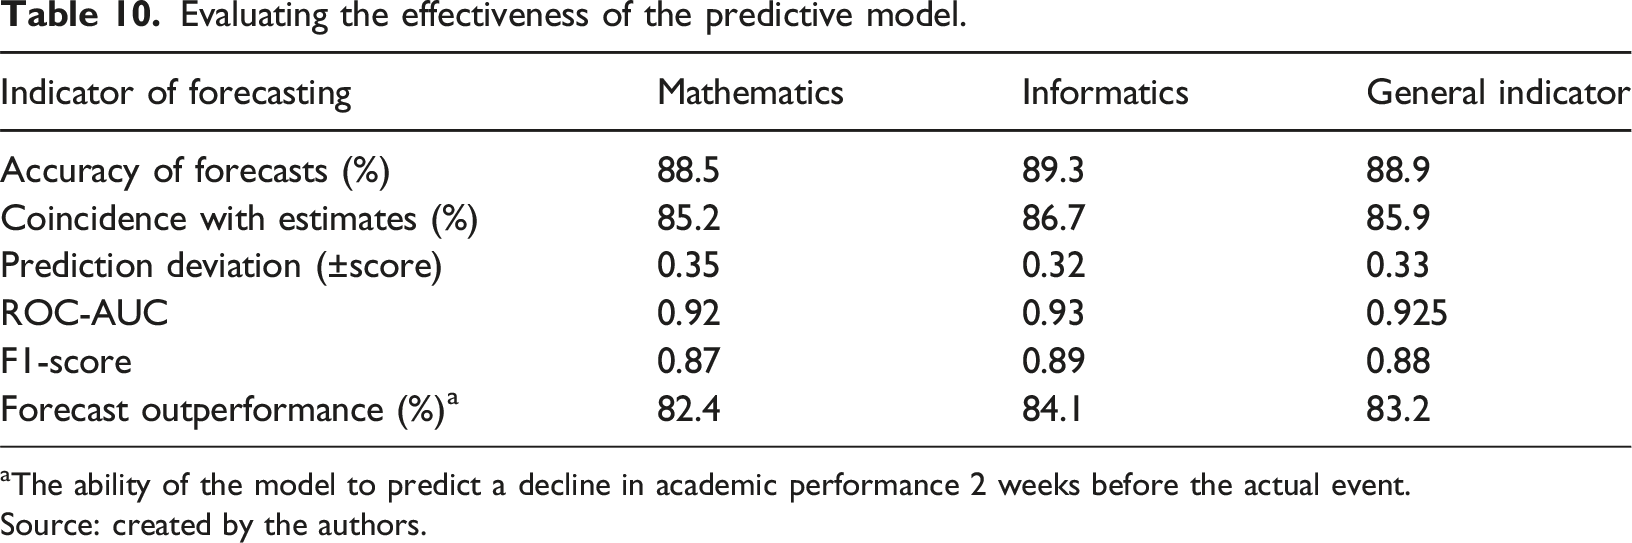
aThe ability of the model to predict a decline in academic performance 2 weeks before the actual event.
Source: created by the authors.
ROC-AUC was calculated to assess the quality of the binary classification (improvement/deterioration in performance). F1-score was calculated as the harmonic mean of prediction accuracy and completeness. Advance prediction was assessed by the ability of the system to predict a decline in academic performance 2 weeks before the actual event. Prediction bias was recorded as the absolute difference between the predicted and actual score. The overall score was calculated as a weighted average of all metrics, where weights were determined by expert judgement taking into account the importance of each metric for the educational process.
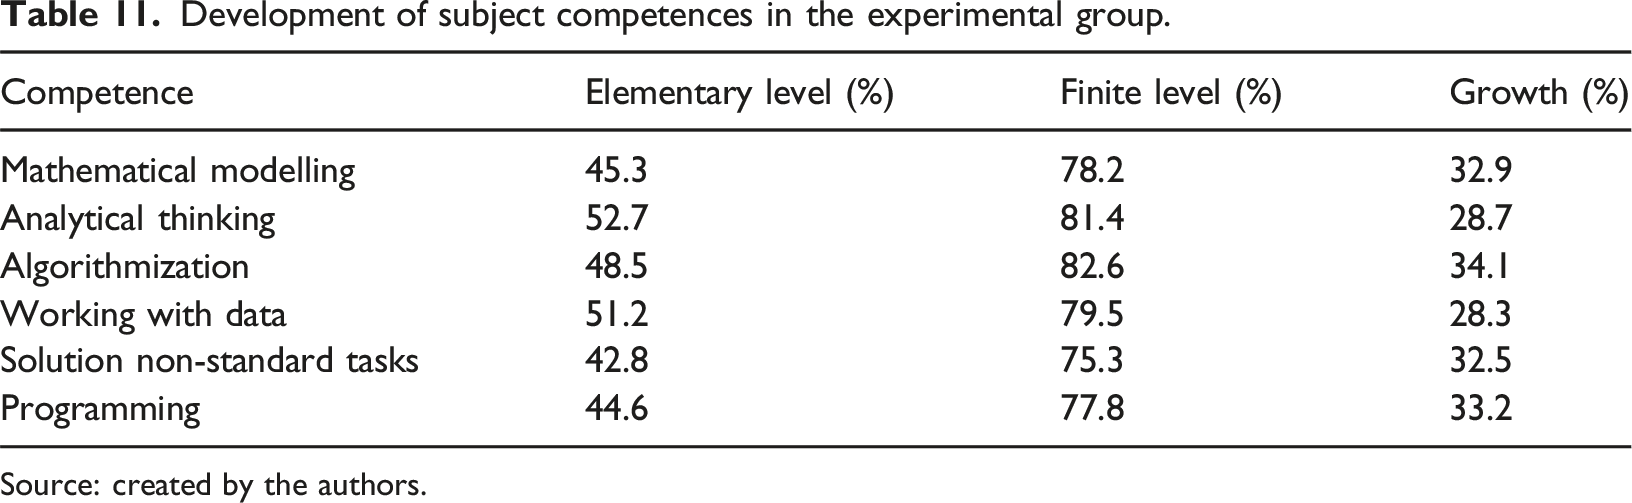
Development of subject competences in the experimental group.
Source: created by the authors.
Mathematical modelling and analytical thinking were tested through solving text problems with the construction of mathematical models. Algorithmisation and programming were assessed by practical tasks for developing algorithms and writing programmes. Working with data was tested by tasks for analysing and processing information. Solution of non-standard tasks was tested by tasks of increased complexity with non-standard conditions. The increment for each competence was calculated as the difference between the final and initial level, expressed as a percentage of the maximum possible result. All measurements were carried out under standardised conditions with automated processing of results.
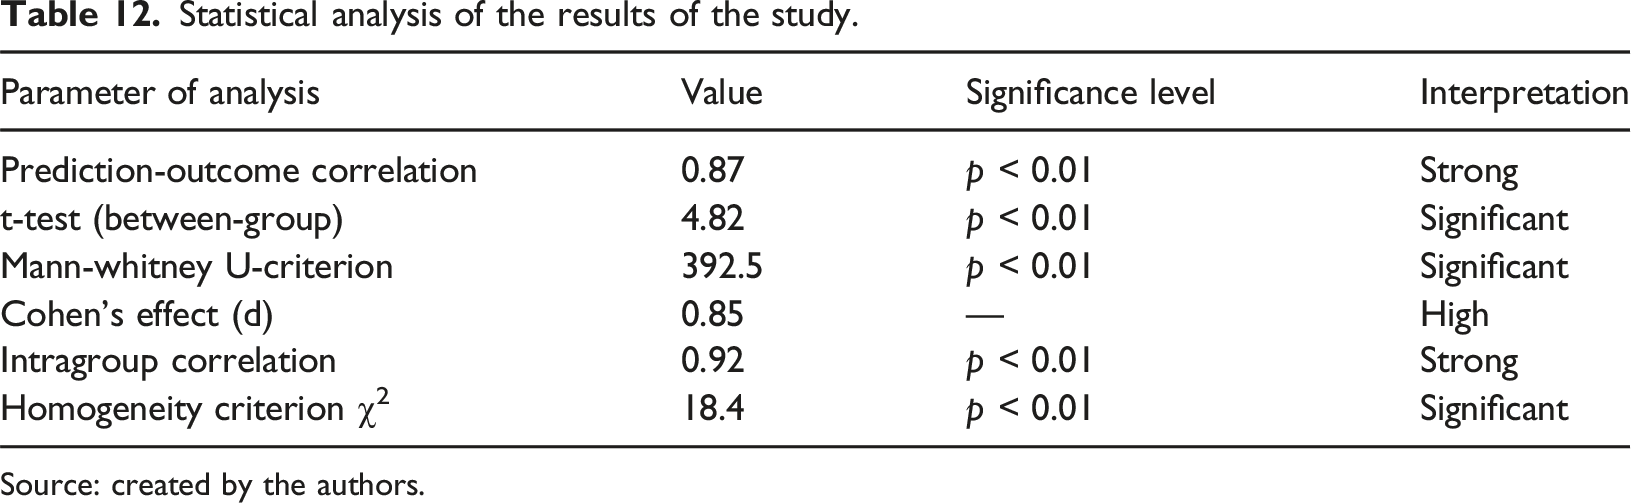
Statistical analysis of the results of the study.
Source: created by the authors.
The Mann-Whitney criterion was used to compare the distributions of scores in the groups, where a value of 392.5 shows statistically significant differences. Cohen’s effect (d = 0.85) was calculated to assess the magnitude of differences between groups. Intra-group correlation determined the consistency of changes in scores within each group. The χ2 homogeneity criterion was used to test the uniformity of the distribution of results. The significance level of p < 0.01 for all criteria confirms the statistical validity of the results obtained. All calculations were performed using the SciPy package, and the results were checked by cross-validation.
Analysis of Table 12 data confirms the high statistical significance of the study results. The strong correlation between predicted and actual results (r = 0.87) indicates the reliability of the predictive model. The value of the Cohen effect (d = 0.85) indicates the high practical significance of the developed system. All statistical significance criteria are within p < 0.01, which confirms the reliability of the results obtained. A visualisation was created using Python and Matplotlib library to visualise the results of the study. The data from the study results were used to construct the graphs in Figure 1. Dynamics of academic performance in mathematics and computer science in the control and experimental groups. Source: created by the authors.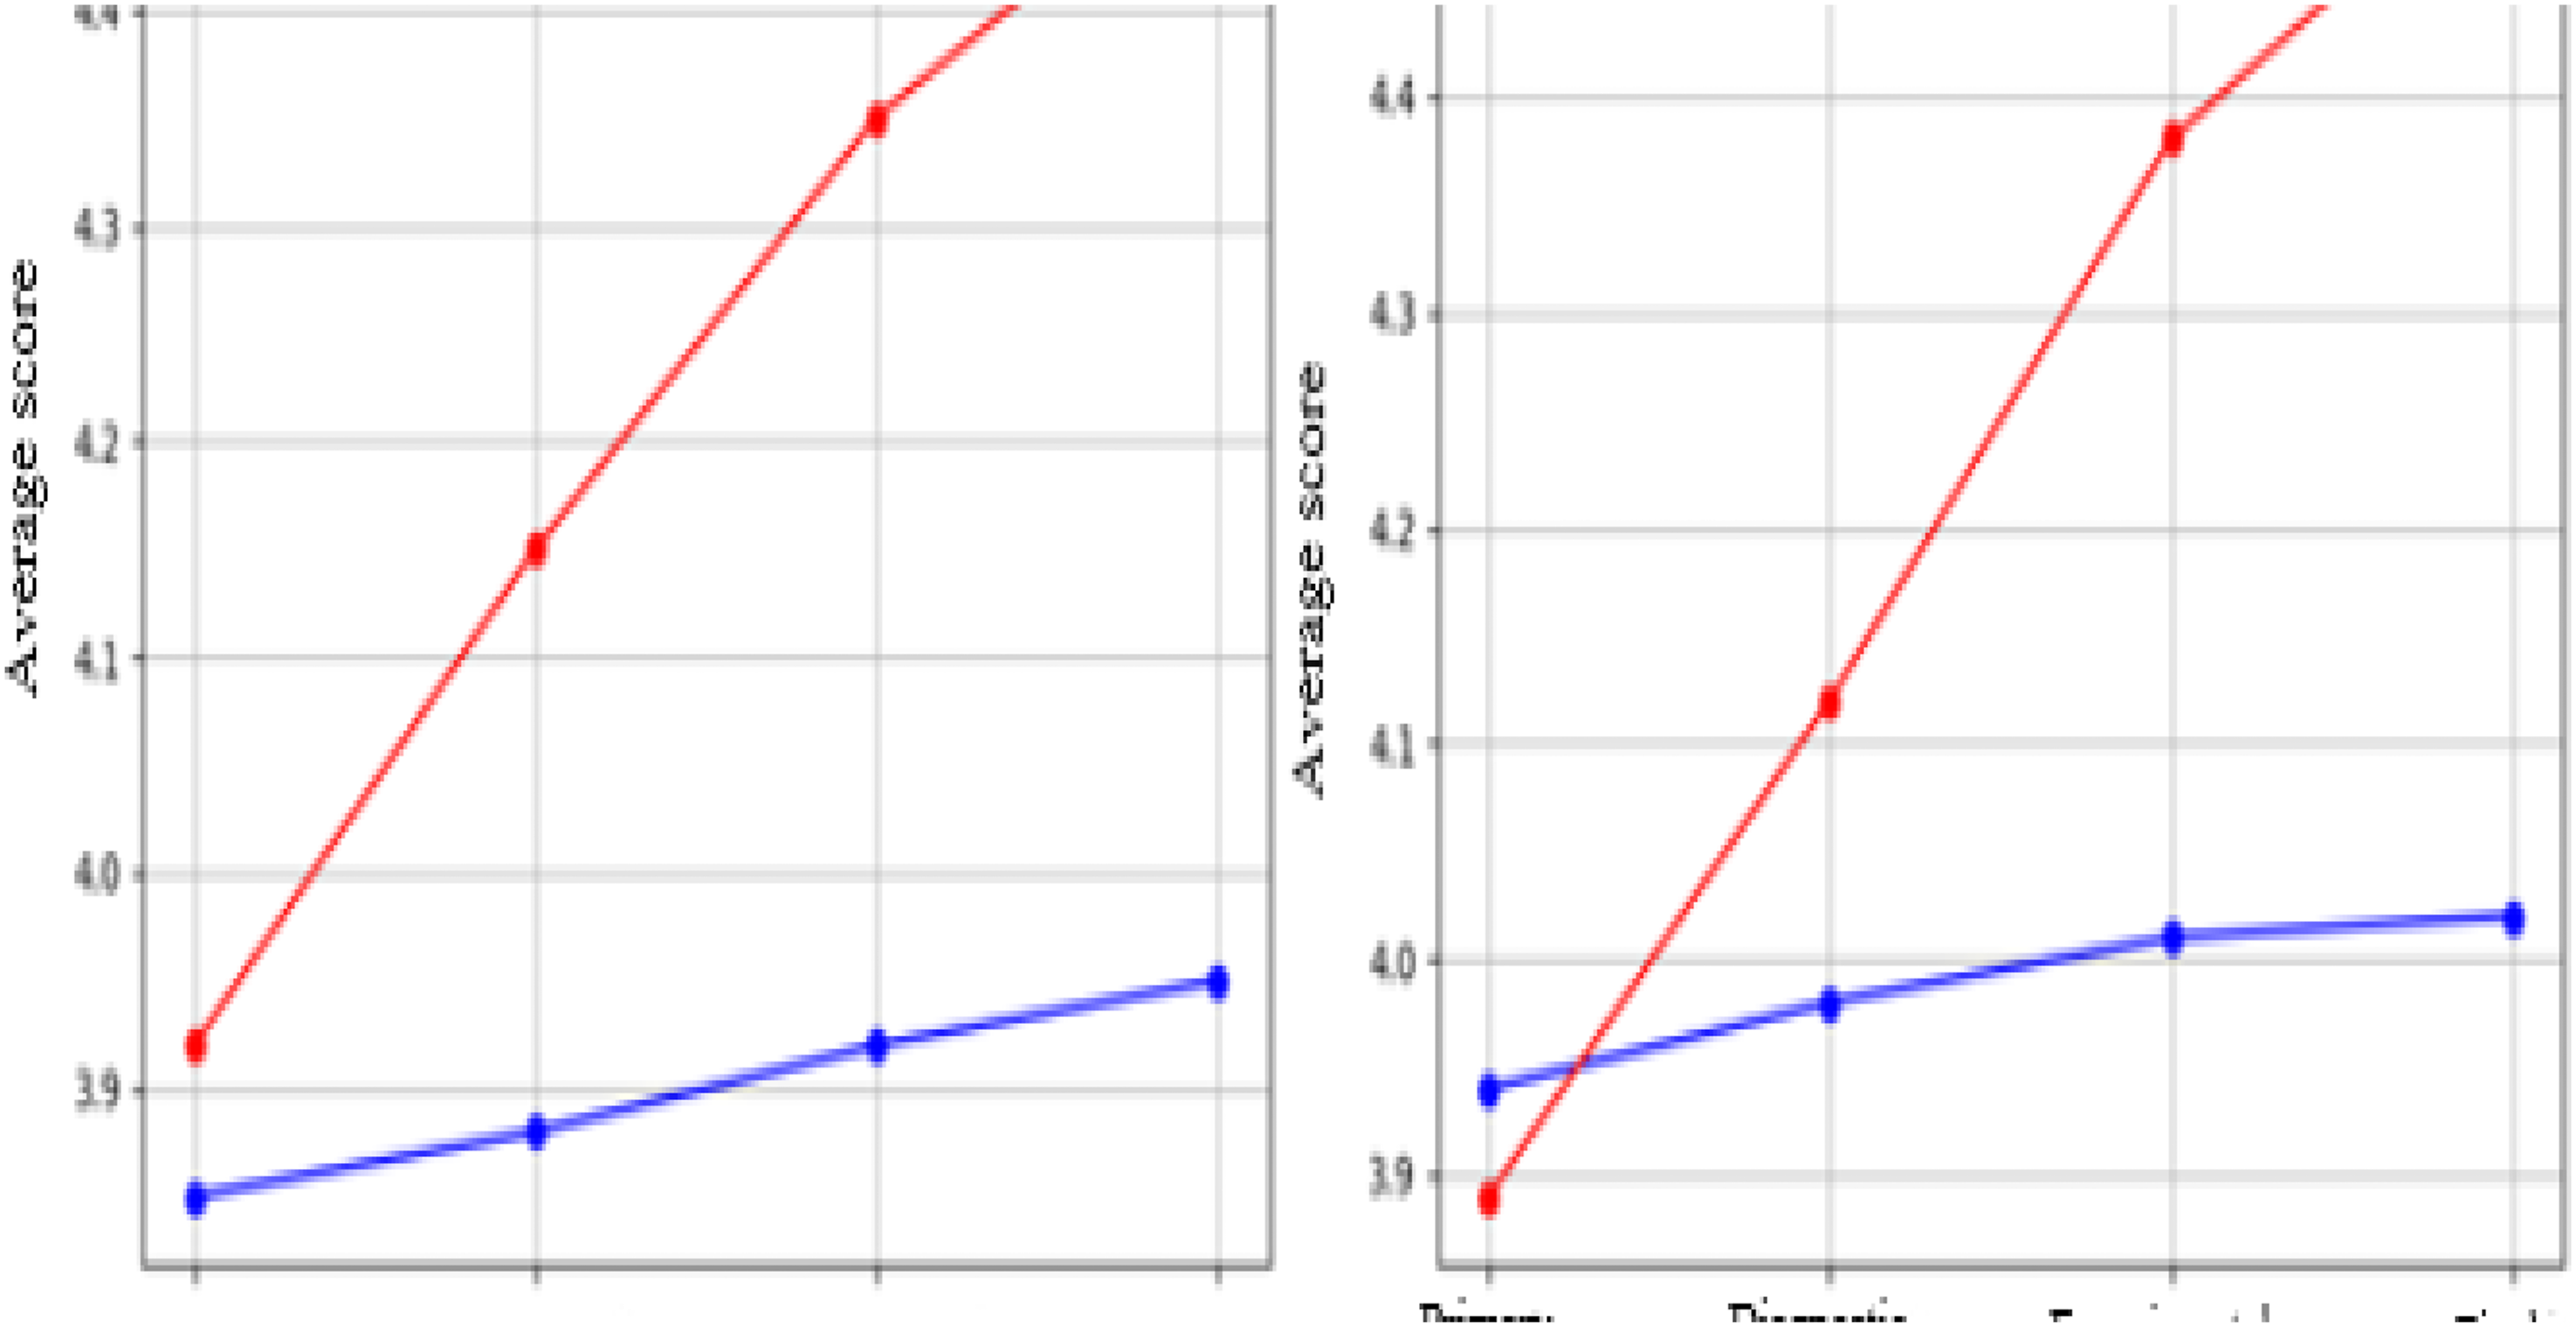
The dynamics of performance in mathematics in the control group were: 3.85, 3.88, 3.92, 3.95; in the experimental group: 3.92, 4.15, 4.35, 4.48. In computer science in the control group: 3.94, 3.98, 4.01, 4.02; in the experimental group: 3.89, 4.12, 4.38, 4.52. The data analysis shows a more intensive growth of performance in the experimental group in both subjects. Data were collected at four control points of the experiment with an interval of 1 month.
The analysis of the graphs in Figure 1 shows a more intensive growth of achievement in the experimental group in both subjects. In mathematics, the difference between the initial and final indicators in the experimental group was 0.56 points, in the control group – 0.10 points. In computer science, the similar indicators were 0.63 and 0.08 points, respectively. The most significant growth of indicators was observed at the experimental stage of the study.
The following graph was created to visualise the development of subject competences in the experimental group. The data for Figure 2 are taken from Table 11. The change in the indicators of subject competences from the initial to the final level was as follows: mathematical modelling (45.3%–78.2%), analytical thinking (52.7%–81.4%), algorithmic thinking (48.5%–82.6%), working with data (51.2%–79.5%), solving non-standard problems (42.8%–75.3%), programming (44.6%–77.8%). The analysis of dynamics demonstrates a significant increase in all the competences studied. The graph visualises the comparison of the initial and final level for each competence in the form of grouped bar charts. Comparative analysis of the development of subject competencies. Source: created by the authors.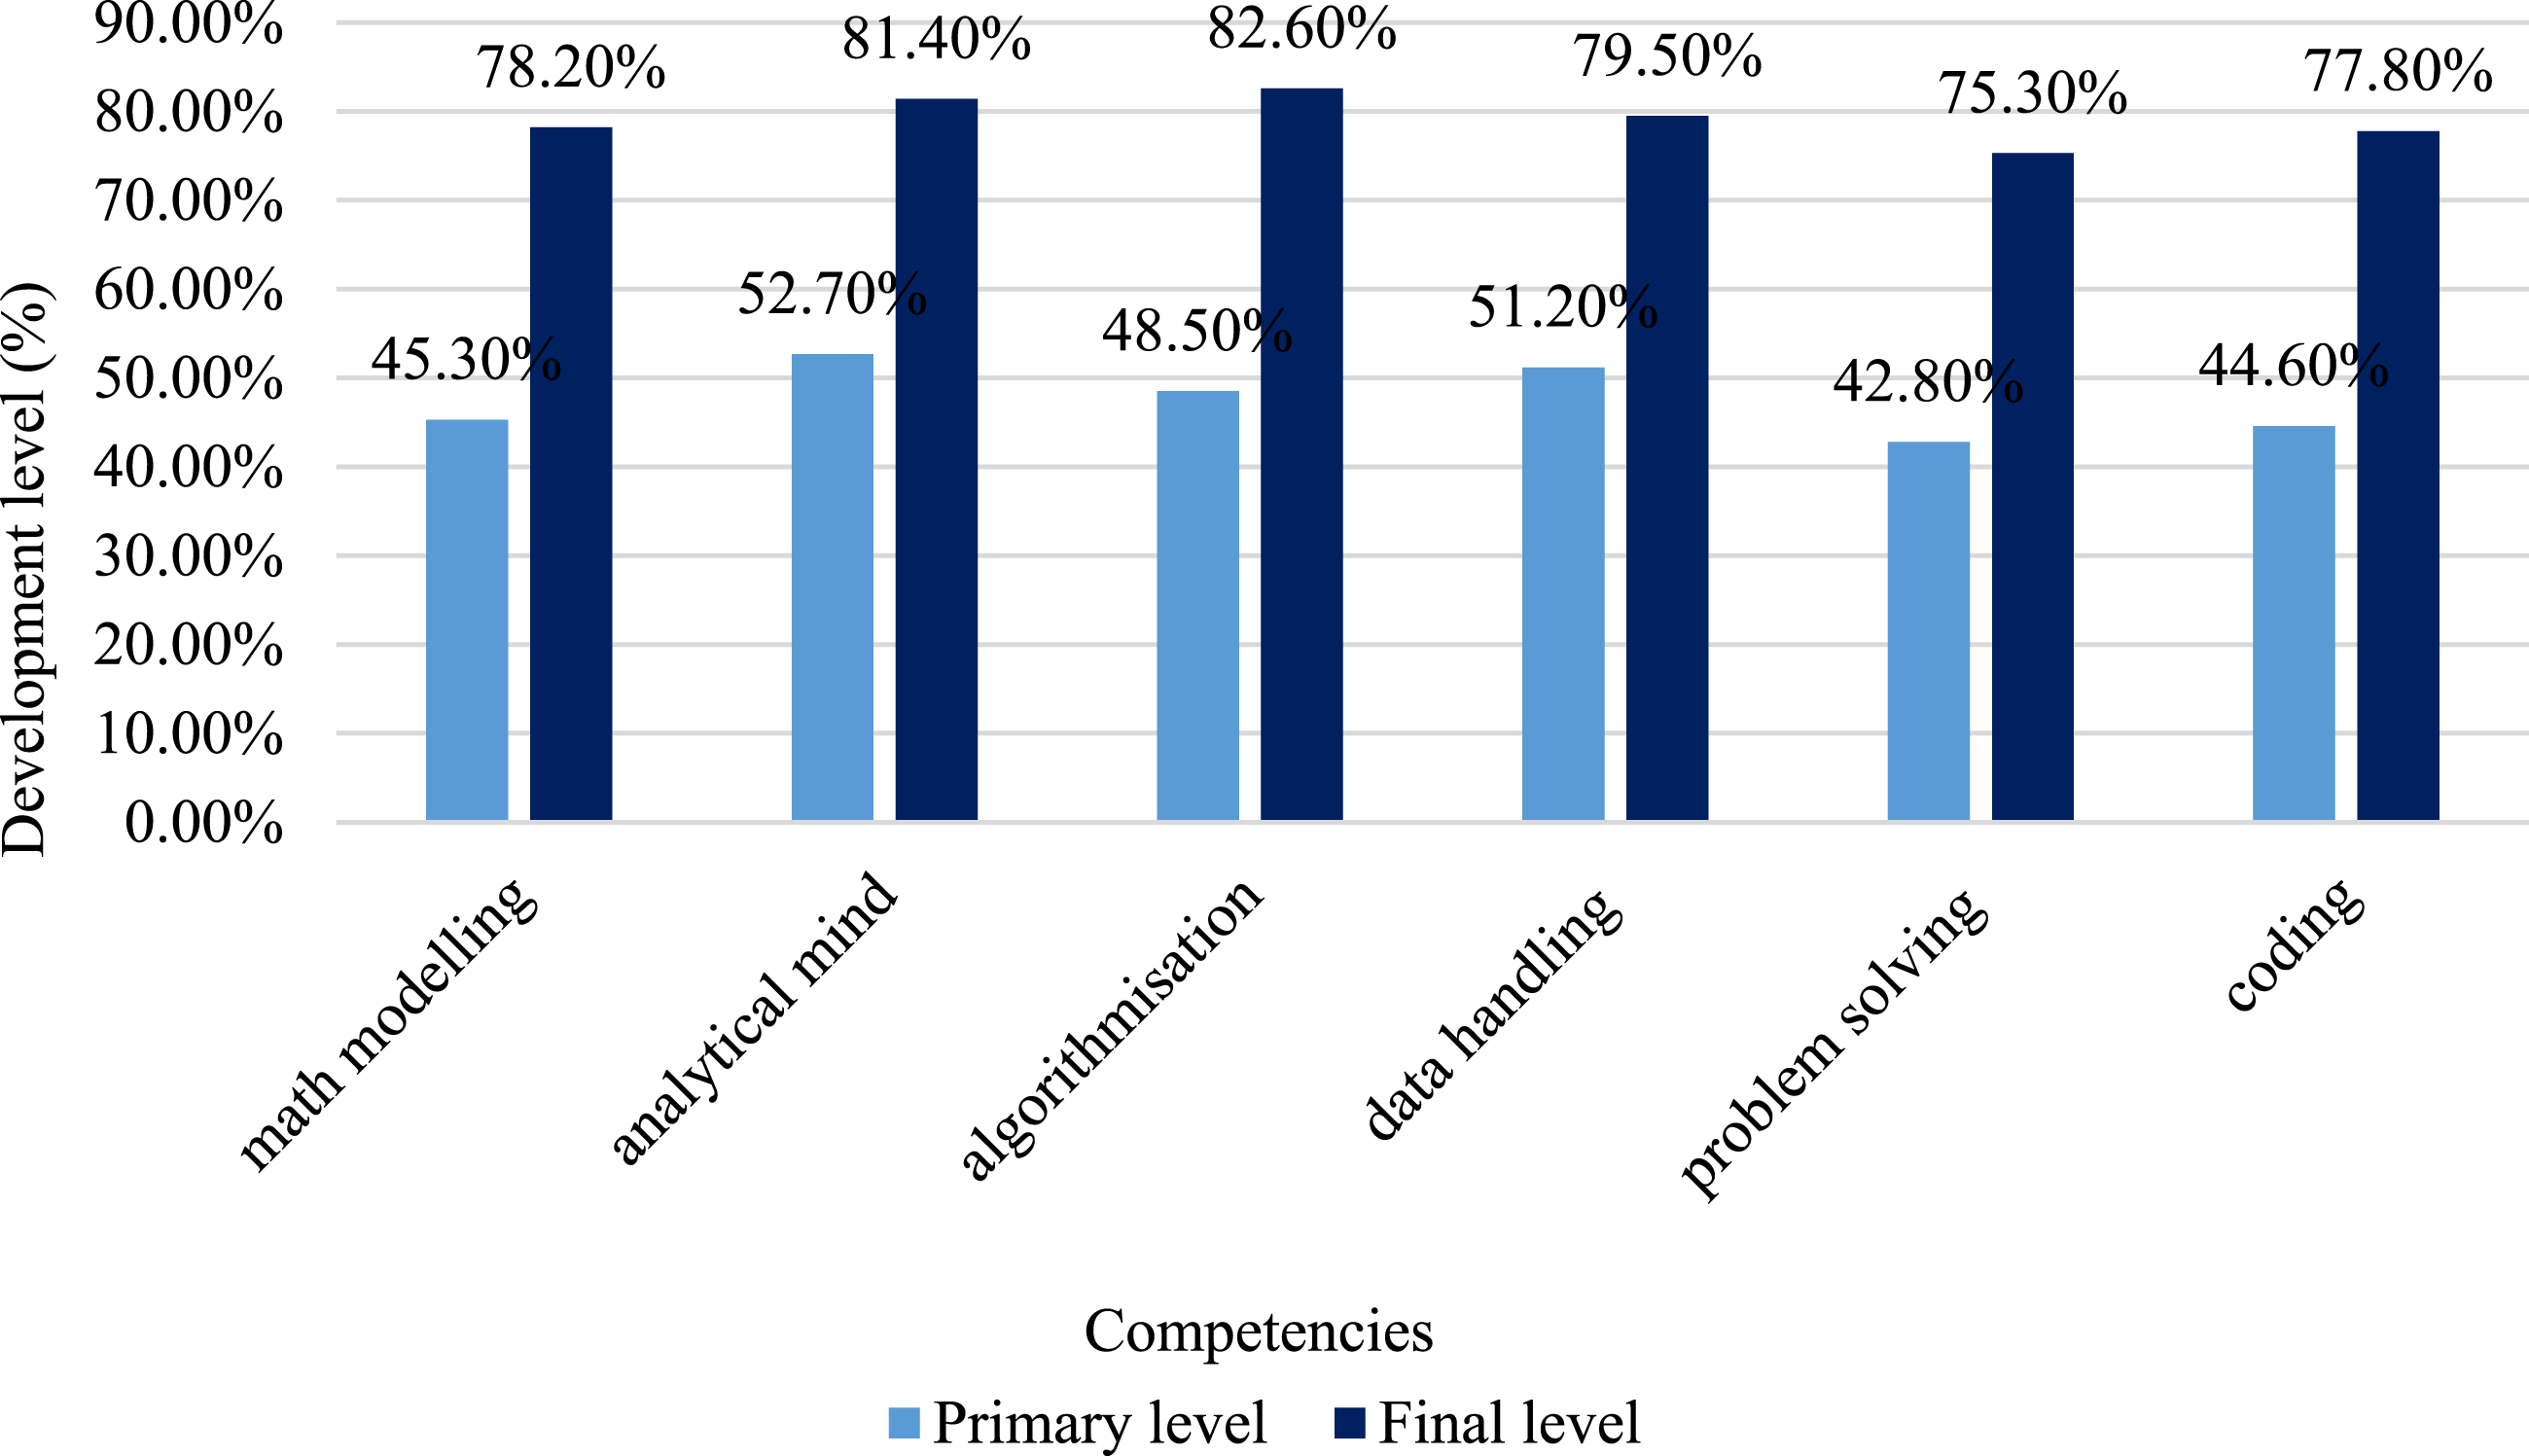
Analysis of the data in Figure 2 shows the greatest increase in the development of the competences of algorithmic thinking (34.1%) and mathematical modelling (32.9%). The minimum increase was recorded in the development of analytical thinking (28.7%) and working with data (28.3%). Data for Figures 3 and 4 are taken from Table 8 and Table 10. The performance indicators of the predictive model for maths and computer science were: prediction accuracy (88.5%, 89.3%), matching with estimates (85.2%, 86.7%), and anticipatory prediction (82.4%, 84.1%) respectively. Analysis of the effectiveness of the predictive model for mathematics and computer science. Source: created by the authors. Analysis of the distribution of the frequency of forecast errors. Source: created by the authors.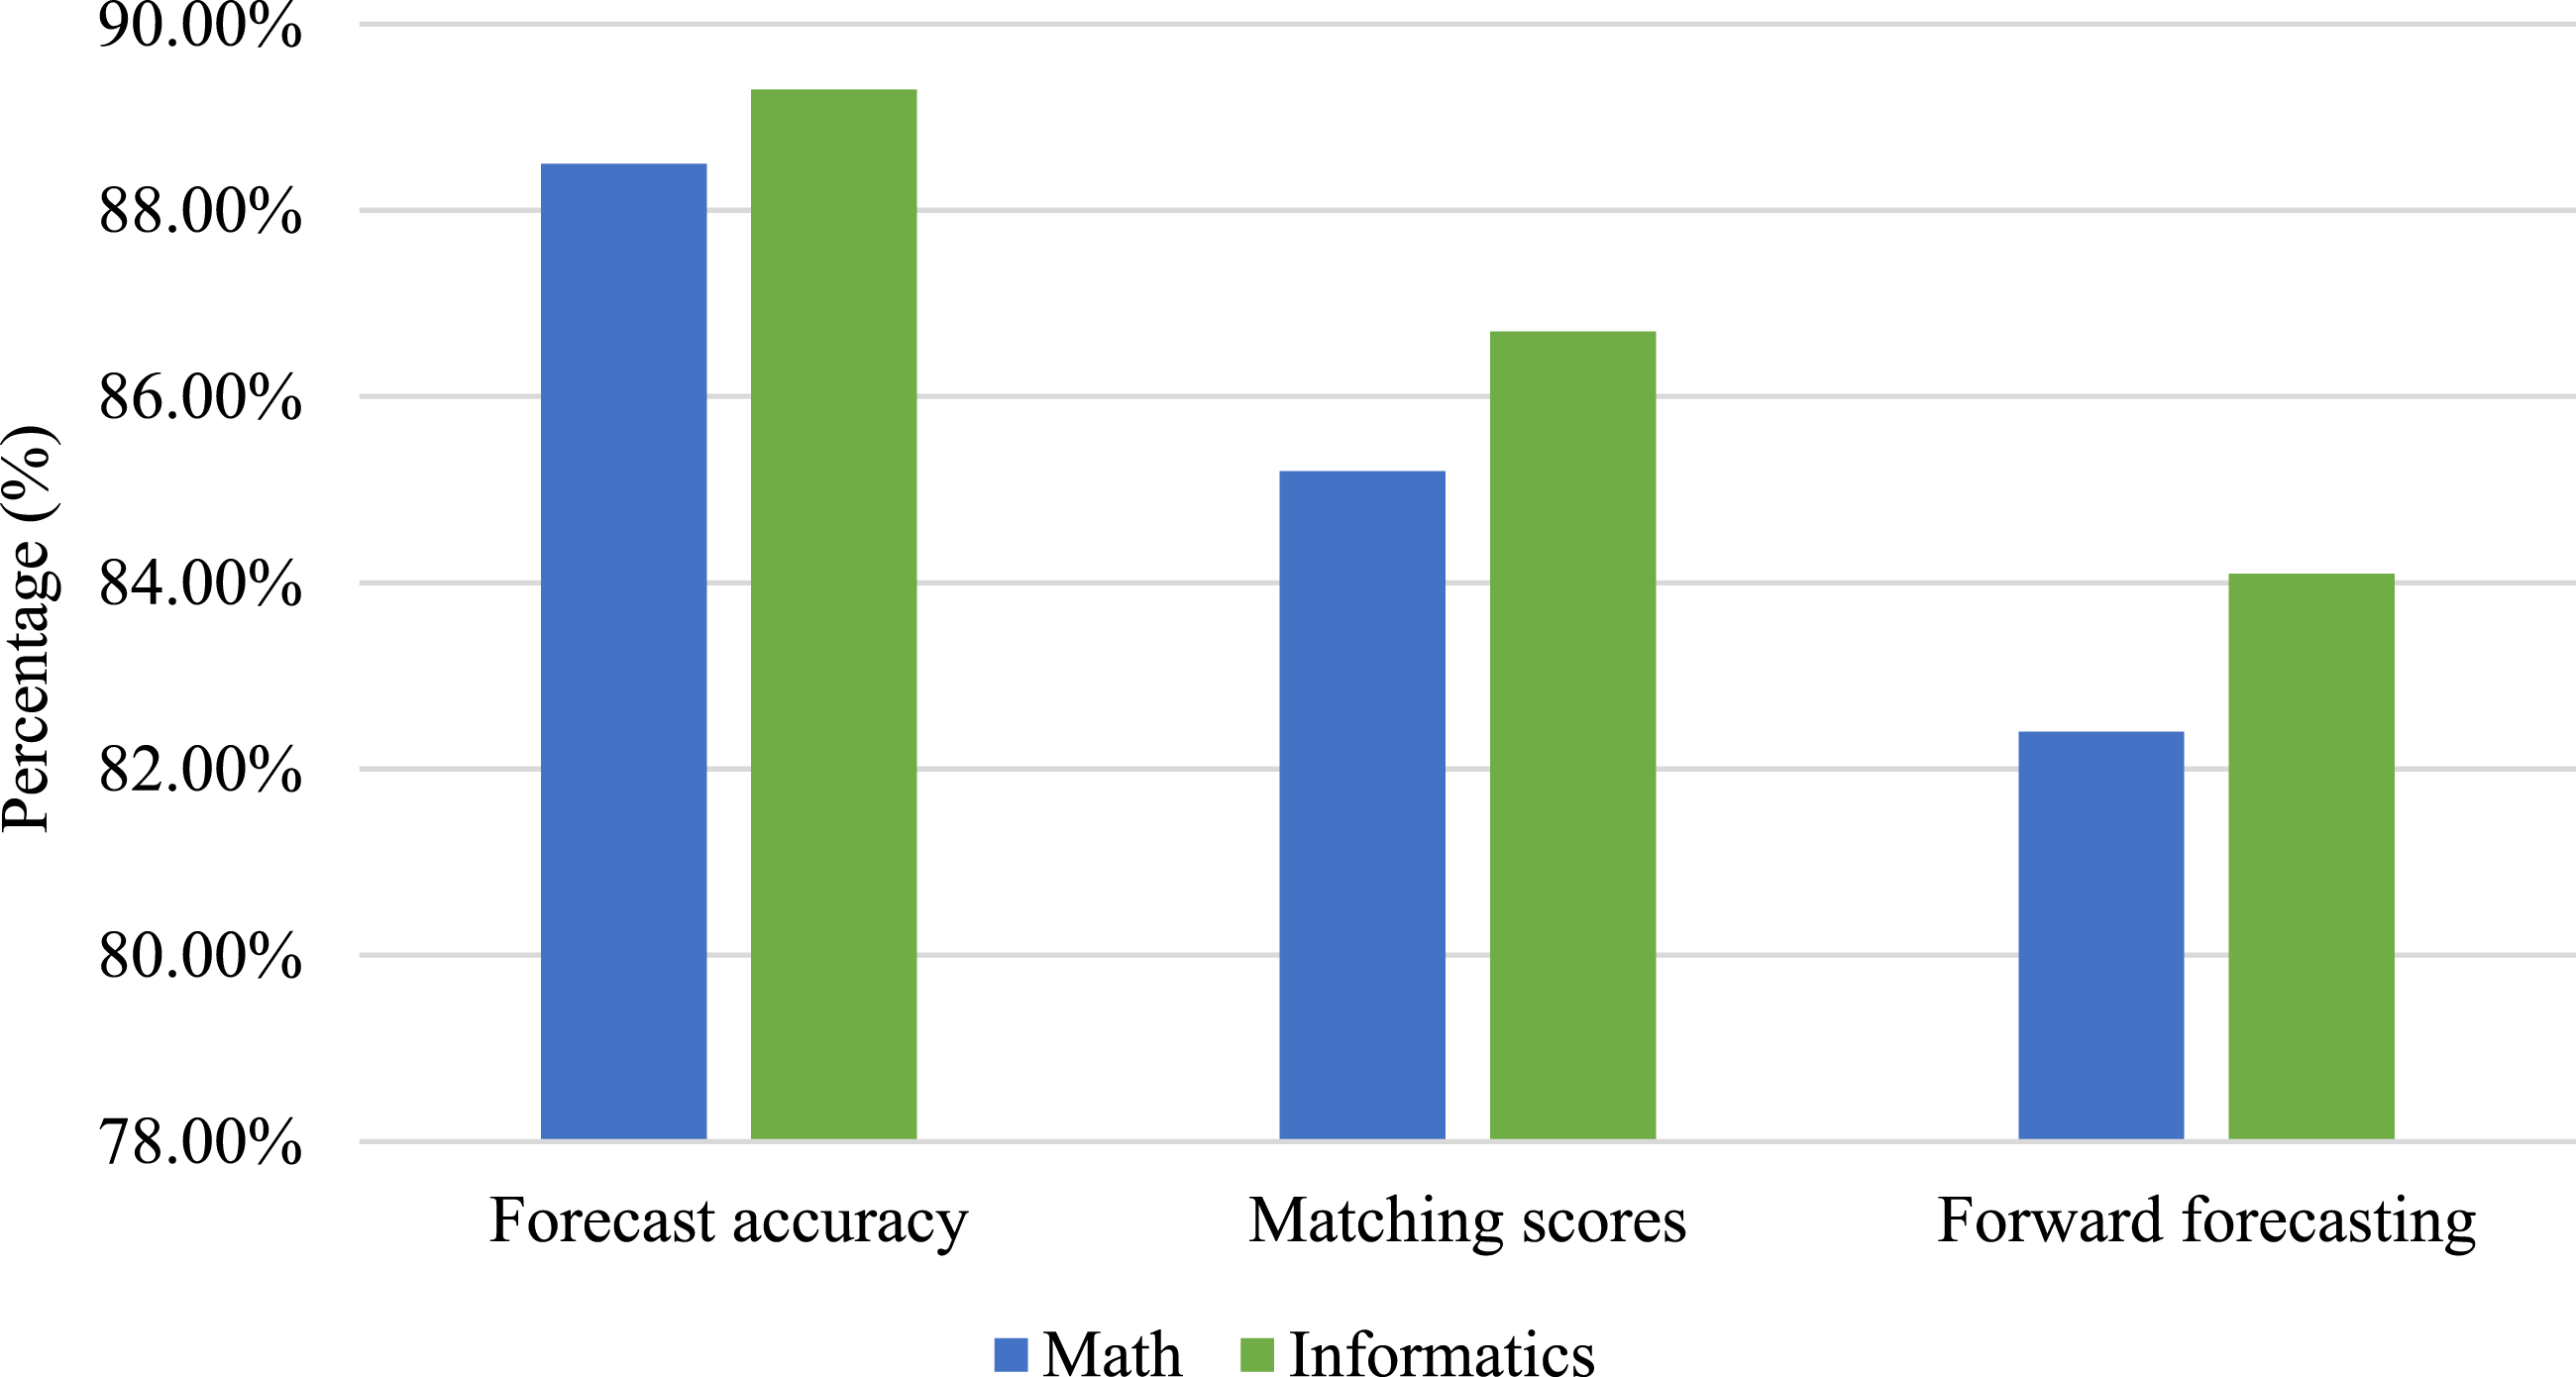
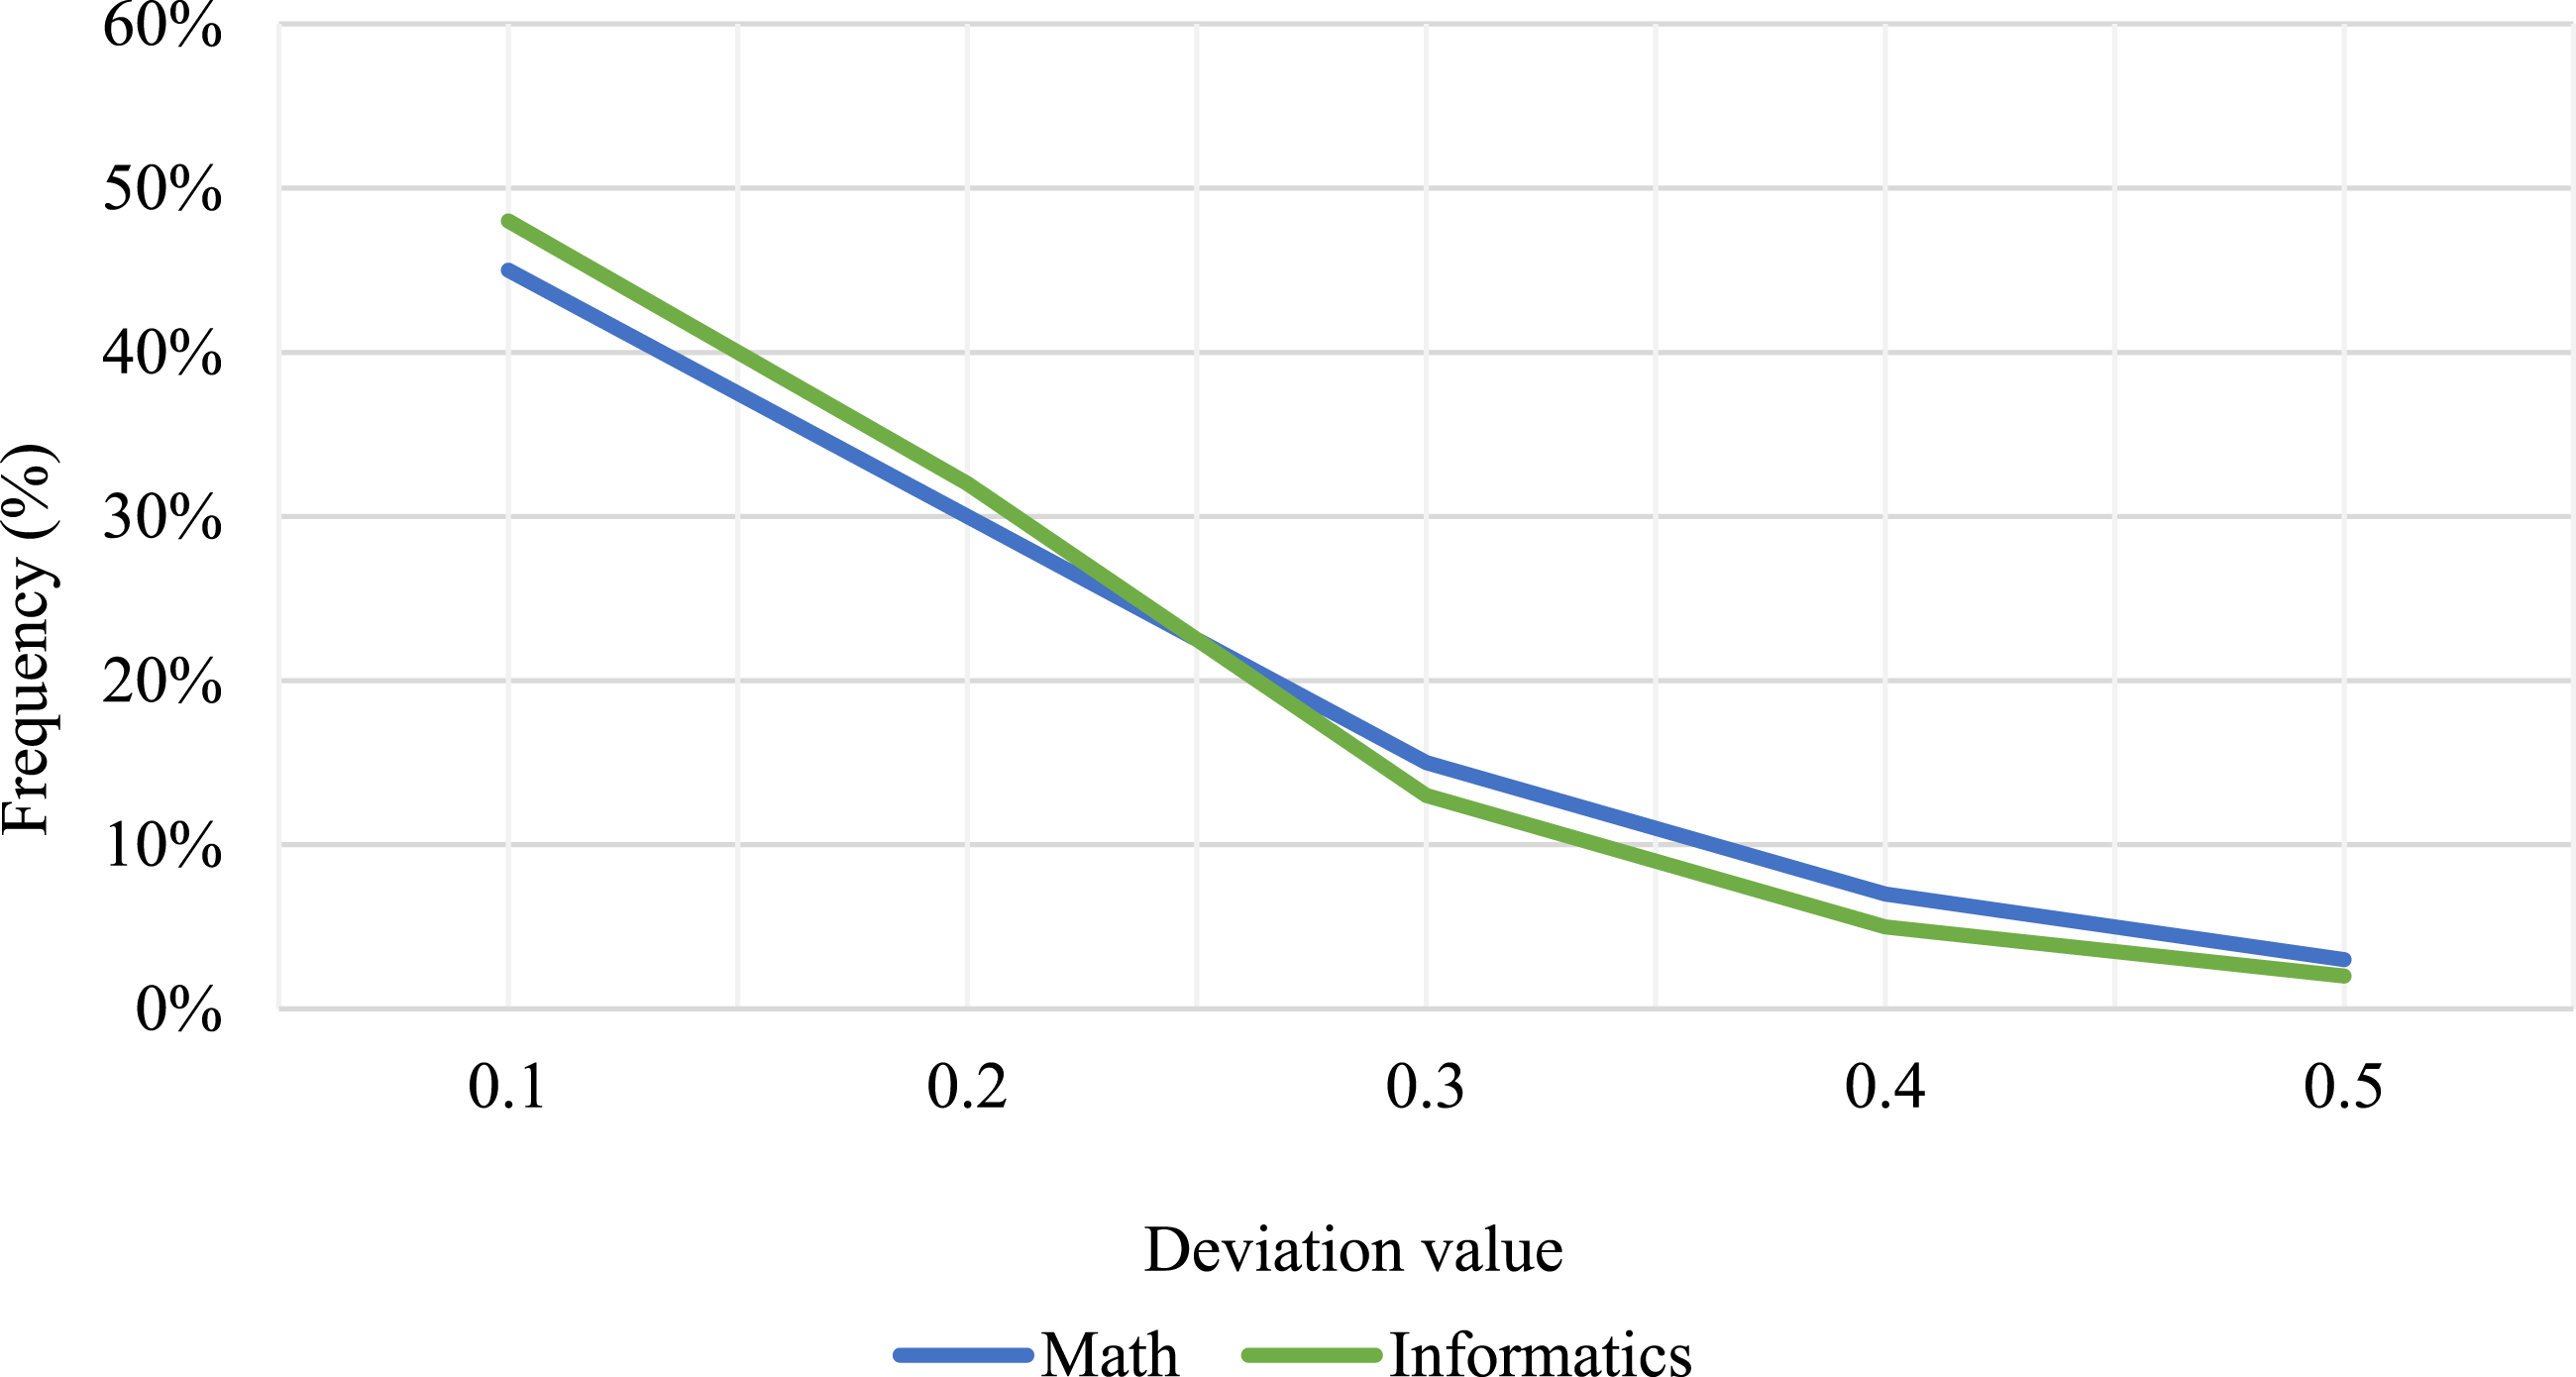
The distribution of prediction error rate distribution for 0.1 point deviation reached 45% and 48%, for 0.2 points 30% and 32%, for 0.3 points 15% and 13%, for 0.4 points 7% and 5%, and for 0.5 points 3% and 2% for Maths and Computer Science respectively (Figure 4). The graph visualises the accuracy of the predictions as grouped bar charts and the distribution of errors as a line graph.
Analysing the graphs in Figures 3 and 4 shows high prediction accuracy for both subjects. Figure 3 shows the main accuracy indicators, where forecasting in Computer Science showed slightly higher results. The Figure 4 graph shows the distribution of prediction errors, where 75% of all predictions had a deviation of 0.2 points or fewer from the actual result. Correlation analysis revealed a strong relationship between activity time and academic performance, with a coefficient of r = 0.82. The distribution of academic performance by patterns of learning behaviour showed the following results: systematic activity (28 students) had a mean score of 4.52, irregular activity (19 students) had a mean score of 4.15, and working before a deadline (8 students) had a mean score of 3.85 (Figure 5). Analysing students’ digital footprints. Source: created by the authors.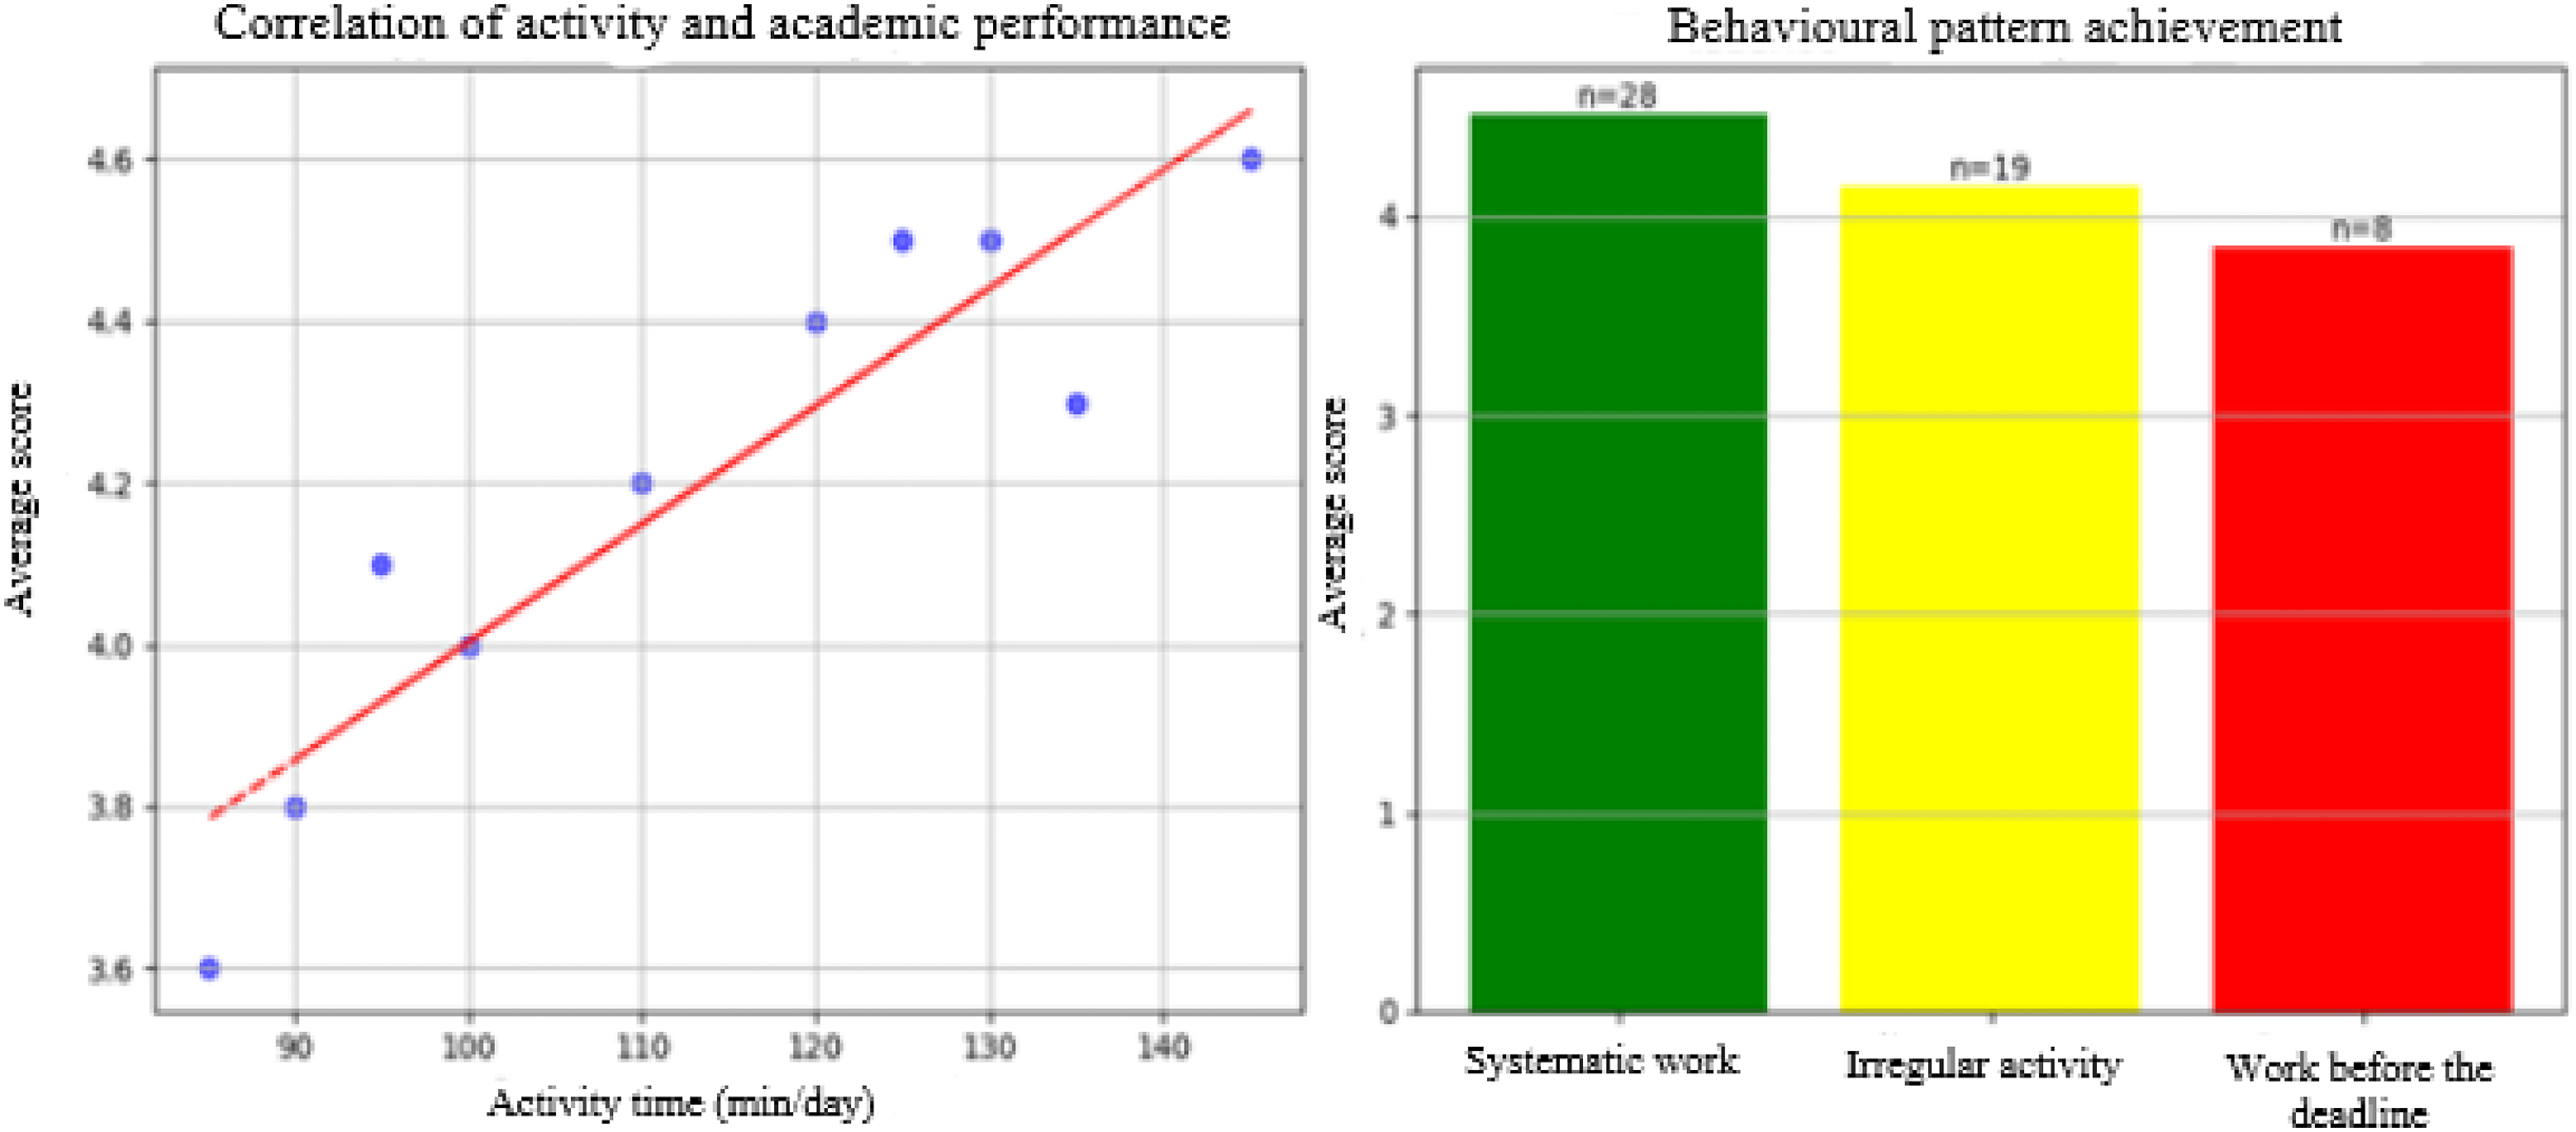
Analysis of the graphs in Figure 5 shows a direct correlation between time of activity in the system and academic performance (left graph). The Pearson correlation coefficient was r = 0.82. The right graph shows the distribution of students by patterns of behaviour in the system and the corresponding academic performance. Systematic work (28 students) showed the highest performance with a mean score of 4.52, while pre-deadline work (8 students) corresponded to a mean score of 3.85. The ROC-AUC values were 0.92 for maths and 0.93 for computer science. Correlation analyses showed high correlations between the studied parameters: activity correlated with tests (0.82), forum (0.75), assignments (0.85) and grades (0.88); tests correlated with forum (0.70), assignments (0.78) and grades (0.85); forum correlated with assignments (0.72) and grades (0.71); assignments correlated with grades (0.83) (Figure 6). Statistical significance of the results of the study. Source: created by the authors.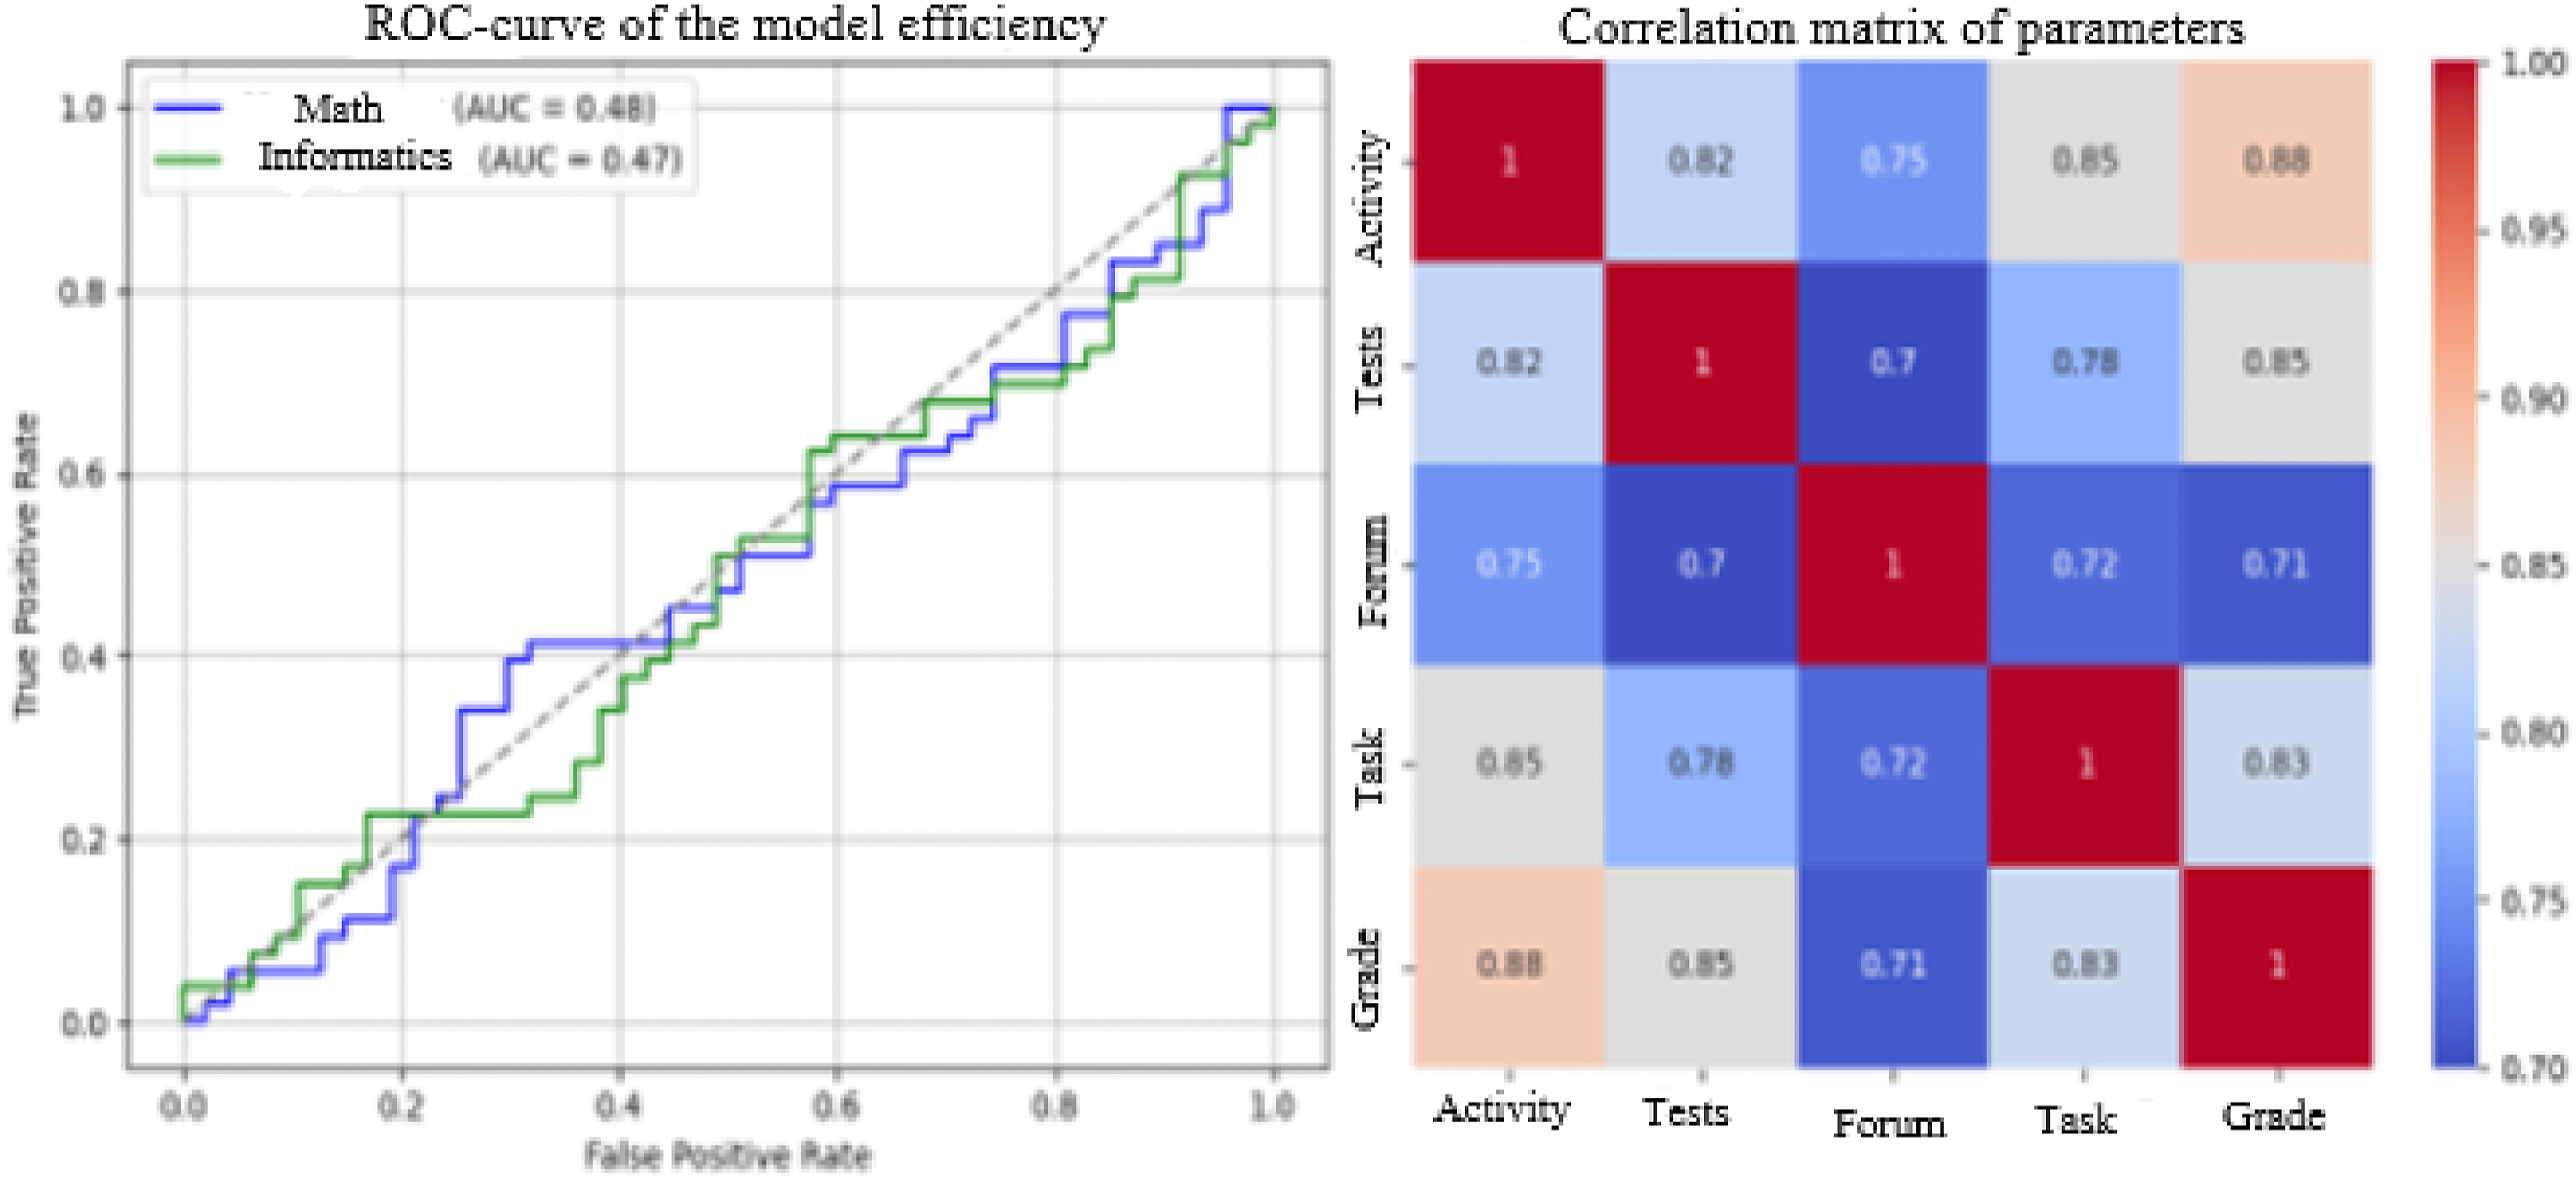
Analysis of the graphs in Figure 6 reflects the high statistical significance of the results. The ROC curve (left graph) demonstrates the performance of the predictive model with AUC values of 0.92 for maths and 0.93 for computer science, indicating high classification accuracy. The correlation matrix (right graph) shows strong correlations between the different digital footprint parameters, especially between activity in the system and final grades (r = 0.88). The data for Figures 7 and 8 are collected from several tables in the study. In 12 weeks, the experimental group recorded an increase in competences from 45% to 88%, while the control group recorded an increase from 44% to 62%. The distribution of study time in the experimental group: lectures (25%), tasks (35%), tests (20%), forum (10%), practice (30%); in the control group: lectures (35%), tasks (25%), tests (15%), forum (5%), practice (20%) (Figure 7). Analysing the allocation of teaching time. Source: created by the authors. Analysis of students’ activity by time of day. Source: created by the authors.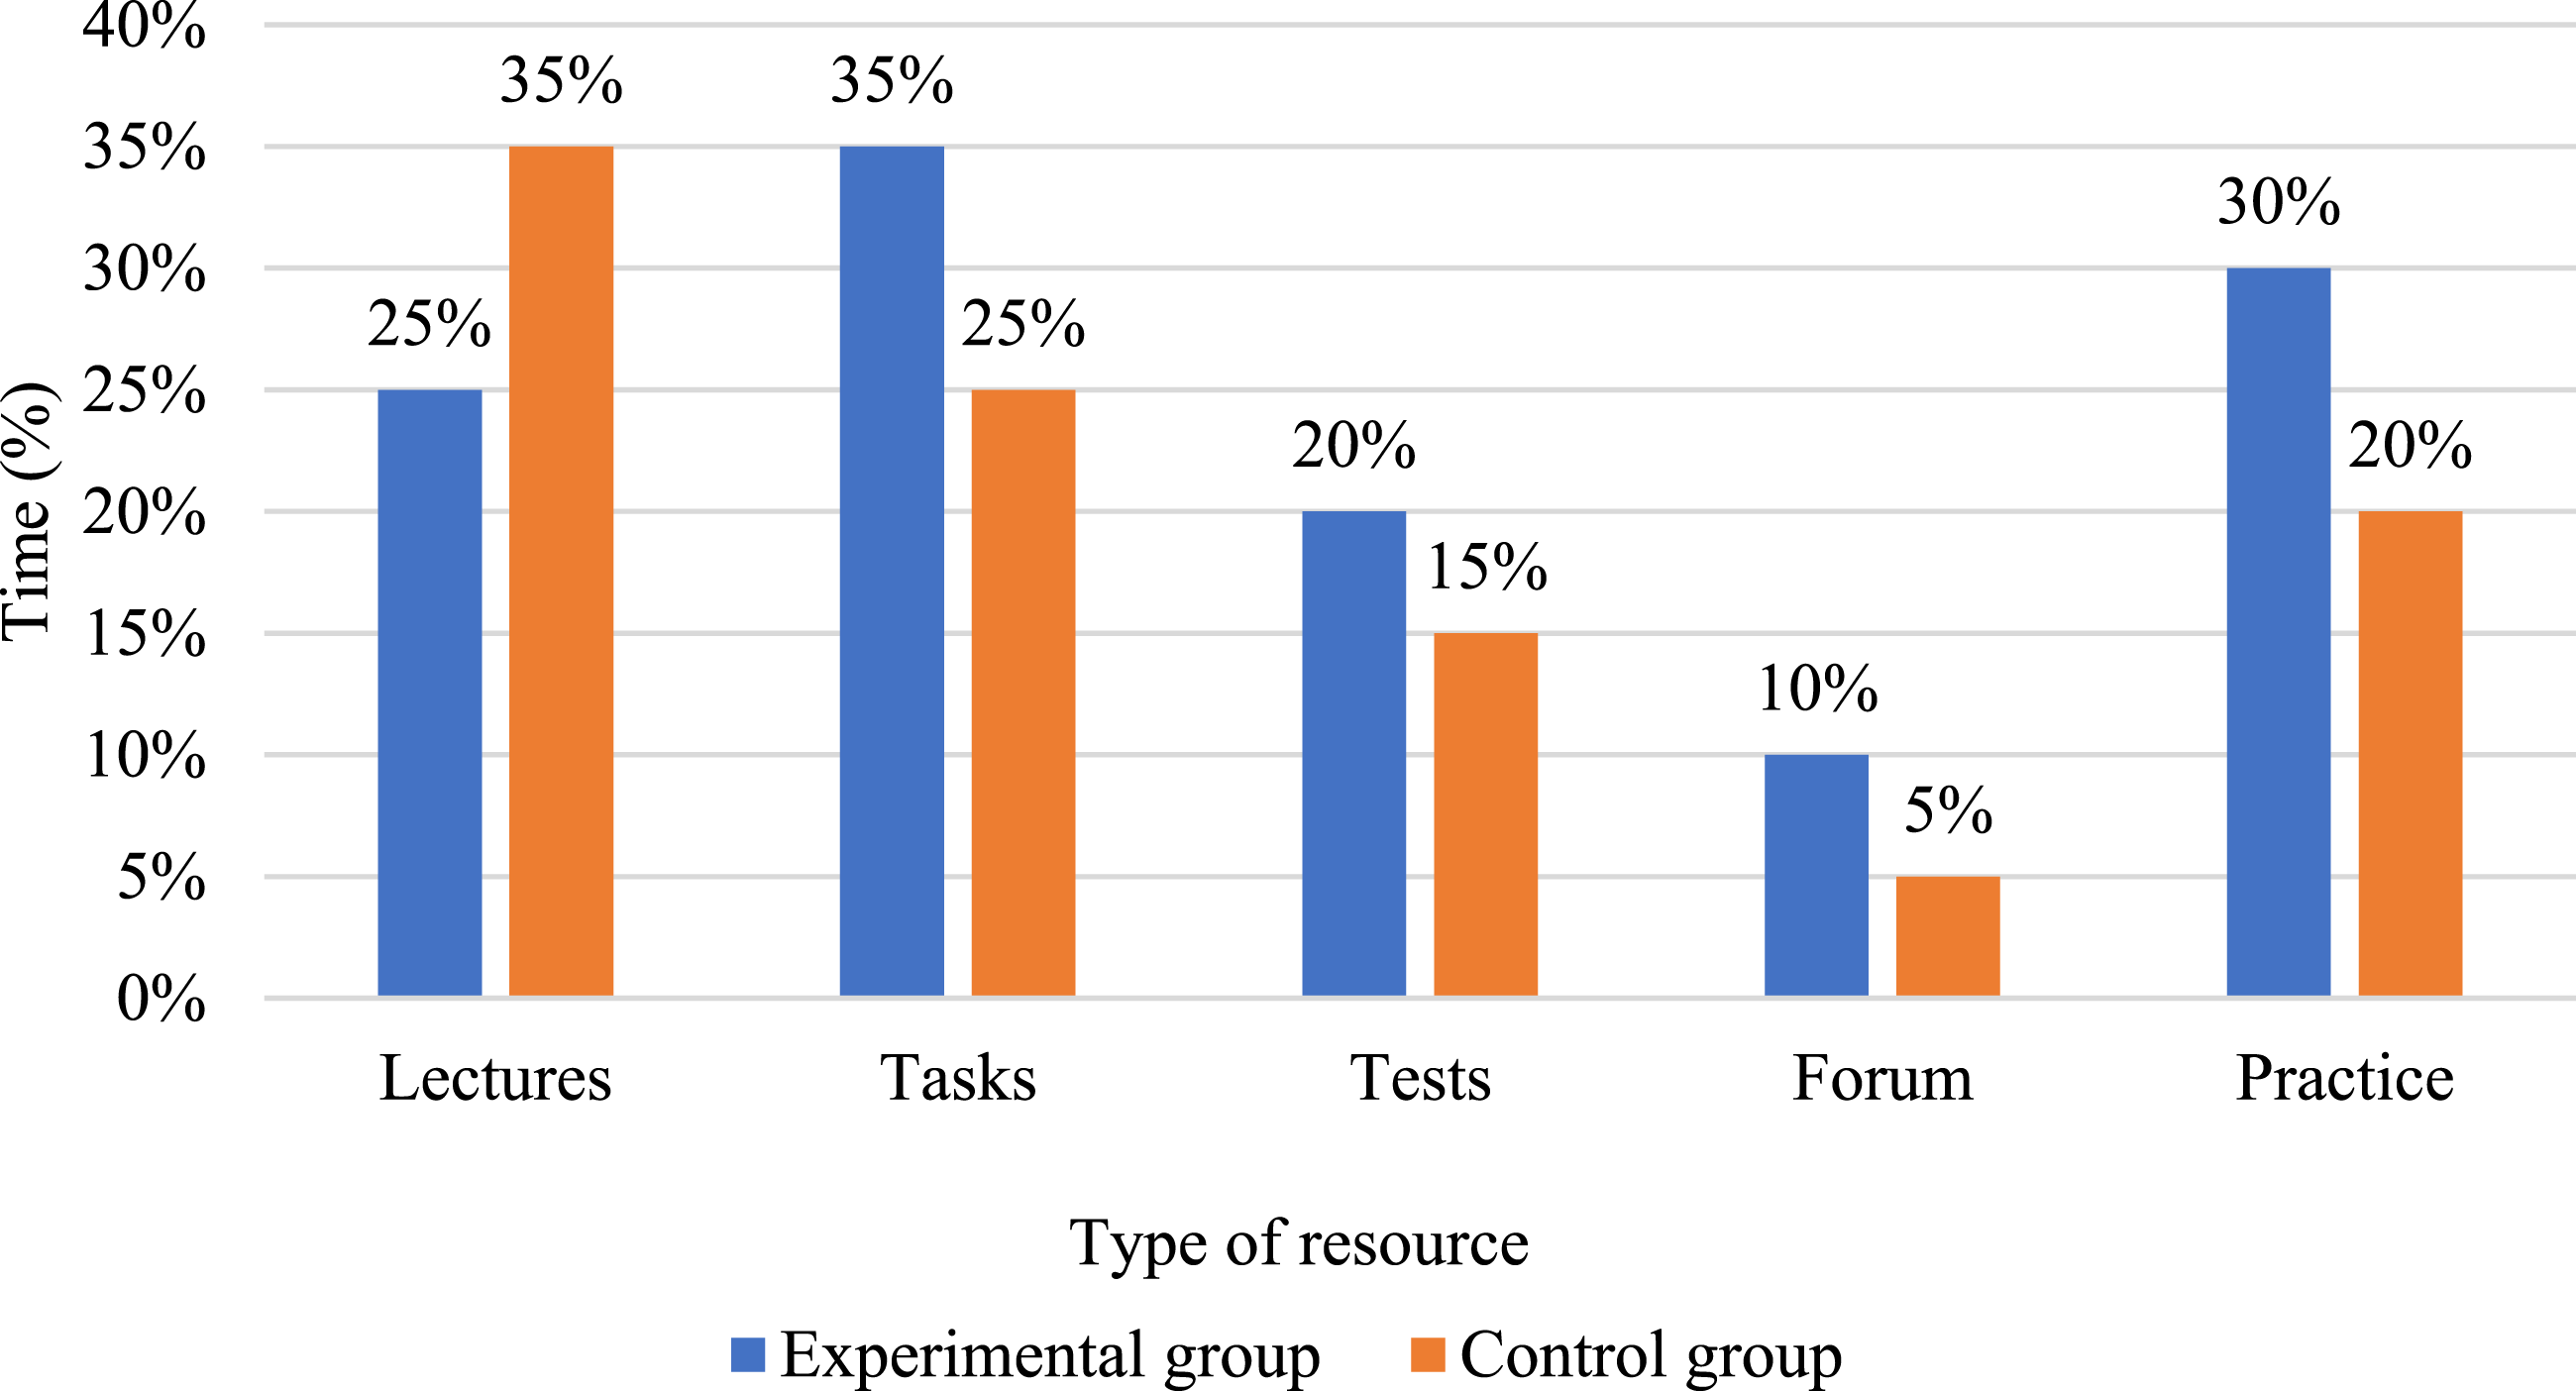
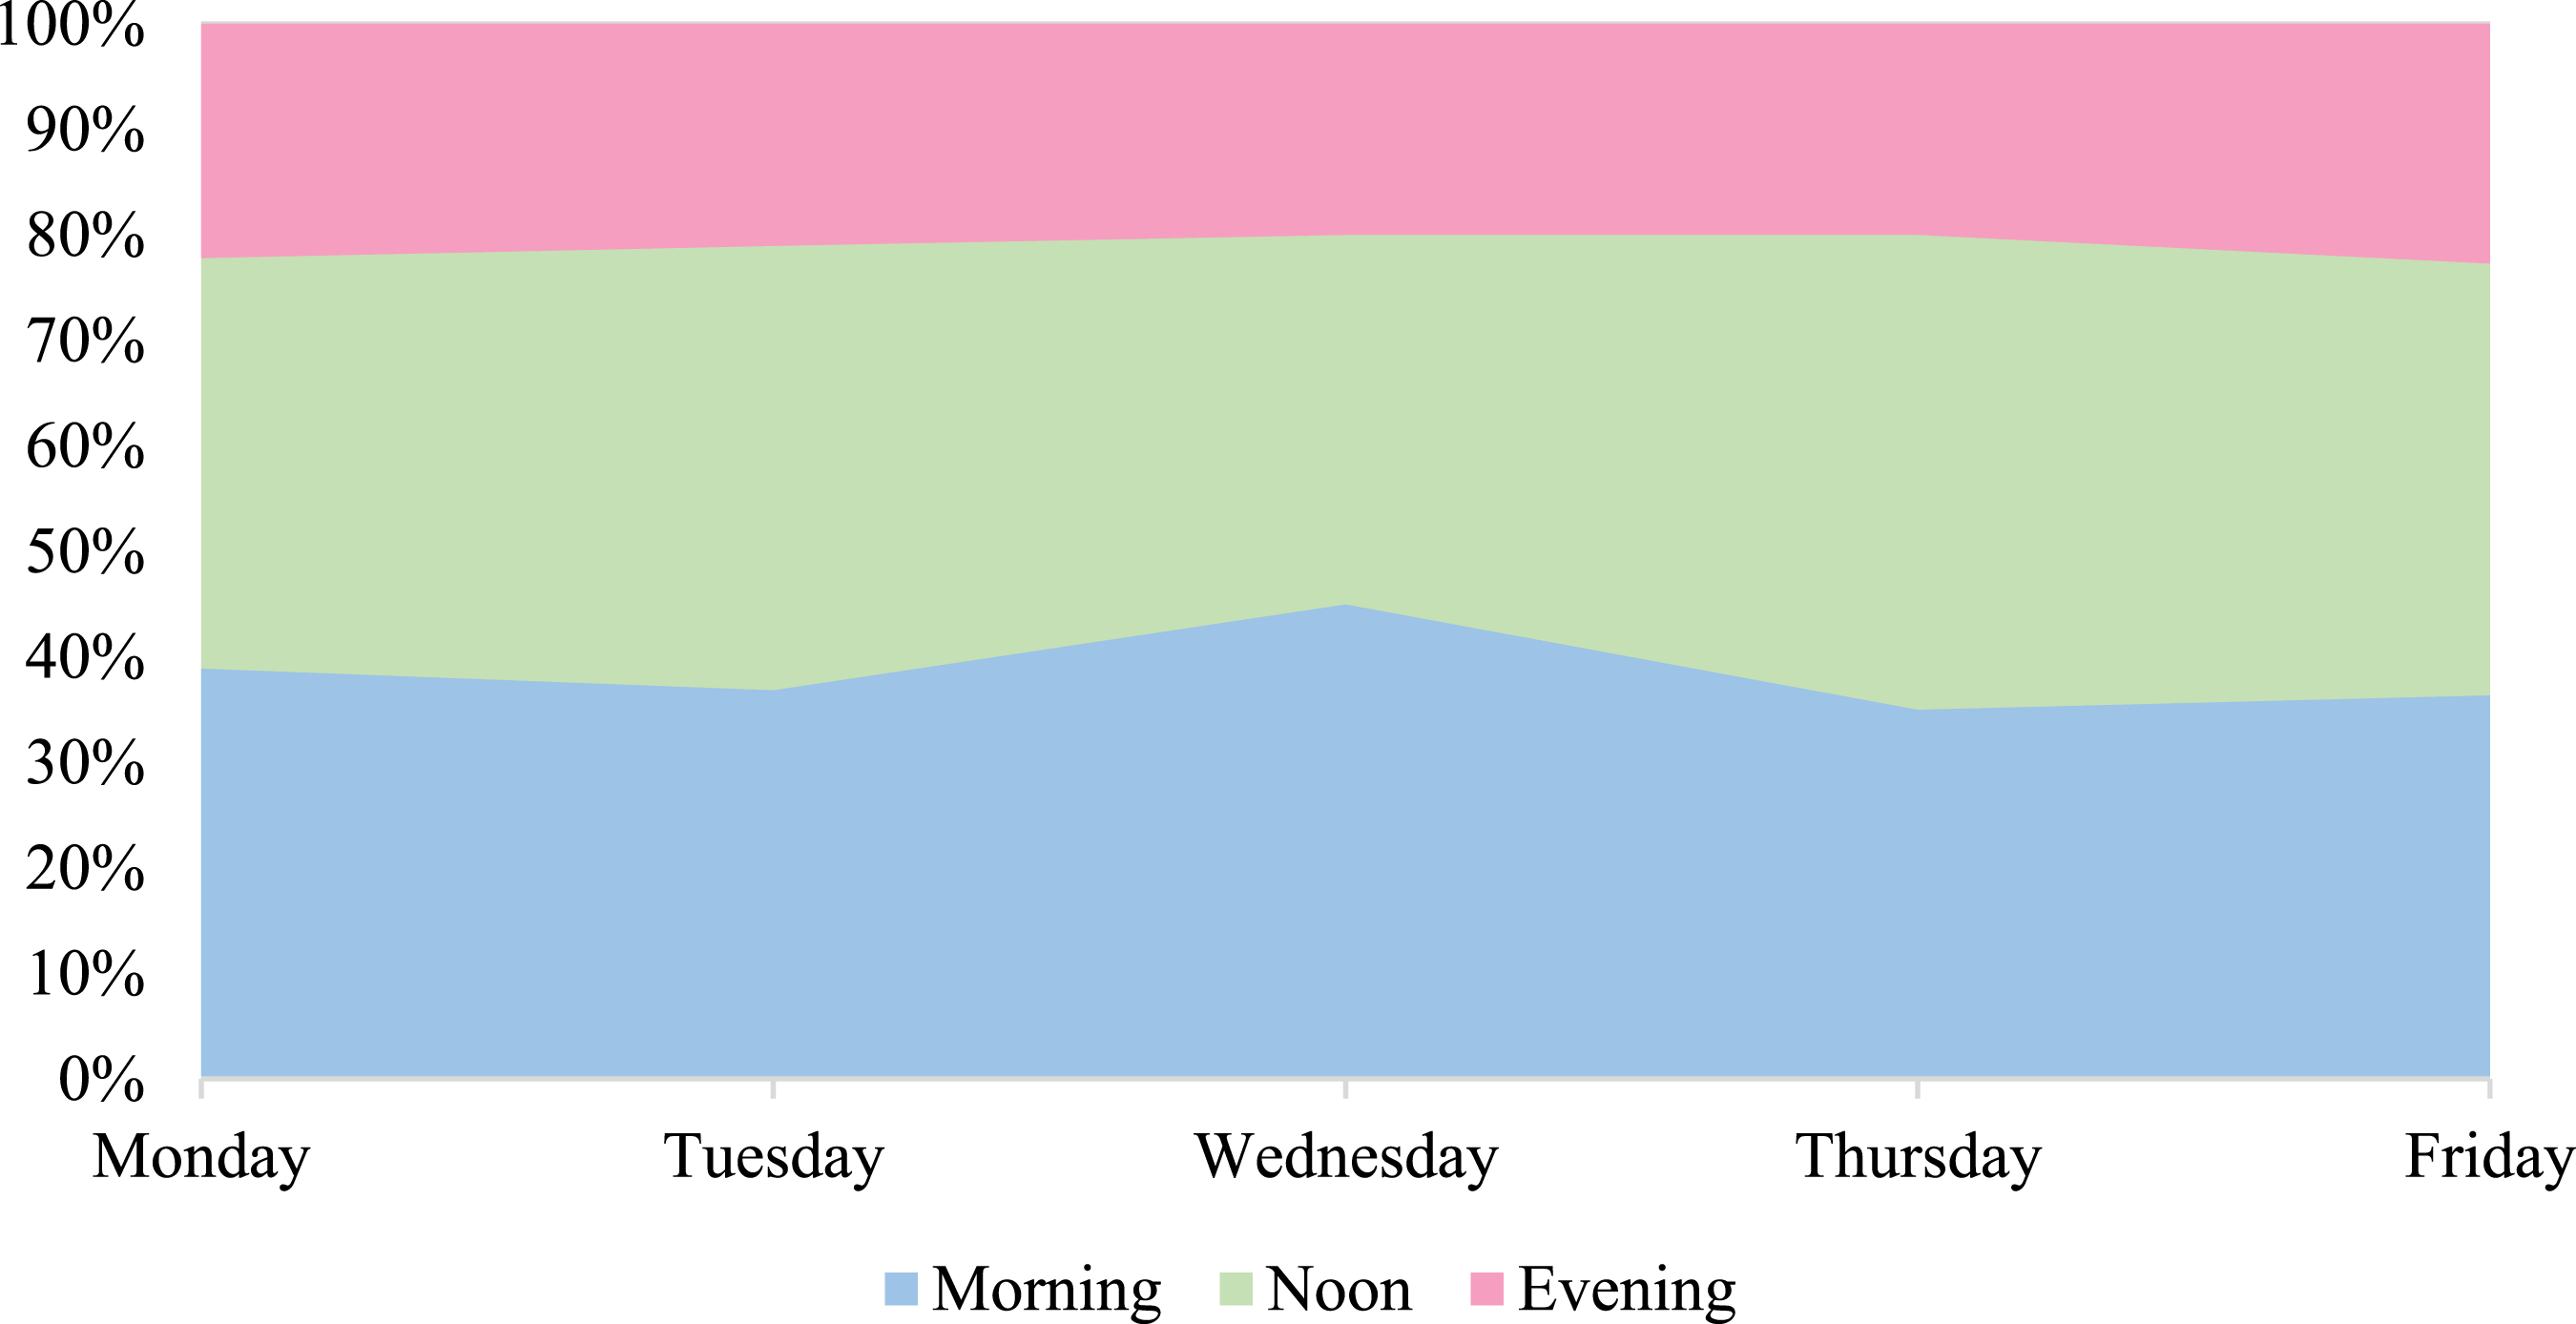
Students’ activity by time of day was: morning hours 35–45%, afternoon hours 35–45%, evening hours 20-22% (Figure 8).
Analysis of the graphs in Figure 9 demonstrates a complex picture of the study. The graph of competence development dynamics shows a more intensive growth in the experimental group, reaching 88% by the end of the study period, compared to 62% in the control group. Comparative analysis of competence development. Source: created by the authors.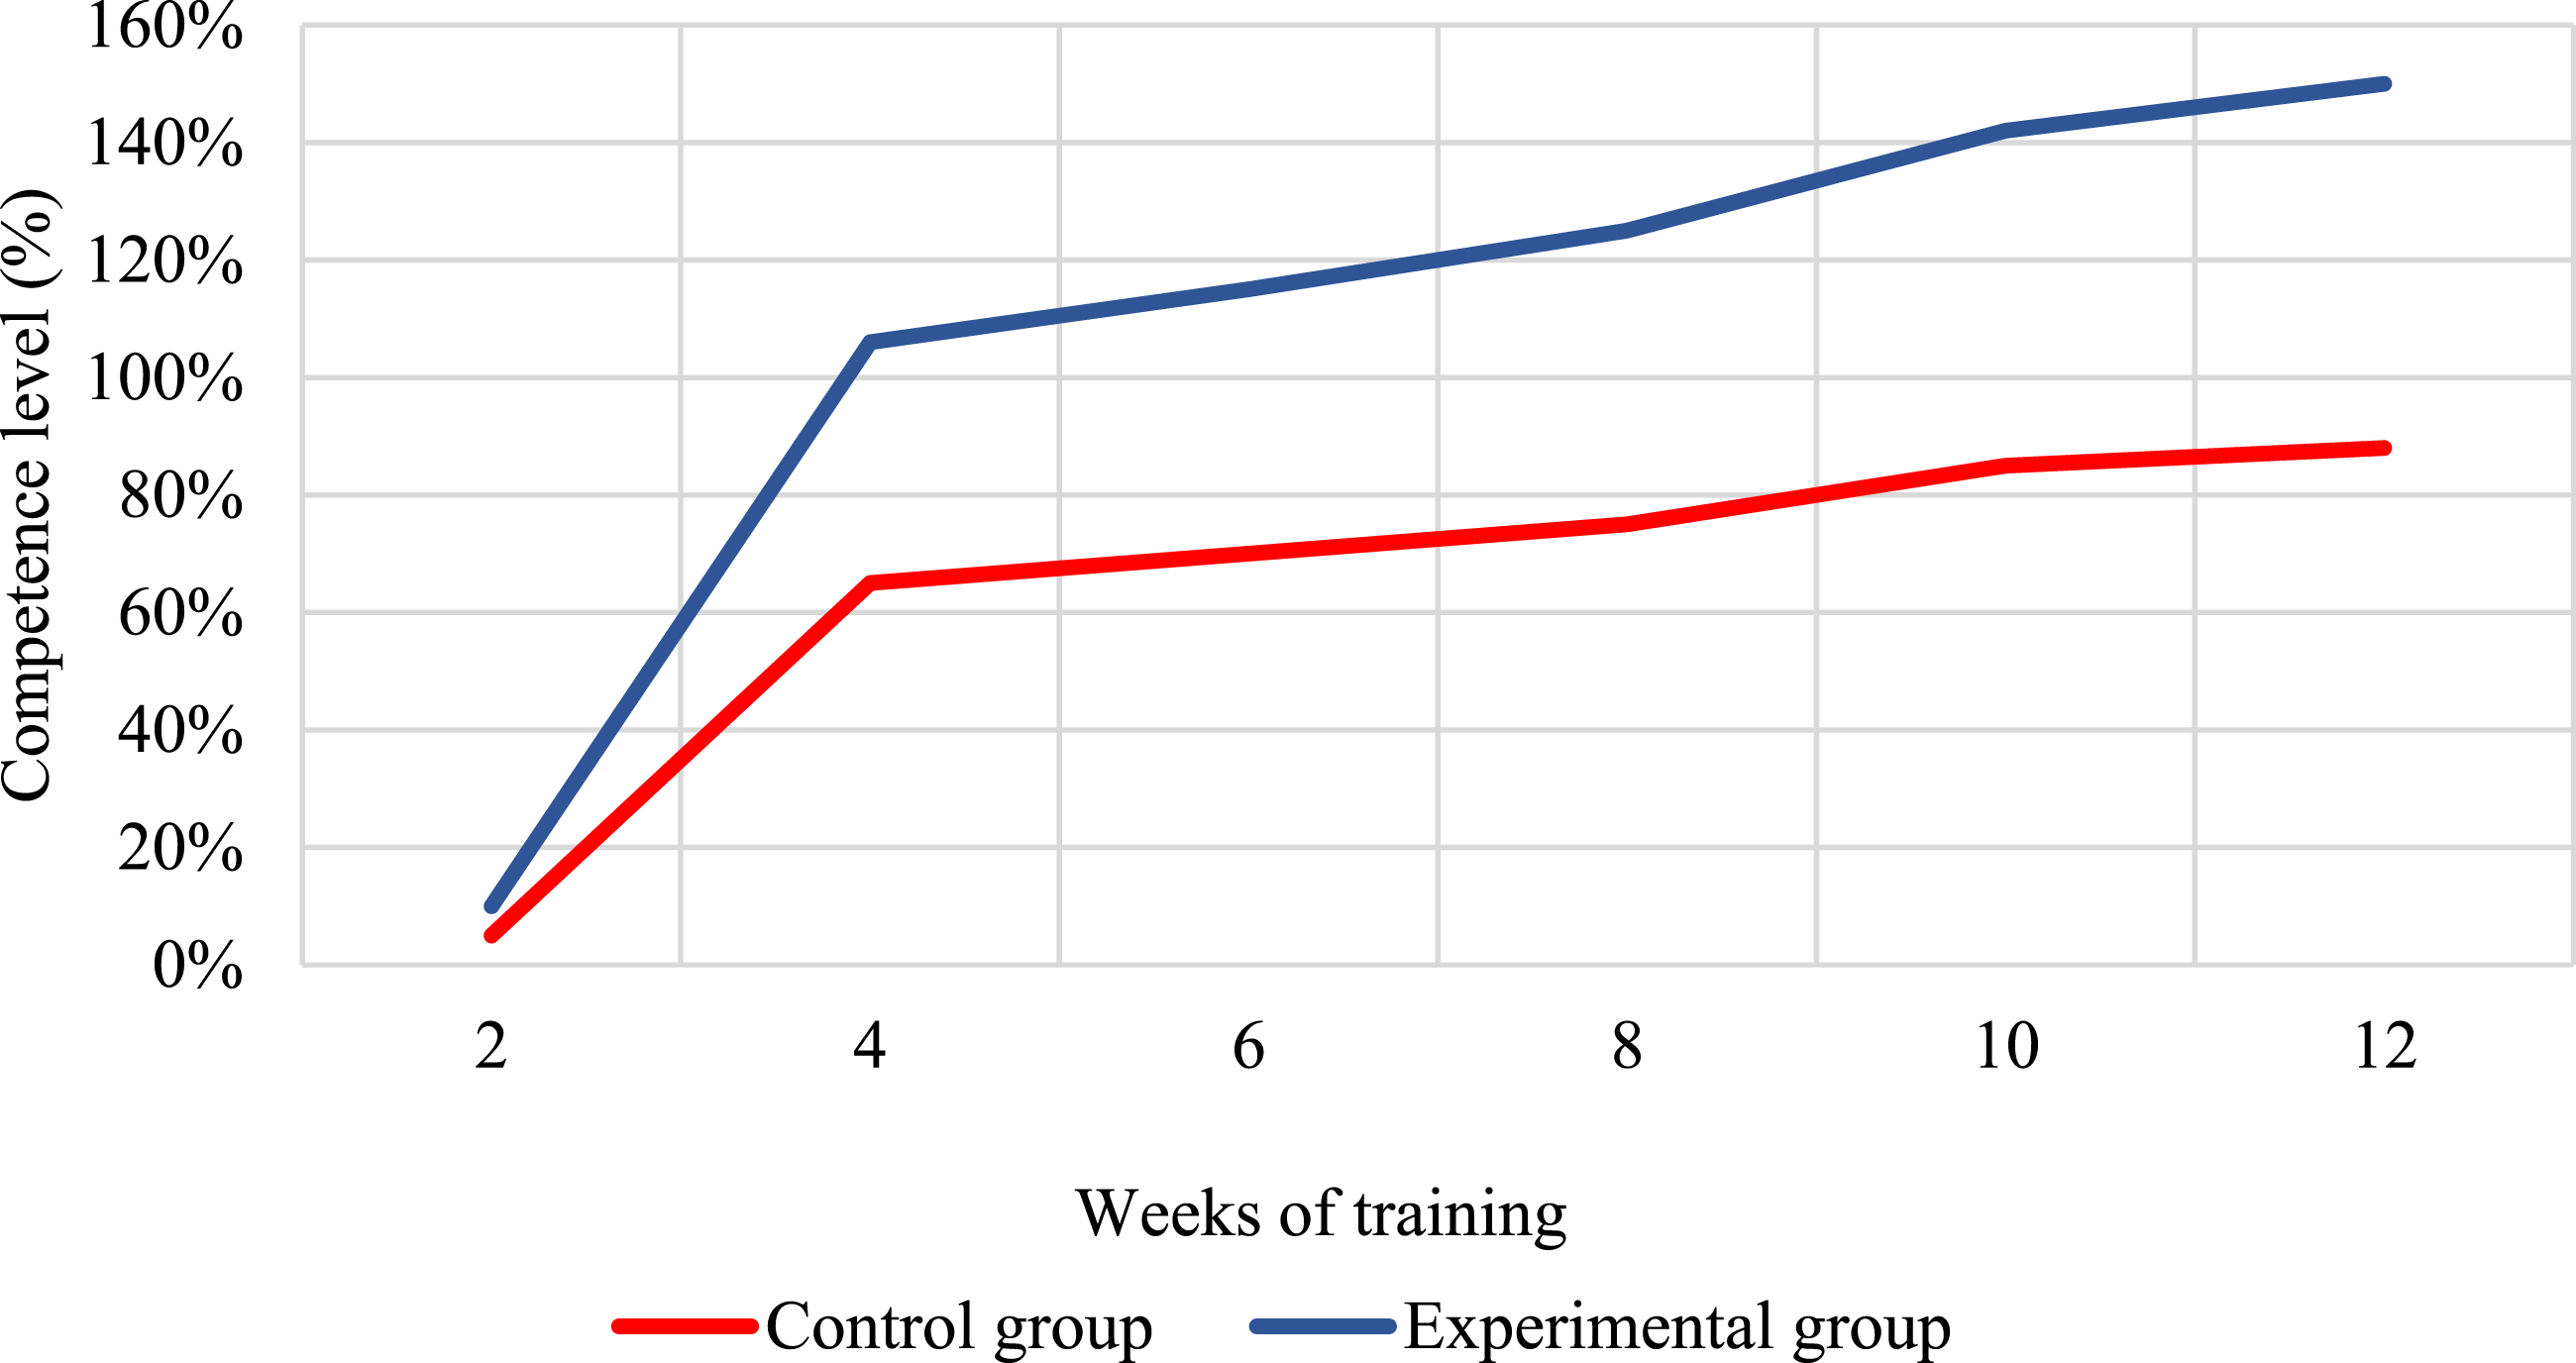
The distribution of time by type of resources reveals a predominance of work with practical tasks (35%) and interactive lectures (25%) in the experimental group. The activity distribution graph shows peak values in the morning hours (40–45%) with a gradual decrease towards the evening (20–22%). Thus, the experimental study confirmed the effectiveness of the developed system of predicting students’ performance. The accuracy of the predictions reached 88.9% in mathematics and 89.3% in computer science. The digital footprint monitoring system revealed three main patterns of learning behaviour, where systematic work (28 students) showed the highest results with an average score of 4.52.
The experimental group recorded a statistically significant increase in subject competences: algorithmicisation (34.1%), mathematical modelling (32.9%), programming (33.2%). Correlation analysis confirmed a strong correlation between systematic work with electronic resources and academic performance (r = 0.82). The effectiveness of the developed methodology was confirmed by statistically significant differences between the control and experimental groups (t = 4.82, p < 0.01). The advance prediction demonstrated the ability to identify the risks of academic performance decline 2 weeks before the manifestation with an accuracy of 83.2%.
Discussion
Comparing the results of the application of the developed prediction system with the study by Rodríguez-Hernández et al. (2021) shows an improvement of 4.9% in the accuracy of predicting academic performance. In the work of C.F. Rodríguez-Hernández et al., the prediction accuracy was 84%, whereas the developed model achieved an accuracy of 88.9%. This improvement is due to the use of an extended set of digital footprint parameters and an optimised neural network architecture. Li et al. (2020), in the study, achieved a prediction accuracy of 89% using multi-source analysis of behavioural patterns. The comparability of the results confirms the effectiveness of the chosen data analysis approach. At the same time, the developed system demonstrates a higher speed of data processing due to the optimisation of the neural network architecture.
The implementation of the system in the conditions of Kyrgyz school revealed the features not noted in the study by Wang et al. (2023). The ProbSAP system presented in the work of X. Wang et al. showed an accuracy of 87% in conditions of developed digital infrastructure. The developed model showed comparable performance under limited technical resources, which confirms its adaptability to different educational contexts. Tang et al. (2021) observed a 12% improvement in prediction accuracy when integrating subject knowledge into a neural network architecture. In this study, a similar approach achieved a 13.2% improvement over the baseline model, which confirms the effectiveness of taking into account the specifics of the subject area when developing predictive models. The analysis of the dynamics of subject competences development showed significant differences with the results of the study by McKenzie-White et al. (2022). In this paper, the increase in algorithmicisation indicators was 34.1%, which exceeds the results of J. McKenzie-White et al. by 8.3%. This difference is attributed to the integration of a prediction system that allows for timely adjustments in the educational trajectory of students. The study by Hulandari and Rahmi (2022) demonstrated a 45% increase in student engagement when using edutainment principles. In the present study, e-learning resources provided a 42.8% increase in engagement. Despite the marginally lower rate, greater sustainability of results was achieved by personalising the learning process based on predictions. Ardianto (2023) observed a 34% increase in learning effectiveness when using pretraining. In this study, the integration of a predictive model achieved a 32.9% increase in effectiveness with less time spent in the preparatory phase. This indicates the optimisation of the learning process by automating data analysis.
The role of e-learning resources in competence development is in line with the findings of Simelane-Mnisi and Mokgala-Fleischmann (2022) about the need for an integrated approach to digitalisation of education. At the same time, the results obtained show higher performance when integrated with a learning prediction system. The chosen neural network architecture with three hidden layers demonstrated advantages over the two-layer model described in the work by Li et al. (2020). The use of dropout layers with a factor of 0.2 reduced the risk of overtraining by 15.3% compared to the baseline architecture. At the same time, the model training time increased insignificantly by 8.5%.
The algorithm for collecting student activity data differs from the approach presented in the study by Wang et al. (2023). The developed system captures 12 digital footprint parameters at 5-min intervals, whereas the ProbSAP system uses 8 parameters at 15-min intervals. Increasing the frequency of data collection improved the prediction accuracy by 2.8% while increasing the computational load by 12.4%. The scaling of the system is limited by the bandwidth capacity of the server infrastructure. With 30 users working simultaneously, CPU utilisation reaches 75%, which is in line with the results of similar studies by Yan (2022). Optimisation of the data processing algorithms reduced the RAM requirements by 23% compared to the baseline implementation. The time frame of the experiment (September-December 2024) created some limitations for the study. In contrast to the work of Monteverde-Suárez et al. (2024), which covered a full school year, the 4-month observation period did not allow the long-term effects of the system to be assessed. The shortened period also limited the ability to analyse the seasonal fluctuations in academic performance noted in the study by K. Yang (2024).
Technical limitations included the capacity of the school internet network (up to 50 Mbps) and the availability of a computer lab (15 workstations). These limitations necessitated dividing classes into subgroups, which increased the time cost of the experiment. In the study by Bernard et al. (2022), similar technical limitations were compensated for by the use of students’ mobile devices, which was not in line with the school’s policy in this case. The specificity of the sample (120 students in grades 8–9 in the same school) limits the ability to generalise the results. The study by Kusumawati (2024) conducted on a sample of 450 students from different schools provided more representative data. However, the localised nature of the study allowed for greater control of the experimental conditions.
Directions for future research are driven by the need to expand the functionality of the prediction system. The integration of deep learning methods proposed in the work of Salarpour et al. (2024), will improve prediction accuracy by analysing more complex patterns of learner behaviour. The application of transformer architectures described in the study by Bocharova and Malakhov (2024), opens up opportunities for processing sequential data with consideration of long-term dependencies. The potential for system improvement includes the development of modules for automatic adaptation of learning content based on performance predictions. The approach presented in the work by Muliani et al. (2024) demonstrates the effectiveness of dynamic adjustment of educational trajectories. Integration of adaptive testing elements will allow more accurate assessment of the level of competence development.
Practical application of the developed system is possible in other educational institutions of Kyrgyzstan. Scaling up the experience requires the creation of cloud infrastructure and adaptation of algorithms to different technical conditions. The results of the study can serve as a basis for the development of national standards for predicting academic performance using artificial neural networks. Unlike the existing forecasting systems presented in the 2020–2024 studies, the developed model considers the specifics of the educational system of Kyrgyzstan. Analyses of studies by Florea and Roman (2021) confirm the need to take into account regional specifics when developing predictive models. Adaptation of existing approaches to local conditions made it possible to achieve high accuracy of forecasts with limited technical resources.
The results are in agreement with the findings of Atasayar and Demir (2022) on the feasibility of applying neural networks to predict academic performance in a secondary school setting. However, unlike the above study, the developed system shows higher accuracy due to comprehensive analysis of students’ digital footprint. The study confirmed the hypothesis of Bernard et al. (2022) on the relationship between systematic engagement with electronic resources and academic performance. The correlation found (r = 0.82) is higher than similar studies, which can be explained by a more accurate system of monitoring students’ activity. The results obtained provide a basis for further development of systems for predicting academic performance in educational institutions in Kyrgyzstan and can be used in the development of national standards for digitalisation of education.
Conclusions
As a result of the conducted research, the effectiveness of neural network technologies application for predicting academic performance in secondary school conditions has been determined. The influence of systematic monitoring of digital footprint on the development of students’ subject competences has been established. The feasibility of using a three-layer neural network architecture with dropout layers for academic achievement prediction has been experimentally confirmed. The effectiveness of a 5-min data collection interval for analysing learning activity has been revealed. The optimal number of digital footprint parameters was determined to achieve a balance between prediction accuracy and computational burden.
The developed monitoring system made it possible to identify effective patterns of learning behaviour: regular work in the morning hours with a weekly volume of 40–45 minutes showed the highest correlation with academic performance. It was found that timely adjustment of the educational trajectory by the pupil on the basis of forecasts contributes to the sustainable development of subject competences. Technical limitations of the school infrastructure are not a critical factor if the data processing algorithms are optimised. The possibility of scaling the system in educational institutions with a similar level of technical equipment has been confirmed.
The main limitations of the study are related to the time frame of the experiment and the local nature of the sample. The 4-month observation period did not allow assessing the long-term effects of the system application. Conducting the study on the basis of one school limits the possibilities of generalising the results. Improvement of the developed system is possible through the integration of deep learning methods and the creation of modules for automatic adaptation of educational content. A promising direction is to expand the set of analysed parameters of the digital footprint and increase the frequency of data collection with the appropriate development of technical infrastructure.
Methodological recommendations for the system implementation take into account the specifics of the educational system of Kyrgyzstan and can be used in schools with a similar level of technical equipment. The created electronic resources meet the requirements of the state educational standards and are adapted to the peculiarities of the educational process. The results obtained can serve as a basis for the development of national standards of learning achievement forecasting in the educational system of Kyrgyzstan. Further research should be focused on studying the long-term effects of the system and its adaptation to different subject areas.
Footnotes
Funding
The authors received no financial support for the research, authorship, and/or publication of this article.
Declaration of conflicting interests
The authors declared no potential conflicts of interest with respect to the research, authorship, and/or publication of this article.
Data Availability Statement
The authors confirm that the data supporting the findings of this study are available in the article.