






Abstract
Background:
Ketamine has emerged as a promising rapid-acting antidepressant for treatment-resistant depression (TRD), yet its mechanisms of action and reliable biomarkers of treatment response remain poorly understood. Recent evidence suggests that the aperiodic exponent (1/f slope) of electroencephalography (EEG) power spectra reflects cortical excitation-inhibition balance (EIB), offering a potential non-invasive marker of treatment outcomes.
Objective:
Our study investigated whether subanesthetic ketamine modulates the EEG aperiodic exponent in patients with major depressive disorder (MDD), most of whom met criteria for TRD. We also examined whether pretreatment aperiodic exponent predicts antidepressant response.
Design:
A placebo-controlled, single-blind, one-arm, fixed-sequence design without randomization trial of intravenous ketamine infusion in patients with MDD.
Method:
Twenty-four MDD patients underwent both placebo and ketamine (0.54 mg/kg over 30 min) infusions. Resting-state EEG was recorded pre-, start-, end-, and 24 h post-infusion. Aperiodic exponent (1–40 Hz) was extracted using spectral parameterization. Depressive symptoms were assessed using the Montgomery–Åsberg Depression Rating Scale, with responders defined as ⩾33% symptom reduction 24 h post-infusion.
Result:
Meta-analysis revealed substantial heterogeneity in ketamine’s effect on aperiodic exponents. In our cohort, ketamine significantly reduced the aperiodic exponent across the scalp. Notably, responders exhibited higher pretreatment occipital aperiodic exponents than non-responders. A steeper pretreatment 1/f slope in the occipital region predicted better treatment outcomes.
Conclusion:
Subanesthetic ketamine alters cortical aperiodic dynamics in MDD, potentially reflecting EIB modulation. The EEG aperiodic exponent, particularly in occipital regions, may serve as a useful biomarker for predicting antidepressant response to ketamine. However, our meta-analysis underscores the complexity and variability of the EEG aperiodic exponent. Future large-scale, multimodal studies are needed to validate and expand on these findings.
Trial registration:
EudraCT Number: 2013-000952-17 (https://www.clinicaltrialsregister.eu/ctr-search/trial/2013-000952-17/CZ).
Plain language summary
Ketamine is a fast-acting treatment that can reduce symptoms of severe depression, especially in people who have not improved with standard antidepressants. However, not everyone benefits from ketamine, and doctors currently have no reliable way to predict who will respond. In this study, we explored whether a simple, non-invasive brain test called electroencephalography (EEG) could help identify people who are more likely to improve after ketamine treatment. EEG measures the brain’s natural electrical activity using small sensors placed on the scalp. We focused on a specific pattern in brain activity that reflects the balance between two important brain processes: activation and inhibition. This balance helps regulate healthy brain function and may be altered in depression. Twenty-three adults with major depressive disorder received both placebo and ketamine infusions in a controlled study. We measured their brain activity before, during, and after treatment. We found that ketamine temporarily shifted overall brain activity toward greater activation. Importantly, people who showed stronger inhibitory patterns in the back part of the brain before treatment were more likely to experience improvement in their depression symptoms 24 hours later. These findings suggest that a simple brain wave measure could help predict who is most likely to benefit from ketamine. While more research with larger groups is needed, this approach may eventually support more personalized and targeted treatment decisions for people with difficult-to-treat depression.
Introduction
Major depressive disorder (MDD) is a debilitating psychiatric illness characterized by persistent affective, cognitive, and somatic symptoms. 1 A substantial subset of patients develops treatment-resistant depression (TRD), defined as inadequate response to at least two adequate antidepressant trials. For these patients, effective treatment options remain limited. 2 Ketamine, a noncompetitive N-methyl-D-aspartate (NMDA) receptor antagonist, has demonstrated rapid and robust antidepressant effects in TRD.3 –6 However, its underlying neurophysiological mechanisms remain incompletely understood, and reliable biomarkers for identifying likely responders are lacking. Such biomarkers could enable more targeted treatment strategies and minimize exposure to ineffective interventions.
Electroencephalography (EEG) is a promising tool for biomarker development due to its high temporal resolution, portability, and non-invasive nature.7 –9 While previous studies have largely focused on oscillatory features such as alpha 10 and delta band activity11,12 or vigilance states,4,13 increasing attention has been given to aperiodic (non-oscillatory) features of the EEG power spectrum. 14 One such measure is the aperiodic exponent (also referred to as the 1/f slope or spectral exponent), which quantifies how power decreases with frequency.15,16 This measure has been proposed to reflect the balance between excitatory and inhibitory activity in cortical networks.17 –19 The aperiodic exponent has been proposed as a non-invasive marker of cerebral excitation-inhibition balance (EIB). 20 A steeper 1/f slope (i.e., higher aperiodic exponent) has been associated with relatively greater inhibitory tone, whereas a flatter slope has been linked to heightened excitation. 21
Altered E/I balance has been implicated in MDD 22 and other neuropsychiatric conditions,23 –27 where corresponding changes in scalp aperiodic exponent have been observed.22,26,28,29 Notably, patients with schizophrenia show a steeper aperiodic exponent compared to controls, which may be modulated following memantine intervention. 27 Similarly, in epilepsy, the aperiodic exponent varies systematically across ictal and interictal states, underscoring its sensitivity to dynamic shifts in cortical excitability.29 –31 Consistent with this, ketamine, through its NMDA receptor antagonism, shifts cortical activity toward excitation.32,33 An intracranial EEG study in patients with TRD found that fluctuations in the 1/f slope within the ventromedial prefrontal cortex were associated with changes in symptom severity over the course of minutes to hours. 34 Flatter (less negative) slopes were consistently associated with clinical improvement, underscoring the exponent’s sensitivity to dynamic mood changes, 34 further supporting its sensitivity to temporal changes in neurophysiological and clinical state. Further evidence from a bipolar depression cohort showed that ketamine reduced the 1/f slope and increased high-frequency signal entropy. 35 These EEG changes were more pronounced in patients who were not responders after the first week of treatment, suggesting individual variability in neurophysiological sensitivity to ketamine and supporting the relevance of scale-free EEG dynamics in treatment response. 35 Furthermore, the aperiodic exponent is modulated by GABAA and NMDA receptors, 36 key targets in depression pathophysiology and ketamine’s therapeutic action. 22
Importantly, the EEG aperiodic exponent appears to distinguish ketamine from other anesthetics.20,23,37 While agents such as propofol increase the exponent (suggesting increased inhibition), ketamine tends to flatten the slope,18,37 consistent with elevated cortical excitation.32,33 Our previous finding extends this line of research, showing that subanesthetic ketamine enhances cortical complexity without inducing anesthesia. 38 This suggests that even low-dose ketamine, as used in antidepressant treatment, may engage large-scale neural dynamics through EIB modulation. Whether these changes reflect those observed at anesthetic doses remains an open and compelling question.
The present study aimed to investigate whether subanesthetic ketamine alters the aperiodic exponent of resting-state EEG in patients with MDD, most of whom met criteria for TRD. Given evidence of glutamatergic and GABAergic across multiple brain regions in depression, 22 we considered the possibility that changes in the aperiodic exponent may reflect both regional and global aspects of cortical dynamics. We therefore hypothesized that ketamine would enhance cortical excitation, reflected as a flattening of the 1/f slope, consistent with anesthetic-dose studies 31 . Unlike prior work focused on anesthetic doses, 37 our study examined lower, subanesthetic doses typically used in antidepressant treatment. To contextualize our findings, we conducted a meta-analysis of existing studies examining ketamine’s impact on the aperiodic exponent. A secondary aim was to evaluate whether the pretreatment aperiodic exponent could serve as a predictive biomarker of clinical response. We hypothesized that responders would show distinct pretreatment of the EEG aperiodic exponent. Finally, to assess whether ketamine-induced changes are globally or regionally distributed, we implemented both regional and whole-brain EEG models.
Materials and methods
Participants
Detailed recruitment procedures have been described elsewhere.4,39 In brief, 24 participants aged 18–65 were recruited (EudraCT Number: 2013-000952-17). All participants met DSM-IV diagnostic criteria for MDD, confirmed using the Mini-International Neuropsychiatric Interview (M.I.N.I.). Inclusion criteria required a baseline Montgomery-Åsberg Depression Rating Scale (MADRS) score ⩾20 and evidence of non-response to at least one adequate antidepressant trial during the current major depressive episode. Of the 24 participants, 21 met criteria for TRD, defined as inadequate response to two or more trials in the current episode. 2 Participants were required to be on a stable antidepressant regimen for at least 4 weeks before study entry. Augmentation treatments with lamotrigine, lithium, antipsychotics, or monoamine oxidase inhibitors were excluded. Additional exclusion criteria included current suicidal risk, any Axis I or II psychiatric comorbidity, serious or unstable medical or neurological conditions (e.g., epilepsy and head trauma with loss of consciousness), and a lifetime history of psychotic symptoms or a family history of psychotic disorders. During screening, all participants underwent physical examination, routine laboratory testing, electrocardiography, urinalysis, and toxicology screening. Individuals with clinically significant somatic illnesses, particularly cardiovascular disorders (including hypertension or the use of cardiac medications such as beta-blockers), were excluded. The reporting of this study conforms to the CONSORT statement. 40 One participant (a non-responder) was excluded due to poor model fit in the Fitting Oscillations and One-Over-F (FOOOF) algorithm, 14 resulting in a final sample of 23.
Design and procedure
This was a single-blind, controlled, non-randomized crossover study.4,39 All participants first received a placebo infusion (0.9% sodium chloride), followed by a 7-day washout period and then a ketamine infusion. Resting-state EEG with eyes closed was recorded at four time points: 10 min pre-infusion, during the first 10 min of infusion (start-infusion), the final 20 min of infusion (end-infusion), and 10 min at 24 h post-infusion. For the present analysis, 10 min of EEG data were analyzed from each of these points to characterize both immediate and delayed effects of ketamine on the aperiodic exponent. Blood samples were drawn at 10 and 30 min after the start of infusion to assess serum ketamine and norketamine levels.
Ketamine and placebo infusion
Ketamine and placebo infusions were administered via a forearm intravenous catheter. Racemic ketamine hydrochloride (Calypsol, Gedeon Richter Plc., Czech Republic) was delivered using an infusion pump (ID 20/50, Polymed Medical CZ Ltd, Czech Republic) following a two-phase protocol: a loading dose of 0.27 mg/kg over 10 min, followed by an additional 0.27 mg/kg over the next 20 min, totaling 0.54 mg/kg over 30 min. The placebo was administered using an identical infusion protocol with 0.9% sodium chloride. Further procedural details are available in Meyer et al. 39
EEG recording and preprocessing
EEG was recorded using a BrainScope digital amplifier (M&I, Prague, Czech Republic) while subjects were seated in a semi-recumbent position with eyes closed, in a sound-attenuated room under subdued lighting. Horizontal electrooculogram channels were positioned at the outer canthi. Electrode impedances were kept below 50 kΩ.
Data preprocessing was detailed elsewhere. 4 Briefly, signals were (1) re-referenced to the average reference; (2) manually inspected for artifacts such as sudden movements and impedance issues using DeepPsy software; (3) applied independent component analysis (ICA) for removal of ocular, cardiac, and technical artifacts; (4) filtered with a 0.5–70 Hz bandpass filter and a 50 Hz notch filter; (5) Bad channels were interpolated using spherical spline interpolation. 41 No significant differences were observed across conditions in the number of rejected epochs or ICA components. 4
Depression severity measurement
Depressive symptoms were assessed using the MADRS at pre-infusion, at 24 h, 72 h, and 7 days post-infusion. Treatment response was defined as a ⩾33% reduction in MADRS score at 24 h relative to baseline, consistent with prior work using this cohort.4,38,39 This more inclusive threshold was chosen to capture early antidepressant effects of ketamine, as the conventional ⩾50% criterion is less frequently observed within 24 h, particularly in treatment-resistant populations. Applying a ⩾33% cutoff allowed for the identification of clinically meaningful early improvement while maintaining sufficient statistical power for group comparisons.
Aperiodic exponent calculation
The aperiodic exponent was estimated using the FOOOF toolbox, which decomposes the power spectrum into periodic and aperiodic exponent (1/f slope) through parameterized modeling. This measure was used as a proxy for cortical EIB, consistent with its increasing use in the literature despite the absence of a universally established metric.27,42,43 Power spectral densities (PSDs) were computed from 1 to 40 Hz using the MNE-Python toolbox, consistent with prior work on ketamine-induced EEG dynamics. 37 Welch’s method was applied using 4s sliding time windows with 50% overlap and zero padding. PSDs were averaged across time segments before being input into FOOOF. Model settings included a fixed aperiodic mode, as no clear spectral knee was observed within this frequency range. Spectral knees are typically observed only over broader frequency ranges 44 and their inclusion here may lead to unstable or overfit estimates. 14 Peak width limits of 1–8 Hz, a maximum of eight peaks, and a peak threshold of three were selected to capture physiologically plausible oscillatory components while reducing noise-driven or overfit peak detection. The maximum number of peaks was treated as an upper bound rather than an expected value, allowing flexibility across spectra while maintaining robustness of the parameterization. 14
Statistical analyses
Statistical analysis was conducted using SPSS 25.0 (SPSS Inc., Chicago, IL, USA) and Python 3.8. Repeated-measures analyses of variance (ANOVA) were used to assess the effects of ketamine on the aperiodic exponent, as well as the predictive value of pretreatment exponent measures. The Greenhouse-Geisser correction was applied when assumptions of sphericity were violated. Bonferroni correction was used for post hoc comparisons to control for Type I errors. Regional analyses were conducted using predefined electrode groupings, and where pairwise comparisons between regions were performed, Bonferroni correction was applied accordingly. All statistical tests were two-tailed, and significance was set at p < 0.05. Effect sizes were reported using partial eta squared (ηp²) for ANOVAs and Cohen’s d for pairwise comparisons. Partial correlations, adjusted for age and sex, were used to examine associations between the aperiodic exponent and clinical or serum measures. Detailed statistical analyses are outlined below.
Ketamine effects on aperiodic exponent
To evaluate ketamine effects on aperiodic exponents, repeated-measures ANOVA was conducted with intervention (ketamine vs placebo) and treatment condition (percentage changes from start-infusion and end-infusion relative to pre-infusion) included as within-subject factors. Aperiodic exponent changes were expressed as percentage change from pre-infusion using the formula: (start or end − pre)/pre × 100%. Regional analyses were performed by grouping electrodes into four brain regions: the frontal lobe (Fp1, Fp2, F3, F4, Fz, F7, F8, AFz), parietal lobe (P3, P4, Pz, C3, C4, Cz), temporal lobe (T3, T4, T5, T6), and occipital lobe (O1 and O2). Each region was entered as a within-subject factor in separate models. Additionally, partial correlation analyses (controlling for age and sex) were used to assess the relationship between changes in aperiodic exponent and serum concentrations of ketamine and norketamine at 10 and 30 min post-infusion.
Predictive value of pretreatment aperiodic exponent
We tested whether pretreatment aperiodic exponents could predict clinical response to ketamine. Repeated-measures ANOVA was performed using response group (responders vs non-responders) as a between-subject factor. For any significant predictive biomarkers identified, receiver operating characteristic (ROC) curve analysis was used to evaluate classification performance. These analyses were considered exploratory, given the modest sample size and absence of independent validation.
Association between aperiodic exponent and depression severity
To explore the relationship between aperiodic exponent and depressive symptoms, we performed partial correlations (adjusted for age and sex) between the exponent (pre-infusion and percentage change at start/end-infusion) and MADRS scores at baseline, 24 h, 4 days, 7 days, and 14 days post-infusion. These analyses were conducted on pooled data from both the ketamine and placebo conditions to improve statistical power.
Remaining ketamine effects at 24 h post-infusion
To determine whether ketamine-induced changes in the aperiodic exponent persisted 24 h post-infusion, repeated-measures ANOVAs were performed on both whole-brain and region-specific models, comparing exponent values at 24 h with baseline values.
Alpha peak frequency analysis
Alpha peak frequency (APF) was extracted to assess whether ketamine effects on the aperiodic exponent were influenced by changes in oscillatory alpha activity. As APF reflects the underlying neurophysiological state and may interact with the spectral slope, this analysis helped to better isolate aperiodic from periodic contributions. 45 Comparisons across time points and interventions were performed using the Friedman test.
Meta-analysis overview
We conducted a meta-analysis to contextualize the current study within the broader literature on ketamine’s effects on the EEG aperiodic exponent. Analyses were performed using JASP version 0.19.3.0 (JASP Team, 2024, Amsterdam, The Netherlands). Studies were included if they were conducted in human participants, involved ketamine administration, and reported EEG-derived aperiodic exponent measures either before and after ketamine administration or relative to a control condition. Given the limited number of available studies in clinical populations, inclusion criteria were broadened to include both healthy participants and individuals with depression. Effect sizes were reported as Hedges’ g with 95% confidence intervals (CI), and significance was assessed using two-sided p-values with a threshold of p < 0.05. Full details of the search strategy, study selection, and meta-analytic procedures are provided in the Supplemental Materials.
Results
Sociodemographic results
Sociodemographic and clinical characteristics of the sample have been detailed elsewhere.4,38 Ketamine responders showed significantly lower 24 h MADRS scores (F(1,22) = 9.80, p = 0.005), and greater symptom improvement from baseline (F(1,22) = 10.63, p = 0.004) compared to non-responders. Groups did not significantly differ in sex, age, or pretreatment MADRS scores (p-values > 0.65).
Ketamine effect on aperiodic exponent
A repeated-measures ANOVA revealed a significant main effect of intervention on the aperiodic exponent in the whole-brain model (F(1, 21) = 9.27, p = 0.006, ηp² = 0.31). Participants exhibited a significantly greater reduction in aperiodic exponent following ketamine infusion compared to placebo (−21.1% vs 0.1%, 95% CI = (−35.40, −6.70), p = 0.006, Cohen’s d = 0.63), consistent with a relative shift toward increased cortical excitation (Figure 1(a) and (b)). The three-way interaction between intervention, treatment condition, and group was not significant (p = 0.57, ηp² = 0.02), suggesting that the ketamine effect on aperiodic exponent did not differ between responders and non-responders. No significant partial correlation was observed between percentage changes in aperiodic exponent at 10 min and 30 min post-infusion and the serum concentrations of ketamine or norketamine (p-values > 0.26, see Table S2).
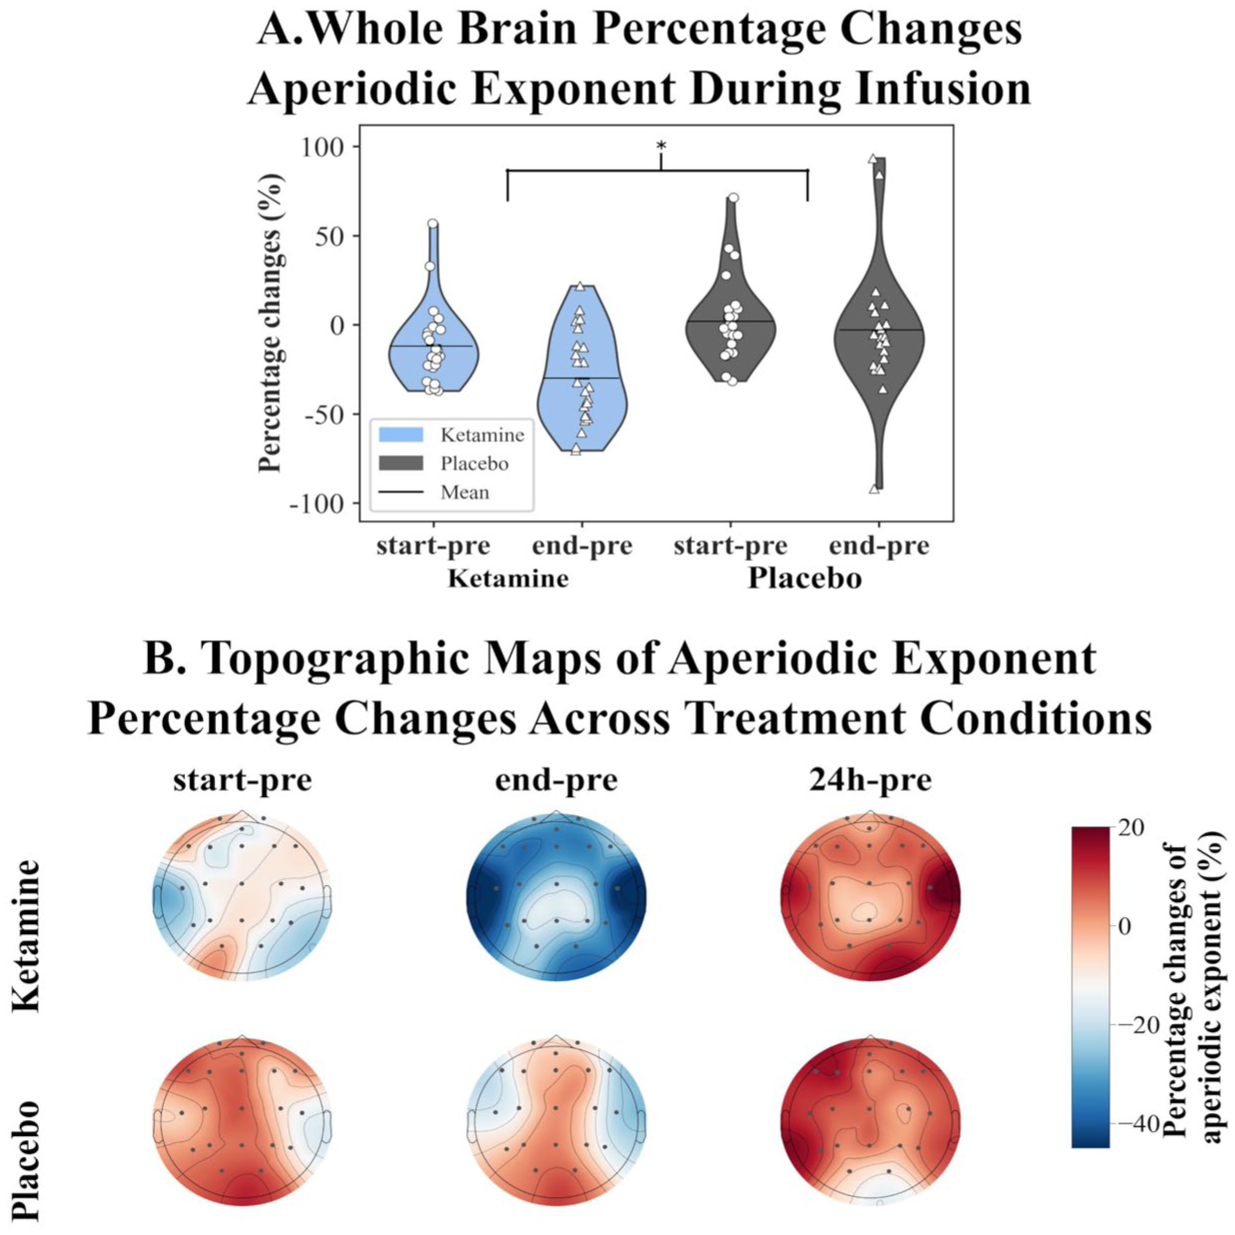
Ketamine effects on the EEG aperiodic exponent of MDD patients. (a) Whole-brain percentage changes during infusion (*p < 0.05). Ketamine significantly decreased the aperiodic exponent compared to placebo. (b) Topographic maps showing spatial distribution of exponent changes at three time points: the first 10 min of infusion (start-pre), the final 20 min of infusion (end-pre), and 24 h after infusion (24 h-pre). All changes are expressed relative to the pretreatment (pre-infusion) baseline.
To examine whether changes in periodic alpha activity contributed to the observed effects, we analyzed APF across intervention and treatment conditions. Statistical analysis revealed no significant differences between ketamine and placebo (p = 0.85; see Figure 2), indicating that ketamine-induced changes in the aperiodic exponent were unlikely to be driven by alpha oscillatory activity.
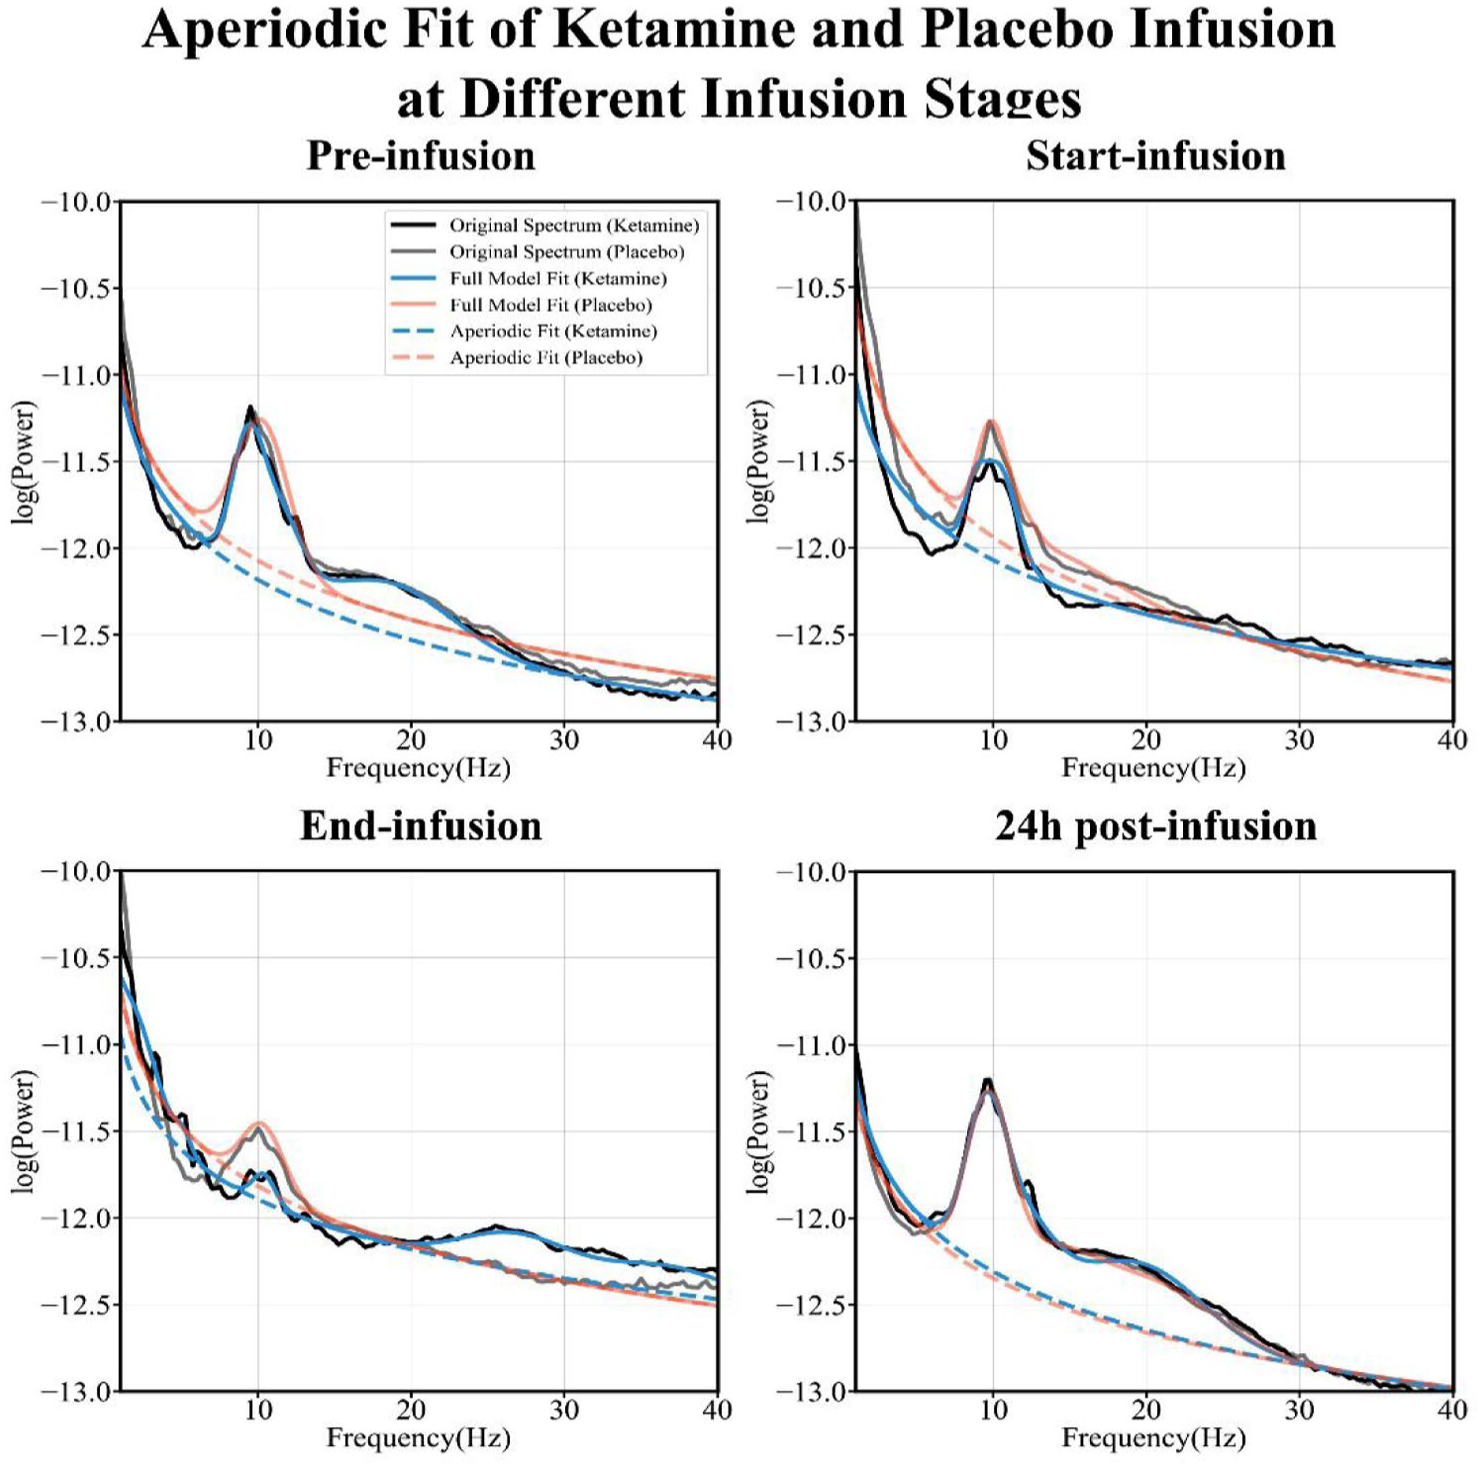
Aperiodic spectral fitting at different infusion stages.
Pretreatment aperiodic exponent as a predictive biomarker for ketamine response
No significant results were found in the whole-brain aperiodic exponent analysis between responders and non-responders (p = 0.62). However, a significant interaction between response group and brain region emerged in the regional model (F(3,60) = 4.01, p = 0.027, ηp² = 0.16, Figure 3(a) and (c)). Post hoc comparisons revealed that responders exhibited significantly higher aperiodic exponent values in the occipital region compared to non-responders (1.19 vs 0.90, 95% CI = (−0.54, −0.05), p = 0.023, Cohen’s d = 1.03). This corresponds to a steeper 1/f slope in responders, suggesting that elevated inhibitory tone in occipital regions may predict clinical benefit from ketamine (Figure 3(a) and (c)).
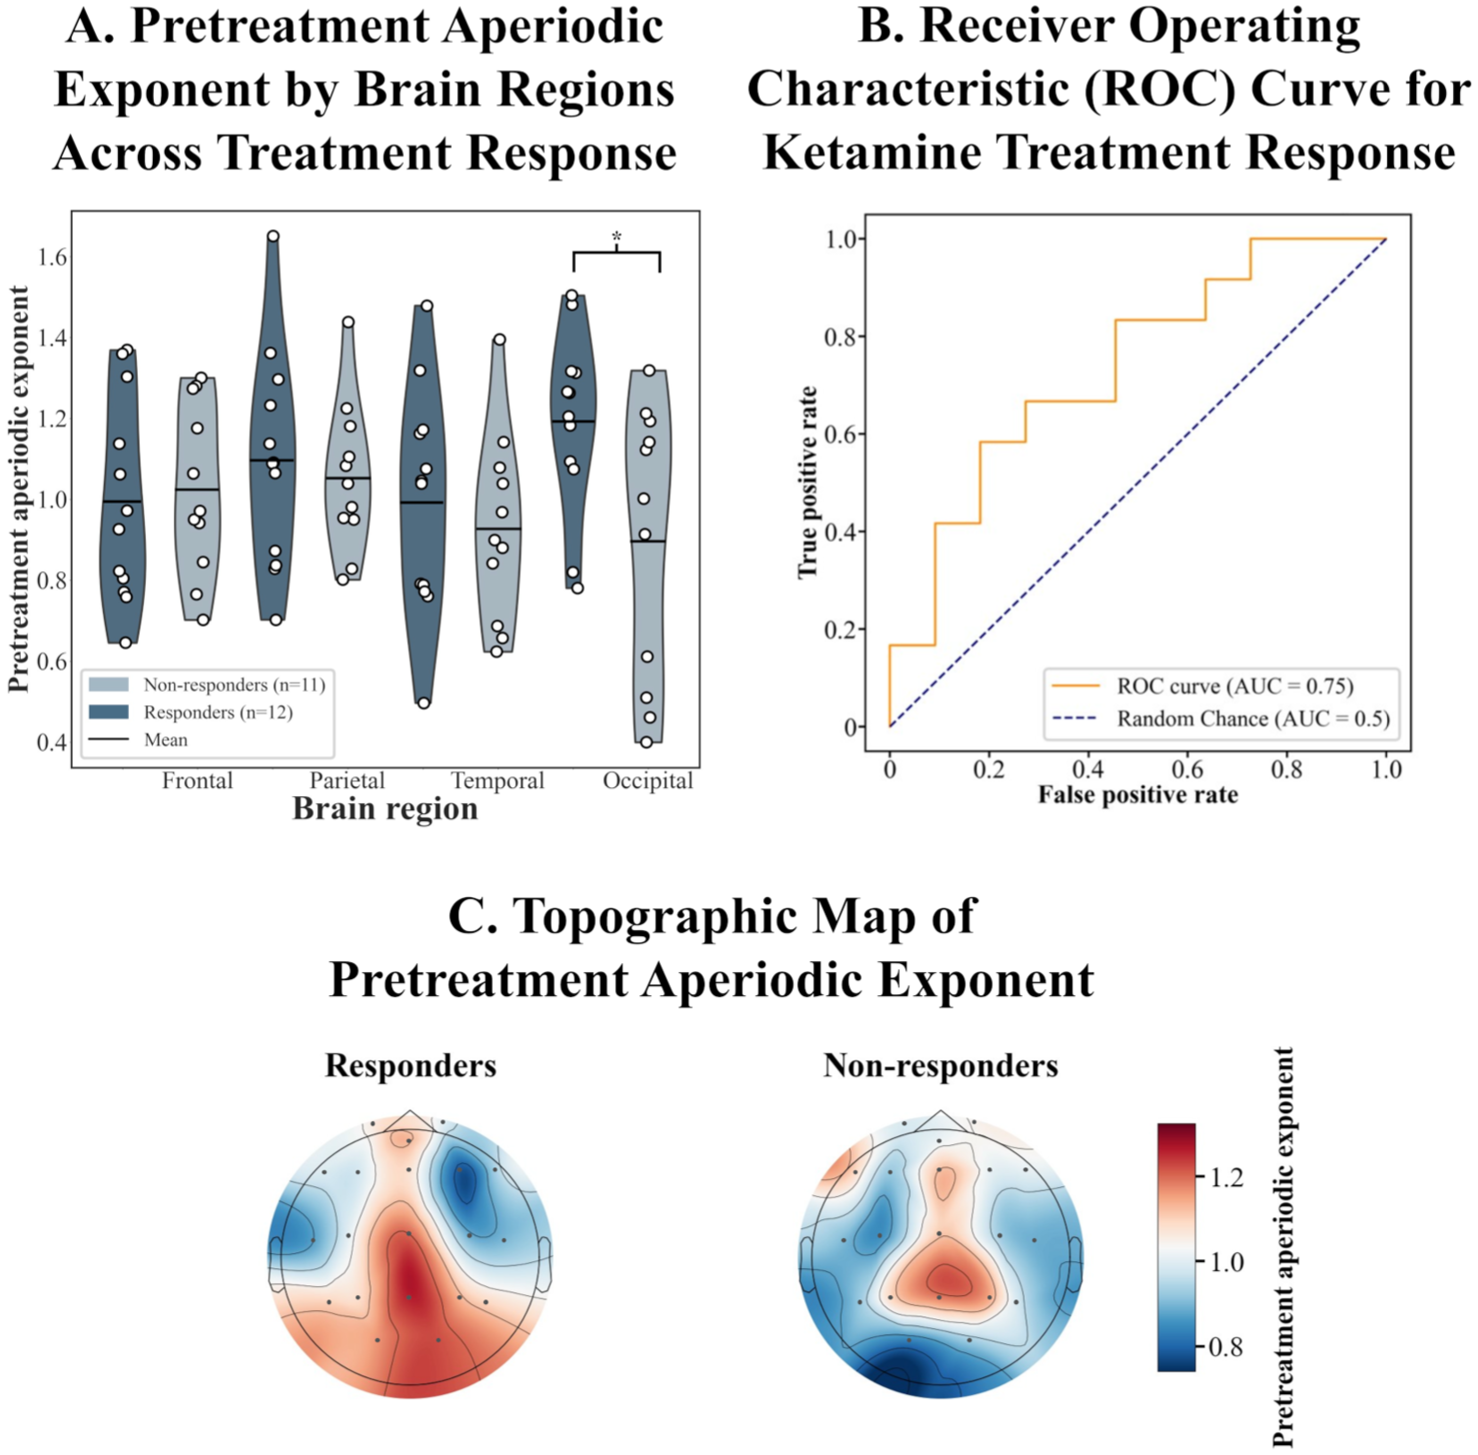
Pretreatment aperiodic exponent as a predictor of ketamine response. (a) Regional aperiodic exponent values in responders (n = 12) vs non-responders (n = 11), with a significant difference in the occipital region (*p < 0.05). (b) ROC analysis demonstrating predictive accuracy (AUC = 0.75). (c) Topographic maps of pretreatment aperiodic exponent for responders and non-responders.
ROC analysis using occipital pretreatment aperiodic exponent revealed an area under the curve of 0.75 (95% CI = (0.55, 0.96)), which suggests a potential discriminative ability of occipital pretreatment aperiodic exponent, further improving the prediction of response to ketamine (Figure 3(b)).
Association between aperiodic exponent and clinical depression severity
No significant associations were found between pretreatment aperiodic exponent and baseline MADRS scores in either whole brain (p = 0.302) or occipital regions (p = 0.075), indicating that the 1/f slope was not significantly related to symptom severity at baseline (see Table S3). Similarly, there were no significant associations between whole-brain 1/f slope and clinical improvement following ketamine infusion (p-values > 0.123).
Remaining ketamine effects on aperiodic exponent 24 h post-infusion
In the whole-brain model, we did not find a significant main effect of intervention at 24 h post-infusion (p = 0.949). However, regional analyses revealed a significant intervention effect in the occipital region (F(3,66) = 3.80, p = 0.022, ηp² = 0.15). Specifically, the occipital aperiodic exponent showed a significantly greater percentage increase following ketamine compared to placebo (14.00% vs −5.29%, 95% CI = (1.09, 37.50), p = 0.039, Cohen’s d = 0.46).
Discussion
This study examined how subanesthetic ketamine modulates the aperiodic exponent of resting-state EEG in patients with MDD, most of whom met criteria for TRD. We also explored whether the aperiodic exponent could serve as a candidate biomarker for identifying individuals likely to benefit from treatment. Consistent with our hypothesis, ketamine significantly reduced the aperiodic exponent across the scalp, consistent with a relative shift toward increased cortical excitation. Notably, responders exhibited steeper pretreatment 1/f slopes in the occipital region compared to non-responders. Although whole-brain effects did not persist 24 h post-infusion, occipital increases remained, pointing to possible region-specific lasting effects.
To place our findings in context, we conducted a meta-analysis of studies examining ketamine’s effects on the EEG aperiodic exponent.20,23,37 Studies were included if they were conducted in human participants, involved ketamine administration, and reported aperiodic exponent measures suitable for effect size estimation. Because of the limited number of available studies, both healthy and clinical samples were considered. However, only four human studies met the inclusion criteria, yielding a modest combined sample size (n = 138). The analysis revealed substantial heterogeneity, likely driven by key differences across studies, including varying ketamine dose (anesthetic 37 vs subanesthetic) and participant populations. Compared to prior work, the present study focuses specifically on individuals with MDD, extending the literature into a clinically relevant population. Although the overall pooled effect size was not statistically significant, the small number of studies limits statistical power and constrains the interpretation of between-study variability. As such, these findings should be considered preliminary, while still providing a useful synthesis of an emerging literature and highlighting the need for larger, more standardized investigations.
This study used the EEG aperiodic exponent as a putative biomarker for measuring cortical E/I-related dynamics because of considerations of clinical application and methodology. Other methods for assessing cortical EIB include magnetic resonance spectroscopy (MRS) and transcranial magnetic stimulation electroencephalography (TMS-EEG). Although MRS can quantify GABA concentration in specific brain regions, 24 it has low temporal resolution and cannot capture the dynamic changes in cortical E/I state over time. In addition, MRS is expensive to acquire and has high operational requirements, which limit its application in large-scale studies and clinical practice. 46 TMS-EEG also presents challenges to research reproducibility due to its complex operation and lack of standardized analytical methods. 47 EEG, on the other hand, offers advantages such as non-invasive, high temporal resolution, and easy operation, making it a more suitable tool for large-scale research and clinical work.
The aperiodic exponent of the EEG power spectrum has been proposed as a broadband marker of cortical EIB.17,19,23,36 A steeper 1/f slope reflects greater inhibitory tone, while a flatter slope is associated with increased excitation.17,21 We found that subanesthetic ketamine significantly reduced the aperiodic exponent across the scalp in patients with MDD, consistent with a shift toward cortical excitation. This flattening is consistent with previous reports of anesthetic-dose studies and supports the notion that ketamine modulates cortical EIB,18,37,48 even at lower, clinically relevant doses. Through NMDA receptor antagonism, ketamine disinhibits cortical pyramidal neurons by suppressing GABAergic interneurons and facilitating downstream glutamatergic activity through AMPA receptors, thereby promoting synaptic plasticity and potentially influencing E/I balance.22,34,49 This effect was observed across participants, regardless of clinical response, suggesting a general pharmacodynamic mechanism. We also observed a sustained increase in occipital exponent 24 h post-infusion, possibly reflecting a delayed rebound in regional inhibitory tone. Given ketamine’s rapid metabolism, 50 this suggests that local EIB shifts may outlast drug clearance and could be extended by repeated dosing. The lack of correlation between exponent values and symptom severity or change implies that the exponent may not track depressive burden directly but instead may reflect underlying neurophysiological traits or treatment sensitivity—particularly in the occipital cortex.
Support for the aperiodic exponent as a marker of cortical EIB also comes from comparisons with other anesthetic agents. For instance, while ketamine reduces the exponent (indicating increased excitation), propofol increases it, consistent with enhanced inhibition.18,37 Notably, when participants were brought to a comparable level of sedation using either ketamine or thiopental, ketamine flattened the aperiodic exponent, while thiopental steepened it. 23 The 1/f slope effectively distinguished the differences in cortical E/I status induced by drugs, thus supporting the validity of 1/f slope as a potential biomarker for cortical EIB. 23 These opposite spectral effects reflect their distinct pharmacodynamic mechanisms and suggest that the aperiodic exponent may track drug-induced shifts in EIB. This interpretation is further supported by simulation studies using local field potentials, which demonstrate an inverse relationship between the 1/f slope and EIB, with steeper slopes associated with greater inhibitory tone. 17 Developmental data further suggest that the exponent is initially high in neonates, 21 decreasing with cortical maturation as excitatory activity rises. 51 In addition, optogenetic manipulation of interneurons in the prefrontal cortex of developing mice revealed that selective activation of interneurons enhanced inhibitory drive, reduced pyramidal neuron firing, and decorrelated population activity, whereas suppression of interneuron activity produced the opposite effect, increasing synchrony. 21 Together, these findings support the view that the aperiodic exponent is a broadband, non-oscillatory index of neural population activity that may more directly reflect EIB dynamics than traditional frequency band power metrics. 14 However, the biological specificity of the aperiodic exponent remains an area of ongoing debate. Notably, the relationship between the exponent and E/I balance appears asymmetric: while increases in inhibition consistently steepen the slope, increases in excitation do not reliably produce the expected flattening effect. 25 This asymmetry suggests that the relationship between the aperiodic exponent and cortical E/I balance is not a strictly bidirectional mapping, and the exponent may more directly reflect inhibitory tune than excitatory. Alternatively, as highlighted by Donoghue et al., 14 the 1/f-like background activity reflects scale-free neural dynamics that arise from multiple physiological mechanisms, including the temporal integration of synaptic currents, neuronal timescales, and population-level firing statistics. Changes in the aperiodic exponent may therefore reflect broader alterations in neural activity, rather than a one-to-one mapping onto E/I balance. Recent biophysical modeling further supports this interpretation, showing that the aperiodic EEG component arises from multiple mechanisms beyond E/I balance and lacks a singular physiological interpretation. 52 Moreover, shifts in the aperiodic component can influence apparent band-limited power, raising the possibility that some effects attributed to oscillatory changes may instead be driven by underlying aperiodic dynamics.
Interestingly, we did not observe any significant association between aperiodic exponent changes and serum levels of ketamine or norketamine, suggesting that the neurophysiological effects are not linearly dose-dependent or may reflect downstream network-level dynamics beyond direct pharmacokinetics. 38 Additionally, the absence of changes in APF indicates that the aperiodic exponent captures a distinct component of spectral activity not reflected in traditional oscillatory markers.
Despite the whole-brain exponent returning to baseline at 24 h, regional analyses revealed a persistent ketamine-induced increase in occipital exponent values. The occipital cortex may be particularly sensitive to ketamine’s excitatory effects due to its high glutamatergic activity,53,54 and involvement in depression-related neurochemical and functional changes.55 –57 Reduced GABA concentrations have been reported in the occipital cortex among unmedicated depressed patients,55,56 and treatments such as selective serotonin reuptake inhibitors (SSRIs) and electroconvulsive therapy (ECT) normalize these levels.56,57 These findings support the view that cortical regions play a broader role in mood regulation and may act as downstream targets or compensatory hubs within antidepressant response pathways. Notably, we found that pretreatment aperiodic exponent in the occipital cortex significantly distinguished responders from non-responders, with responders exhibiting steeper 1/f slopes before treatment. This suggests that individuals with higher inhibitory tone or reduced cortical excitation in occipital regions may be more likely to benefit from ketamine. ROC analysis further supported the potential utility of this regional marker, indicating moderate discriminatory power. These findings align with our prior research showing that lower pretreatment occipital signal complexity predicts greater antidepressant response to ketamine, 38 suggesting that occipital spectral characteristics may serve as relevant biomarkers for treatment stratification.
The predictive role of the occipital cortex is supported by a growing body of evidence linking this region to the neurobiology and treatment of depression. Importantly, this region has also been implicated in depression-related neurochemical changes, including reductions in GABA levels,56,57 and may play a broader role in mood regulation. These deficits appear to normalize (increased GABA levels) following effective antidepressant interventions, including SSRIs, 56 ECT, 57 and, to a lesser extent, CBT, 58 suggesting that restoration of occipital GABAergic tone may be one potential mechanism underlying treatment response. In this context, the occipital cortex may not only reflect depression-related inhibitory dysfunction but also serve as a promising biomarker region for predicting treatment response and guiding personalized interventions.
Limitations
While the aperiodic exponent is a promising non-oscillatory marker of cortical EIB, its biological specificity remains limited. Changes in the 1/f slope may reflect concurrent shifts in both excitatory and inhibitory processes, making it difficult to isolate the underlying mechanism: whether due to increased inhibition, reduced excitation, or a combination of both. As such, exponent changes should be interpreted cautiously and ideally in conjunction with neurochemical or receptor-level data. Future work integrating aperiodic analysis with pharmacological challenges, receptor-specific imaging, or computational modeling could help clarify these relationships. And there is no universal cutoff value that exists for the aperiodic exponent to distinguish excitatory from inhibitory cortical states, as it is influenced by factors such as age, cognitive status, health condition, 59 and methodological choices including frequency range and fitting algorithm. Monitoring within-subject dynamic changes over time is therefore a more appropriate approach, and future large-scale normative studies may establish disorder-specific reference ranges for clinical application. In addition, our sample size was modest, which limits statistical power and generalizability. Replication in larger, independent cohorts will be essential to validate the predictive value of regional aperiodic metrics, particularly in identifying ketamine responders. Finally, the single-blind, fixed-sequence design (placebo followed by ketamine) introduces potential order effects and expectancy-related bias, particularly for subjective clinical measures such as MADRS. Although this design was chosen to minimize pharmacological carryover and ensure a clean EEG baseline, its influence on treatment-related effects cannot be fully excluded.
Conclusion
Our findings show that subanesthetic ketamine reduces the EEG aperiodic exponent in MDD, consistent with a shift toward increased cortical excitation. Pretreatment occipital 1/f slope emerged as a potential predictor of antidepressant response, aligning with prior findings implicating the occipital cortex in depression-related inhibitory dysfunction and treatment effects. While global effects were transient, sustained occipital changes suggest region-specific modulation of E/I-related cortical dynamics with possible clinical relevance. These results support the aperiodic exponent as a potential marker of ketamine’s neurophysiological effects and a candidate predictor of treatment response.
Supplemental Material
sj-doc-1-tpp-10.1177_20451253261462240 – Supplemental material for Ketamine alters the aperiodic EEG exponent in major depression: implications for cortical E/I balance and treatment prediction
Supplemental material, sj-doc-1-tpp-10.1177_20451253261462240 for Ketamine alters the aperiodic EEG exponent in major depression: implications for cortical E/I balance and treatment prediction by Yujuan Liu, Xiaorong Liu, Sebastian Olbrich, Chong-Leong Lao, Haoyun Zhang, Martin Brunovsky and Cheng-Teng Ip in Therapeutic Advances in Psychopharmacology
Supplemental Material
sj-doc-2-tpp-10.1177_20451253261462240 – Supplemental material for Ketamine alters the aperiodic EEG exponent in major depression: implications for cortical E/I balance and treatment prediction
Supplemental material, sj-doc-2-tpp-10.1177_20451253261462240 for Ketamine alters the aperiodic EEG exponent in major depression: implications for cortical E/I balance and treatment prediction by Yujuan Liu, Xiaorong Liu, Sebastian Olbrich, Chong-Leong Lao, Haoyun Zhang, Martin Brunovsky and Cheng-Teng Ip in Therapeutic Advances in Psychopharmacology
Footnotes

References
Supplementary Material
Please find the following supplemental material available below.
For Open Access articles published under a Creative Commons License, all supplemental material carries the same license as the article it is associated with.
For non-Open Access articles published, all supplemental material carries a non-exclusive license, and permission requests for re-use of supplemental material or any part of supplemental material shall be sent directly to the copyright owner as specified in the copyright notice associated with the article.
