
Abstract
Objectives
To determine the prevalence, determinants, and management of dyslipidaemia in the 25–74-year-old urban black population of Cape Town and examine the changes between 1990 and 2008/09 in the 25–64-year-old sample.
Methods
In 2008/09, a representative cross-sectional sample, stratified for age and sex, was randomly selected from the same townships sampled in 1990. Cardiovascular disease (CVD) risk factors were determined by questionnaires, clinical measurements, and fasting biochemical analyses. Survey logistic regression analysis assessed the determinants of raised low-density lipoprotein cholesterol (LDL-C).
Results
There were 1099 participants in 2008/09 (392 men and 707 women; response rate 86%). The prevalence of raised total cholesterol (TC), raised LDL-C, and reduced high-density lipoprotein cholesterol (HDL-C) were 25.2% (95% confidence interval, CI, 20.0–31.3), 37.8% (95% CI 32.5–43.4), and 55.2% (95% CI 49.9–60.4) in men and 23.1% (95% CI 20.0–26.5), 47.0% (95% CI 43.1–50.9), and 66.8% (95% CI 62.9–70.5) in women, respectively. Between 1990 and 2008/09, raised LDL-C and reduced HDL-C prevalence increased significantly with no change for raised TC. Among participants with raised LDL-C, only 2.6% were aware of their diagnosis, 2.7% were on treatment, and 1.5% had LDL-C <3 mmol/l. In the logistic model, increasing age (odds ratio, OR, 1.04, 95% CI 1.03–1.05; p < 0.001), rising body mass index (OR 1.03, 95% CI 1.01–1.05; p = 0.003), and fat intake ≥30% of diet (OR 1.37, 95% CI 1.02–1.85; p = 0.035) were significantly associated with LDL-C ≥3 mmol/l but not sex, physical activity, or urbanization.
Conclusions
The dyslipidaemia pattern in this population requires full lipogram screening in high-risk individuals and demands improved management using a total CVD risk approach.
Keywords
Introduction
The value of abnormal blood lipid levels to predict ischaemic heart disease (IHD) has been studied for decades 1 with total cholesterol (TC) found to be an important risk factor for the development of IHD. In the INTERHEART study, which included data from South Africa, dyslipidaemia was found to be the single most powerful cardiovascular risk factor for IHD. 2 In South Africa, a substantial amount of cardiovascular disease (CVD) can be attributed to non-optimal cholesterol levels (≥3.8 mmol/l) and was estimated to cause 4.6% of all deaths in 2000. Approximately 59% of IHD and 29% of ischaemic stroke burden in ≥30-year-old adults were attributable to raised cholesterol. 1
There were considerable differences in the prevalence of raised TC (≥3.8 mmol/l) amongst the population groups in South Africa with rates in ≥30-year-old white, coloured, and Indian adults exceeding 80% in 2000 while the prevalence in the black population was much lower (27.6%) 1 . The black population usually has lower TC and a relatively higher proportion of high-density lipoprotein cholesterol (HDL-C) levels than other populations, indicative of a protective pattern against developing atherosclerosis and subsequent IHD. 3 However, with this group’s increasing uptake of behaviours that adversely affect lipid levels such as shifts towards unhealthy diets high in saturated fats and sedentary lifestyles, 3 it is likely that there may be a worsening of lipid profiles, particularly in urban settings.
Therefore, the Cardiovascular Risk in Black South Africans (CRIBSA) study aimed to ascertain the prevalence, determinants, and management of dyslipidaemia in the urban black population of Cape Town and to compare these findings with a similar study conducted in 1990. In line with the shift in attention from TC, the composite measure of the cholesterol content of lipoprotein particles including low-density lipoprotein cholesterol (LDL-C) and HDL-C, 1 to that of the individual components associated with TC, this study focused on LDL-C, the most atherogenic of the lipoprotein particles with raised levels required for the initiation and progression of atherosclerosis. 4
Methods
Study population and sampling procedure
In 2008/09, a random sample of 25–74-year-old men and women in the predominantly black residential areas of Langa, Guguletu, Crossroads, Nyanga, and Khayelitsha in Cape Town was selected to participate in this cross-sectional study. These areas were selected to ensure comparability with a 1990 study, the methodology of which has been described previously. 5 The sampling procedure for the current study included a three-stage cluster sampling and has been described in detail elsewhere. 6 The prespecified age and gender quotas included disproportionate sampling across age groups to ensure at least 50 men and women in each sex category. Among other, participants on tuberculosis or antiretroviral therapy or who had received cancer treatment within the last year were excluded.
Data collection
Data including socio-demographic characteristics, medical history, physical activity patterns (Global Physical Activity Questionnaire), 7 tobacco (WHO STEP-wise surveillance questionnaire), 8 and alcohol use (CAGE set of four questions) 9 were collected by administered questionnaires. Assets defining wealth, including ownership of consumer items (durable goods), dwelling characteristics (wall and flooring materials), and the source of drinking water and toilet facilities, were recorded.
Height, weight, and waist and hip circumferences were measured using standardized techniques. 10 Three blood pressure (BP) measurements were taken at 2-min intervals and the average of the second and third BP measurements were used in the analysis.
Blood samples, for lipid and glucose estimations, were drawn following an overnight fast of 10 hours, and a standard oral glucose tolerance test administered with blood samples taken 120 min later. 11 Blood samples were kept on ice and transported to the laboratory within 6 hours to be centrifuged, aliquotted, and stored at −80℃ until the assays were performed. These were analysed using the ACE Alera Clinical Chemistry System (Alfa Wassermann Diagnostic Technologies, Woerden, Netherlands). HDL-C was assayed using Cholesterol AE-12 reagent (Alfa Wasserman Diagnostic Technologies) comprising magnesium chloride and phosphotungstic acid.
Definitions
The components of dyslipidaemia were defined as follows: 12 TC >5mmol/l, triglycerides >1.5 mmol/l, HDL-C <1.2 mmol/l and calculated LDL-C using the Friedewald equation >3.0 mmol/l 13 or taking anti-lipid agents, and HDL-C:TC ratio <20%. Diabetes, impaired glucose tolerance and impaired fasting glucose were diagnosed according to the 1998 WHO definition. 11 Hypertension was defined as BP ≥140/90 mmHg or using antihypertensive agents.
Normal weight, overweight, and obesity, raised waist circumference (>94 cm in men and >80 cm and in women), and raised waist-to-hip ratio (>1.0 in men and >0.85 in women) were identified using standardized international criteria. 14 Smoking status was defined as smoking ≥1 cigarette a day. Problematic alcohol use was deemed present if two or more CAGE questions were answered affirmatively. 9 Physical inactivity was defined as <150 min of moderate to vigorous activity per week.
Statistical analysis
Data analyses were done using STATA 11. Descriptive statistics, including crude prevalence, were calculated using the weights based on the sample design and adjusted for the realized sample. A principal component analysis of the pooled data, based on the assets that defined wealth, was used to develop an asset index 15 and categories of relative wealth were created using tertiles.
The univariate analyses were adjusted for the sample realization and presented as mean and standard errors for the continuous data, and as percentages and standard errors for the categorical data. Survey-based unadjusted odds ratios (OR) and 95% confidence intervals (95% CI) for the associations of the socio-demographic variables and CVD risk factors with raised LDL-C were calculated. Survey multiple logistic regression analysis determined the independent associations of age, gender, body mass index (BMI), fat intake, physical activity, and urbanization with raised LDL-C.
The common age range of 25–64-years between the two studies was used for the comparison between the 1990 and 2008/09 data. The 1990 study comprised 292 men and 373 women in this age range. A direct comparison of the 2008/09 and 1990 datasets could not be conducted because of the geographic and demographic changes that occurred in Khayelitsha during this period; the population increased markedly with a concomitant expansion in area size. This necessitated the use of 95% CI for the comparison of the lipid data between the two surveys.
Further, the blood samples obtained in the 1990 study were random and not fasting as those drawn in 2008/09. Seeing that fasting blood samples are required to accurately measure triglyceride levels, these were not compared between the studies but triglyceride values <4.5 mmol/l were used to calculate LDL-C levels for the 1990 study. 16
Additionally, the 1990 samples were measured in a different laboratory on a Gilford batch analyser using the Boehringer Mannheim CHODPAP enzymatic method. 16 HDL-C was measured after precipitation of the apolipoprotein B containing lipoproteins using heparin/manganese chloride.
The University of Cape Town’s Research and Ethics Committee approved the study. All participants signed informed consent.
Results
The realized study sample comprised of 1099 participants: 392 men and 707 women (64% and 108% of the planned sample, respectively), with 17 excluded because they did not meet the inclusion criteria. The response rate was 86%: of the 187 non-responders (i.e. the selected people who the study team were unsuccessful in contacting), 79 (42%) were men.
Mean lipid concentrations and prevalence of dyslipidaemia by gender and age in 2008/09
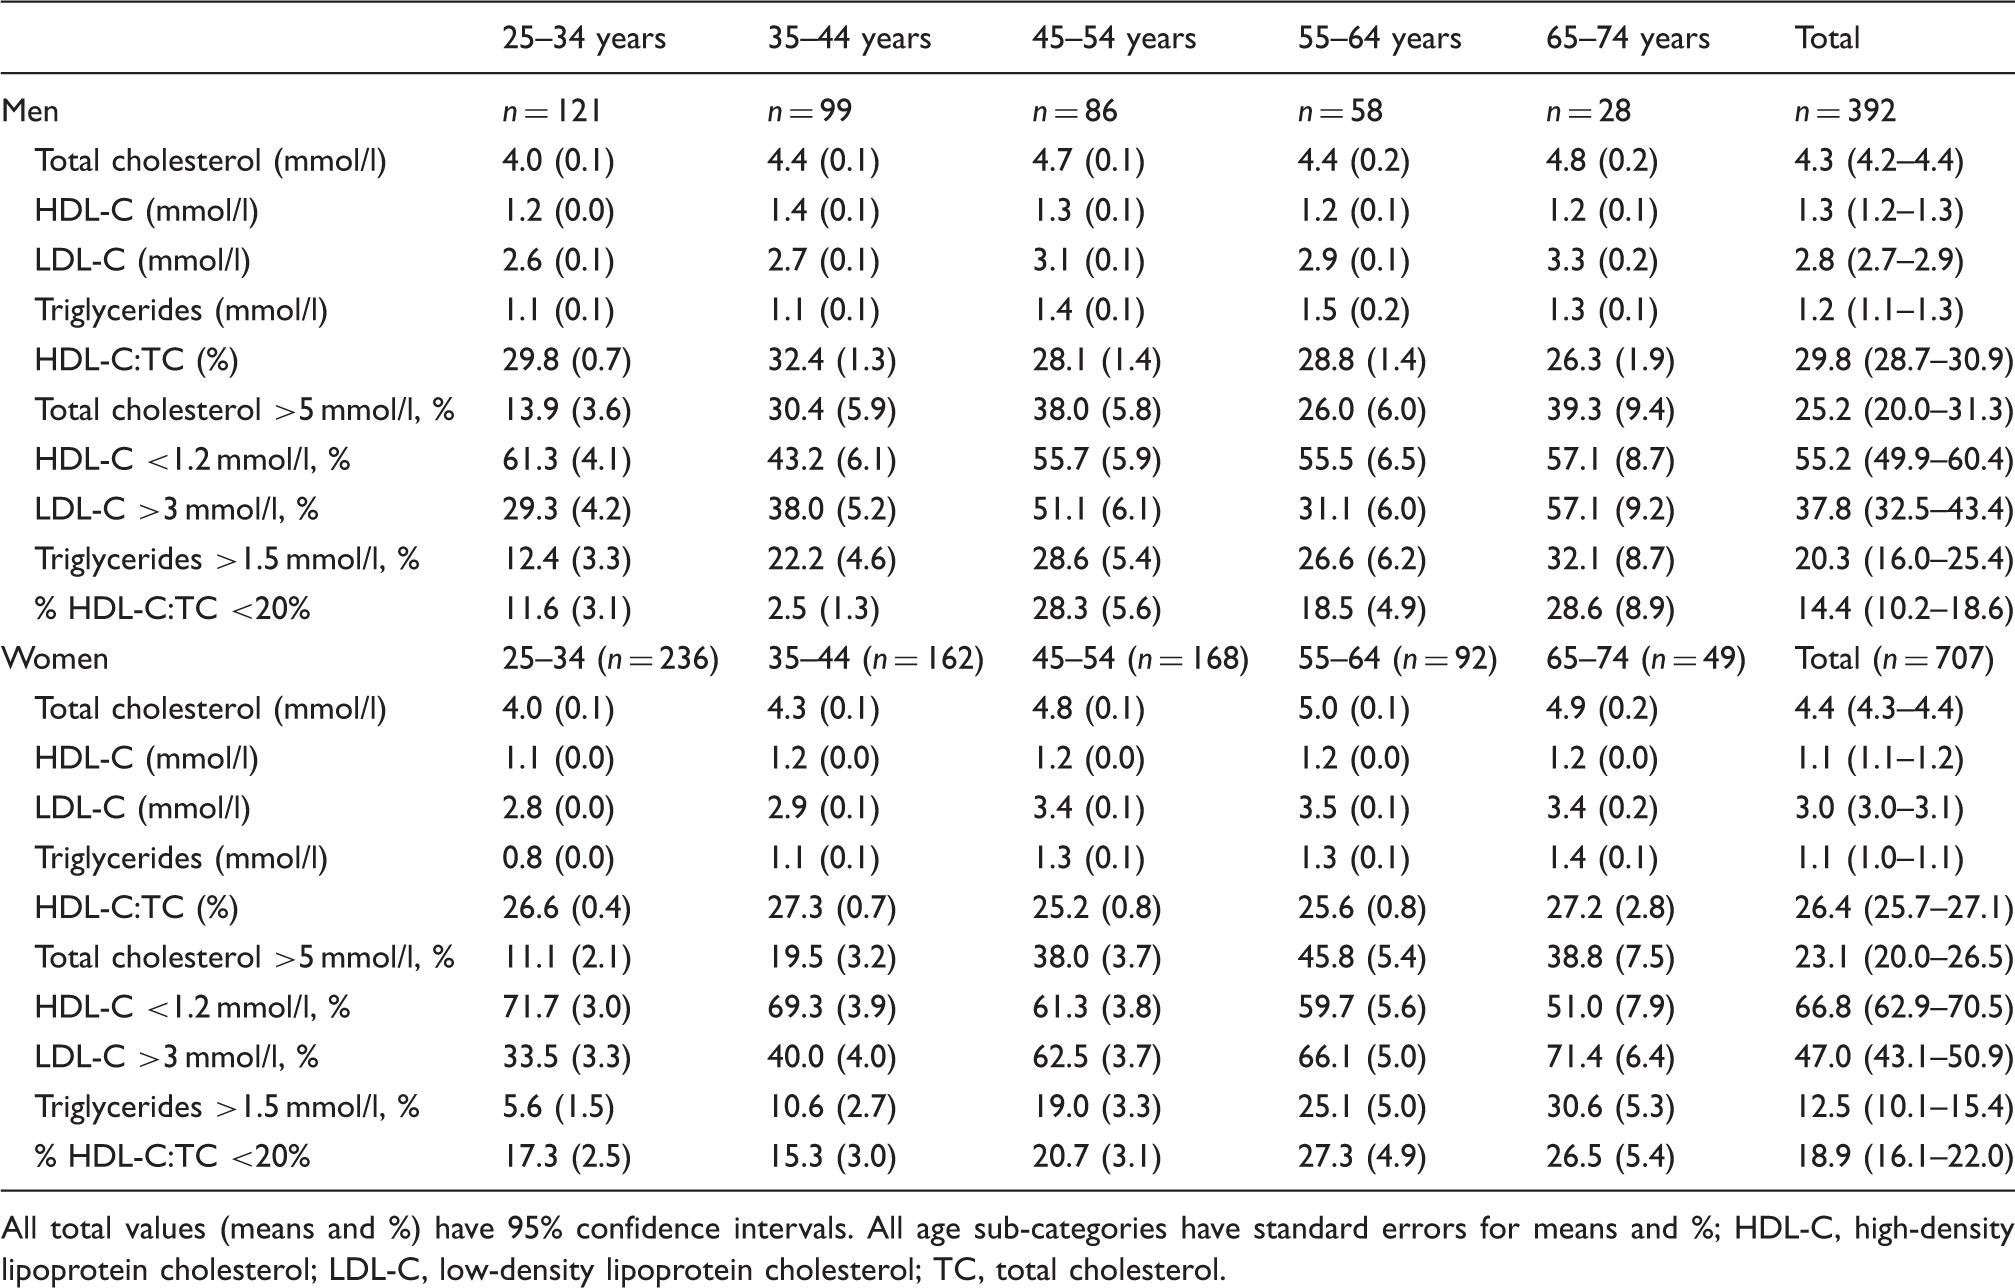
All total values (means and %) have 95% confidence intervals. All age sub-categories have standard errors for means and %
HDL-C, high-density lipoprotein cholesterol; LDL-C, low-density lipoprotein cholesterol; TC, total cholesterol.
The prevalence of raised TC among 25–64-year-olds in 2008/09 (23.3%) was significantly higher than in 1990 (19.3%) but by sex only reached significance in men (2008/09 24.4%, 1990 16.7%) and not women (2008/09 22.2%, 1990 21.8%; Table 2 and Figure 1a).
Prevalence of raised total cholesterol (TC) >5.0 mmol/l (a), raised low-density lipoprotein cholesterol >3.0 mmol/l (b), reduced high-density lipoprotein cholesterol (HDL-C) <1.2 mmol/l (c), and reduced HDL-C:TC ratio <20% (d) in 25–64-year-old men and women in 1990 and 2008/09. Comparison of lipid patterns in 25–64-year-old men and women in 1990 and 2008/09 All values (means and %) have 95% confidence intervals HDL-C, high-density lipoprotein cholesterol; LDL-C, low-density lipoprotein cholesterol; TC, total cholesterol.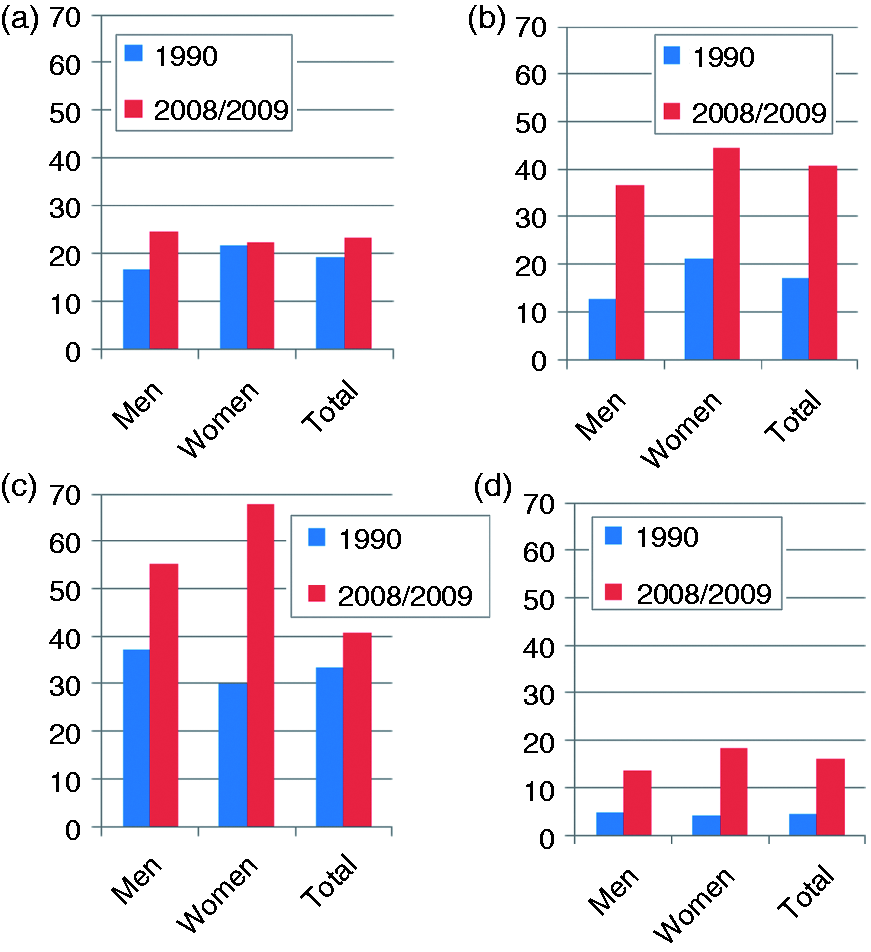
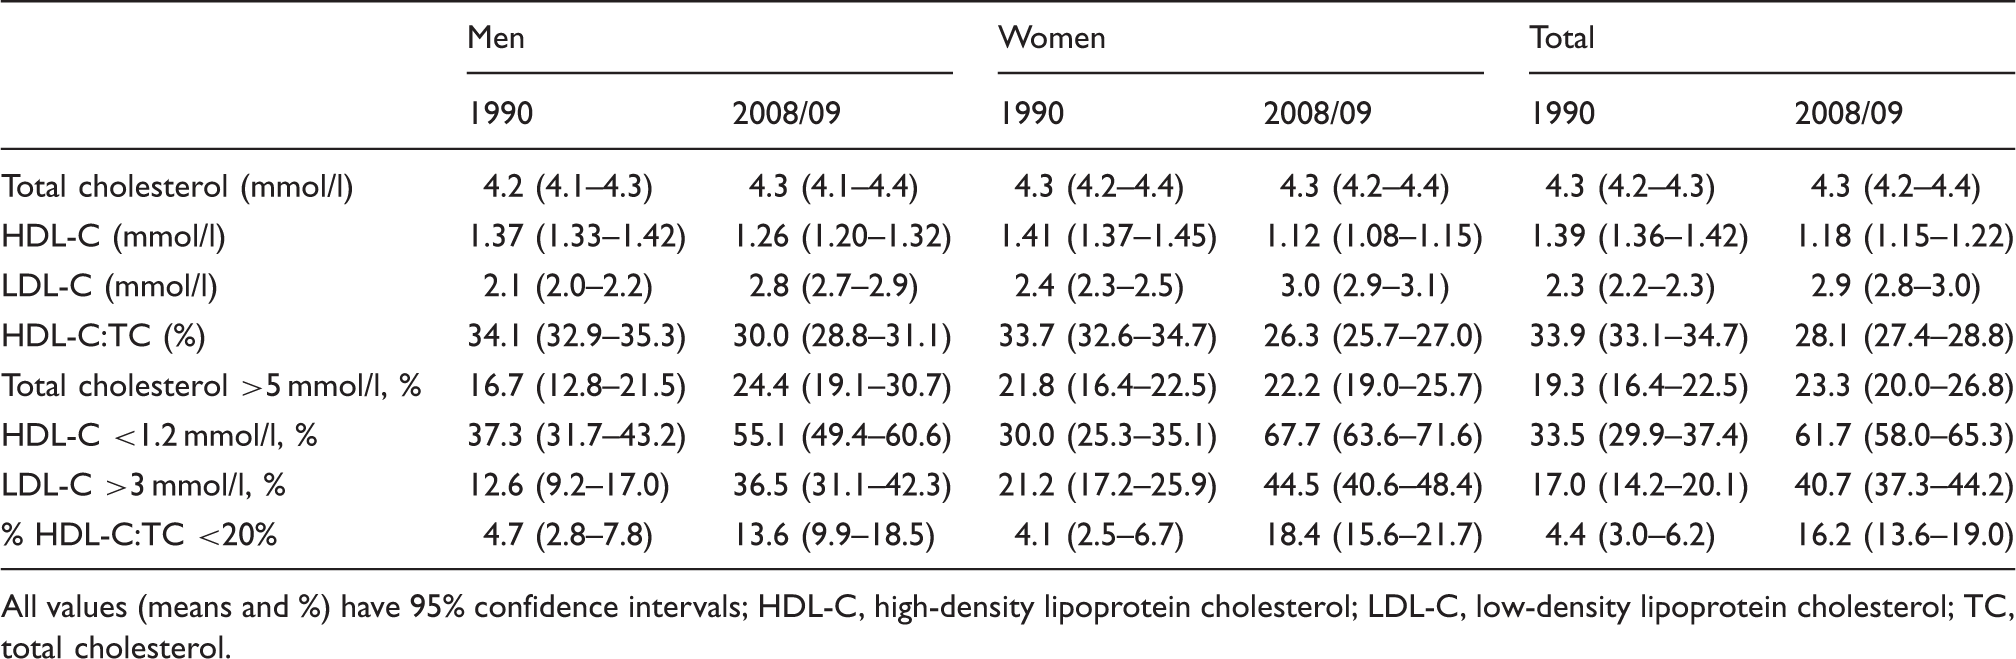
In contrast to TC, mean LDL-C levels were significantly higher in women compared to men (3.1 vs. 2.8 mmol/l; p < 0.001) as was the prevalence of raised LDL-C (47.0 vs. 37.8%; p = 0.003; Table 1). The peak prevalence for raised LDL-C was 57.1% in 65–74-year-old men and 71.4% in women. Among 25–64-year-old participants, mean LDL-C was significantly higher in 2008/09 in both men (2.8 mmol/l) and women (3.0 mmol/l) compared to 1990 (men 2.1 mmol/l; women 2.4 mmol/l; Table 2). The prevalence of raised LDL-C was also significantly higher in 2008/09 compared to 1990 for men (2008/09 36.5%; 1990 12.6%) and women (2008/09 44.5%; 1990 21.2%; Figure 1b).
Men compared to women had significantly higher mean HDL-C levels (1.3 vs. 1.1 mmol/l; p < 0.001) and HDL-C:TC ratios (29.8 vs. 26.4%; p < 0.001; Table 1). Low HDL-C was the most prevalent dyslipidaemia abnormality and more common in women than in men (66.8 vs. 55.2%; p < 0.001). The peak prevalence was 61.3% among 25–34-year-old men and 71.7% in women. In 2008/09 compared to 1990, mean HDL-C was significantly lower among 25–64-year-old men (1.26 mmol/l vs. 1.37 mmol/l) and women (1.11 mmol/l vs.1.41 mmol/l; Table 2). The prevalence of reduced HDL-C was significantly higher in 2008/09 compared to 1990 for both men (55.1 vs. 37.3%) and women (67.7 vs. 30.0%; Figure 1c). Also, the prevalence of reduced HDL-C:TC ratio was significantly higher in 2008/09 (men 13.6%, women 18.4%) than in 1990 (men 4.7%, women 4.1%; Figure 1d).
Among participants with raised LDL-C, only 2.6% (n = 14) were aware of their diagnosis, 2.7% (n = 16) were on treatment, and 1.5% (n = 10) had LDL-C ≤3 mmol/l.
Associations of socio-demographic and cardiovascular disease risk factors with raised low-density lipoprotein cholesterol (≥3 mmol/l or using lipid-lowering therapy) in 2008/09
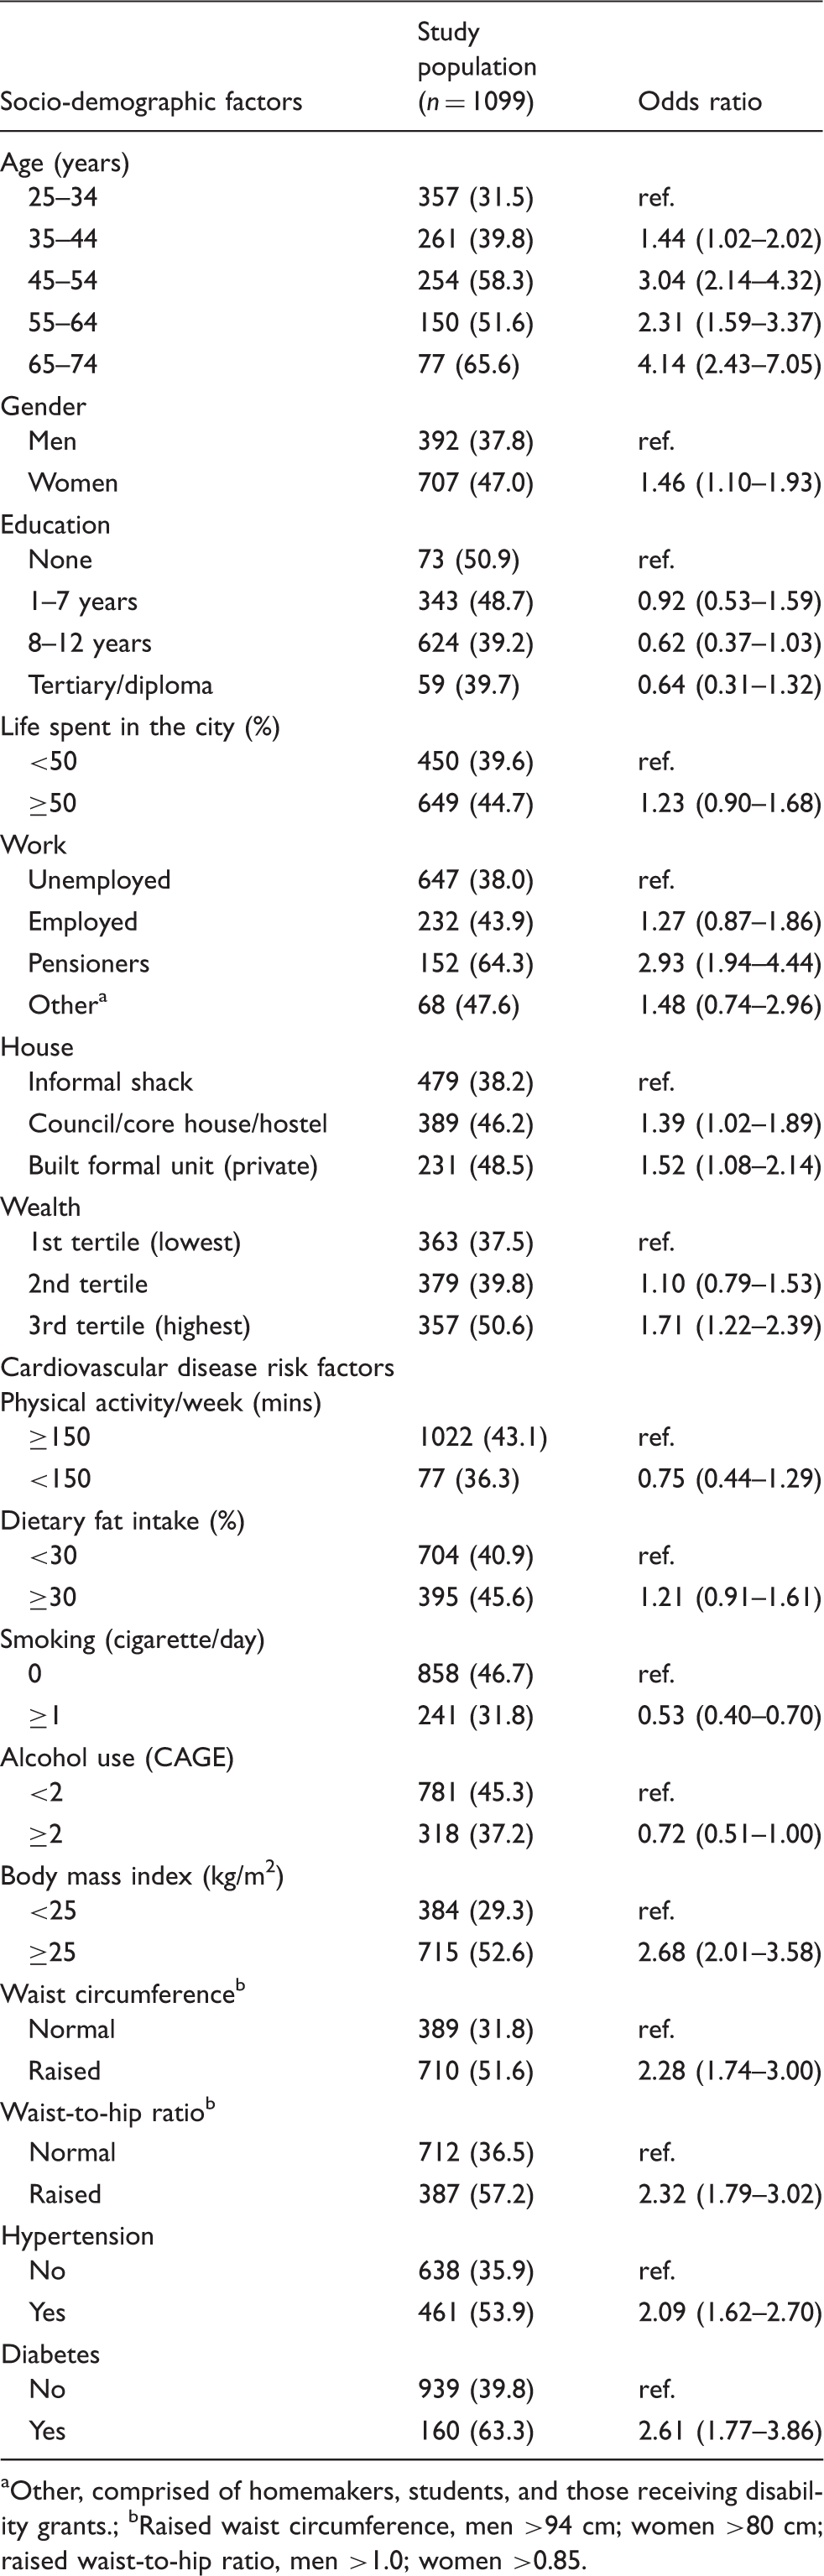
Other, comprised of homemakers, students, and those receiving disability grants.
Raised waist circumference, men >94 cm; women >80 cm; raised waist-to-hip ratio, men >1.0; women >0.85.
Multiple logistic regression model for raised low-density lipoprotein cholesterol (≥3 mmol/l) or using lipid-lowering therapy in 2008/09
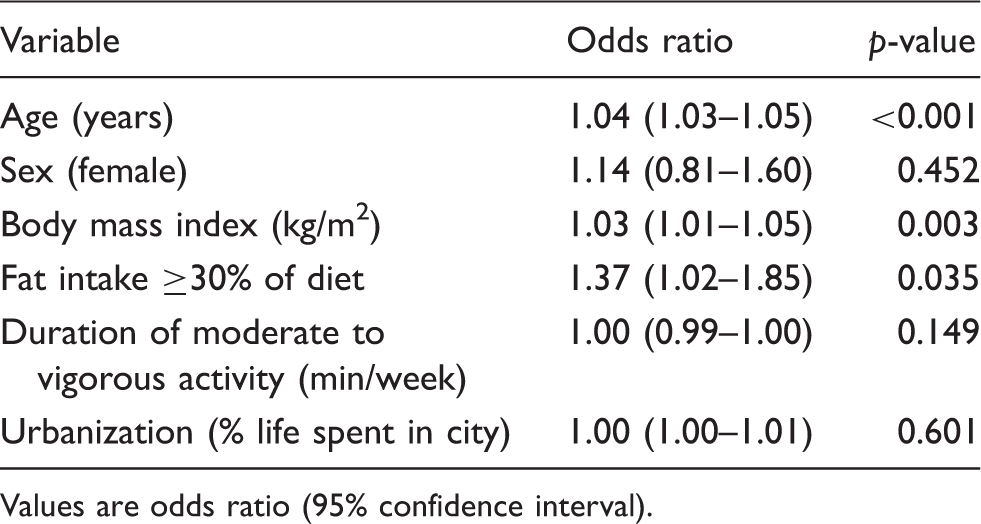
Values are odds ratio (95% confidence interval).
Discussion
In contrast to the 1990 study, these data reveal that dyslipidaemia, in particular the prevalence of high LDL-C and reduced HDL-C, were high in this population with a 2.4-fold rise in the former and a 1.8-fold increase in the latter over the last two decades. Notably, despite the markedly higher rates of raised LDL-C and reduced HDL-C, the prevalence of raised TC was similar in 2008/09 and 1990, illustrating the importance of measuring all the lipid parameters and not just TC, particularly in individuals of African descent. If only TC was measured in this study, almost half (48.5%) of the participants with raised LDL-C would have been missed and the deterioration in lipid profiles from 1990 would have remained unrecognized. Therefore, in order to accurately assess the lipid-related risk for IHD in this population, it would be prudent to focus on measuring or calculating LDL-C levels 1 as this is the usual target of treatment, as well as the other lipid components, which are independently related to cardiovascular risk.
Previously, the favourable lipid profile has been cited as the reason for the slower emergence of IHD compared to stroke among the black population in South Africa, despite the presence of other CVD risk factors, in particular hypertension. 17 Seeing that this protective mechanism against IHD is no longer evident with high LDL-C and reduced HDL-C levels now widely prevalent, this may suggest an eventual increase in IHD in this population as raised LDL-C is known to be the driving force for atherosclerosis.1,18,19 Indeed, a rise in the caseload of IHD in the urban black population of South Africa has already been noted.18,20
HDL-C levels have been gradually declining in Africa over the last four decades as documented by various studies and may be attributed to urbanization and the attendant changes in BMI, diet, and physical activity patterns. 21 Low HDL-C was also the most prevalent dyslipidaemia in Ghanaian women (59.1%) 22 and in urban Tanzanian men (10.3%), although the prevalence was lower than the findings in this study. 23 This is of concern because of the significant inverse relationship between HDL-C and CVD risk for all CVD outcomes as demonstrated in a meta-analysis of prospective studies. 24 Furthermore, recent research on cohorts has shown an increased trend in the incidence of IHD with decreasing HDL-C irrespective of the LDL-C level. 25 The higher prevalence of reduced HDL-C as well as the lower mean HDL-C levels in women compared to men was unexpected considering that generally more men than women are identified as having reduced HDL-C 26 as was found in this population in 1990. The causes of reduced HDL-C levels are largely unknown 26 and the reasons for worse HDL-C profiles in women compared to men can only be speculated. The considerably higher prevalence of overweight/obesity in women may be a contributory factor. On the other hand, smoking prevalence, a contributory factor to reduced HDL-C levels, was higher in men than in women. Higher mean HDL-C levels in men compared to women may be related to reduced activities of hepatic lipase which was found to determine higher HDL-C levels in men but not women. 27
The steep rise in the prevalence of reduced HDL-C:TC ratio over the past two decades is notable as HDL-C:TC ratio has been found to be a better predictor of atherosclerosis and CVD than any other single lipid parameter. 28 Low HDL-C:TC ratio has been shown to be associated with higher BP, increased triglycerides, and hyperinsulinaemia, each an independent risk factor for CVD.
The significant association of older age with raised LDL-C suggests that with demographic changes and ageing of this population, the prevalence of raised LDL-C will likely increase in the future. Also, considering that increasing BMI was positively correlated with raised LDL-C in this study, and the high and rising obesity levels in this population (1990 26.4%, 2008/09 36.8%), attributable to increases in women, future LDL-C levels are likely to worsen. The link between adiposity and dyslipidaemia is an important one with dyslipidaemia found to progressively develop with BMI ≥21 kg/m2. 29 The association between BMI and raised LDL-C present in this study accords with the relationship between obesity and LDL-C reported in the THUSA study conducted in another South African province. 30
Another variable significantly associated with raised LDL-C was high fat intake, an unusual association in cross-sectional studies, but which strengthens the importance of dietary modifications to improve lipid profiles. A recent analysis of the impact of dietary trends on TC in Sweden over 25 years showed that changes in dietary fat intake resulted in parallel shifts in TC levels with increased fat intake correlating with higher TC levels. 31 Similarly, the Dietary Approaches to Stop Hypertension (DASH) study, among others, has also reported the association of dietary fat intake with TC. 29 Replacing 60% of saturated fat intake with unsaturated vegetable oils and reducing dietary cholesterol intake could reduce TC levels by about 0.8 mmol/l (i.e. 10–15%). About 80% of this reduction will be in LDL-C. 32
The absence of an association between physical activity and raised LDL-C is in agreement with findings from other studies. 33 The evidence suggests that regular physical activity may increase LDL-C particle size but there is no significant reduction in LDL-C levels independent of weight loss.
The dyslipidaemic patterns of high levels of LDL-C and/or reduced HDL-C, characteristic of this study, impart a high risk for developing IHD and justify aggressive treatment to reduce cardiovascular risk 1 . Lipid-lowering agents, statins in particular, have been shown to greatly improve cardiovascular morbidity and mortality34,35 with every mmol/l reduction in LDL-C reducing mortality by 10%, all-cause morbidity by 20%, major cardiac events by 23%, and stroke by 17%. 36 The use of generic statins has subsequently resulted in cost-effective treatment of dyslipidaemia.
Nevertheless, the current study, in keeping with other South African studies,20,37–39 demonstrates that dyslipidaemia is mostly unrecognized and consequently not treated. Furthermore, as evident among participants on anti-lipid treatment in this study, less than half (45.2%, n = 7) were aware of their condition, highlighting the lack of awareness even among those receiving treatment. An integrated approach is required for the control of dyslipidaemia, particularly in light of the clustering of other CVD risk factors with raised LDL-C as shown in this study, with total CVD risk reduction the focus. 36
Study limitations
The cross-sectional study design precludes conclusions about causal associations between raised LDL-C and its determinants. The low sample realization in men (64%) that is characteristic of epidemiological studies in this country and likely due to their reluctance for giving blood samples, necessitated higher sampling weights and loss of precision. The use of self-reported rather than objectively measured ambulation or physical activity decreased data accuracy.
Conclusion
Dyslipidaemia in the urban black population of Cape Town can no longer be ignored; there has been a shift from the favourable lipid profile found almost two decades ago to that with a high prevalence of raised LDL-C and reduced HDL-C. Given that healthcare services in South Africa are overburdened and understaffed, and the need for anti-lipid therapy to be based on total cardiovascular risk assessment, it would be prudent to commence lipid screening in those with other established CVD risk factors such as diabetes, hypertension, and overweight/obesity as well as in high-risk individuals diagnosed on non-laboratory-based total CVD risk assessment.
Footnotes
Acknowledgements
The authors would like to acknowledge the participants, fieldworkers, MRC research nurse fieldworkers Debbie Jonathan and Theresa Gogela, fieldwork co-ordinator Erica April, study manager Serena van Haght, statistician Rebecca Shanmugam, and Dr Kirsty Bobrow. We also thank the City of Cape Town.
Funding
This work was supported by an unrestricted grant from Servier Laboratories (South Africa), the Medical Research Council of South Africa, the Initiative for Cardiovascular Health Research in Developing Countries (IC Health) Foundation Council, and Brigham Women’s Hospital and Harvard University.
Conflict of interest
NL has received honoraria from Novartis for serving on the steering committee for the Navigator Trial and travel support from Novo Nordisk, Eli Lilly Laboratories, and Sanofi Aventis. The other authors declare that there is no conflict of interest.