
Abstract
Background
Peak exercise capacity is an independent predictor for mortality in patients with coronary artery disease. However, sometimes cardiopulmonary exercise tests are stopped prematurely. Therefore, submaximal exercise measures such as the oxygen uptake efficiency slope have been introduced. The aim of this study was to assess the prognostic value of the oxygen uptake efficiency slope and other exercise parameters, in patients with coronary artery disease.
Methods
Between 2000 and 2011, 1409 patients with coronary artery disease (age 60.7 ± 9.9 years; 1205 males) underwent cardiopulmonary exercise tests. A maximal effort was not reached in 161 (11.5%) patients. The oxygen uptake efficiency slope was calculated and information on mortality was obtained. Cox proportional hazards regression analyses were used to assess the relation of oxygen uptake efficiency slope and other gas exchange variables with all-cause and cardiovascular mortality. Receiver operating characteristic curve analyses was performed to define optimal cut-off values.
Results
During an average follow-up of 7.45 ± 3.20 years (range 0.16–13.95 years), 158 patients died, among which 68 patients for cardiovascular reasons. The oxygen uptake efficiency slope was related to all-cause (hazard ratio: 0.568, p < 0.001) and cardiovascular (hazard ratio: 0.461, p < 0.001) mortality. When significant covariates were entered in the analysis, oxygen uptake efficiency slope remained related to mortality (p < 0.05). When other submaximal exercise parameters were added to the model, oxygen uptake efficiency slope and minute ventilation/carbon dioxide production slope also remained significantly related to mortality.
Conclusion
The oxygen uptake efficiency slope is an independent predictor for all-cause and cardiovascular mortality in patients with coronary artery disease, irrespective of a truly maximal effort during cardiopulmonary exercise tests. Furthermore, the oxygen uptake efficiency slope provides prognostic information, complementary to the minute ventilation/carbon dioxide production slope and peak exercise capacity.
Introduction
Exercise capacity is an independent predictor of all-cause and cardiovascular mortality in patients with coronary artery disease (CAD).1–3 Peak oxygen uptake (VO2 peak) is a highly reliable measure of overall exercise performance and has been accepted as the golden clinical standard for aerobic exercise capacity for many years.4,5 However, between 4 and 22% of the patients with cardiovascular diseases are incapable of reaching peak effort during a graded exercise test.6,7 Exercise tests can be interrupted prematurely by the patient for motivational or emotional (anxiety) reasons or by the supervisor for medical reasons. Therefore, submaximal exercise variables have been introduced in order to interpret exercise capacity in case of a non-maximal test. Moreover, these submaximal exercise variables might provide prognostic information. In 1996, Baba and co-workers introduced the oxygen uptake efficiency slope (OUES), 8 which represents the relationship between minute ventilation (VE) and oxygen uptake during graded exercise. Cardiovascular, musculoskeletal and respiratory fitness are, similar to oxygen consumption, incorporated into one single index.9,10 The OUES can be determined even when the exercise test is interrupted prematurely, is highly correlated with VO2 peak and is reliable and reproducible.9,10–15 Recently, a few studies reported on the OUES as a prognostic marker in patients with cardiopulmonary diseases.16–21
A more established exercise parameter to predict prognosis is the VE/VCO2 slope, which represents the linear regression relation of VE and carbon dioxide production (VCO2). 22 It is a measure of ventilatory efficiency that has been shown to be related to morbidity and mortality in various groups of patients, such as patients with chronic heart failure (CHF), congenital heart disease, chest pain suspected to be CAD and respiratory disease.17,23–26
A third submaximal parameter derived from gas exchange data is the oxygen uptake versus exercise intensity slope (VO2/workload slope), which represents the adequacy of the oxygen transport to the peripheral muscles. 27
Finally, two ventilatory thresholds can be determined using gas exchange data during graded exercise: 28 the first ventilatory threshold (VAT) and the second ventilatory threshold or respiratory compensation point (RCP). In patients with CHF, the VAT has been shown to be a reliable parameter for cardiovascular mortality prognostication.29,30
However, to the best of our knowledge, the prognostic value of the OUES and other submaximal gas exchange variables in patients with CAD has not been investigated yet and, therefore, the aim of the present study is to assess the prognostic value of the OUES in CAD, irrespective of the maximal character of the exercise test.
Methods
Study population
All patients with CAD referred to the outpatient cardiac rehabilitation programme at the University Hospitals Leuven (Belgium) between January 2000 and December 2010 were included in the study. CAD was defined by a recent history of acute myocardial infarction (AMI), percutaneous coronary intervention (PCI) or coronary artery bypass surgery (CABG). Patients were not included if they presented with exercise-induced myocardial ischaemia and/or malignant ventricular arrhythmias. Moreover, CAD patients with congenital heart disease, pacemaker or implantable cardioverter defibrillator implantation were excluded. The study was approved by the Local Ethical Committee. General and demographic information, exercise testing data, drug treatment and the presence of cardiovascular risk factors were collected at the time of enrolment in the programme.
Cardiopulmonary exercise testing
Graded exercise tests were performed on a cycle ergometer (Siemens-Elema 380B; Ergometrics 800S, Ergometrics, Bitz, Germany), in an air-conditioned laboratory where the room temperature was regulated at 18–22℃. Patients were asked to cycle at a constant rate of 60 rates per minute. The initial workload of 20 W was increased by 20 W every minute. Blood pressure was measured at rest, with the patient sitting on the bicycle and every 2 minutes during graded exercise. Heart rate and a 12-lead electrocardiogram (Max Personal Exercise Testing®, Marquette, WI, USA) were registered continuously. In- and expired gasses were analysed breath-by-breath by means of the Oxyxon Pro (Jaeger, Mijnhardt, The Netherlands). All patients were asked to perform a symptom-limited graded exercise test until exhaustion. Exhaustion was defined by the patients based on feelings of exhaustion, dyspnea, pain or tiredness in the legs. Peak values were defined as the 30 seconds average at the highest workload achieved. VO2 peak was compared to predicted normal values. 22 In addition, the capability of performing an exercise test until maximum was defined by the criteria described by Mezzani et al. 27 A maximal effort was assumed if the cardiopulmonary exercise testing (CPET) was terminated by the patient due to exhaustion, dyspnea, pain or tiredness in the legs and if (1) peak respiratory exchange ratio (RER) ≥1.10 and/or (2) rating of perceived exertion ≥16 on the Borg scale. 27 Otherwise, the test was coded as submaximal.
Respiratory data were averaged every 15 seconds. The first minute of exercise was excluded because of the often very irregular breathing pattern at the onset of exercise. PROC ROBUSTREG (SAS Institute Inc, Cary, NC, USA) was used in order to account for possible outliers. The OUES was determined from the relation VO2 = a log10 VE + b, in which a is the OUES and b is the intercept. 8 Results for the OUES were compared to the predicted normal values based on the equations proposed by our group, 31 for patients aged under 60 years and by Hollenberg et al., 10 for patients aged 60 years and older. Equations adjusted for Body Surface Area (BSA) were used in all patients and percentages of predicted values were calculated.
The VE/VCO2 slope was calculated from the equation:
Follow-up
The primary endpoint of the study was all-cause mortality; cardiovascular mortality was the secondary endpoint. Information about the vital status, date and cause of death of the patients was gathered by consulting the patients’ medical files. If no patient contact was registered in these files during the last 6 months, the patients’ general practitioners were contacted by post. The follow-up period ended on 31 December 2013. The overall response rate was 89%. Deaths were coded according the International Classification of Diseases, ninth revision. 32
Statistical analysis
We used SAS statistical software version 9.3 for Windows (Sas Institute Inc) to analyse the data and Graphpad Prism 6.0 (Graphpad Software, San Diego, CA, USA) to plot the figures and to perform receiver operator characteristic (ROC) curve analyses. Data are reported as mean value ± SD or number (percentage). Comparisons between groups were performed by unpaired t-test and chi-square contingency analysis. Distributions were checked for normality with the Shapiro-Wilk statistic. The Cox proportional hazards regression model 33 was used for survival analysis. Relative hazard rates with 95% confidence limits are reported for single and multiple regression analysis. Variables included in the multivariate analysis were OUES, age, gender, CABG, systolic blood pressure, history of diabetes as well as the maximal character of the graded exercise test. Dichotomous variables were coded 0 when the condition was absent and 1 when it was present. Furthermore, (ROC) curve analysis was performed to define cut-off values of several gas exchange variables. These values were chosen according to the highest sum of sensitivity and specificity. Statistical results were considered significant if p < 0.05.
Results
Patients’ characteristics and exercise parameters
Between January 2000 and December 2010, 1590 Caucasian CAD patients enrolled in the ambulatory cardiac rehabilitation programme, of which 181 patients were lost to follow-up. The patients who were lost to follow-up were younger than the included patients (p < 0.05). The general and exercise testing variables of the remaining 1409 patients (86% male) at baseline are described in Table 1. Overall, mean age was 60.7 ± 9.9 years. Mean OUES was 1739 ± 593, corresponding to 70 ± 20% of predicted and VO2 peak was 19.5 ± 5.6 ml/kg/min or 73 ± 17% of predicted. The distribution of the OUES is shown in Figure 1.
Distribution of the oxygen uptake efficiency slope (OUES) in our patient cohort, with indication of the cut-off we defined by receiver operator characteristic curve analysis and the mean predicted normal value. Baseline characteristics, peak exercise variables and relative hazard rates for all-cause mortality. RHR: relative hazard rate for all-cause mortality calculated by the single Cox regression model; BMI: body mass index; SBP: systolic blood pressure; DBP: diastolic blood pressure; CR: cardiac rehabilitation; AMI: acute myocardial infarction; CABG: coronary artery bypass surgery; PCI: percutaneous coronary intervention; OUES: oxygen uptake efficiency slope; VO2 at AT: oxygen uptake at aerobic threshold; RCP: respiratory compensation point; RER: respiratory exchange ratio. Comparisons made by chi-square analysis or unpaired student t-test. *p < 0.05; **p < 0.01;***p < 0.001. Values presented are mean value ± SD or number (%).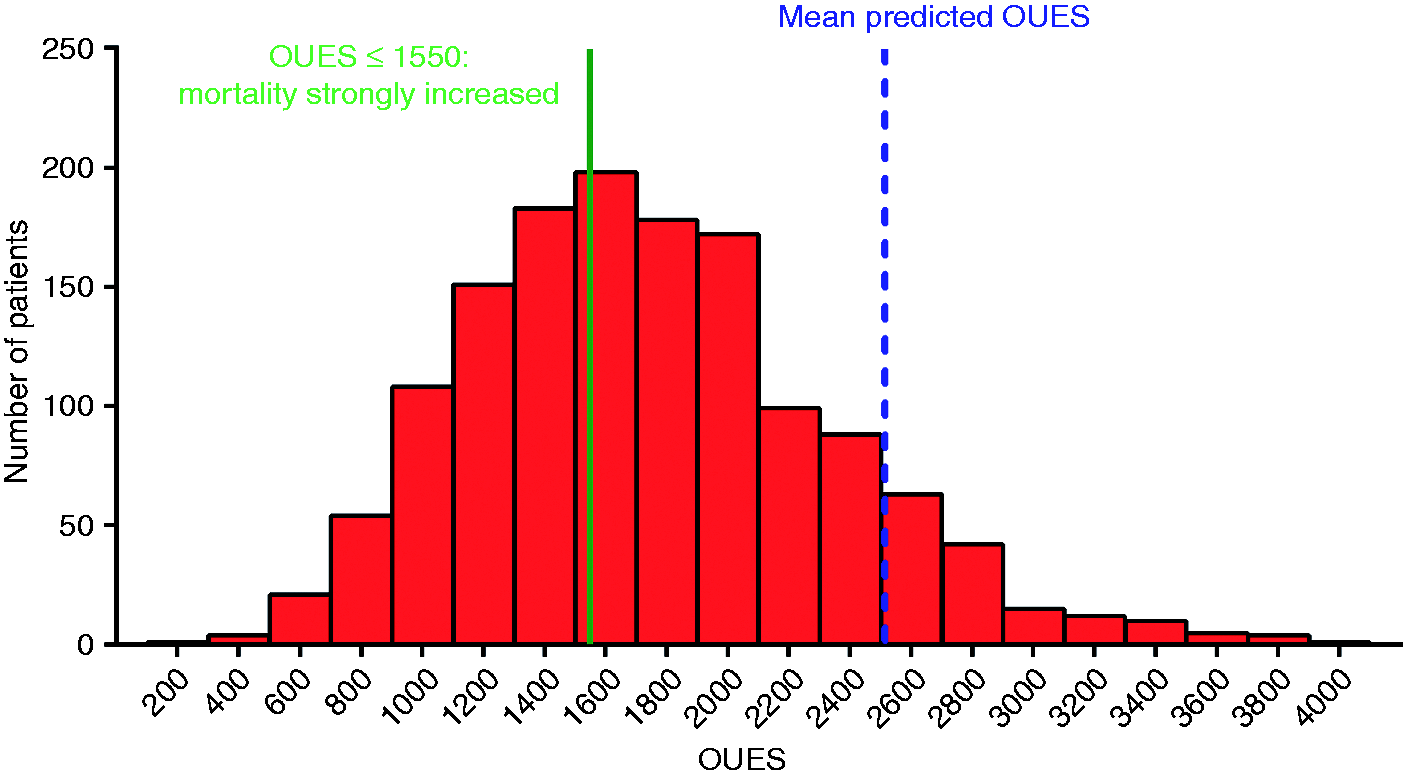
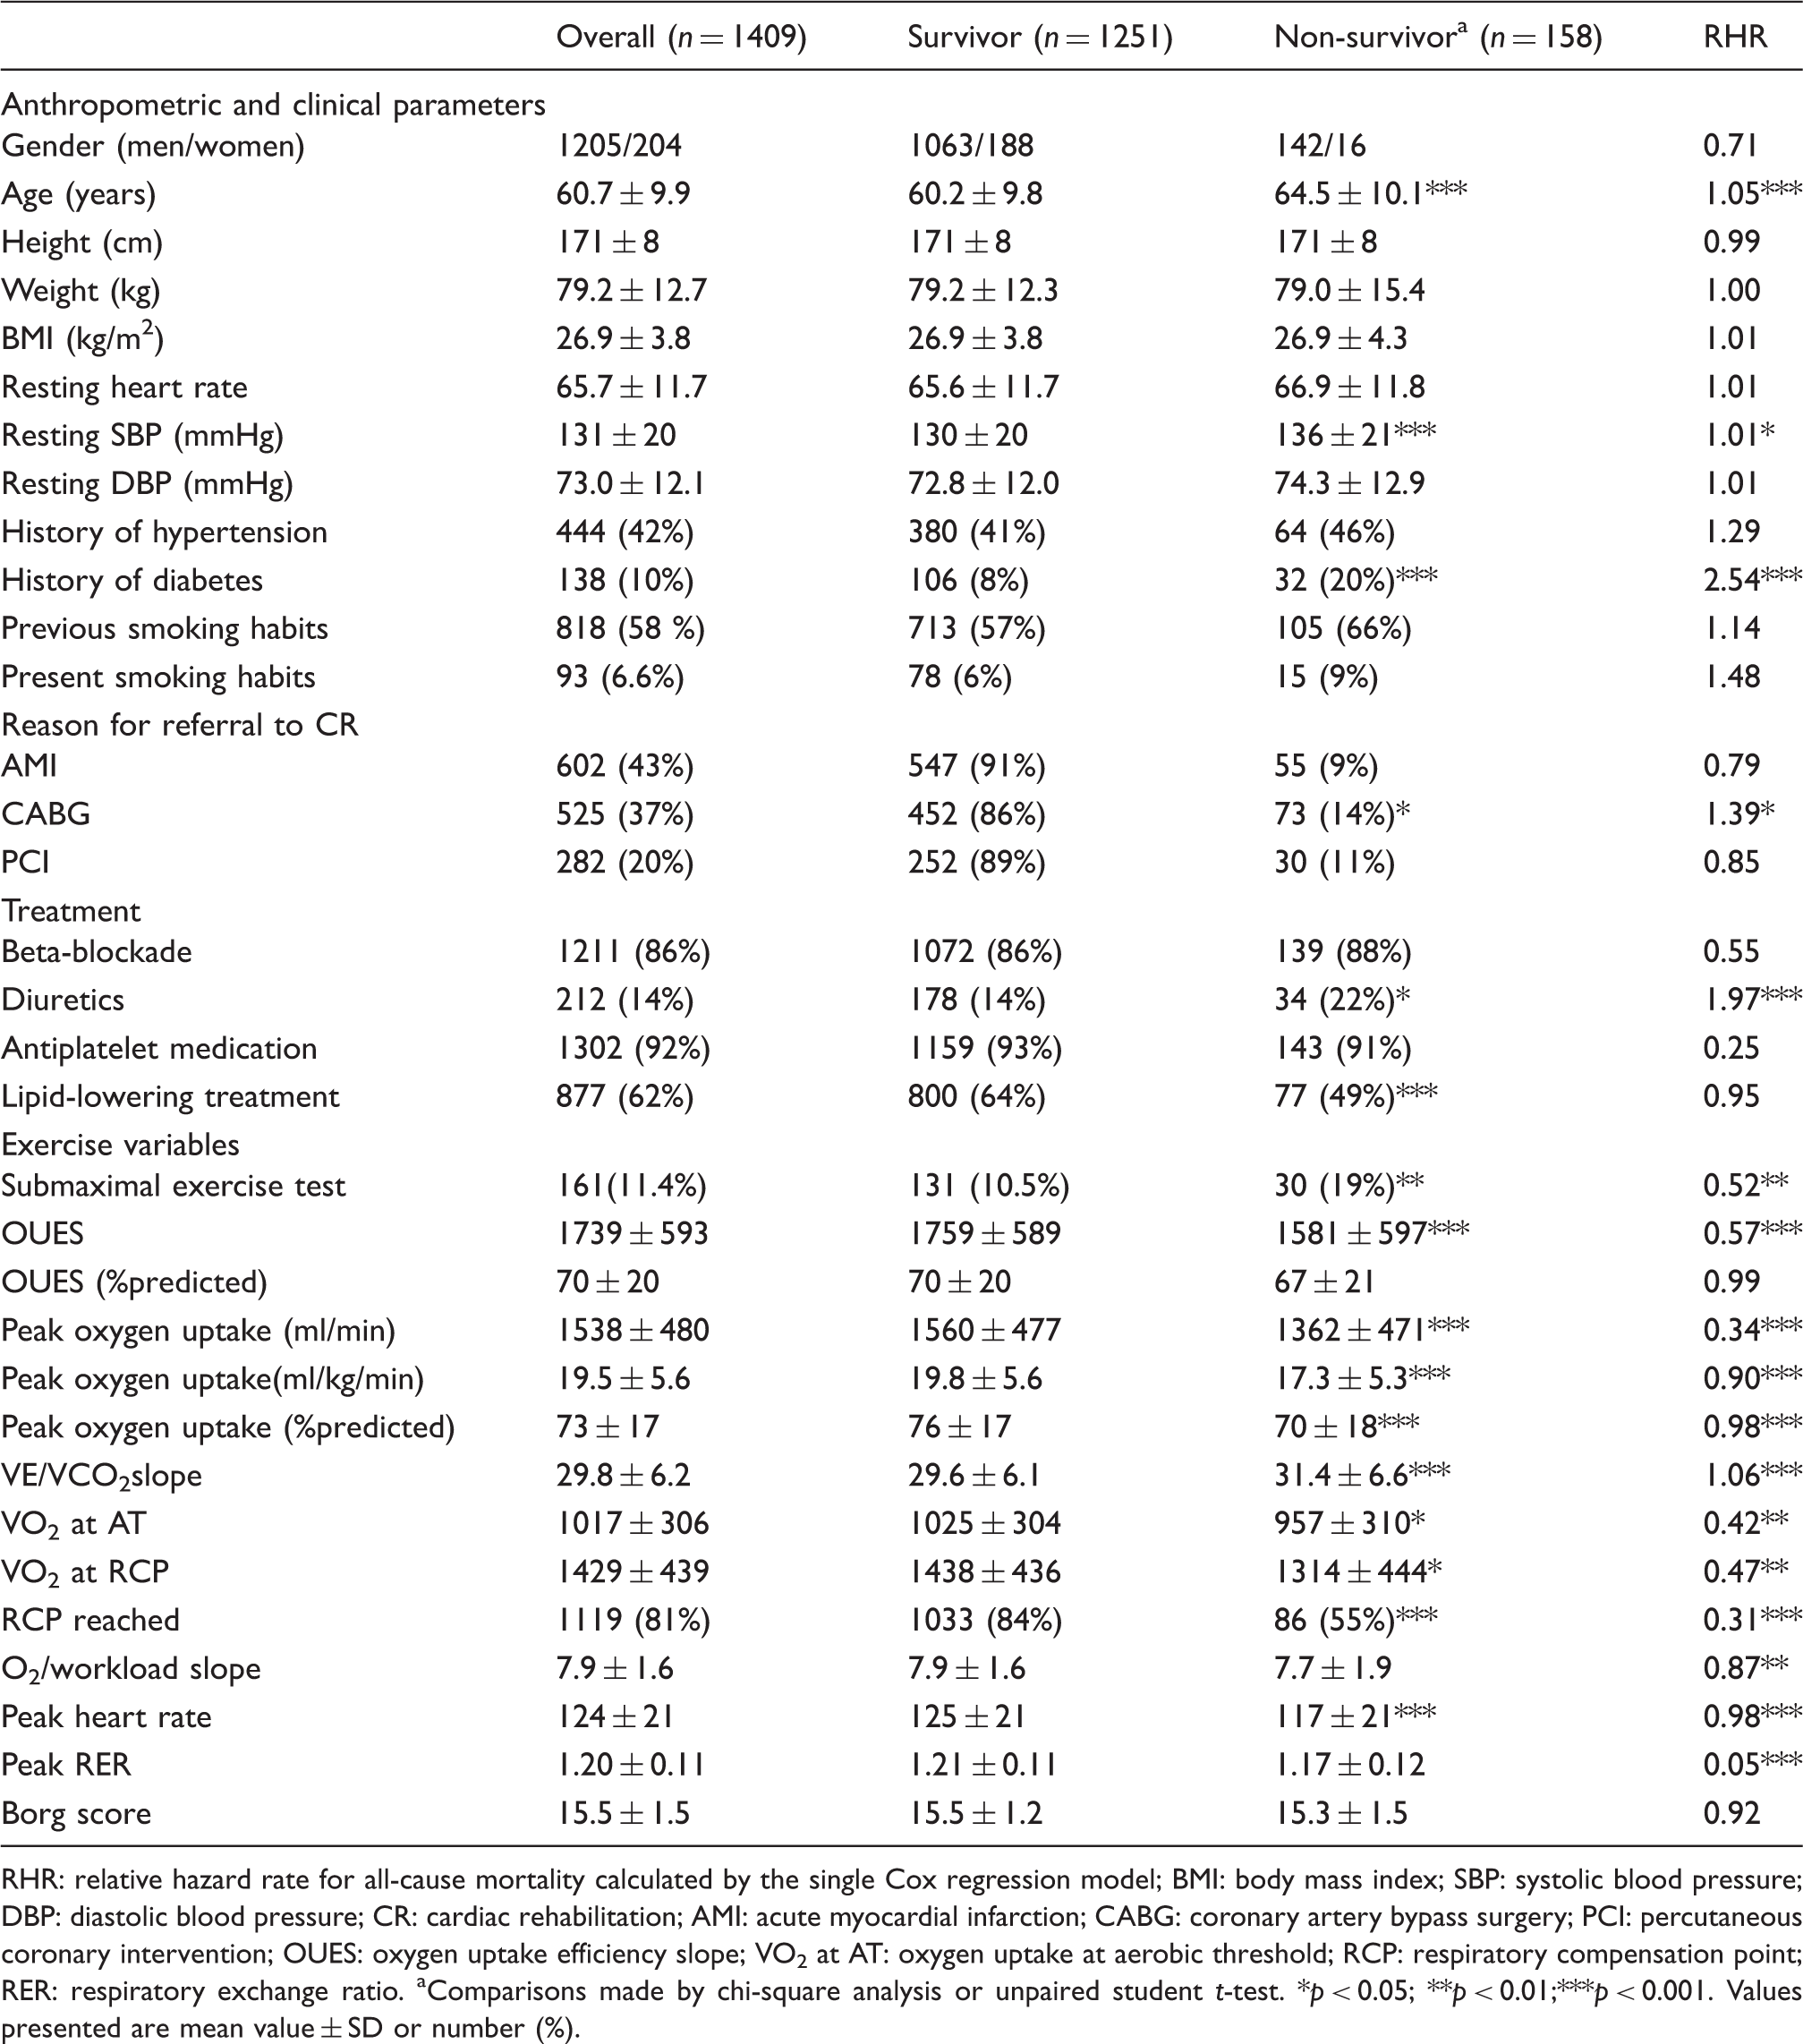
Baseline characteristics for the total group, survivors and non-survivors, together with the relative hazard rates for all-cause mortality, are provided in Table 1. At the entry of the study, survivors and non-survivors differed significantly for age, resting systolic blood pressure, history of diabetes, drug intake, recent history of CABG and most exercise testing variables (p < 0.05). Following the criteria mentioned above, 1248 patients could perform a graded exercise test until the maximum and 161 patients (11.5%) could not. Exercise tests were interrupted prematurely by the patient because of angina (n = 2), subjective complaints (n = 153) or fear (n = 4) and by the supervision (n = 2) because of arrhythmias. At the entry of the study, these groups differed significantly for age, gender, peak heart rate, peak RER and OUES (p < 0.05). The group that was not able to perform a graded exercise test until the maximum was older and more often female. They also had a higher body mass index and a lower exercise capacity. The RCP was reached in 1119 patients (81.1%) and not reached in 261 (18.9%) patients. In another 29 patients, the RCP could not be determined.
Follow-up
Vital status at the end of the follow-up period could be tracked in 1409 patients, 181 patients were lost to follow-up for the following reasons: physician (general practitioner-GP) retired (n = 21) or died (n = 12) or refused to cooperate (n = 8); patients changed from GP (n = 11); patient moved abroad (5) or no response from GP was received (n = 124). The total follow-up period was 58.6 patient-years with an average follow-up of 7.45 years (range 0.16 to 13.95). One hundred fifty eight (11.2%) patients died at an average of 5.47 ± 3.09 years after their start in the cardiac rehabilitation programme. The cause of death was cardiovascular in 68 patients, non-cardiovascular in 80 patients (of which 71 died of cancer) and unknown in 10 patients (official death certificates could not be checked). Moreover, patients who were included in the study after an AMI had a significantly higher risk for cardiovascular mortality compared to revascularized patients (p < 0.001). For all-cause mortality, no significant differences were found.
Prognostic significance of the OUES and other exercise parameters
Relative hazard rates and 95% confidence limits of the OUES for all cause and cardiovascular mortality.
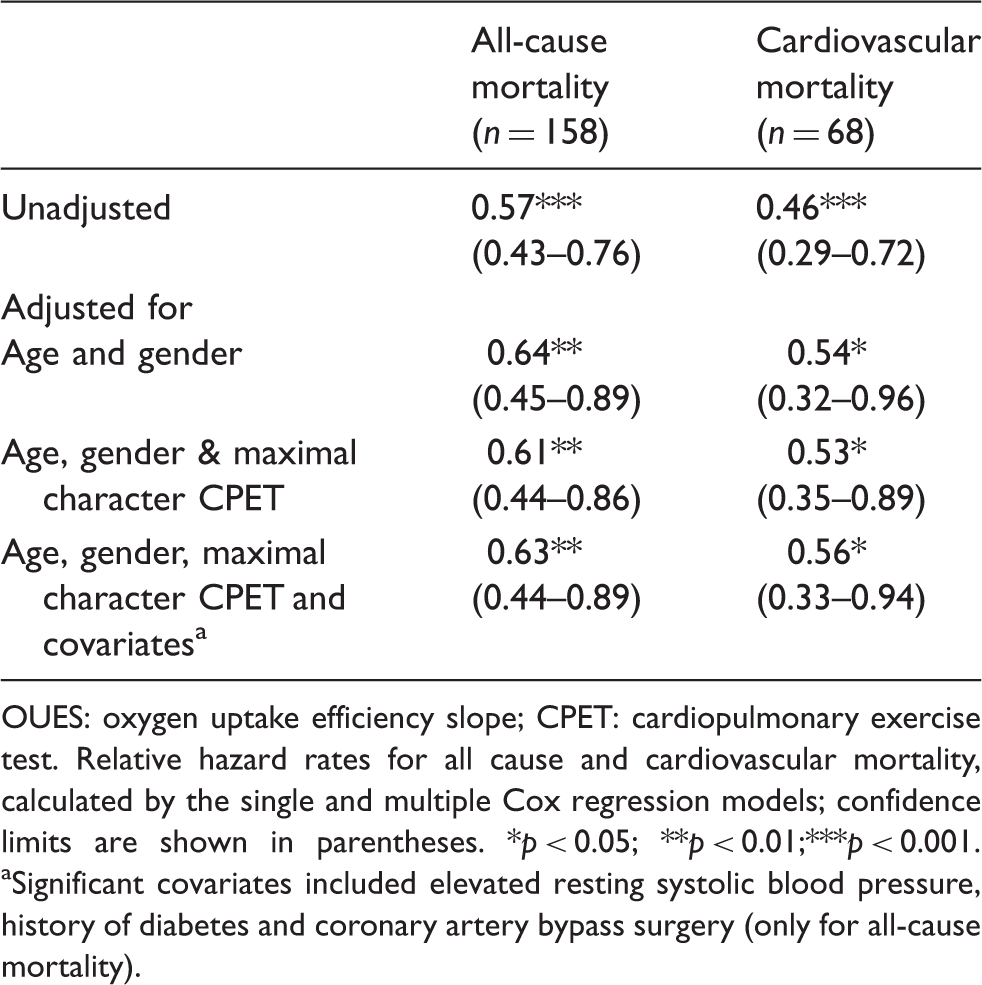
OUES: oxygen uptake efficiency slope; CPET: cardiopulmonary exercise test.
Relative hazard rates for all cause and cardiovascular mortality, calculated by the single and multiple Cox
regression models; confidence limits are shown in parentheses. *p < 0.05; **p < 0.01;***p < 0.001.
Significant covariates included elevated resting systolic blood pressure, history of diabetes and coronary artery bypass surgery (only for all-cause mortality).
Concerning the exercise parameters, based on the single cox proportional hazard regression, VO2 peak, OUES, VE/VCO2 slope, VAT, RCP and VO2/workload slope are all significant predictors of mortality (Table 1).
Based on ROC curve analyses, optimal cut-off values for the submaximal and maximal parameters were obtained, using their optimal sensitivity and specificity. The Kaplan–Meier plots for OUES, VE/VCO2 slope and VO2 peak with their optimal cut-off values are shown in Figure 2. This figure shows a significantly higher mortality for patients with an OUES ≤1550, a VE/VCO2 >31.5, and peak VO2 ≤18.30 ml/kg/min.
The Kaplan–Meier survival curves for (a) the groups of patients with oxygen uptake efficiency slope (OUES) above versus below the defined cut-off value of 1550; (b) the groups of patients with minute ventilation (VE)/carbon dioxide production (VCO2) slope above versus below the defined cut-off value of 31.5; (c) the groups of patients with peak oxygen uptake (VO2) above versus below the defined cut-off value of 18.3 ml/kg/min.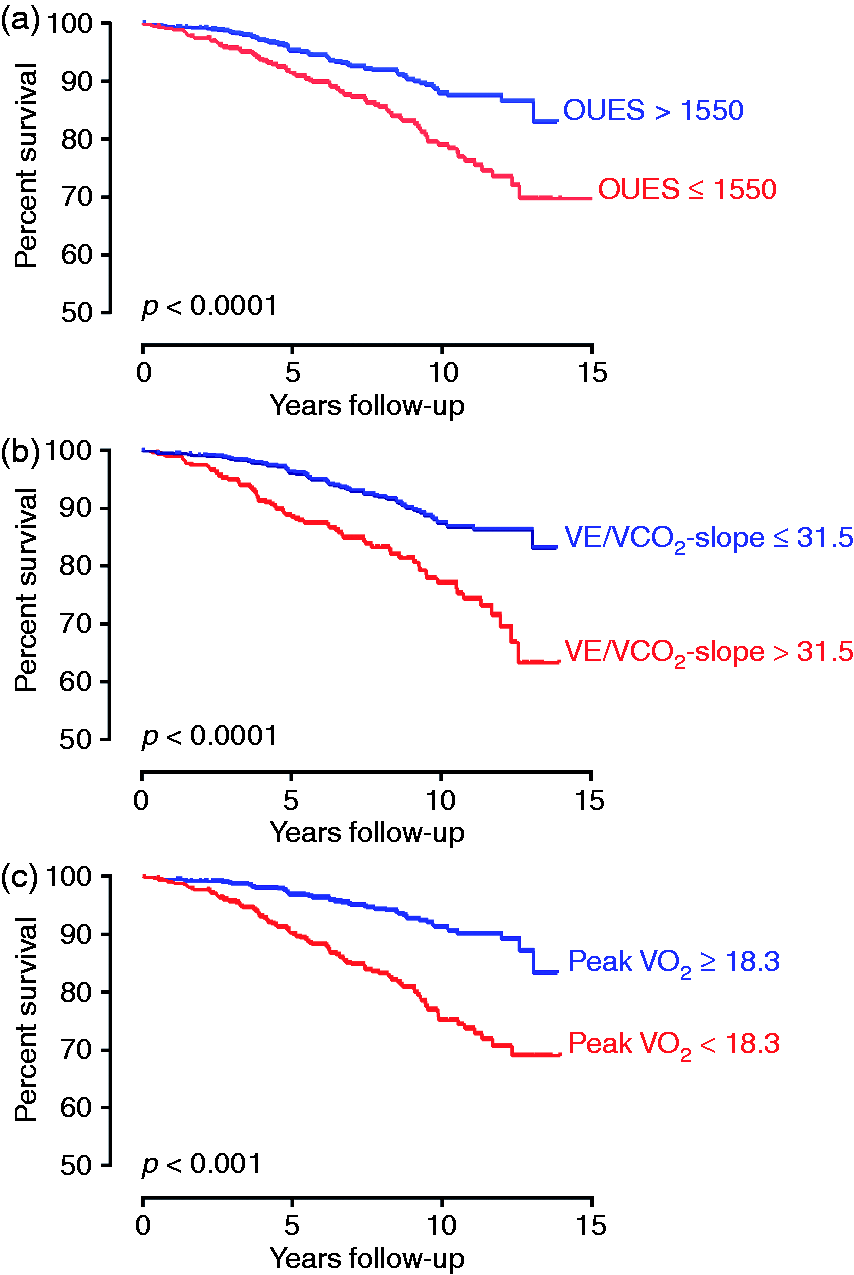
Discussion
To the best of our knowledge, this is the first study that investigated the prognostic value of the OUES in a large group of patients with CAD referred to cardiac rehabilitation. Our results show that, in a sample of 1409 CAD patients (86% males), the OUES is a predictor for all-cause and cardiovascular mortality, irrespective of the maximal character of the graded exercise test.
Cardiopulmonary exercise testing variables are an important source for prognostic information and a wealth of data has been published, showing the prognostic significance of VO2 peak in different patient populations, including patients with CAD.1–3,25,34,35 In patients with heart failure, it has been shown that the traditional exercise parameters such as the VE/VCO2 slope and VO2 peak are less useful as a prognostic marker when derived from a submaximal exercise test. 36 This should not hold true for the OUES, since calculations from the first 75% of gas exchange data of an exercise test do not differ from the values obtained from a complete exercise test.10–12
In our study, we demonstrated that the OUES is an independent prognosticator for both all-cause and cardiovascular mortality, even after adjusting for significant covariates such as age, elevated resting systolic blood pressure, diabetes, CABG and the maximal character of the exercise test.
Data regarding the prognostic value of the OUES are scarce. We demonstrated for the first time that an increase of the OUES with 100 is related to a 3.7% lower risk for all-cause and 4.4% lower risk for cardiovascular mortality in patients with CAD. Our results are in line with those from studies in patients with heart failure 18 or pulmonary hypertension 21 and indicate that a lower OUES can predict a worse prognosis.17,18,21 Davies et al. found that the OUES is the strongest predictor in a CHF population. 18 Conversely, Arena et al. found that the VE/VCO2 slope is prognostically superior to the OUES in the same population. 19 For OUES, they obtained a cut-off value of 1400, based on ROC curve analysis and found that, in the group with an OUES above 1400, there are 7% major cardiovascular events versus 17.7% in the group with OUES below 1400. Our cut-off values are slightly higher, probably because of the higher average exercise capacity of our CAD population (VO2 peak: 17.9 ml/kg/min versus 19.5 ml/kg/min in our study population), but the results are similar. We found that in the group with an OUES above 1550, 8.2 % of the patients died, and in the group with an OUES below 1550, 15.7% died.
For the VE/VCO2 slope our findings were similar. Our CAD patients have a slightly lower average VE/VCO2 slope (29.8 versus 32.1 in Arena) and also the cut-off value where patient with CAD show a significantly higher mortality rate, is lower than in Arena’s study (31.5 versus 34.0). Moreover, since 88% of our patients are capable of reaching peak effort, it seemed warranted that we also included the prognostic value of VO2 peak in our analysis. Based on ROC Curve analyses, we calculated the optimal cut-off value which represented a higher risk for mortality and in our case it was 18.3 ml/kg/min, which is much higher than the cut-off values of Davies and Arena (14.7 ml/kg/min and 14.3 ml/kg/min resp.). Again, it seems that CAD patients have, on average, a higher exercise capacity than patients with CHF. Therefore, there is a need for developing cut-off values specific for CAD patients. Furthermore, when combining the cut-off values of OUES, VE/VCO2 slope and VO2 peak, it gives us additional prognostic information as shown in Figure 3. Patients who have an OUES < 1550, a VE/VCO2 slope >31.5 and VO2 peak <18.3 ml/kg/min have a significant worse prognosis than patients who have a bad performance on one or two exercise variables. Patients who have a high exercise capacity and perform well at all three parameters have the best prognosis. Therefore, we suggest using all three parameters complementary to each other when it comes to estimating prognosis.
The Kaplan–Meier survival curves with indication of the risk of early mortality based on the cut off values of the oxygen uptake efficiency slope (OUES), peak oxygen uptake (VO2) and minute ventilation (VE)/carbon dioxide production (VCO2) slope. High risk: patients who have an OUES <1550, a VE/VCO2 slope >31.5 and peak VO2 <18.3. Moderate risk: bad performance on for one or two exercise variables. Low risk: good performance on all three parameters.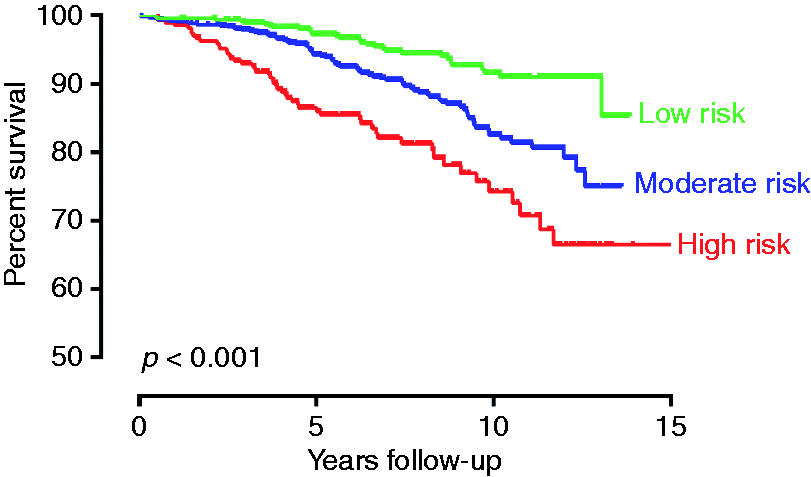
Study limitations
A first limitation of our study consists of the fact that all patients voluntary chose to participate in the cardiac rehabilitation programme and might as such constitute a selected population. Second, patients who were lost to follow-up were significantly younger than the studied group. However, since the OUES remained significantly associated with mortality after adjustment for age, it is reasonable to assume that this has not significantly influenced our study findings. Third, the female gender was under-represented in the present study. Finally, data on possible influencing co-factors like left ventricular ejection fraction and habitual physical activity levels were not available.
Conclusion
Exercise capacity as expressed by the OUES is an independent predictor for all-cause and cardiovascular mortality in patients with CAD, irrespective of the ability to reach a peak effort during CPET. Furthermore, we developed specific cut-off values for CAD indicating a higher risk for all-cause mortality. The OUES provides prognostic information, on top of the VE/VCO2 slope and VO2 peak.
Footnotes
Funding
This work was supported by Research Foundation Flanders (FWO) (support to V.A.C. as a postdoctoral research fellow).
Conflict of interest
None declared.
Acknowledgements
This work was presented during a poster presentation session at Europrevent 2014 and during a moderated poster presentation session at the ESC Congress 2014 where it was selected as the best poster presentation of the session. The authors wish to thank J. Meertens, D. Schepers, F. Florequin and the Department of Management, Information and Reporting of the University Hospitals Leuven for their invaluable help in data collection and management.