
Abstract
Aims
Obesity and cardiovascular diseases (CVDs) often co-occur, likely increasing the intensity of healthcare resource utilization (HCRU). This retrospective, observational database study examined the joint effect of obesity and cardiovascular risk status on HCRU and compared HCRU between body mass index (BMI) categories and CVD-risk categories in the UK.
Methods
Patient demographics and data on CVD and BMI were obtained from the UK Clinical Practice Research Datalink. Cardiovascular risk status, calculated using the Framingham Risk Equation, was used to categorize people into high-risk and low-risk groups, while a CVD diagnosis was used to define the established CVD group. Patients were split into BMI categories using the standard World Health Organization classifications. For each CVD and BMI category, mean number and costs of general practitioner contacts, hospital admissions and prescriptions were estimated.
Results
The final study population included 1,600,709 patients. Data on CVD status were available on just over one-quarter of the sample (28.6%) and BMI data for just less than half (43.2%). The number of general practitioner contacts and prescriptions increased with increasing BMI category for each of the three CVD-risk groups. The group with established CVD had the greatest utilization of all components of healthcare resource, followed by high CVD risk then low CVD-risk groups.
Conclusion
Increasing BMI category and CVD-risk status both affected several HCRU components. These findings highlight the importance of timely obesity management and treatment of CVD-risk factors as a means of preventing increasing HCRU.
Introduction
Obesity is a major cost burden globally, with the proportion of healthcare expenditure on obesity care particularly high in countries reporting a high prevalence of obesity. In 2016, just under one-third of the adult UK population had obesity, 1 and obesity was recorded as a primary or secondary diagnosis in over 600,000 National Health Service (NHS) hospital admissions. 2 It is projected that in 2025, the UK obesity prevalence will rise to roughly 35%, 1 likely further increasing the burden on the NHS.
At an individual level, the relationship between obesity and greater healthcare costs is well established. In a meta-analysis comprising 75 studies, 3 based on USA and UK prevalence estimates, overweight and obesity were associated with increases of 12% and 36% in total annual healthcare costs, respectively, compared with individuals of healthy weight (body mass index (BMI) 18.5–<25 kg/m2). Additionally, increasing BMI has been shown to be associated with greater healthcare resource utilization (HCRU) 4 driven by obesity-related comorbidities, including cardiovascular disease (CVD). 5
Obesity is a major risk factor for development of CVD6 with the risk of atherosclerosis 7 and heart failure,8,9 amongst others, increasing with increasing BMI. CVD is the primary cause of mortality in individuals with obesity 10 and accounts for just over one-quarter of all deaths/year in the UK. 11 Many risk factors are thought to drive the association between obesity and CVD, including metabolic abnormalities such as dyslipidaemia, insulin resistance and chronic inflammation. 12 Even in the absence of metabolic abnormalities, individuals with obesity have an increased CVD risk compared with individuals of normal weight. 13 In the UK, CVD-associated annual costs total almost £30bn, with 60% of these costs for healthcare. 14
To our knowledge, the relationship between obesity and CVD and their impact on HCRU is yet to be investigated. Understanding this relationship may provide an important imperative for healthcare professionals, informing strategies for secondary prevention and cost management for both diseases.
The aim of this retrospective, observational database study was to investigate the association between obesity and HCRU and associated costs in patients at risk of, or with, CVD in a representative cohort of UK adults.
Methods
Study design
This was a retrospective, observational cohort study using data derived from the large population-based Clinical Practice Research Datalink (CPRD) Gold database, an anonymized UK electronic medical record database sponsored by the Medicines and Healthcare products Regulatory Agency and National Institute for Health Research, as part of the Department of Health and Social Care. The CPRD obtains ethics approval from the UK’s Health Research Authority Research Ethics Committee (REC) (East Midlands, Derby, REC number 05/MRE04/87) to receive and supply patient data for public health research. Therefore, no additional ethics approval is required for observational studies using CPRD Gold data for public health research, subject to individual research protocols meeting CPRD data governance requirements. The database includes information regarding general practitioner (GP) contacts, diagnoses, prescriptions, laboratory tests, demographic data and anthropometric measures, collected by general practice staff during patient consultations. Details of data measurements and categorization in CPRD are described elsewhere. 15 Data on admissions, discharge and inpatient procedures as well as date of death were obtained via linkage to Hospital Episodes Statistics (HES) and Office for National Statistics (ONS) Cause of Death register. The Independent Scientific Advisory Committee provided permission for data access (protocol identifier 18_127RA5); the study was conducted according to the principles of the Declaration of Helsinki. For the study design, see Figure 1.
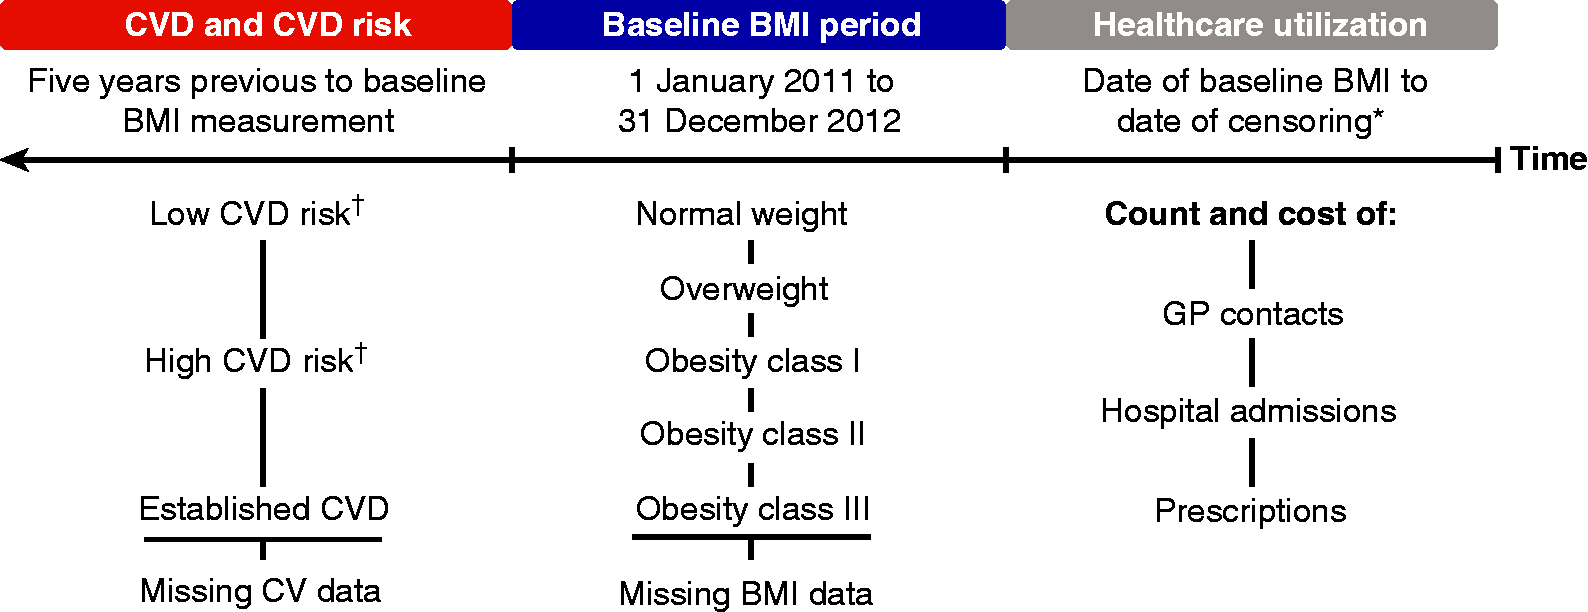
Study design, categorization into BMI categories and CVD-risk groups and healthcare resource utilization outcomes during the follow-up.
Population
Patients registered in the CPRD Gold database at least once in the baseline period (between 1 January 2011 and 31 December 2012) with acceptable data (as determined by the database standards) and ability to be linked to external HES and ONS databases were included in the study. Patients were excluded if they were aged <18 years, only had underweight or invalid BMI measurements in the baseline period (<18.5 or >70 kg/m2), had been registered in the database for <5 years prior to baseline date or had a censoring date prior to the baseline date. Pregnant women, determined via the CPRD Pregnancy Register, and patients diagnosed with type 1 diabetes were excluded.
BMI assessment
The most recent BMI measurement in the baseline period was obtained and the visit date chosen as the baseline date for that patient. Patients were categorized into BMI classes based on World Health Organization criteria: 16 normal weight (BMI 18.5–<25 kg/m2), overweight (BMI 25–<30 kg/m2), obesity class I (BMI 30–<35 kg/m2), obesity class II (BMI 35–<40 kg/m2) and obesity class III (BMI ≥40 kg/m2). Patients with missing BMI were included as a comparison group; for these individuals, the latest visit in the baseline period was chosen as the baseline date.
CVD-risk assessment
Patients were classified as having established CVD based on a list of 481 selected read codes for CVD diagnoses including acute myocardial infarction, acute coronary syndrome, stroke, transient ischaemic attack and peripheral artery disease. For patients without established CVD at baseline, CVD risk was assessed based on the latest available measurements in the year prior to the baseline date. Given that the database included information on age, sex, diabetes status, systolic blood pressure, total cholesterol, high-density lipoprotein cholesterol, smoking and treatment for high blood pressure, it was determined that the most appropriate and feasible method to classify CVD risk was to use the Framingham Risk Equation. 17 Using this method, patients were classified as having either low CVD risk (Framingham Risk Equation score ≤20%) or high CVD risk (Framingham Risk Equation score >20%). Patients missing one or more of the elements required to calculate CVD risk were classified as having missing CVD-risk data.
HCRU assessment
HCRU was assessed as numerical counts of the individual HCRU components as well as their costs. These data were obtained via linkage to the HES database.
HCRU was assessed as the number of GP contacts, hospital admissions and prescriptions, as well as a total of the three components from baseline to the date of death, date of transfer out of the practice or 31 December 2017 (date of final database follow-up), whichever came first. GP contacts were calculated as the total number of GP contacts, including physical, phone/mail and administrative contacts, within the patient follow-up period. Similarly, prescriptions and hospital admissions were calculated as the total number of all prescriptions and all hospital admissions within the patient follow-up period, respectively.
HCRU cost was calculated as the sum of the cost of GP consultations, prescriptions and hospital admissions, respectively, as well as a total sum of all three components. GP contact costs were calculated using average consultation costs from the ‘Personal Social Services Research Unit, University of Kent 2015’. 18 Prescription costs were calculated using average cost per item from ‘Prescription Cost Analysis–England 2016’. 19 Hospital admission costs were calculated from cost data from the ‘National Schedule of Reference Costs 2015–2016’, using the ‘Healthcare Resource Group grouper tool’ for that period. 20
Statistical analysis
Counts of GP contacts, prescriptions or hospitalization events were analysed by a negative binomial model where the log-mean was a function of CVD-risk group, BMI class, sex, age and with log-follow-up-time as offset. Interactions between CVD-risk group and BMI class, as well as between sex and age, were included. Based on the estimated parameters, the log-mean number of counts over a three-year period for a 50-year old man was calculated with 95% confidence intervals and back-transformed to the original count scale. HCRU cost was analysed using a two-stage hurdle model, allowing the cost to be either zero, with some probability, or to be positive and follow a log-normal distribution. 21
The probability and mean were modelled on the logit and log scale, respectively, including the same terms as the count model. The mean cost over a three-year period for a 50-year old man was estimated with 95% confidence intervals and transformed to the original scale.
Patients with missing BMI and/or missing CVD-risk group were excluded from the primary analyses. Sensitivity analyses were conducted by including these patients in separate missing BMI and missing CVD groups.
Results
Patient population
Of the 17,480,766 patients in the CPRD, 7,150,430 (40.9%) had database-determined acceptable data within the relevant time period; 3,694,072 (21.1%) had at least one valid BMI measurement or one consultation in the baseline period; 1,793,395 (10.3%) were aged ≥18 years and included in the database for ≥5 years prior to baseline date; 1,600,709 (9.2%) fulfilled the remaining inclusion/exclusion criteria and were included in the analysis (Supplementary Figure 1).
For patient characteristics at baseline, see Table 1. The 1,600,709 patients included in the final study population had a mean age of 53.0 (±18.1) years and 833,683 (47.9%) were male. Of the final study population, 691,789 patients (43.2%) had available BMI data. Of these, 217,056 (31.4%) were classified as normal weight; 247,874 (35.8%) as overweight; 140,453 (20.3%) as obesity class I; 55,601 (8.0%) as obesity class II; and 30,805 (4.5%) as obesity class III. In total, 457,486 patients (28.6%) had sufficient data available to assess CVD risk. Of these, 108,943 (23.8%) were in the low-risk group, 239,296 (52.3%) in the high-risk group, and 109,247 (23.9%) had established CVD. A total of 343,352 patients had sufficient data to calculate both BMI and CVD risk, approximately 21.4% of the final study population, and were included in the primary analysis. Accordingly, 1,257,357 (78.6%) had missing BMI data, CVD or both, and were included in the sensitivity analyses (Supplementary Figure 1).
Patient characteristics at baseline.
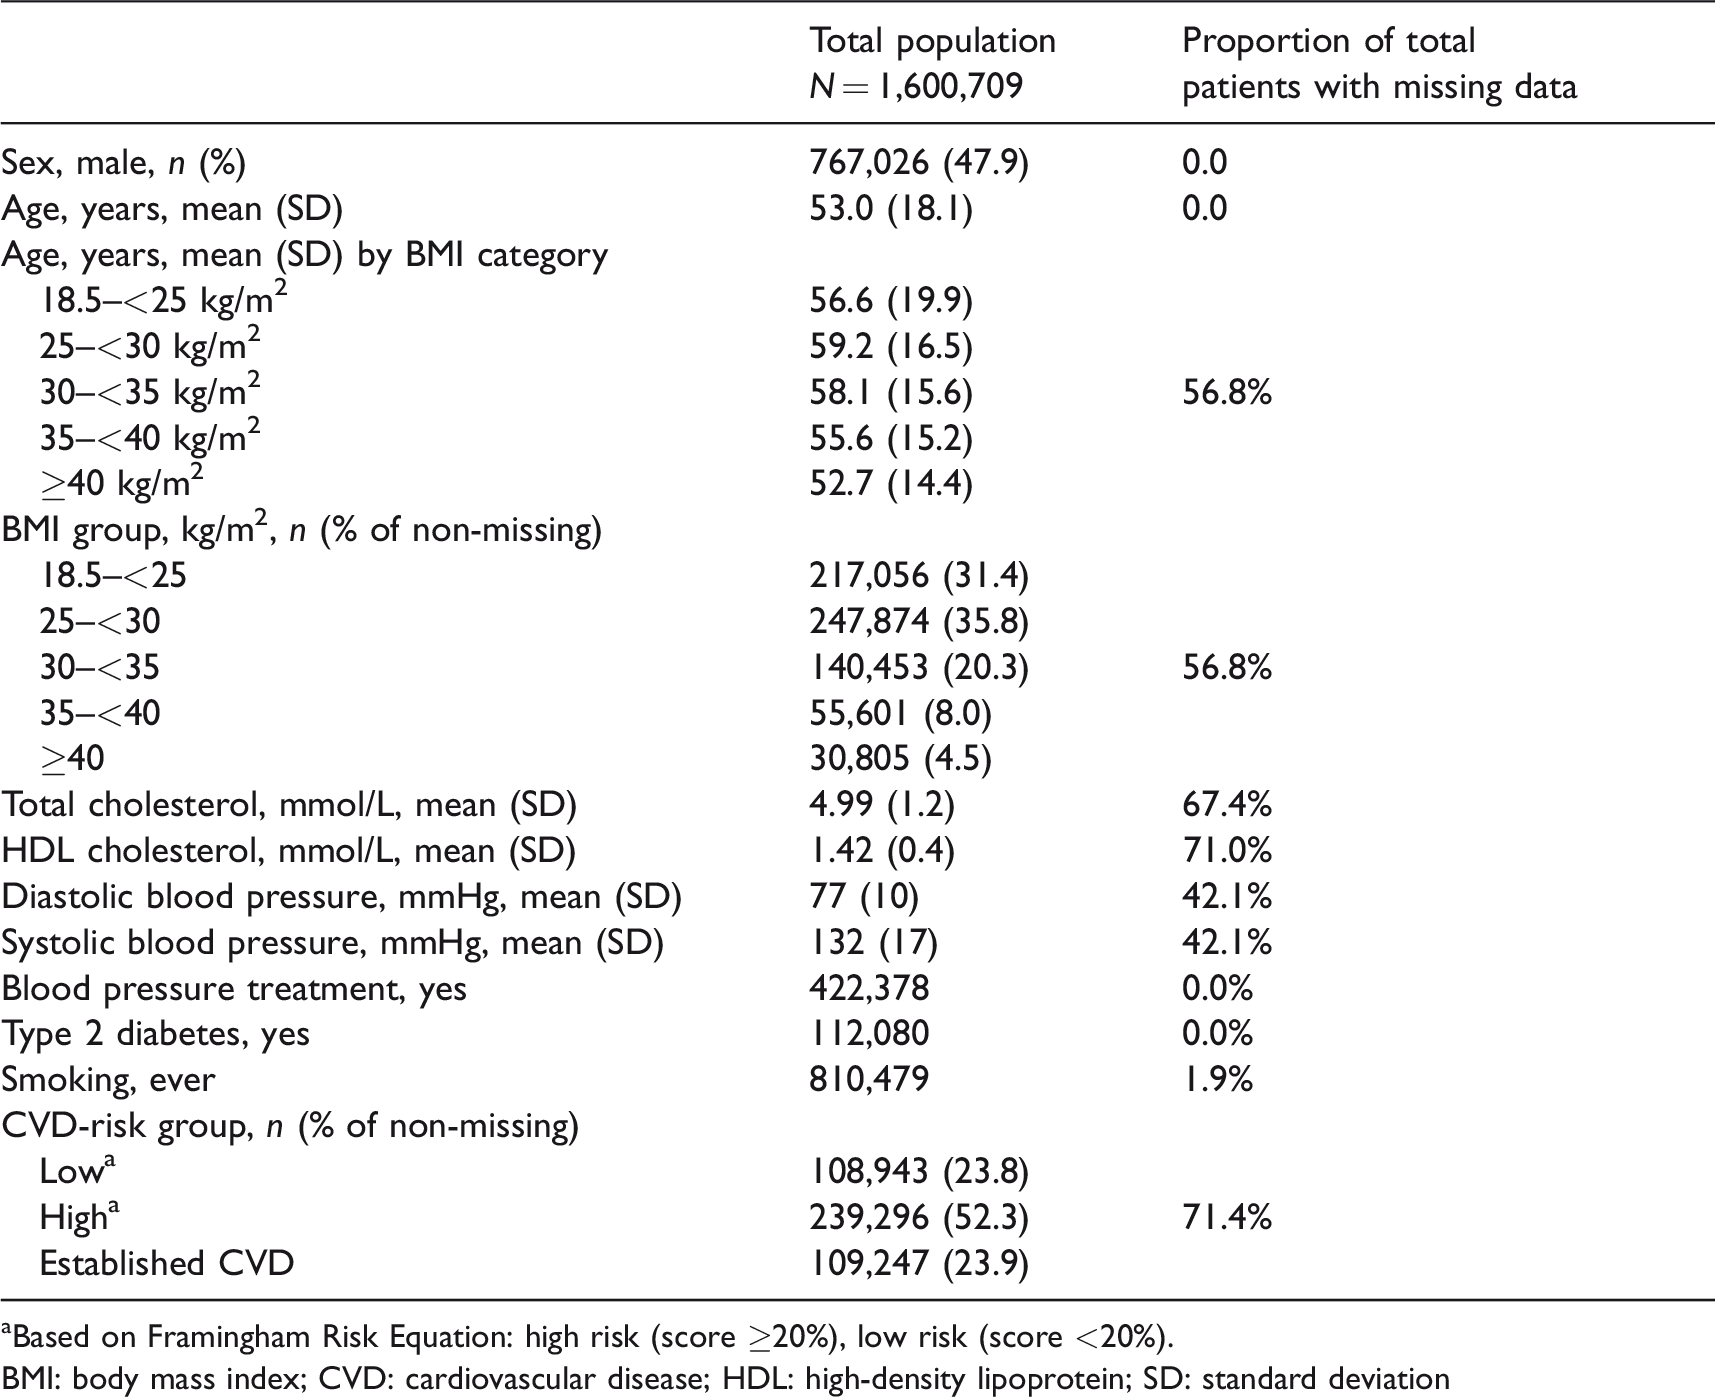
aBased on Framingham Risk Equation: high risk (score ≥20%), low risk (score <20%).
BMI: body mass index; CVD: cardiovascular disease; HDL: high-density lipoprotein; SD: standard deviation
HCRU
The estimated mean count and estimated mean cost of the individual components of HCRU, as well as the estimated mean cost of total HCRU, split by BMI class and CVD group over three years for a 50-year-old man, are presented in Figure 2 and Supplementary Table 1.
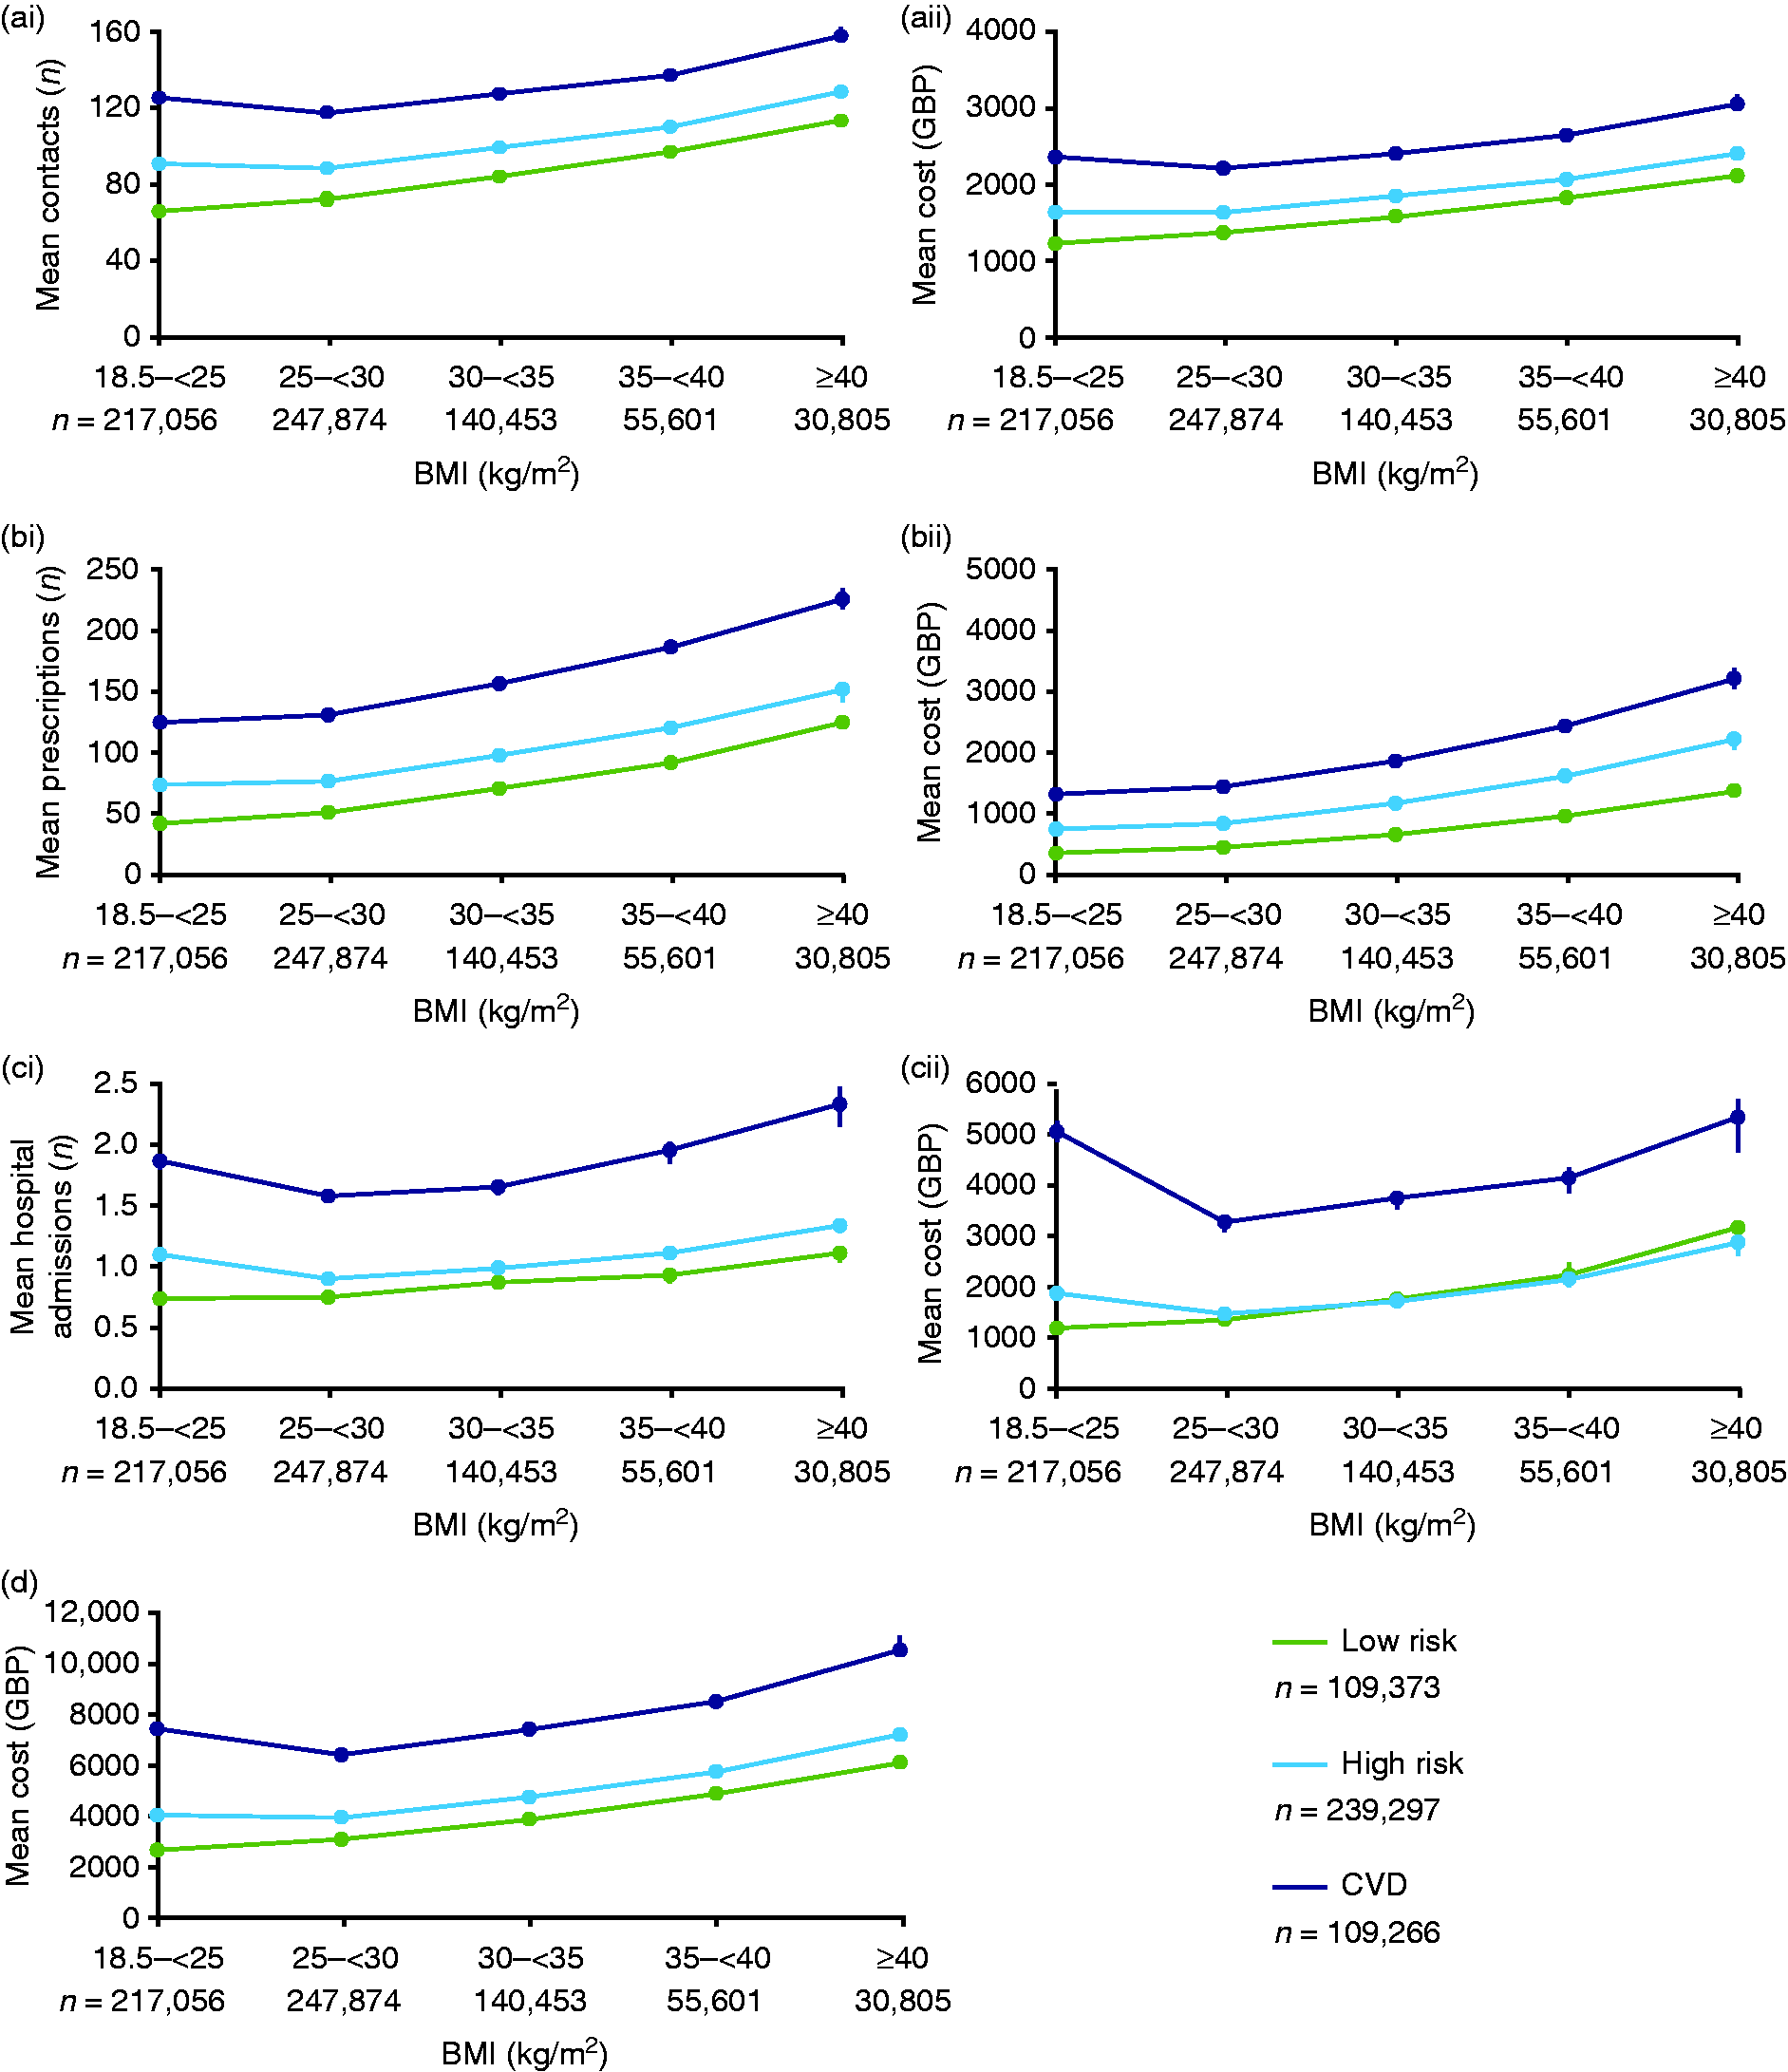
Estimated mean healthcare resource utilization (HCRU) and estimated mean cost over three years (by BMI and CVD group) for a 50-year-old man. (a) GP contacts: (ai) number of GP contacts, (aii) costs related to GP contacts (GBP 2016). (b) Prescriptions: (bi) number of prescriptions, (bii) costs related to prescriptions (GBP 2016). (c) Hospital admissions: (ci) number of hospital admissions, (cii) costs related to hospital admissions (GBP 2016). (d) Mean total HCRU costs. Graphs are estimated means with 95% confidence interval.
GP contacts
The estimated mean number of GP contacts is shown in Figure 2(ai). The number of GP contacts increased with increasing BMI, except for patients with overweight and either established CVD or at high CVD risk, who accumulated slightly fewer GP contacts over the three-year period than their normal-weight counterparts. At all BMI classes, greater numbers of GP contacts were reported for patients with established CVD, followed by patients at high CVD risk and finally patients with low CVD risk.
A similar pattern was reflected in the estimated mean cost of GP contacts per patient. Over a three-year period, the attributed mean cost of GP contacts for a patient with obesity class III and established CVD was ∼£3000, versus ∼£1200 for a patient with normal weight at low CVD risk (Figure 2(aii)).
Prescriptions
For the estimated mean number of prescriptions, see Figure 2(bi). The number of prescriptions increased with increasing BMI regardless of CVD-risk status. A greater number of prescriptions were reported for patients with established CVD, followed by patients at high CVD risk and patients with low CVD risk. The mean number of prescriptions for a patient with obesity class III and established CVD (n = 224) over a three-year period was five times that of a patient with normal weight and at low CVD risk (n = 42).
The estimated mean cost of prescriptions followed a similar pattern to the mean number of prescriptions, with the value increasing at each BMI class and with increased CVD risk. Over a three-year period, the attributed mean cost of prescriptions for a patient with obesity class III and established CVD (∼£3200) was 10 times greater than that of a patient with normal weight at low CVD risk (∼£320) (Figure 2(bii)).
Hospital admissions
The estimated mean number of hospital admissions over a three-year period, for all levels of CVD risk, increased with increasing BMI for individuals with BMI >25 kg/m2 and was greatest at the highest BMI class (Figure 2(ci)). However, among patients with established CVD or high CVD risk, those with normal weight had a greater number of hospital admissions than patients with overweight or obesity class I and II.
The estimated mean costs of hospital admissions closely mirrored the count of hospital admissions (Figure 2(cii)). There was little difference in hospital admission-associated costs between patients with normal weight and obesity class III with established CVD (both ∼£5000). There was also very little difference in costs between patients with a low and a high CVD risk, at all BMI classes; however, costs increased substantially for patients with established CVD.
Total HCRU cost
Total HCRU cost increased with increasing BMI, with the greatest cost in patients with obesity class III, regardless of CVD risk (Figure 2(d)). Patients with established CVD accounted for the greatest total HCRU cost, followed by patients with high CVD risk, then low CVD risk, a pattern consistent across each BMI class. The attributed mean total HCRU cost over three years for a patient with obesity class III and established CVD was ∼£10,500.
Sensitivity analyses
Of the final study population, 908,920 (56.8%) patients had missing BMI data, while 1,143,223 (71.4%) had missing CVD data. As patients could have both missing BMI and CVD data, 1,257,357 patients were excluded from the primary analysis. Given that this equated to a high proportion of the total study population (78.6%), HCRU analyses were re-run to include these patients with the aim of observing their effects on the findings. Overall, the HCRU pattern remained consistent with the primary finding, that is, increasing HCRU with increasing BMI and in those at the greatest risk of, or with, CVD, for all three components of HCRU. However, as a result of increased variance within the cohort characteristics regarding age and sex, the absolute values of each HCRU component differed from the primary analysis. Generally, patients with missing BMI had a lower HCRU than patients with registered BMI values.
Discussion
Obesity is associated with major risk factors for development of CVD 12 and CVD itself7,9 as well as increased HCRU.4,8 This retrospective, observational cohort study using data from the CPRD Gold database is the first in the UK to estimate HCRU costs in differing classes of BMI, by cardiovascular risk, in an adult population representative of the UK.
In a previous study by le Roux et al., 4 patients in the highest BMI class with type 2 diabetes (T2D) incurred greater HCRU costs than patients in the highest BMI class without T2D. The increased HCRU costs in patients with T2D were driven by greater prescription medicine use. Similarly here, patients with established CVD at all BMI classes incurred greater prescription-associated costs than patients with either high or low CVD risk. Additionally, the mean number of prescriptions for a patient with obesity class III and established CVD was five times that of a patient with normal weight and low CVD risk. In the same population, estimated mean costs were 10 times greater. This may indicate that, in the present study, the greater prescription-associated costs are driven not only by use of greater numbers of medications but also by higher cost of each medication. Surprisingly, the mean number of hospital admissions and hospital admission-associated costs were similar for patients of normal weight and those with obesity class III, for established CVD and high CVD-risk groups. It is noteworthy, however, that the design of the current study did not allow differentiation between intentional and unintentional weight loss to be examined in the pre-study period. It is therefore possible that there may have been a patient subgroup within the normal-weight category that had overweight/obesity but at the time of data collection had other diseases leading to unintentional weight loss.
The present study benefits from a large sample size and wide coverage of the CPRD Gold database, which is representative of the UK population and adds confidence to these findings. 15 A total of 1,160,927 individuals were excluded from the primary analysis as they did not have five years of data in the CPRD prior to the index date, or at least one valid BMI measurement or a consultation in the baseline period. When this population was compared with that of the primary analysis, the proportion of males was slightly higher (excluded, 50.3% vs. included, 47.9%), and the excluded population was also slightly younger (mean age; excluded, 42.6 (±18.2) years vs. 53.0 years (±18.1)). It is possible that the discrepancy in age and gender between the two populations is the result of younger people, and particularly males, 22 being less likely to visit or more prone to switching between clinics, thus reducing the likelihood that they had five years’ worth of data prior to the index date. The study sourced cost data directly from the NHS, as opposed to insurance claims databases, which often underestimate medical costs. 23 However, note that a large proportion of patients had missing BMI and especially CVD-risk data. This relative lack of CVD-risk data may have resulted in an over-representation of patients with established CVD in the study population, compared with patients at low or high CVD risk, and may have impacted on the HCRU outcomes for this subgroup. Additionally, the analyses did not incorporate data relating to patients’ socioeconomic status, which may influence the risk of CVD and obesity and impact on HCRU.24–26
The patterns of HCRU demonstrated here are expected to share global similarity; however, healthcare systems and costs of HCRU events vary between countries, so costs estimated here must be extrapolated to other countries with caution. Furthermore, the Framingham Risk Equation, used to determine CVD-risk profiles, is based on the Framingham Heart Study, a long-term cohort study on the CVD incidence in a US population. 27 As such, the equation has not been sufficiently validated in a European cohort and further studies are required to confirm accurate prediction of CVD outcomes in this population. 28
A median follow-up period of ∼3 years allowed for a comprehensive estimate of the economic burden of obesity and cardiovascular risk, although owing to the retrospective, observational design of the study, a causal link cannot be credibly established.
CVD-risk assessment, using tools such as the Framingham Risk Equation, 17 the Systematic Coronary Risk Evaluation risk charts 29 and the QRISK algorithm, 30 is an important strategy for identifying patients at the highest risk of acute CVD events and defining a more intensive approach to preventive treatment.31,32 The findings here demonstrate that CVD-risk status, alone and combined with BMI, is an important contributor to HCRU in people with obesity. Accordingly, such findings may assist key clinical decision-makers in risk stratification and provision of care to patients with obesity at the highest risk of, or with established, CVD, subsequently limiting the healthcare costs of such interventions.
Concluding, patients with established CVD had the greatest utilization of all components of healthcare resources, followed by high CVD risk, then low CVD risk. For all three components of HCRU, costs incurred were generally greatest for patients with obesity class III and established CVD. Our findings highlight the potential of weight management interventions to reduce the need for medications in patients with obesity and established CVD. Timely obesity management and treatment of CVD-risk factors may also prevent increasing HCRU.
Supplemental Material
sj-pdf-1-cpr-10.1177_2047487320925639 - Supplemental material for Obesity, cardiovascular risk and healthcare resource utilization in the UK
Supplemental material, sj-pdf-1-cpr-10.1177_2047487320925639 for Obesity, cardiovascular risk and healthcare resource utilization in the UK by Carel W le Roux, Niels V Hartvig, Christiane Lundegaard Haase, Rikke Baastrup Nordsborg, Anne Helene Olsen and Altynai Satylganova in European Journal of Preventive Cardiology
Footnotes
Authors’ note
The data and details of analytic methods for this study are available from the corresponding author upon request.
Acknowledgements
We thank Jamie Cozens, MSc, of Watermeadow Medical, an Ashfield Company, for editorial and medical writing services, funded by Novo Nordisk.
Author contribution
All authors were involved in study conception and design. NVH and RBN analysed the data; all authors were in involved in data interpretation, preparation and decision to submit the manuscript for publication, and all verify the accuracy and completeness of the data and analyses. CWlR is the guarantor, had access to all the data and accepts full responsibility for the work and/or the conduct of the study.
Declaration of conflicting interests
The author(s) declared the following potential conflicts of interest with respect to the research, authorship, and/or publication of this article: CWlR: advisory board member for Fractyl, Herbalife, GI Dynamics and Novo Nordisk; speaker’s fees from Boehringer Ingelheim, Janssen, Johnson & Johnson, Medtronic and Sanofi. NVH, CLH, RBN, AHO and AS: employees of Novo Nordisk. NVH, AHO and AS are also shareholders in Novo Nordisk.
Funding
The author(s) received no financial support for the research, authorship, and/or publication of this article.
References
Supplementary Material
Please find the following supplemental material available below.
For Open Access articles published under a Creative Commons License, all supplemental material carries the same license as the article it is associated with.
For non-Open Access articles published, all supplemental material carries a non-exclusive license, and permission requests for re-use of supplemental material or any part of supplemental material shall be sent directly to the copyright owner as specified in the copyright notice associated with the article.