
Abstract
Objectives
Integrate statistical shape modeling (SSM) and 4D flow analysis to evaluate the impact of pulmonary artery (PA) geometry in patients with transposition of the great arteries (TGA) after the arterial switch operation (ASO).
Design
Retrospective single-center cohort study.
Setting
Congenital cardiac center performing clinically indicated cardiac magnetic resonance imaging, including 4D flow.
Participants
Seventy TGA patients post-ASO and 49 age/size-matched controls with structurally normal hearts. Exclusion criteria included PA stents, significant right ventricular (RV) outflow obstruction, reintervention, or inadequate image quality.
Main Outcome Measures
Primary measures were PA shape modes (derived via SSM) and 4D flow-based kinetic energy (KE), viscous energy loss (VEL), and vorticity. Secondary measures included RV pressure and RV-to-systemic pressure ratio.
Results
Compared with controls, TGA patients demonstrated higher peak systolic VEL rate (0.106 ± 0.109 mW/mL vs. 0.0125 ± 0.0599 mW/mL), systolic VEL (20.2 ± 18.2 mJ/mL vs. 1.91 ± 8.63 mJ/mL), peak KE (0.300 ± 0.126 mJ/mL vs. 0.0316 ± 0.0897 mJ/mL), and vorticity (194 ± 46.6 1/s vs. 105 ± 30.5 1/s; all p < 0.0001). Statistical shape modeling identified major geometric deviations, including shorter, flatter main PA segments, and increased branch curvature. Shape modes p4, p5, and p8 were significantly associated with increased curvature, reduced vessel caliber, elevated vorticity, and higher RV pressures. Right ventricular-to-systemic ratio also correlated with these shape modes, in addition to PA size, RPA curvature, and peak vorticity.
Conclusions
Abnormal PA geometry after ASO is strongly linked to adverse flow energetics and increased RV afterload. These findings suggest that curvature-driven flow inefficiency, beyond stenosis alone, contributes to long-term hemodynamic burden in TGA, highlighting potential targets for surveillance and intervention.
Keywords
Introduction
Altered hemodynamics in congenital heart disease arises from structural abnormalities that occur before and after cardiovascular surgery. Advances in neonatal cardiovascular surgery have greatly improved survival, but long-term sequelae of postoperative geometry are now apparent, such as in transposition of the great arteries (TGA). In TGA with
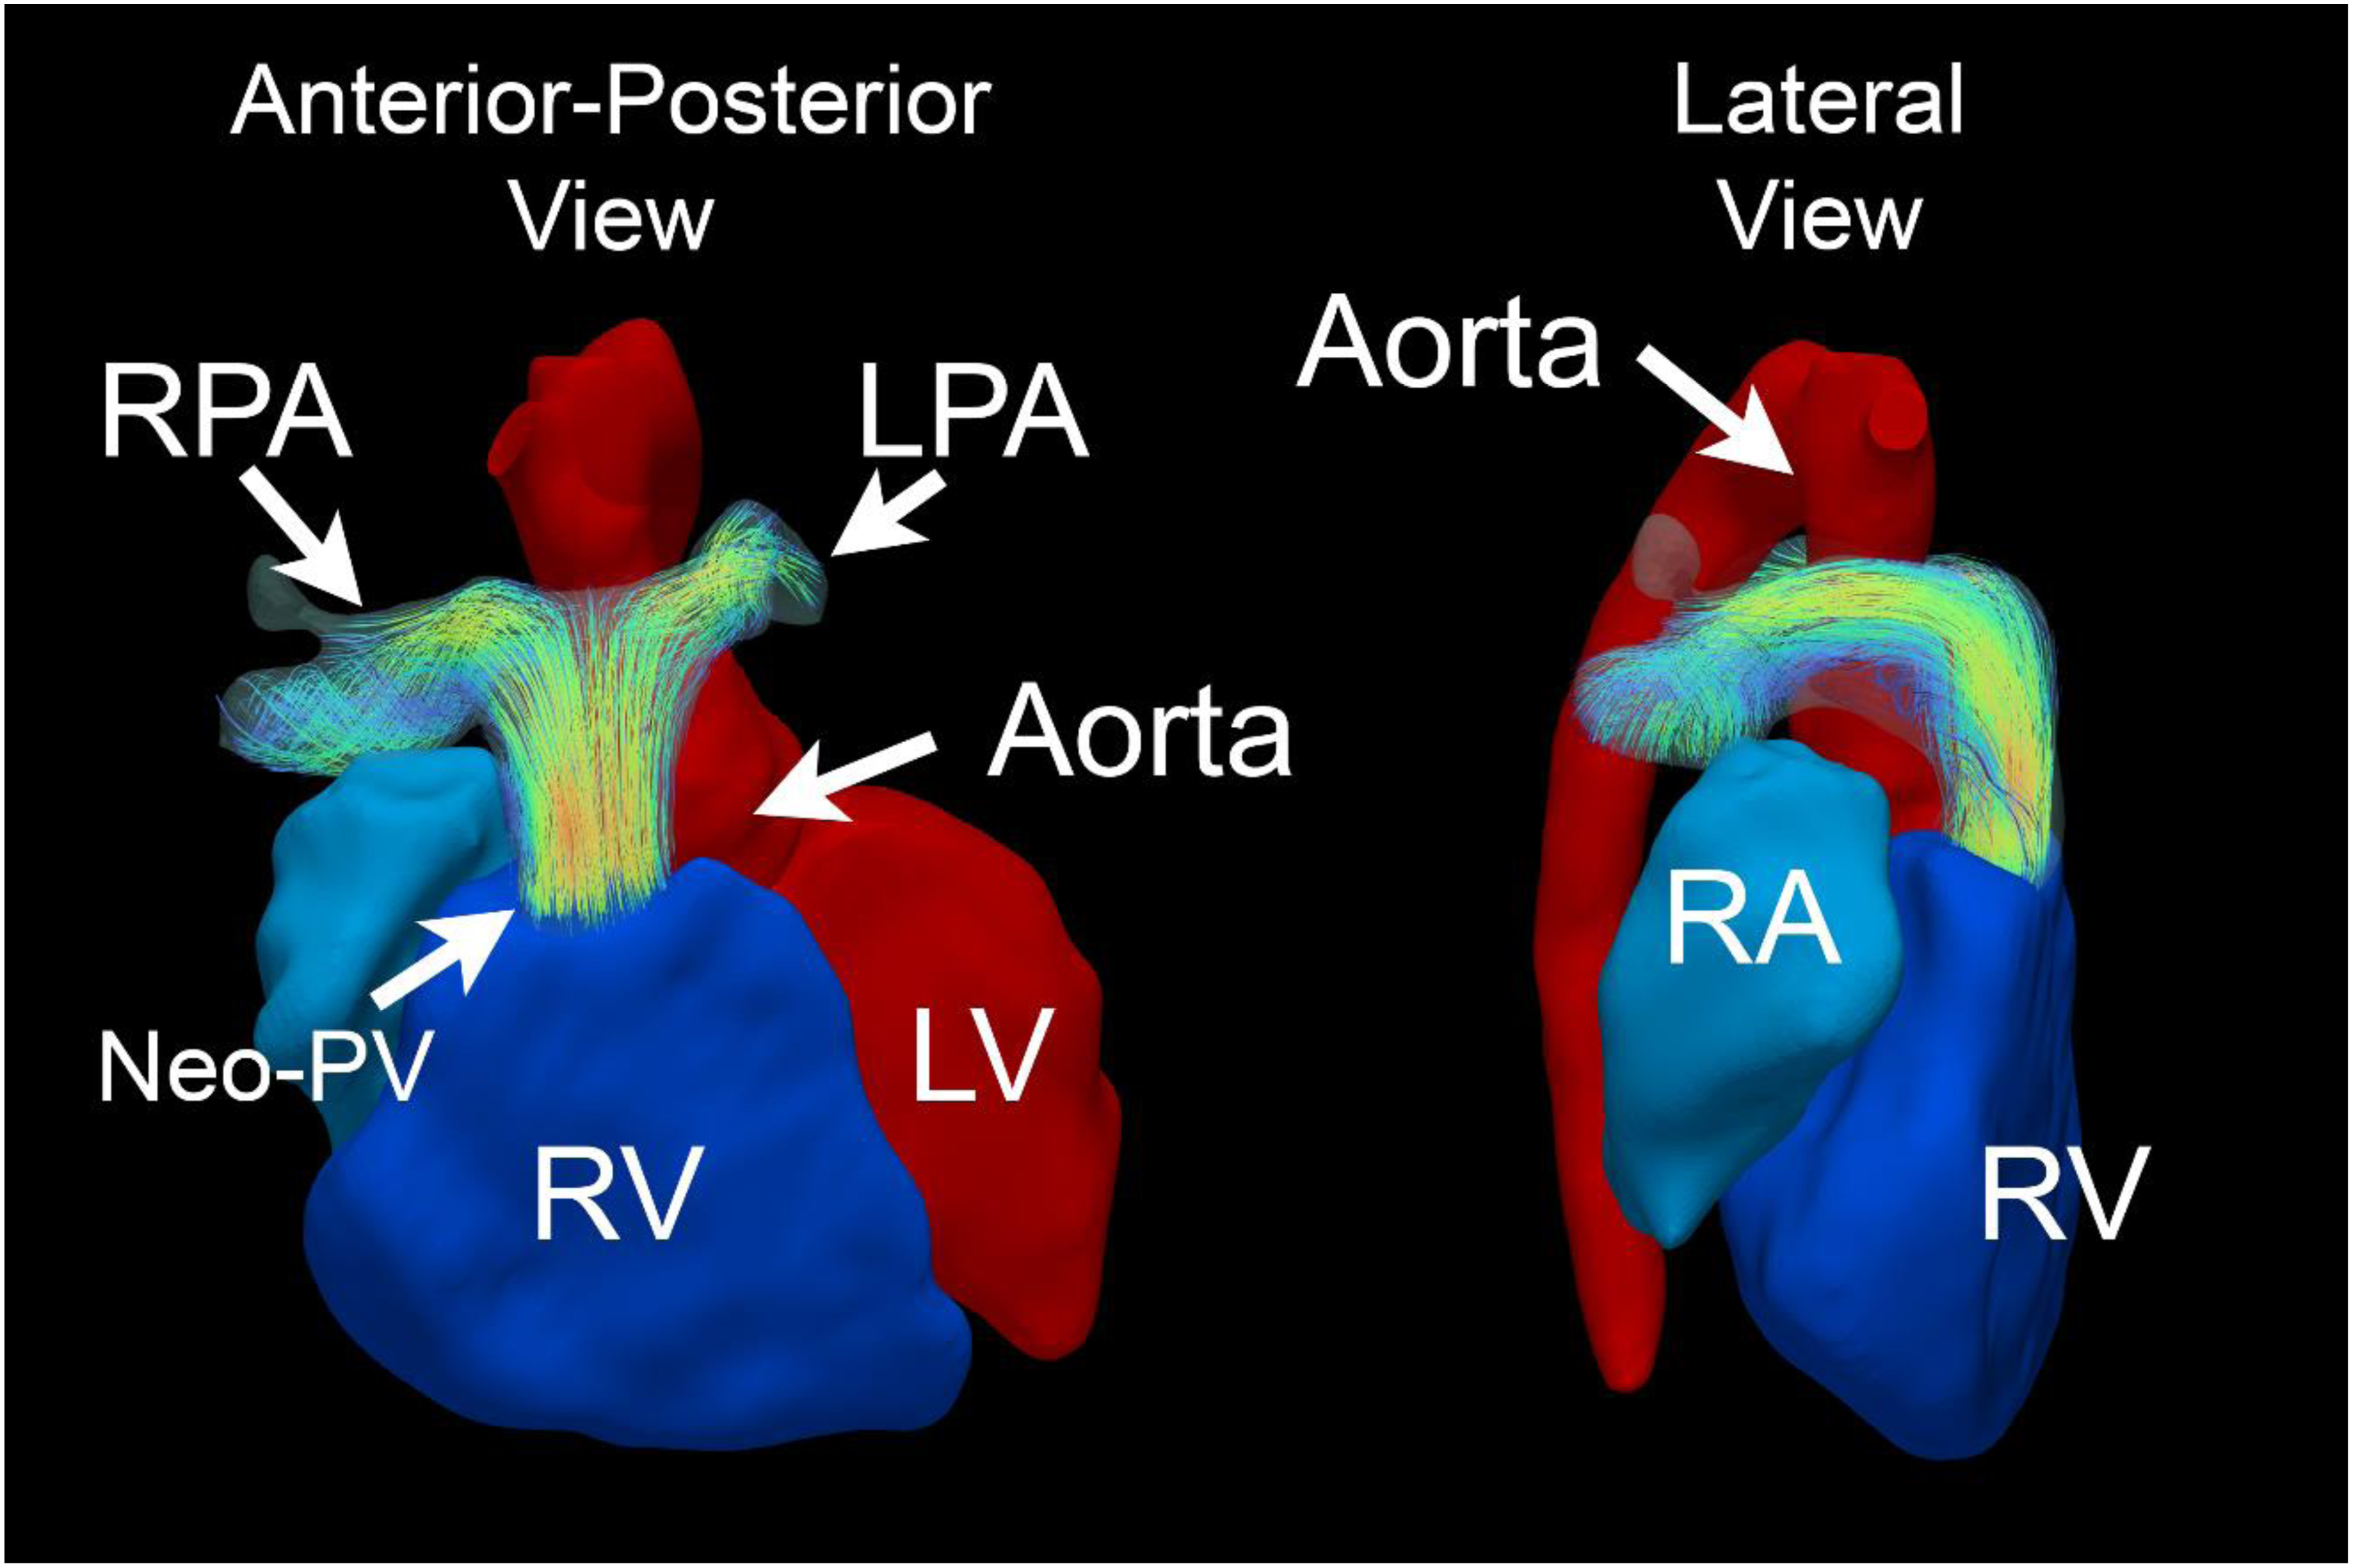
Visualization of the post-arterial switch operation (ASO) anatomy of the pas by 4D flow (left – anterior–posterior view; right – lateral right–left view). Both pulmonary arteries (PAs) pass anterior to the aorta, which is characteristic of the LeCompte maneuver. Streamlines depict alterations in flow dynamics through PAs.
Understanding the mechanisms and clinical impact of these changes is crucial to evaluating the long-term effects of the ASO. Recent advances in 4D flow magnetic resonance imaging (MRI) have highlighted altered vortical flow patterns after the ASO (Figure 1(b)) as well as increases in kinetic energy (KE) and viscous energy loss (VEL).3–5 Thus, 4D flow MRI presents an opportunity to clarify the flow alterations. Statistical shape modeling (SSM), a form of principal component analysis, also offers a way to analyze the interplay between 3D geometry, flow dynamics, and clinical outcomes.6–8 Statistical shape modeling provides a method to describe the abnormal bending of the PAs beyond simple measurement-based approaches. 2 This study integrates 4D flow MRI and 3D SSM to examine the link between pulmonary artery (PA) shape and flow energetics after the ASO. By correlating vessel shape with flow disturbances and clinical metrics, we aim to identify significant anatomical variations for closer monitoring and at risk for reintervention.
Methods
Study design and inclusion/exclusion criteria
This Institutional Review Board-approved, single-center retrospective cohort study (waiver of consent) included patients post-ASO who underwent cardiac magnetic resonance (CMR) imaging from 2019 to 2024. Patients were classified by cardiac anatomy:
A normal control cohort matched for age and body surface area was included for comparison. The normal controls were patients who underwent screening CMR imaging for separate clinical indication (exclude cardiomyopathy, atrial shunts, or partial anomalous pulmonary venous return) and found to have normal RV size, function, and pulmonary-to-systemic flow ratio (Qp:Qs) < 1.2:1.
4D flow processing
All CMR studies were clinically indicated and performed on a 1.5 T scanner (Aera, Siemens Healthineers, Erlangen, Germany) using lab-standard protocols. Imaging included long-/short-axis cine, contrast-enhanced magnetic resonance angiography, noncontrast 3D SSFP gated for end-diastole, and 4D flow. The 4D flow respiratory-navigated sequence was acquired in sagittal 3D Cartesian sampling with GRAPPA acceleration, adjustable voxel size (1.8–2.8 mm), and encoding velocity (200–300 cm/s). The scan time was approximately 8 min. Clinical parameters included RV/LV end-diastolic/end-systolic volume index (EDVi/ESVi) and ejection fraction (RV/LV EF%). The velocity and the effective diameter of the MPA at peak systolic flow were also used to derive the Reynolds number for both cohorts. Reynolds number was calculated to estimate the ratio of inertial to viscous forces within the PA flow field using the standard relation
Geometrical analysis and SSM
Three-dimensional end-diastolic models of the PAs were segmented from 3D SSFP imaging using 3D Slicer following lab standards. Segmentation extended from the neo-pulmonary valve to the distal PAs right before second-order branching. The Vascular Modelling Tool Kit (VMTK) was applied to each PA model to extract centerlines of RPA/LPA and automatically measure average curvature [1/mm] and radius [mm] across each branch PA. Centerline extraction using VMTK allowed objective identification of second-order branching. The distal extent of each branch (RPA and LPA) was defined as the last centerline point before visible secondary branching on 3D SSFP imaging. Geometric dimensions were indexed to body surface area to reduce size-dependent effects (mm/m2).
The 3D models were imported into ShapeWorks, an open-source SSM software that uses particle-based algorithms to calculate the mean shape template and quantify shape variations (p0, p1, etc.) via principal component analysis. 9 ShapeWorks has been applied in cardiac applications such as left atrial appendage morphology or hypoplastic left heart morphology.6–8 For model alignment and particle seeding, three landmarks were placed on the anterior surface of the proximal MPA, the distal right PA, and the distal left PA of each model. Optimization involved a relative weighting of 0.05 and 2, regularization values from 1000 to 10, and 4000 iterations per split. Geodesic distance was used as a correspondence metric, with remeshing at 100% and normals enforced with strength of 10. Landmarks in the distal PA and neo-pulmonary valve guided optimization, with geodesic distance and a landmark distance weight of 1 included. Procrustes analysis with scaling and rotation/translation was applied every 10 iterations. Multiscale mode was disabled, and the narrow band parameter was set to 4 for computational efficiency. Specific parameters related to Shapeworks scheme, including particle count, grooming steps, optimization, and initialization strategy, are provided in the Supplemental Appendix to facilitate reproducibility.
4D flow analysis (KE, energy loss, vorticity)
Each 4D flow dataset was imported into ITFlow 2.1 (Cardioflow Design, Tokyo, Japan) with background phase correction applied. The 3D model served as a mask to isolate velocity flow fields, and semiautomatic deformable registration ensured anatomical alignment throughout the cardiac cycle. Noise artifacts were screened and removed. As a preprocessing step, the 3D models were first aligned to the 4D flow dataset at the appropriate diastolic phase, ensuring that the end-diastolic anatomy overlaps the flow fields and the vessel wall. This model is then imported into ITFlow at the same cardiac phase. ITFlow has a nonrigid deformation algorithm that can track and transform the vessel mask to expand with the systolic cycle. The results are screened qualitatively across the cardiac cycle, and adjustments are made as needed. Streamlines were qualitatively visualized in Paraview 5.13 using the StreamTracer function. Velocity fields within the 3D model were used to quantify PA flow parameters at systole/peak systole, including KE (mJ/mL), viscous energy loss (VEL rate, mW/mL and VEL mJ/mL), and vorticity (1/s).4,10 Energy metrics were normalized to PA volume to reduce size-dependent effects.
Kinetic energy was calculated voxel-wise by integrating the squared magnitude of the velocity field over the segmented region. For each voxel, KE density was defined as:
Viscous energy loss was calculated from spatial velocity gradients (second-order derivatives) within the flow field. VEL rate
Vorticity represents the magnitude and direction of rotational flow and was calculated as the curl of the velocity field:
Reproducibility and sensitivity analysis
To evaluate segmentation reproducibility, PA segmentations were repeated in a randomly selected subset of 10 datasets by a different observer. Agreement between the original and repeated segmentations was quantified using Dice similarity coefficient, 95% Hausdorff distance, and average surface distance. To assess the sensitivity of the SSM to particle initialization, the SSM optimization was repeated after altering particle seed placement. Because principal component axes may rotate within a shared deformation subspace, visual comparison of deformation patterns and downstream correlation analyses were also performed to confirm stability of the geometric phenotypes identified.
Statistical analysis
All statistical analyses were performed using GraphPad. Two-tailed t-tests were used to compare demographics and flow energetics between TGA and normal cohorts. Pearson correlation coefficient analysis was conducted to evaluate relationships between shape modes and flow parameters, as well as their associations with RV pressure/RV:Systemic Ratio. To identify independent predictors of RV afterload, multivariable linear regression analyses were performed incorporating PA shape modes, geometric parameters, flow metrics, and age. Because of the limited sample size relative to the number of candidate variables, multivariable models were constructed using a targeted approach that prioritized variables demonstrating significant univariable associations and parameters with physiologic relevance identified in the initial analyses. Several related models were evaluated to examine the relative contributions of PA shape, vessel size, and flow energetics. Regression assumptions were assessed by evaluation of residual distributions, and multicollinearity was evaluated using variance inflation factors.
Results
Demographics and clinical measurements
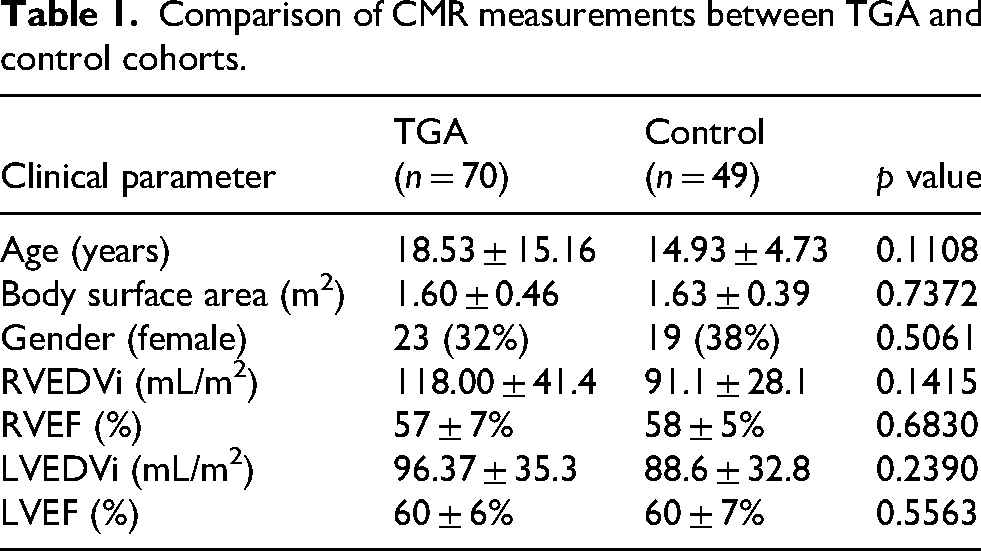
The study included 70 patients in the TGA cohort and 49 in the control cohort (Table 1). The mean age, gender distribution, body surface area, and CMR parameters were comparable between groups with no statistically significant differences; 49 (70%) of the TGA patients had sufficient data to quantify RV pressures, with 21 (30%) confirmed by cardiac catheterization. The mean estimated RV pressure was 41 ± 14 mmHg, and the mean RV:Systemic ratio was 0.466 ± 0.204. Finally, the TGA cohort had higher Reynolds numbers both at peak systole (5922 ± 1553 vs. 4404 ± 895, p < 0.0001) and when averaged across the cardiac cycle (1609 ± 341 vs. 1299 ± 360, p < 0.0001).
Comparison of CMR measurements between TGA and control cohorts.
4D flow parameters (KE, VEL and vorticity)
Patients in the TGA cohort exhibited significantly altered systolic flow parameters compared to the normal cohort. Notably, the TGA group demonstrated a marked increase in peak systolic VEL rate (0.106 ± 0.109 mW/mL vs. 0.0125 ± 0.0599 mW/mL), VEL (20.2 ± 18.2 mJ/mL vs. 1.91 ± 8.63 mJ/mL), peak systolic KE (0.300 ± 0.126 mJ/mL vs. 0.0316 ± 0.0897 mJ/mL), and average systolic KE (0.167 ± 0.0750 mJ/mL vs. 0.0170 ± 0.0492 mJ/mL). Furthermore, peak systolic vorticity was nearly doubled in the TGA cohort (194 ± 46.6 1/s vs. 105 ± 30.5 1/s). All comparisons were statistically significant (p < 0.0001).
Shape template and variations of pa anatomy after ASO
The TGA template exhibits significant geometric differences compared to the normal template (Figure 2, left column). The MPA appears shortened and flatter along the anteroposterior plane, with a wider bifurcation angle and more divergent branch PAs. The distal PAs, particularly the LPA, were tapered and elongated. The first nine (p0–p8) shape modes collectively explained about 83% of the variance in PA anatomy. p4 is highlighted in Figure 2, and p2, p5, and p8 are highlighted Figure 3. These shape modes are described as follows:
p2: This mode highlights the development of LPA hypoplasia. With lower p2, the PAs are symmetric, whereas with higher p2 there is progressively narrower LPA. p4: This (Figure 2, middle column) demonstrates the most significant changes, which exhibits a sharper curvature and bilateral narrowing of the branch PAs in the negative direction. This mode also reflects a degree of narrowing in the MPA segment. p5: The mode primarily captures a transition in the size and angulation of the mid-MPA. With higher p5, the MPA has a progressively smaller caliber with more horizontal trajectory/curvature. p8: The mode corresponds to flattening of the MPA along the AP plane and bending of the PAs. With higher p8, the MPA flattens and broadens, which in turn influences a sharper curvature in the branch PAs. Other modes include p0 (rightward shift of MPA and contralateral LPA elongation) and p1/p7 (symmetry and proportionality of the proximal bifurcation)

Pulmonary artery template comparison and geometric variation captured by shape mode p4. Top left: Surface renderings comparing the templates derived from normal controls (cyan) and transposition of the great arteries (TGA) patients (red). Arrows indicate the main pulmonary artery (MPA), right pulmonary artery (RPA), and left pulmonary artery (LPA). Top right: Surface representations illustrating deformation along shape mode p4, with low p4 shown in green and high p4 shown in magenta. Bottom rows: Centerline representations of pulmonary artery (PA) geometry. Left compares the centerlines derived from the normal and TGA templates. Right illustrates geometric deformation across the p4 spectrum. Centerlines are color-mapped by local vessel radius (mm).
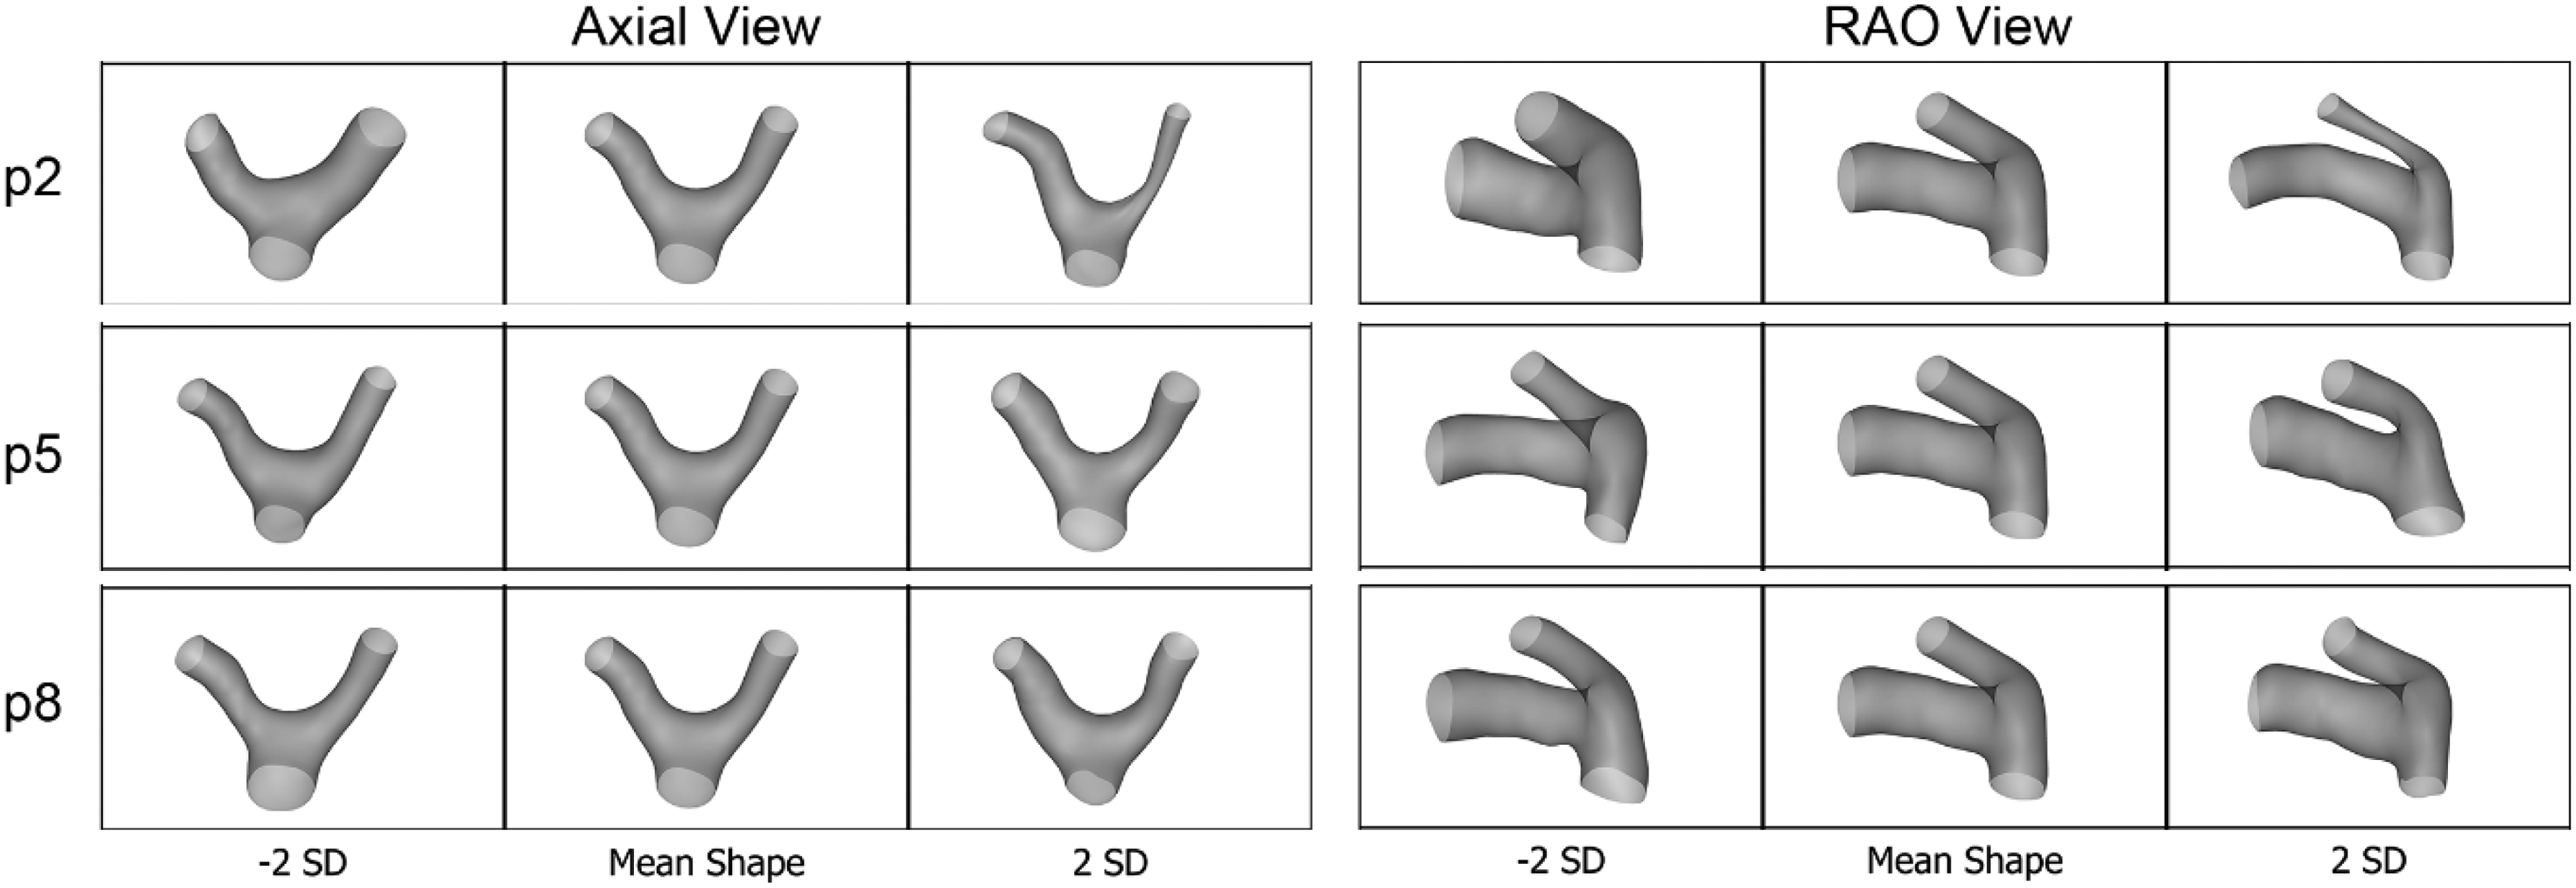
Shape mode variations of p2, p5, and p8. p2 – progressive LPA hypoplasia. p5 – alteration to mid-main pulmonary artery (MPA) caliber and trajectory. p8 – flattening of proximal MPA and bending of the pulmonary arteries (PAs).
Associations between shape and flow
A correlation matrix (Figure 4) highlights associations between shape modes and PA geometry, flow dynamics, and RV parameters in the TGA cohort. Shape mode p4 demonstrated significant correlations with increased RPA curvature and elevated peak systolic vorticity. Mode p5 was associated with increased LPA curvature and RV afterload metrics. Mode p8 demonstrated associations with indexed PA caliber, increased curvature of both branch pulmonary arteries, and elevated peak systolic vorticity. Age was inversely correlated with both p4 and p8 (Figure 5).
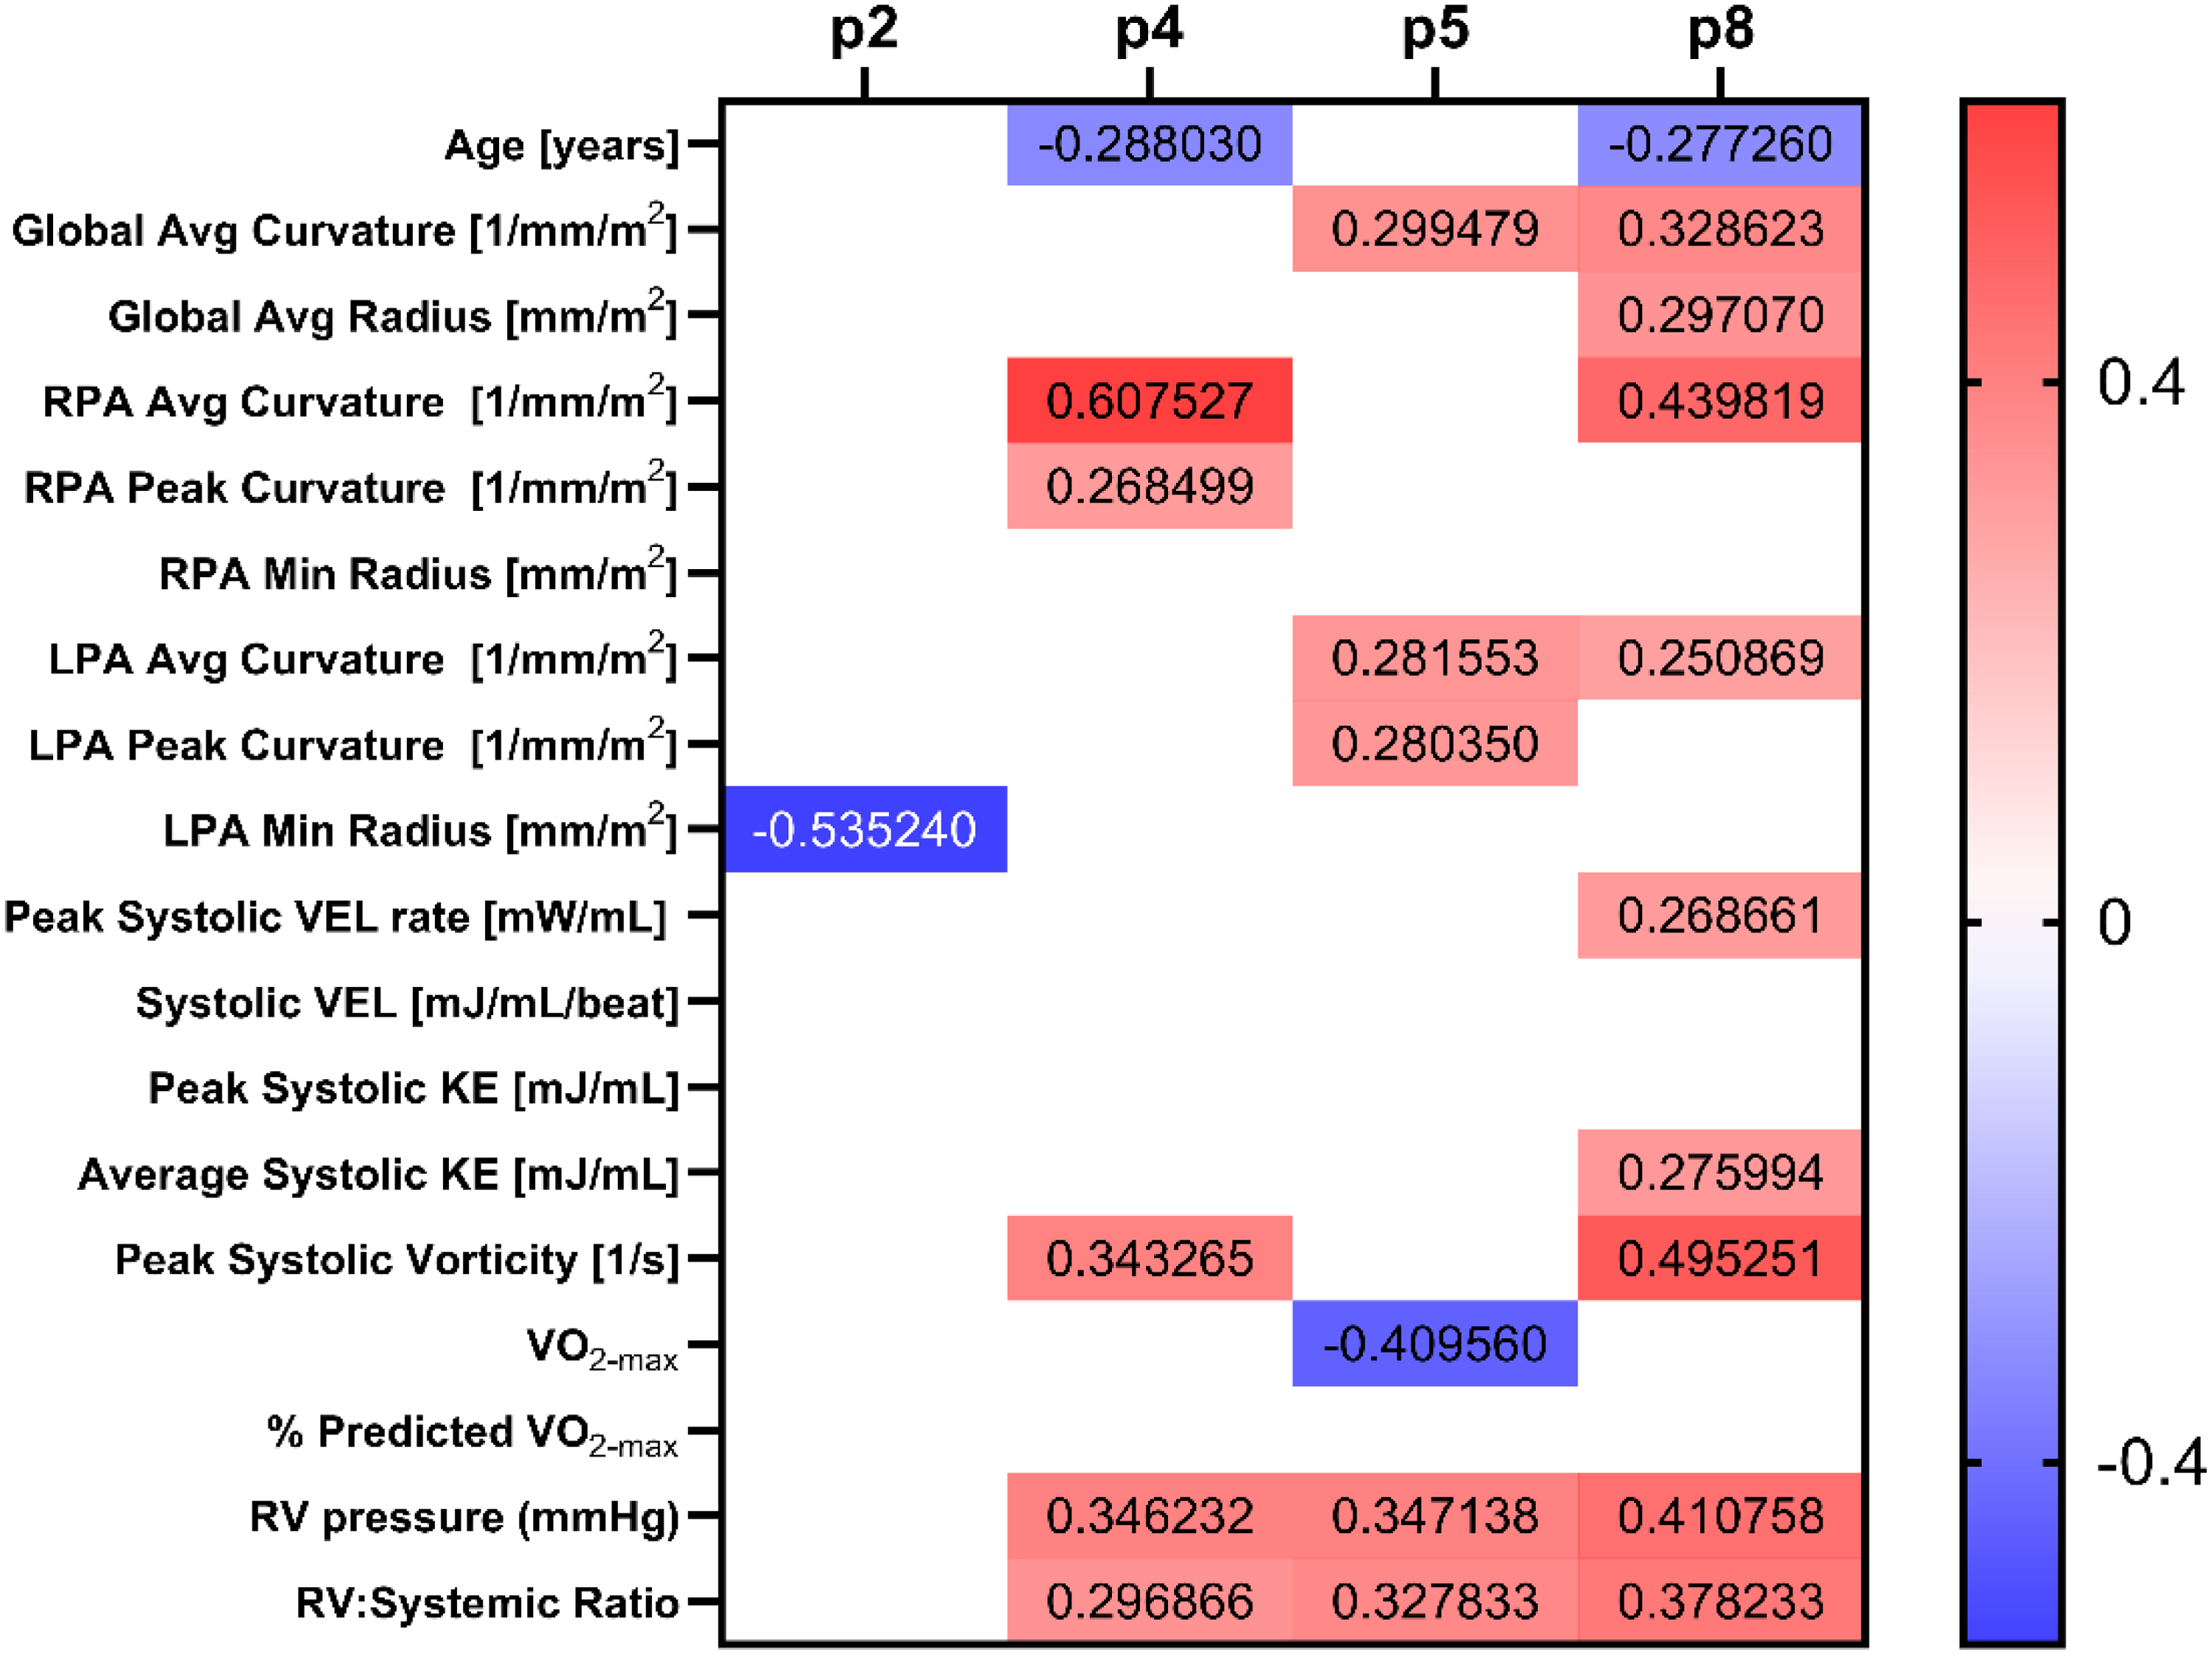
Correlation matrix depicting the relationships between shape modes (p2, p4, p5, and p8) and pulmonary artery geometry, flow dynamics, and right ventricular parameters within the transposition of the great arteries (TGA) cohort. p2 – progressive LPA hypoplasia. p4 – sharper curvature, bilateral narrowing of the branch pulmonary arteries (PAs) and main pulmonary artery (MPA). p5 – alteration to mid-MPA caliber and trajectory. p8 – flattening of proximal MPA and bending of the PAs.
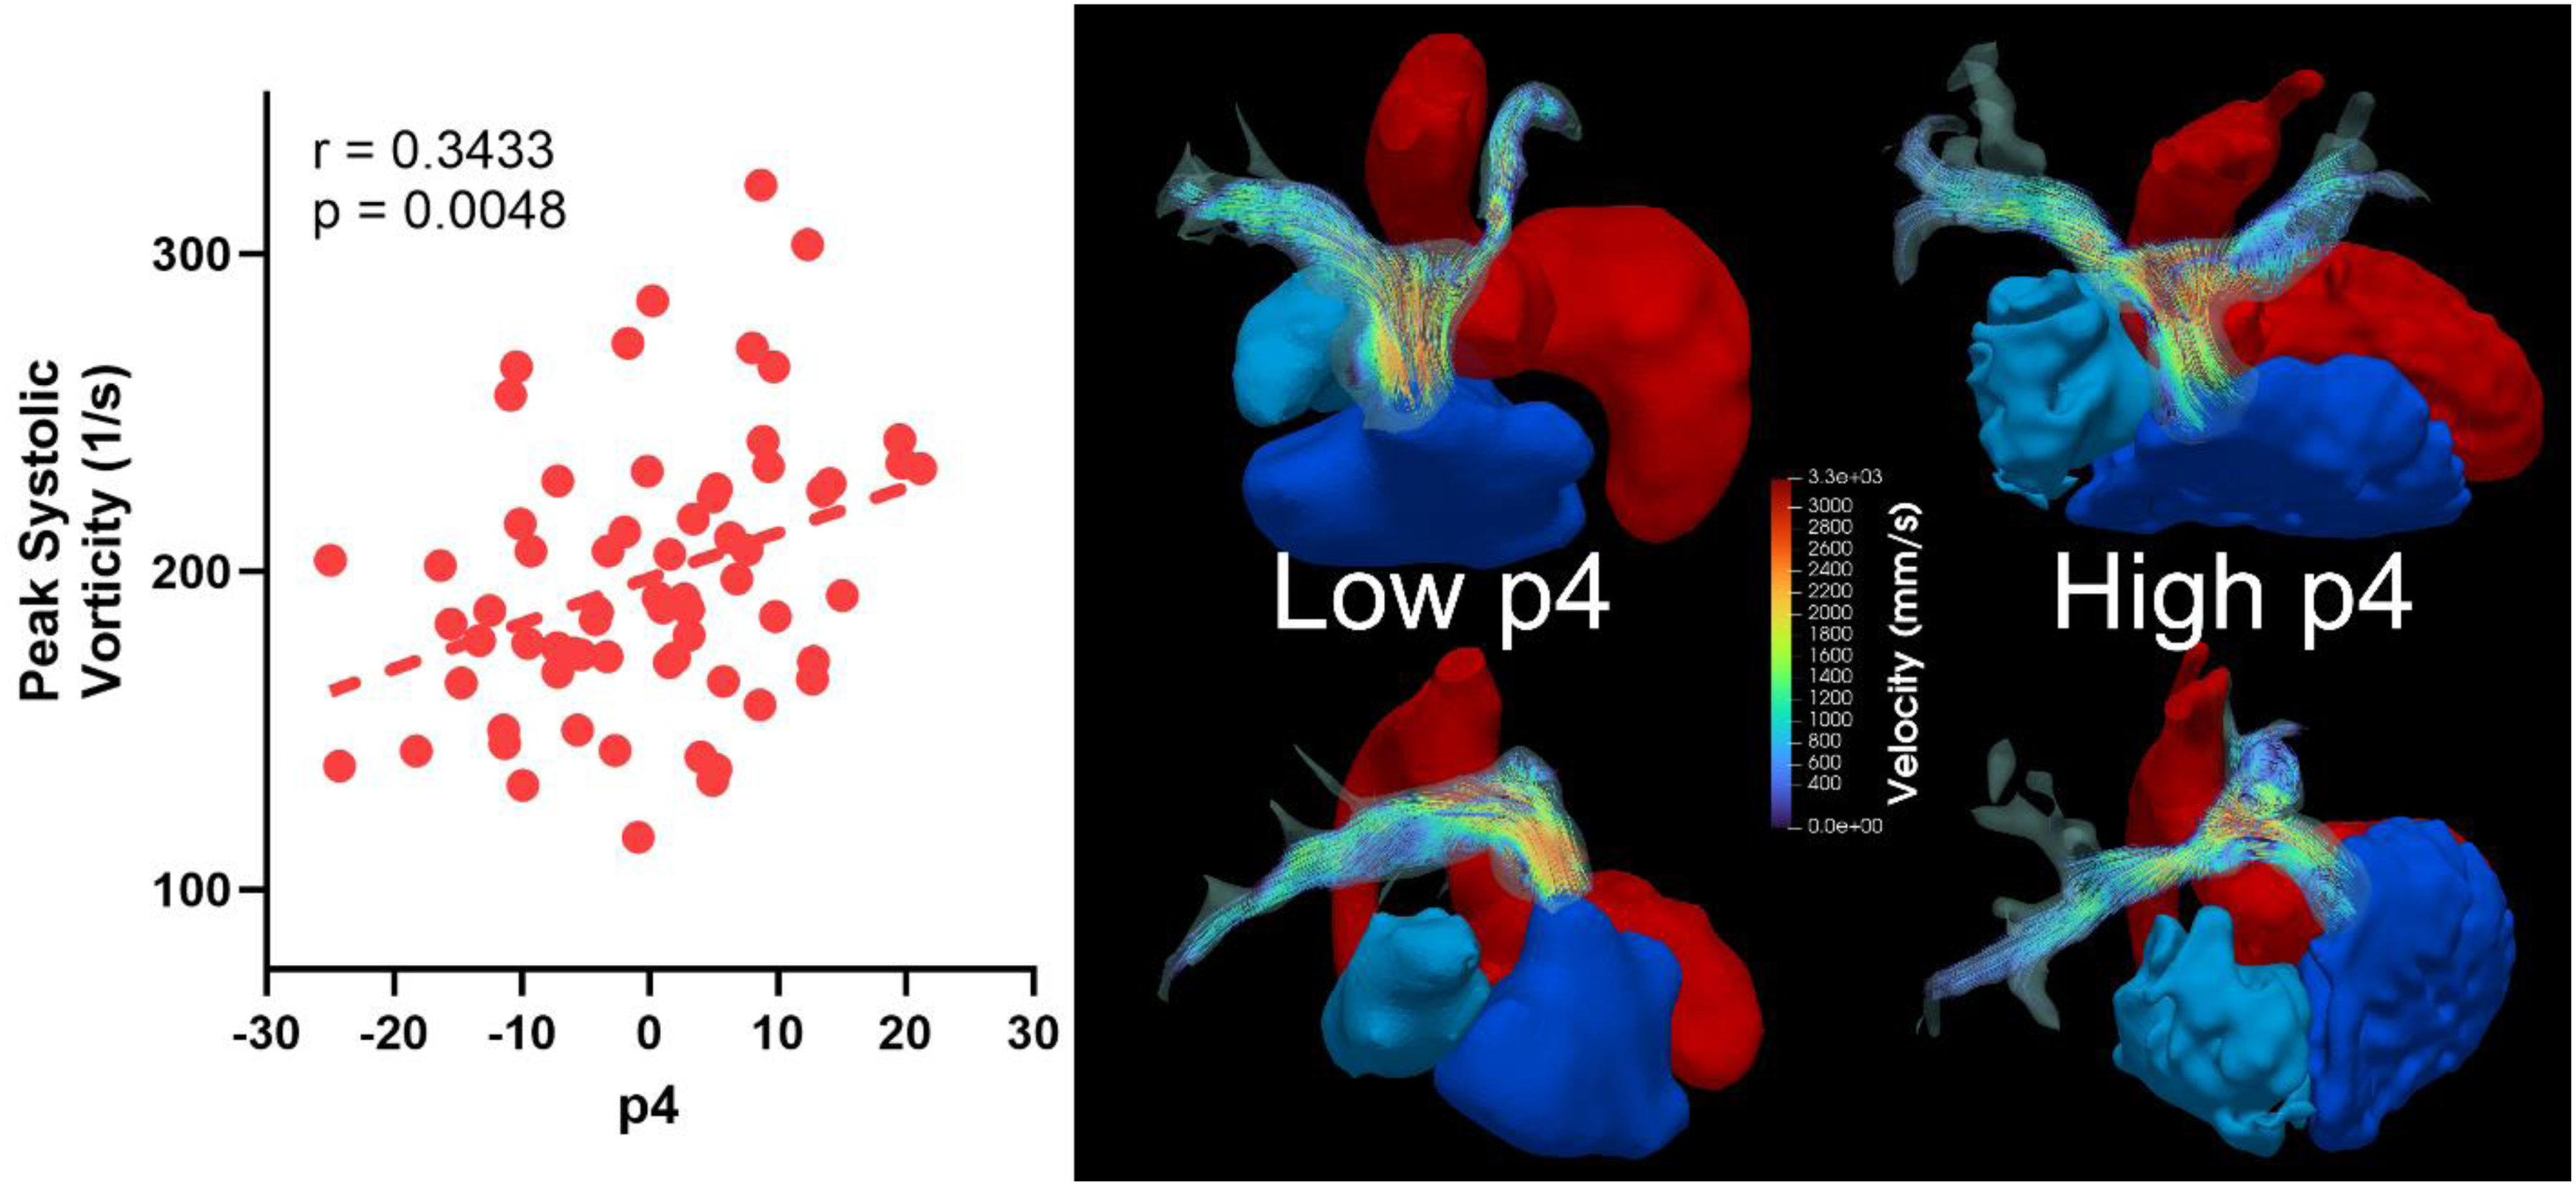
Relationship between shape mode p4 and peak systolic vorticity in patients post-arterial switch operation (ASO). The streamline visualizations demonstrating differences in flow patterns, with higher p4 values corresponding to more pronounced vortical flow formation in both branch pulmonary artery (PAs).
Associations of shape and flow with RV afterload and exercise intolerance
Both geometrical and flow parameters were associated with elevated RV pressure and RV:Systemic ratio. Shape modes p4, p5, and p8 correlated with both RV pressure and RV:Systemic ratio on univariable analysis. Additionally, RV:Systemic ratio was correlated with peak systolic vorticity (R = 0.42, p = 0.003). Right ventricular pressure also correlated both VEL rate (R = 0.33, p = 0.025) and VEL (R = 0.39, p = 0.007). To determine specific shape and flow parameters independently associated with RV afterload, multivariable linear regression analyses were performed (Table 2). In a model including PA size and shape modes, p4 (β = 0.005, p = 0.049), p5 (β = 0.006, p = 0.045), and p8 (β = 0.009, p = 0.028) were associated with RV:Systemic ratio, independent of global average radius. In a model including shape modes and age, only p5 remained independently associated with RV:Systemic ratio (β = 0.008, p = 0.007), whereas p4 and p8 did not retain statistical significance. In expanded models incorporating age, global average radius, and VEL, both p5 (β = 0.007, p = 0.013) and systolic VEL (β = 0.008, p < 0.001) remained independently associated with RV:Systemic ratio. A similar pattern was observed for RV pressure, where p5 (β = 0.455, p = 0.031) and systolic VEL (β = 0.629, p < 0.001) remained significant predictors. These findings suggest that the geometric configuration captured by p5 demonstrates an independent relationship with RV afterload, even after accounting for age, PA size, and flow-related energy dissipation.
Multivariable linear regression models evaluating associations between pulmonary artery shape, geometric and flow parameters, and right ventricular (RV) afterload.

Model 1 includes shape modes (p4, p5, and p8) and global average pulmonary artery radius as predictors of RV:Systemic pressure ratio. Model 2 includes shape modes and age as predictors of RV:Systemic pressure ratio. Model 3 expands the RV:Systemic ratio model to include systolic pulmonary artery viscous energy loss (VEL). Model 4 evaluates predictors of RV pressure. Values represent β coefficients with 95% confidence intervals. Model R2 and overall model significance are derived from the regression F-test. All models met assumptions of normal residual distribution and demonstrated low multicollinearity (variance inflation factor <1.6). Bold is meant to demonstrate p<0.05.
Exercise testing data were available in 25 TGA patients (median age 21.7 years [IQR 14.3–32.4], median BSA 1.7 m2 [IQR 1.5–1.9]). Median peak VO₂ was 27.2 mL/kg/min [IQR 23.1–33.5], corresponding to 76% predicted [IQR 63.5–88]. In age-adjusted linear regression analysis, peak systolic vorticity was associated with reduced exercise capacity (β = −0.22, p = 0.018). No shape modes or other energy metrics demonstrated significant associations in this limited subgroup.
Segmentation reproducibility and sensitivity of SSM analysis
To assess segmentation reproducibility, PA segmentation was repeated in 10 randomly selected datasets. The mean Dice similarity coefficient was 0.88 (IQR 0.05). The mean 95% Hausdorff distance was 3.10 mm (IQR 1.26 mm), and the mean average surface distance was 0.95 mm (IQR 0.27 mm), indicating good intraobserver agreement for PA segmentation. To evaluate sensitivity to particle initialization, the SSM was rerun after altering particle seed placement. The repeat SSM resulted in minor reordering of deformation patterns, with the deformation pattern previously represented by p5 appearing as p6 in the reseeded model. Despite this shift in mode ordering, the correlations derived from the reseeded SSM demonstrated similar associations between this geometric phenotype and clinical parameters (Supplementary Figure 1). In multivariable modeling of RV:Systemic Ratio, the corresponding shape mode p5 (p6 in the reseeded analysis) remained independently associated with RV afterload.
Discussion
This study highlights the interplay between abnormal PA geometry, altered flow hemodynamics, and increased RV afterload in patients post-ASO, measured using metrics by SSM and 4D flow. Correlation analysis revealed key shape-flow associations, with mode p4 linked with increased right curvature, PA narrowing, increased vorticity/decreased KE, and higher RV afterload. Additionally, increased curvature, energy loss, and vorticity were also associated with higher RV pressures. These findings underscore the role of pulmonary geometry and flow disturbances on RV ventricular afterload in TGA patients after the ASO.
Long-term monitoring is essential for ASO patients due to the effects of abnormal PAs. While RV ejection fraction is typically normal, exercise capacity is often borderline low and correlates with smaller PA size and pulmonary blood flow maldistribution. 11 Subtle RV impairments, including reduced free wall strain and tissue Doppler velocities, persist postrepair. 12 Over time, maladaptive remodeling, including eccentric hypertrophy and declining RV function may develop, requiring longitudinal follow-up for right heart failure. 13
Among the identified shape modes, p4 most directly reflects PA curvature, integrating branch PA bending and relative narrowing. The strong associations between p4, flow inefficiency, and RV afterload in this study support curvature as a central geometric driver of post-ASO hemodynamics. A recent study by Calderon et al. used 4D flow to characterize hemodynamic abnormalities in TGA patients post-ASO, reporting significantly higher KE, VEL, and wall shear stress in PAs and aorta compared to controls. 4 While PA narrowing influences differential pulmonary blood flow, we have previously identified that PA curvature is strongly associated with increased RV systolic pressures, independent of stenosis. 2 For this study, we have further improved on the precision of curvature analysis by using centerline-based approaches. Abnormal PA curvature also correlates with neo-aortic dilation and neo-pulmonary valve compression. 14 Using a mock circulatory system with 3D-printed PA replicas, we previously demonstrated correlations between vorticity, pressure differentials, and energy loss, which could identify elevated RV mass more effectively than indices like the Nakata index. 10 These findings, along with the results from this study, emphasize that branch PA stenosis/caliber alone does not fully account for RV afterload, highlighting the role of abnormal bending, energy loss, and vorticity.
Computational fluid dynamic modeling of ASO PAs has demonstrated shear layer instabilities, vortical flow, and turbulence due to the unnatural PA bifurcation curvature. 15 In contrast, normal PA flow is streamlined and laminar. 16 The abnormal curvature increases blood flow resistance through the Dean number, defined as the Reynolds number multiplied by the square root of the ratio of tube diameter to curvature diameter.17,18 While this study does not directly investigate turbulent phenomenon as the hemodynamic parameters of velocity field are derived from a time-averaged sequence, the higher Reynolds number in the TGA cohort suggests that these flow profiles and flow hemodynamics are associated with turbulence and elevated turbulent KE found in computational fluid dynamic studies. Higher Dean numbers, associated with turbulent flow and increased resistance, are also observed in coarctation repair patients with an impact on functional capacity. 17
Computational, geometrical, and flow analysis have demonstrated that the LeCompte maneuver may exacerbate hemodynamic inefficiencies. Modified PA reconstruction techniques at the time of ASO, such as positioning the bifurcation differently or optimizing angulation of the MPA, might reduce the degree of PA bending and mitigate some of the long-term flow disturbances. For older ASO patients with significant PA flow abnormalities, surgical or percutaneous reintervention targeting curvature correction rather than just stenosis relief could be explored. Alternatives to the LeCompte maneuver, such as the spiral technique for PA reconstruction, may improve flow uniformity by emulating the natural curvature of healthy great vessels. 19 These findings also suggest that anatomical modifiers influencing bending, curvature, and flow in TGA patients could be used to identify those at risk for RV afterload and improve long-term outcomes. The association between PA vorticity and exercise capacity may also provide mechanistic insight into why functional limitation occurs in TGA patients despite relatively preserved ventricular structure and function. A recent longitudinal study by Joosen et al. demonstrated that peak VO₂ progressively declined over two decades following ASO despite stable RV volumes, systolic function, and myocardial strain on serial CMR examinations. 20 Altered PA geometry and associated flow inefficiencies may represent an underrecognized contributor to impaired functional capacity in this population.
This study has several limitations, including adjustments in 4D flow acquisition that could influence the voxel-based approach to VEL/vorticity, as these metrics rely on velocity derivatives that may be sensitive to image resolution/noise and phase offset errors. 21 The hemodynamic parameters derived from the velocity field are also fundamentally time-averaged and therefore do not provide the data needed to turbulent KE. Turbulent KE assessment requires dedicated magnitude imaging for each individual flow encoding, based on an MR signal model that captures the effect of pseudorandom fluid motion on the MR signal. 22 This functionality is not fully supported by ITFlow, and magnitude imaging is routinely stored in standard 4D flow acquisitions.
Another limitation is the use of RV pressure measurements derived from both cardiac catheterization and echocardiography. Doppler-derived estimates based on tricuspid regurgitant jet velocity may differ from catheter-derived gradients and introduce measurement variability. However, restricting the analysis to catheterization data alone would preferentially include patients undergoing invasive evaluation for suspected RV hypertension, introducing severity bias. Including both modalities, therefore, reflects real-world clinical surveillance and allowed a broader representation of RV pressure across the cohort, although this heterogeneity may have introduced additional measurement uncertainty. Additionally, the exclusion of patients with stent angioplasty may have underestimated the burden of abnormal flow dynamics in more complex ASO populations. These patients were excluded to focus on the geometric variability attributable primarily to the LeCompte maneuver and to minimize confounding from prior reintervention and image-related artifacts. This exclusion may bias the cohort toward less severe anatomy and may underestimate the full spectrum of post-ASO PA shape phenotypes and their association with RV afterload. The limited availability of exercise data (n = 25) likely reduced statistical power for detecting additional associations. Larger prospective studies are required to determine whether curvature-driven flow inefficiency independently predicts functional capacity. The retrospective nature of this study limits generalization, particularly when considering generational variations in surgical techniques for ASO.
Future research should explore the longitudinal progression of shape/flow metrics and their relationship with clinical outcomes such as RV failure in ASO patients. Advanced imaging and computational methods, such as SSM and improved CFD frameworks, could enhance our ability to quantify and predict flow disturbances in this population. Applying this analysis on datasets from CT angiography could potentially expand anatomic sampling for SSM, integrating CT- and CMR-derived geometries, particularly those with stent angioplasty. Future multimodality studies with harmonized segmentation and stratified analyses will be necessary to characterize stented anatomy and to determine whether preintervention shape phenotypes predict progression to reintervention. Finally, studies comparing surgical strategies, including the spiral technique versus the LeCompte maneuver or surgical reintervention of the PAs after ASO, could provide insights into their respective impacts on Dean number, flow efficiency, and RV afterload.
Conclusion
Abnormal PA geometry and altered flow hemodynamics are related and contribute to increased RV afterload in TGA patients post-ASO.
Supplemental Material
sj-docx-1-cvd-10.1177_20480040261447953 - Supplemental material for Shape and flow characterization of the pulmonary arteries after the LeCompte maneuver
Supplemental material, sj-docx-1-cvd-10.1177_20480040261447953 for Shape and flow characterization of the pulmonary arteries after the LeCompte maneuver by Jose Enzo Bunag, Thomas Casto, Tin The Phan, Bryan Gonzalez, Ryan O'Hara, Yves d'Udekem, Elias Balaras, Francesco Capuano and Yue-Hin Loke in JRSM Cardiovascular Disease
Footnotes
Acknowledgements
The authors would like to acknowledge Alan Morris from Scientific Computing and Imaging Institute at the University of Utah for his technical consultation of the ShapeWorks parameterization described in Methodology.
Ethical approval
This study was approved by Children's National Institutional Review Board under protocol STUDY0000045 with waiver of consent.
Guarantor
Yue-Hin Loke.
Author contributors
JEB, TTP, TC, BG, ROH, and YHL contributed to data collection and data analysis. JEB led the initial manuscript drafting. EB, FC, and YHL contributed to manuscript writing, critical revision, and intellectual content. YdU contributed to critical review of the manuscript. All authors reviewed and approved the final manuscript.
Funding
The authors received no financial support for the research, authorship, and/or publication of this article.
Declaration of conflicting interests
The authors declared no potential conflicts of interest with respect to the research, authorship, and/or publication of this article.
Supplemental material
Supplemental material for this article is available online.
References
Supplementary Material
Please find the following supplemental material available below.
For Open Access articles published under a Creative Commons License, all supplemental material carries the same license as the article it is associated with.
For non-Open Access articles published, all supplemental material carries a non-exclusive license, and permission requests for re-use of supplemental material or any part of supplemental material shall be sent directly to the copyright owner as specified in the copyright notice associated with the article.