






Abstract
Patient-specific cardiovascular simulations are an integral part of cardiovascular research and are increasingly finding use in clinical practice. A primary factor hindering large cohort studies and clinical utilization of cardiovascular simulations is the time-consuming process of constructing simulation-suitable computer models from medical image data. Methods have been proposed to automate the model construction process, but are tailored to either vascular or cardiac models. We herein propose a framework, MeshGrow, that is capable of combining automated modeling of cardiac and extended vascular territories. Namely, we demonstrate that this method can be used to reconstruct the main cardiac chambers along with the aorta and its main sub-branches, and returns a simulation-suitable mesh with a defined aortic valve surface and other surfaces needed for boundary condition specification. MeshGrow combines two different machine learning based techniques to address the specific challenges involved with cardiac and vascular model construction. This results in a two-stage approach; (a) meshing the cardiac structures and (b) growing the vasculature out from it. We present results of our method on five CT test datasets and compare predictions against state-of-the-art benchmark methods, as well as ground truth manually constructed models. Results show that MeshGrow achieves higher metric scores than benchmark methods on the test data. Additionally, we showcase the applicability of the method by running three-dimensional computational fluid dynamics simulations with two of the test cases. With this work, we demonstrate a method that can automate the construction of combined cardiac and vascular models for patient-specific cardiovascular hemodynamic simulation.
Keywords
Introduction
Patient-specific computational modeling of cardiovascular function is a fundamental part of cardiovascular research and increasingly a part of patient care.1,2 Specifically, patient-specific simulations of tissue mechanics and fluid dynamics gain insight into physiological function otherwise difficult, or impossible, to observe; for example, tissue mechanics, cardiac electrodynamics, and hemodynamic data such as pressure gradient or wall shear stress. These patient-specific simulations require anatomically accurate geometric models representing the domain of interest. These geometric models are typically built from medical image scans of patients, where the outlines of different tissues in the medical image (pixels/voxels) are used for reference for model construction. A primary challenge remains the time-consuming and costly process of geometric model construction from medical image data. This challenge limits the ability to consider larger cohort studies as well as timely decision support often needed in clinical settings. 1 Also, because model construction is often manually performed and guided by user discretion, the process lacks standardization and the outcome may largely depend on the modeler. 3
Several software tools have been developed for patient-specific cardiovascular modeling. Most of these, such as SimVascular and CRIMSON,4,5 focus on vascular modeling. The common workflow involves a user manually generating pathlines along vessel centers, followed by defining vessel lumen contours in planes perpendicular to these pathlines. These 2D contours are then lofted to construct a 3D surface mesh of the vasculature. This process heavily depends on manual input and user discretion, requiring experienced users to construct pathlines and refine 2D segmentations. Even with advancements in 2D segmentation techniques, such as level-set methods and machine learning,6–8 manual correction remains necessary. Additionally, selecting segmentation points along pathlines can lead to contour misalignment, complicating the 3D lofting process. Therefore, there is a clear need for accessible, automated vascular model construction methods.
Custom cardiac modeling software has not been developed to the same extent as vascular modeling tools. Most modelers rely on general medical image segmentation software such as 3D Slicer. 9 Cardiac segmentation presents unique challenges due to the unclear boundaries between heart chambers in medical images. Moreover, temporal modeling introduces additional complexity, requiring multiple consistent cardiac models across different time points in a sequence. Prior methods have primarily used basic segmentation techniques, including manual voxel labeling and thresholding. 10 While semi-automated approaches, such as level-set methods and region growing, offer potential improvements, they still require manual correction and parameter tuning. 10
Recently, machine learning methods for segmentation have gained popularity as a possible avenue for automating the modeling process. For medical image segmentation, deep neural networks (DNNs) have shown promising results, especially for voxel-wise classification. Specifically, convolutional neural networks (CNNs) have been deployed for cardiac segmentation yielding good voxel classification accuracy but struggling with the resulting staircase artifacts and disconnected bodies, none of which is desirable when performing simulations.11–13
Alternative approaches, such as graph neural networks, have been used to deform mesh templates, improving topological consistency. 14 However, this method introduces overlapping elements, which the recent method LinFlo-Net addresses by enforcing continuous and smooth deformations. 15
For vascular segmentation, DNNs have been trained to classify voxels corresponding to coronary arteries, the aorta, and other structures.16–18 While these methods achieve high accuracy for large vessels with well-defined boundaries, they struggle with smaller branches, often resulting in disconnected structures. This limitation poses a significant challenge for simulation applications, where a unified mesh is required. SeqSeg addressed this issue by enhancing local vessel segmentation and prioritizing smaller branches. 19 Beyond voxel classification, CNNs have also been applied to vascular tracking 20 and bifurcation detection, 21 but these approaches require integration with 2D or 3D lumen predictions to create complete vascular models.
To our knowledge, cardiac and vascular model construction methods have been developed largely independently. This is likely due to the historical separation of cardiac and vascular simulation applications. However, the physiology and pathology of the heart and its primary branches are closely interconnected. To address these applications, there is a need to integrate both cardiac and vascular components to produce comprehensive 3D models with well-defined intersection boundaries. We herein address this by developing a novel approach, MeshGrow. Namely, since vasculature and cardiac structure anatomies differ significantly topologically, we combine two different modeling approaches. First, we model the cardiac chambers by deforming a cardiac mesh template using LinFlo-Net,
15
and from this we seed and grow out attached vasculature using SeqSeg.
19
Overall, MeshGrow is capable of:
Automatically locating the cardiac region in a medical image volume and generating a patient-specific cardiac model. Automatically locating the aortic root from the predicted cardiac model and initializing an automatic vascular tracking and segmentation method. Automatically constructing an extensive vascular segmentation. Returning a patient-specific cardiovascular mesh with an inlet, outlets and an aortic valve surface defined for boundary condition specification.
Methods
Figure 1 shows the method workflow. The input to the proposed method is a 3D angiography containing the heart and aorta. This “global” image volume is fed into a heart localization module that deploys a neural network to perform a “rough” cardiac segmentation. This segmentation is used to crop the global image volume to produce a smaller volume localized around the heart. This cardiac sub-volume is used for a detailed 8-class cardiac region segmentation. The 8 classes are: the left ventricular myocardium, left ventricle lumen, right ventricle lumen, left atrium lumen, right atrium lumen, ascending aortic arch lumen, pulmonary artery lumen, and aortic valve surface. The cardiac region segmentation is then used to place a seed point in the aortic root to initialize the segmentation of the aorta and its sub-branches. Note that the cardiac mesh template also contains a truncated ascending aortic arch lumen. As described later in this section, we use this to align the SeqSeg segmentation of the aorta and connecting arteries to the cardiac model. The cardiac and vascular segmentations are finally combined into one using an assembly module and output as surface meshes after post processing.
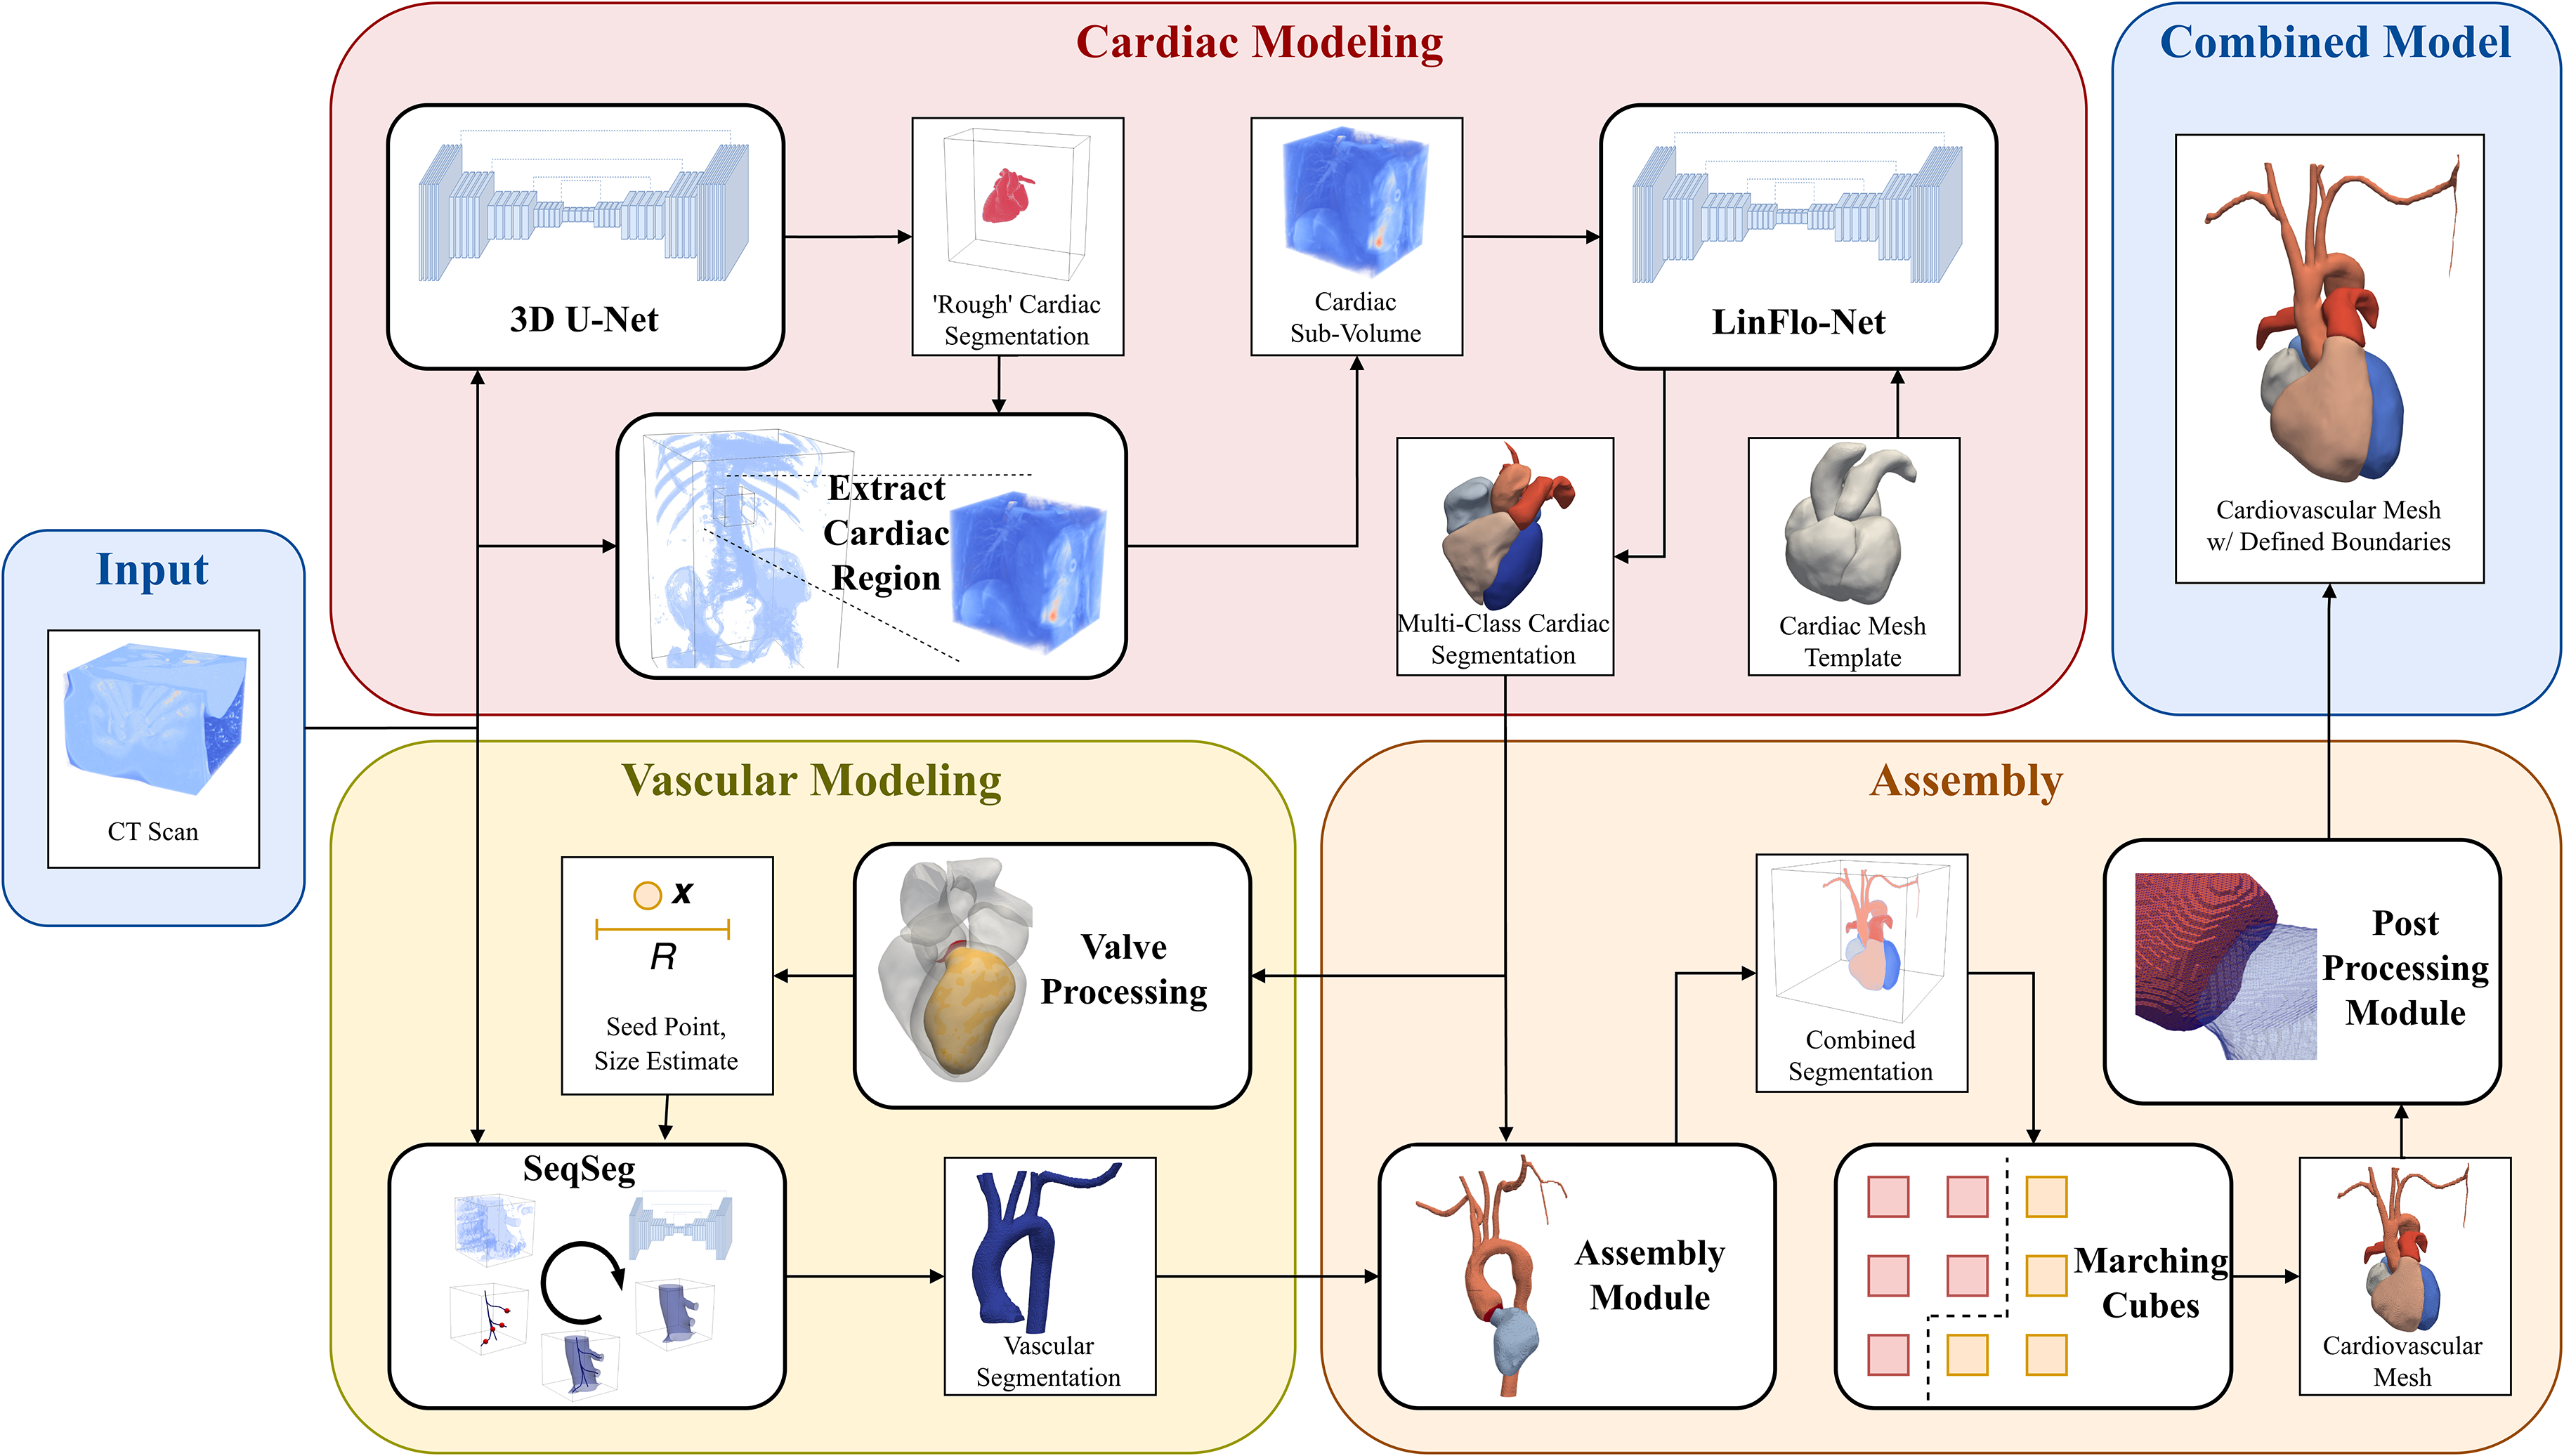
The MeshGrow method workflow. MeshGrow takes as input a medical image scan and returns a patient-specific cardiovascular mesh.
Cardiac localization and segmentation
The first step is to locate the heart in the global image volume. We utilize a U-Net CNN for the task. Namely, we trained a model to perform binary voxel classification on the global image volume, where each voxel is labeled as either
We use LinFlo-Net 15 for cardiac mesh generation. This method transforms a template cardiac mesh to capture the patient-specific cardiac morphology as seen in a 3D clinical image (e.g. CT scan). LinFlo-Net is chosen for its demonstrated ability to predict accurate simulation-ready cardiac meshes. Briefly, the method utilizes a two-stage mesh deformation process consisting of a learned affine transformation (scaling, translation, and rotation) followed by a diffeomorphic mesh deformation process wherein the vertices of the template mesh are integrated along a learned static 3D flow vector field.
The affine transformation uses a 3D CNN and predicts the 9 parameters of the transformation (3 parameters each for scale, translation, rotation). This module is trained to minimize the chamfer distance in the L1-norm between the template mesh and target mesh. The diffeomorphic mesh deformation module consists of a U-Net architecture that is trained to produce a dense flow vector field in the image space. This module is trained to minimize a weighted sum of various losses including:
Chamfer distance in the L1-norm. Normal consistency between template and ground truth meshes Physics-based loss term that prevents volume collapse Mesh regularization, which includes edge length, normal consistency across faces, and Laplacian smoothing loss.
The reader is referred to the original article
15
for further details on each of these loss terms.
The template mesh is a multi-component surface mesh representing the blood pools of the four cardiac chambers, the myocardium of the left ventricle, and segments of the pulmonary artery and aorta where they attach to the heart. Since the vascular segmentation method that we later use requires a seed-point for initialization, we added an additional region to the template mesh consisting of the aortic valve surface. Figure 2 shows the template mesh with the aortic root highlighted. This aortic valve surface in the template was created manually using MeshLab 23 by cutting the aorta template mesh with a plane.

(a) Template mesh used for cardiac segmentation showing the added aortic valve surface. (b) Automatic initialization of aorta tracking starting from the aortic valve, determining direction using the aortic valve and left ventricle mesh regions.
Vascular segmentation
Vascular segmentation was achieved using the Sequential Segmentation (SeqSeg) method. 19 The method constructs vessel segmentation by piece-wise addition of local segmentations predicted using a deep-learning-based U-Net convolutional neural network. SeqSeg automatically tracks vasculature by inferring direction and bifurcations from local vessel features. The method can be applied to various vascular territories, but requires initial specification of a seed point, tracking direction, and estimate of the initial local vessel radius.
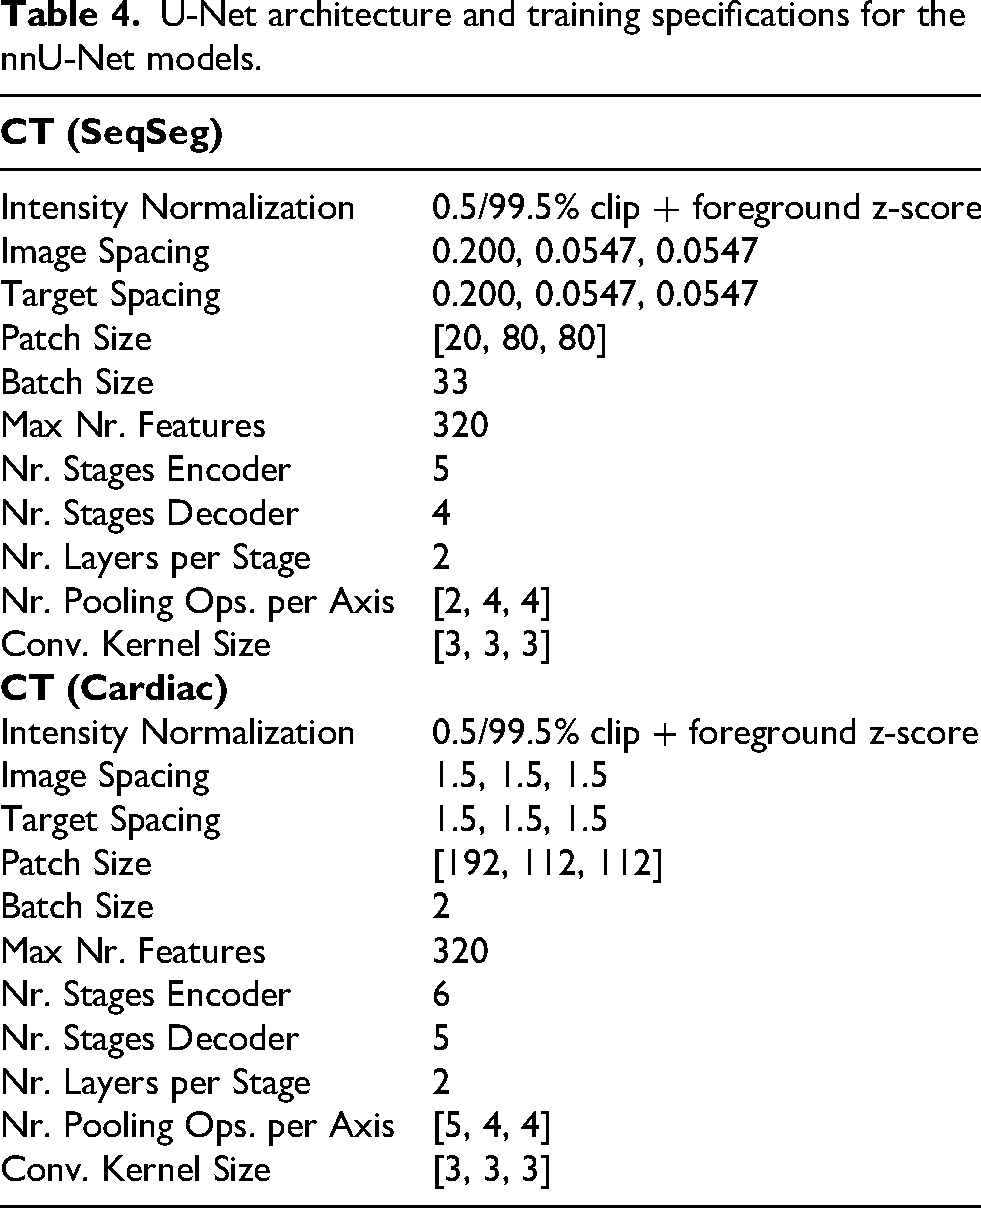
SeqSeg deploys a DNN to perform vascular segmentation of local sub-volumes, including a 3D U-Net convolutional neural network with hyperparameters determined from the nnU-Net framework, see Isensee et al.
22
for further details on methodology and Appendix Table 4 for specific hyperparameters chosen. For training we sampled each global vascular segmentation in the training dataset around the global vascular centerline. This improves use of available annotated data and introduces a beneficial inductive bias in our neural network model that allows it to generalize to vessels not annotated in training datasets, as demonstrated in Sveinsson Cepero and Shadden.
19
Several augmentation techniques are used during training such as rotation, scaling, Gaussian noise, Gaussian blur, brightness, contrast, simulation of low resolution, gamma correction and mirroring; see Isensee et al.
22
for full implementation details. We use a combined loss
Automatic initialization of vascular segmentation
We automatically initialize SeqSeg at the aortic root by processing the cardiac mesh prediction. Let us denote regions of mesh vertices as sets The average node location is calculated for sets AV and LV; There are two possible normals to the surface, the direction of tracking

Initial seed point is chosen as
Tracking and assembly
Once initialized, SeqSeg extracts the first sub-volume around the aortic root for segmentation. A centerline is extracted from the segmentation, which is then used to determine direction and size of the vessel, and this information is used to choose the next point to move the segmentation window to. In the case of multiple branches, one point is chosen to move to next and the others are saved in a bifurcation queue for subsequent tracking, see Sveinsson Cepero and Shadden
19
for further details. The global vascular segmentation is assembled together from all local segmentations predicted while tracking. Note that many of these local segmentations overlap and their probabilistic map output prediction are averaged together. We thresholded the averaged global probabilistic map using a value of
Outlets of the global vasculature mesh are detected using the global centerline. Where outlets are detected, caps are defined using a box clip boolean operation on the surface mesh to obtain a planar surface that can be used for boundary condition specification. Caps are planar surfaces defined at the cross section of vascular domain boundaries. The location of the node and the tangent of the centerline there are used to position and rotate the box clip operator. The box side length
Union of segmentations and valve definition
Two aortic segmentations are obtained; one from LinFlo-Net,
Let

Once the final multiclass cardiovascular segmentation is defined with corresponding aortic segmentation
Experimental setup and metrics
We use the same data as Narayanan et al. 15 to train LinFlo-Net. The training data includes the multi-modality whole heart segmentation challenge (MMWHS), 13 orCaScore challenge, 25 left atrial wall thickness challenge (SLAWT), 26 and left-atrial segmentation challenge (LASC). 27 In total we had 101 CT samples in our LinFlo-Net training dataset. We used the same data as Sveinsson Cepero and Shadden 19 to train the neural network for SeqSeg, a total of 33 aortic models from the Vascular Model Repository (VMR, vascularmodel.com). See Sveinsson Cepero and Shadden 19 for further details on training data.
Since the objective of this work is to present a unified method to generate consistent cardiac and vascular segmentations, it is important to consider image samples that capture the structures of interest sufficiently for testing. In particular, we are interested in cardiac and aortic segmentations, therefore we are interested in image samples that capture the whole heart along with the descending aorta and which include corresponding segmentation masks for comparative analysis. Datasets containing both cardiac and vascular segmentations are not readily available and, therefore, the authors had to partially manually construct the test dataset in-house, as described next.
Five CT test datasets that contained the heart, aorta and aortic branches, were selected from the VMR. See Appendix Table 5 for patient demographic details. These test samples were not included in training data. The image spacing ranged
These datasets already contained ground-truth segmentations of the vasculature to use to evaluate the predictive accuracy of MeshGrow, however, since the VMR only provides vascular segmentation, we had to generate the ground-truth cardiac segmentations. To do this, we used TotalSegmentator 28 to generate the preliminary ground-truth cardiac segmentations that were then interrogated and manually corrected as needed. The segmentations generated directly from TotalSegmentator for all samples except O34421 appeared reasonable. This dataset required manual correction of the segmentation of the myocardium, as shown in Appendix Figure 7. Note, this particular failure case underscores the efficacy of a template-based method (which we adopt in MeshGrow) since mesh templates provide a strong shape prior for model predictions, enforcing topological consistency and anatomical accuracy.
For quantitative comparison between the segmentation results from our method,
The cardiac segmentation method LinFlo-Net has been evaluated and compared with benchmarks in Narayanan et al. 15 and therefore is not reconsidered here. However, since the vascular region segmentation depends on the cardiac segmentation method, it requires further validation. For comparison with state-of-the-art benchmark segmentation methods, as in Sveinsson Cepero and Shadden 19 we compared against 2D and 3D nnU-Net segmentation predictions of the vascular segmentations on the test datasets. The benchmark models were trained on the same datasets as the method proposed. For full details on network architecture and data preprocessing, see Table 2 in Sveinsson Cepero and Shadden. 19 Multiple augmentation techniques were deployed during training such as rotation, scaling, Gaussian noise and blur, see Supplementary Note 4 in Isensee et al. 22 for full details.
Quantitative metric results for aortic vascular regions.
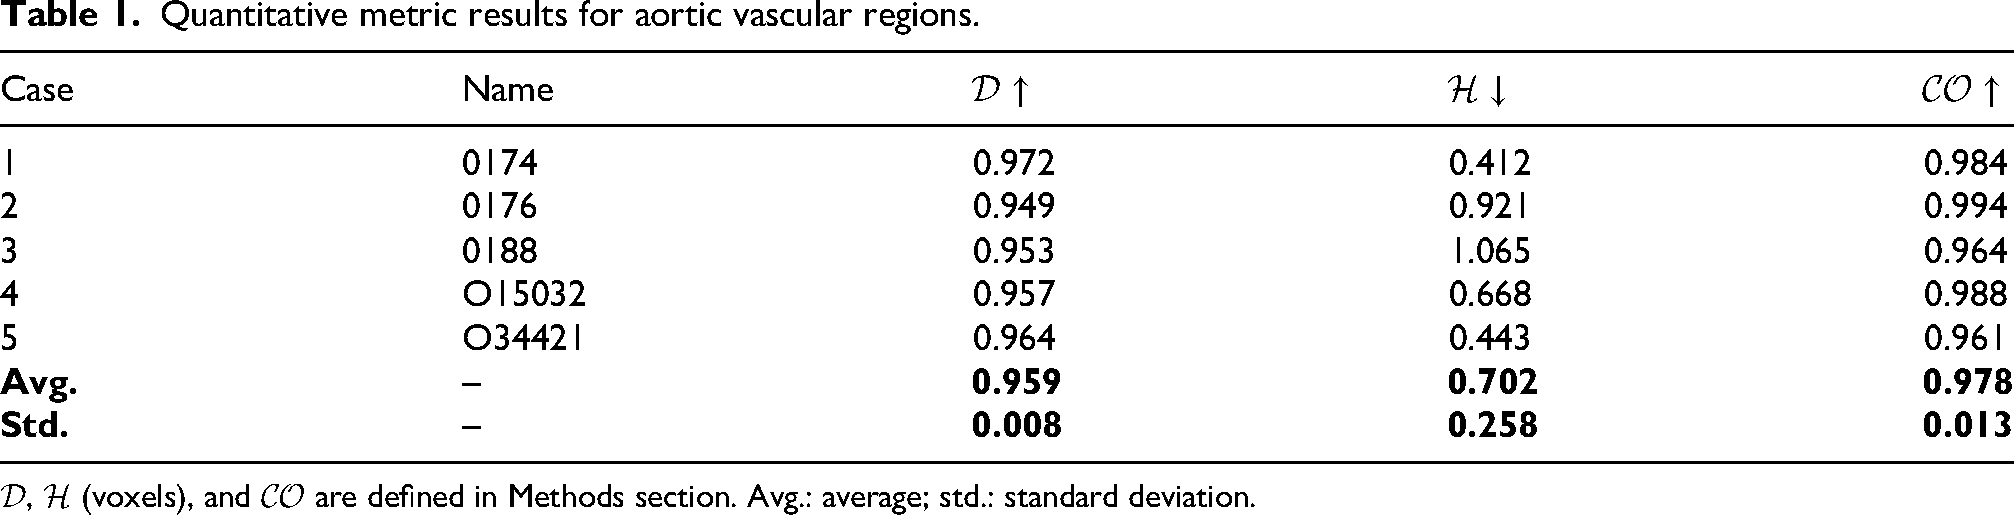
Both benchmark and SeqSeg models were trained using stochastic gradient descent with Nesterov momentum. Initial learning rate of 0.01 was chosen with a learning rate scheduler, see Isensee et al. 22 for full details. A single NVIDIA Geforce RTX 2080ti GPU (11 GB GPU memory) on the Savio High Performance Computing cluster at the University of California, Berkeley was used for training.
Simulation
To demonstrate the applicability of our proposed unified cardiac and vascular modeling approach, we performed left ventricle-aorta hemodynamic simulations. We chose two arbitrary cardiovascular models in the test set. We isolated the left ventricle and aortic meshes for simulation. As these were single time point images, we required a way to predict cardiac motion over time. To do this, left ventricle contraction was mapped from realistic motion derived from a separate patient with gated CT. Namely, using our recent cardiac shape modeling approach, 29 we first trained a neural ordinary differential equation (NODE) parameterized by time-series motion codes to fit the separate patient’s whole heart anatomy throughout the cardiac cycle. We then trained a second NODE to learn the diffeomorphic transformation between this patient’s anatomy at the static time point and the cardiovascular anatomies of our test cases. The learned cardiac motion from the first NODE (described by the motion codes) was subsequently mapped onto the test cases to generate their motion over the cardiac cycle. We performed a 3D blood flow computational fluid dynamics simulation using svFSI, 30 where the arbitrary Lagrangian and Eulerian (ALE) formulation of the incompressible Navier–Stokes equations was solved using the finite element method. We used the synthetic left ventricle and aorta motion to prescribe velocity boundary conditions on the left ventricle and aorta wall, and used a linear elastostatic model to solve the motion of the entire computational domain. We prescribed zero pressure boundary conditions at vessel cap outlets for simplicity. We simulated systole where the aortic valve is open. We obtain simulation results for velocity, pressure and wall shear stress over time.
Results
Geometric
We tested the proposed method on five withheld CT test cases. Appendix Tables 1 and 2 show the quantitative metric results for our method on these test cases, vascular and cardiac, respectively.
Quantitative metric results for cardiac chambers of the geometric model.
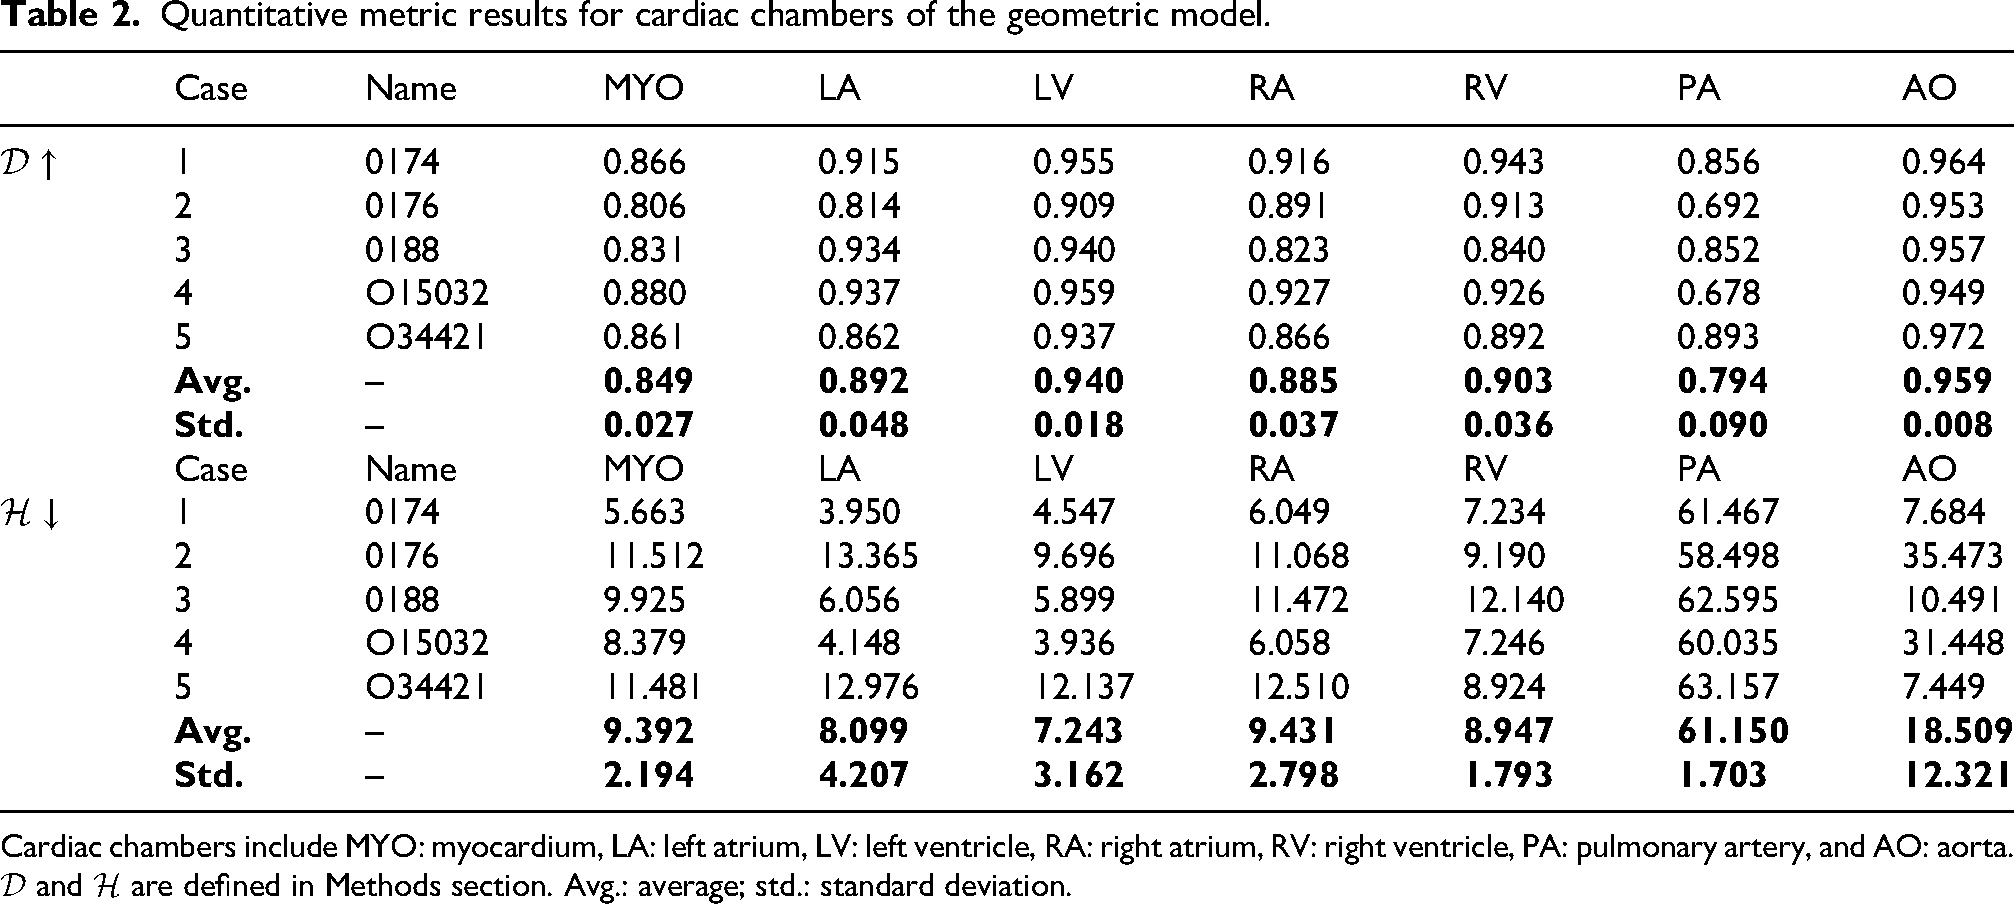
Cardiac chambers include
The method begins by performing a ‘‘rough’’ binary cardiac segmentation in the global image volume to estimate the location and bounds of the cardiac structures. See Figure 3 for qualitative comparison of the binary segmentation with ground truth cardiac models for the five held out CT test cases.

Comparing the ‘‘rough’’ binary cardiac segmentations with the ground truth for the CT test set.
After localizing the cardiac structures and extracting a sub-volume around its bounds, the method predicts a multiclass cardiac model. The Dice score and Hausdorff distance results for the different cardiac regions are presented in Appendix Table 2 for the 5 test datasets. The average Dice score for each region is shown in bold font. Of the cardiac structures, the Dice score was highest for the ventricles; on average
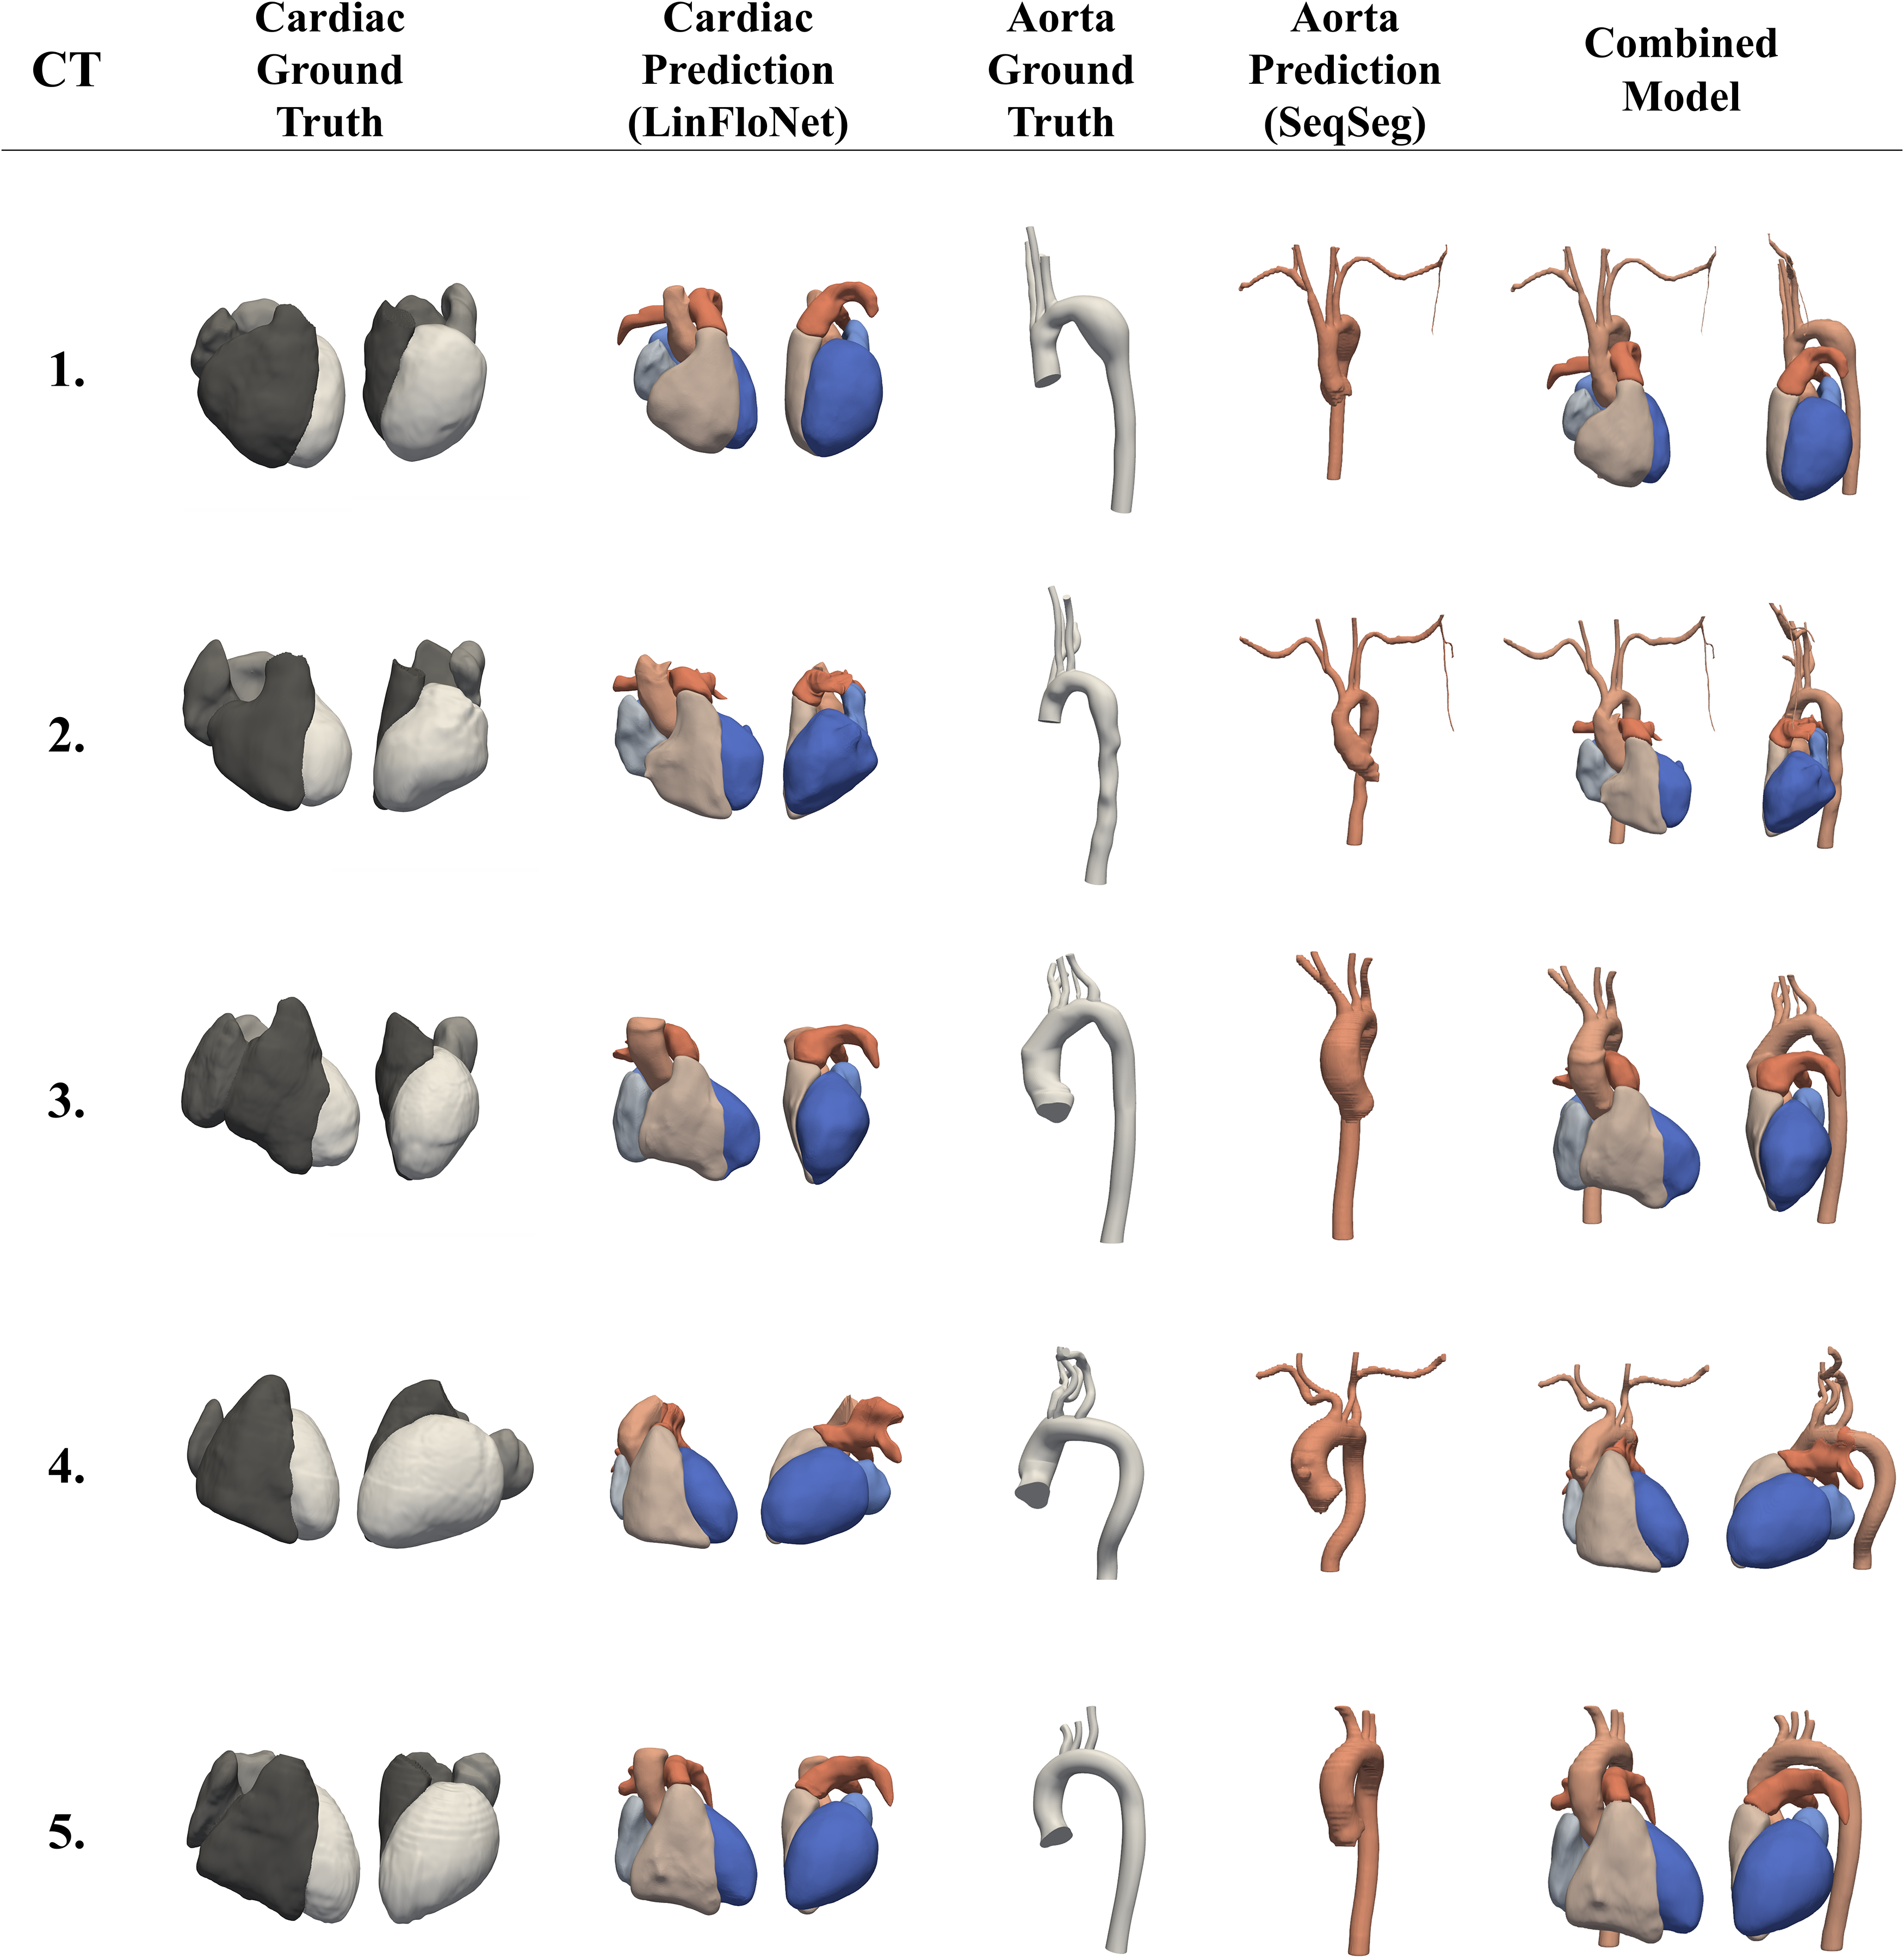
Qualitative results for our method compared to ground truth segmentations. From left: cardiac region ground truth, cardiac region prediction results (from LinFlo-Net), aorta ground truth, aorta prediction results (from SeqSeg), and the final combined cardiovascular model.
The seed point for initiating aortic segmentation is determined from the aortic root predicted in the cardiac model. To test the robustness of seed point size to initialize SeqSeg tracking, we try a range of radii values
Appendix Figure 6 shows the vascular segmentation growing from the cardiac mesh for case 2. The quantitative metrics comparing the predictions with the ground-truth for the five CT test cases are presented in Appendix Table 1. On average, our method achieved a Dice score of
For the comparison with vascular segmentation using the state-of-the-art 2D and 3D nnU-Net benchmark method,
22
quantitative metric results are presented in Appendix Table 3. On average, the benchmark methods achieve Dice score of
Quantitative comparisons for aortic vascular region test set CT cases between state-of-the-art 2D nnU-Net and 3D nnU-Net segmentation methods using the dice score (
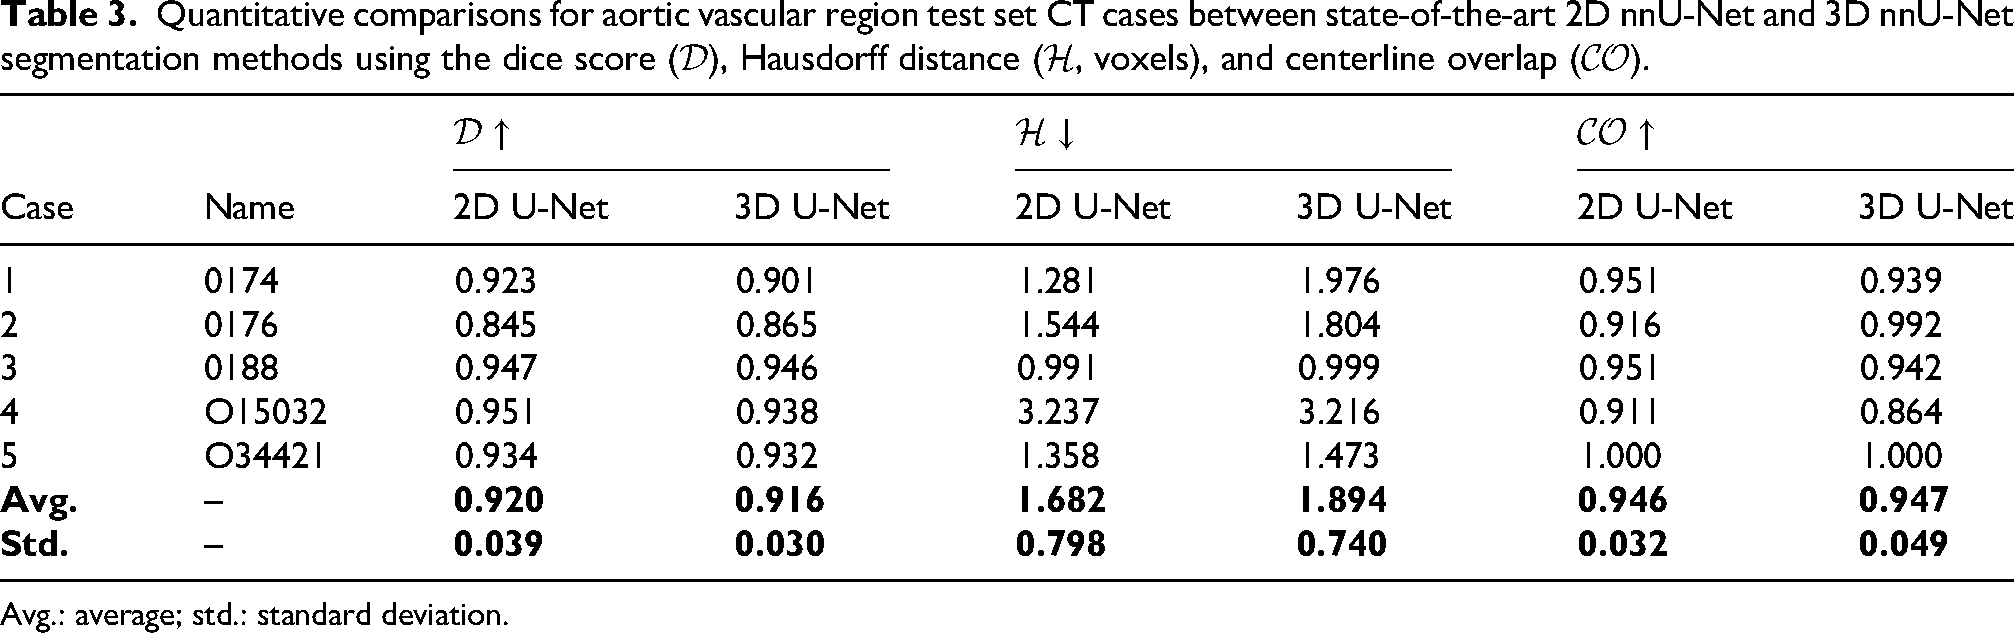
Avg.: average; std.: standard deviation.
U-Net architecture and training specifications for the nnU-Net models.
For a runtime comparison of methods, we additionally report approximate inference times. The MMWHS paper
13
claims that it takes 6
Simulation
To demonstrate the method’s ability to produce simulation-ready models, we ran hemodynamic simulations for two arbitrary cases in the test set. Figure 5 shows simulation results for cases 4 and 5. We display streamlines that pass through the aortic valve and wall shear stress magnitude during systole.
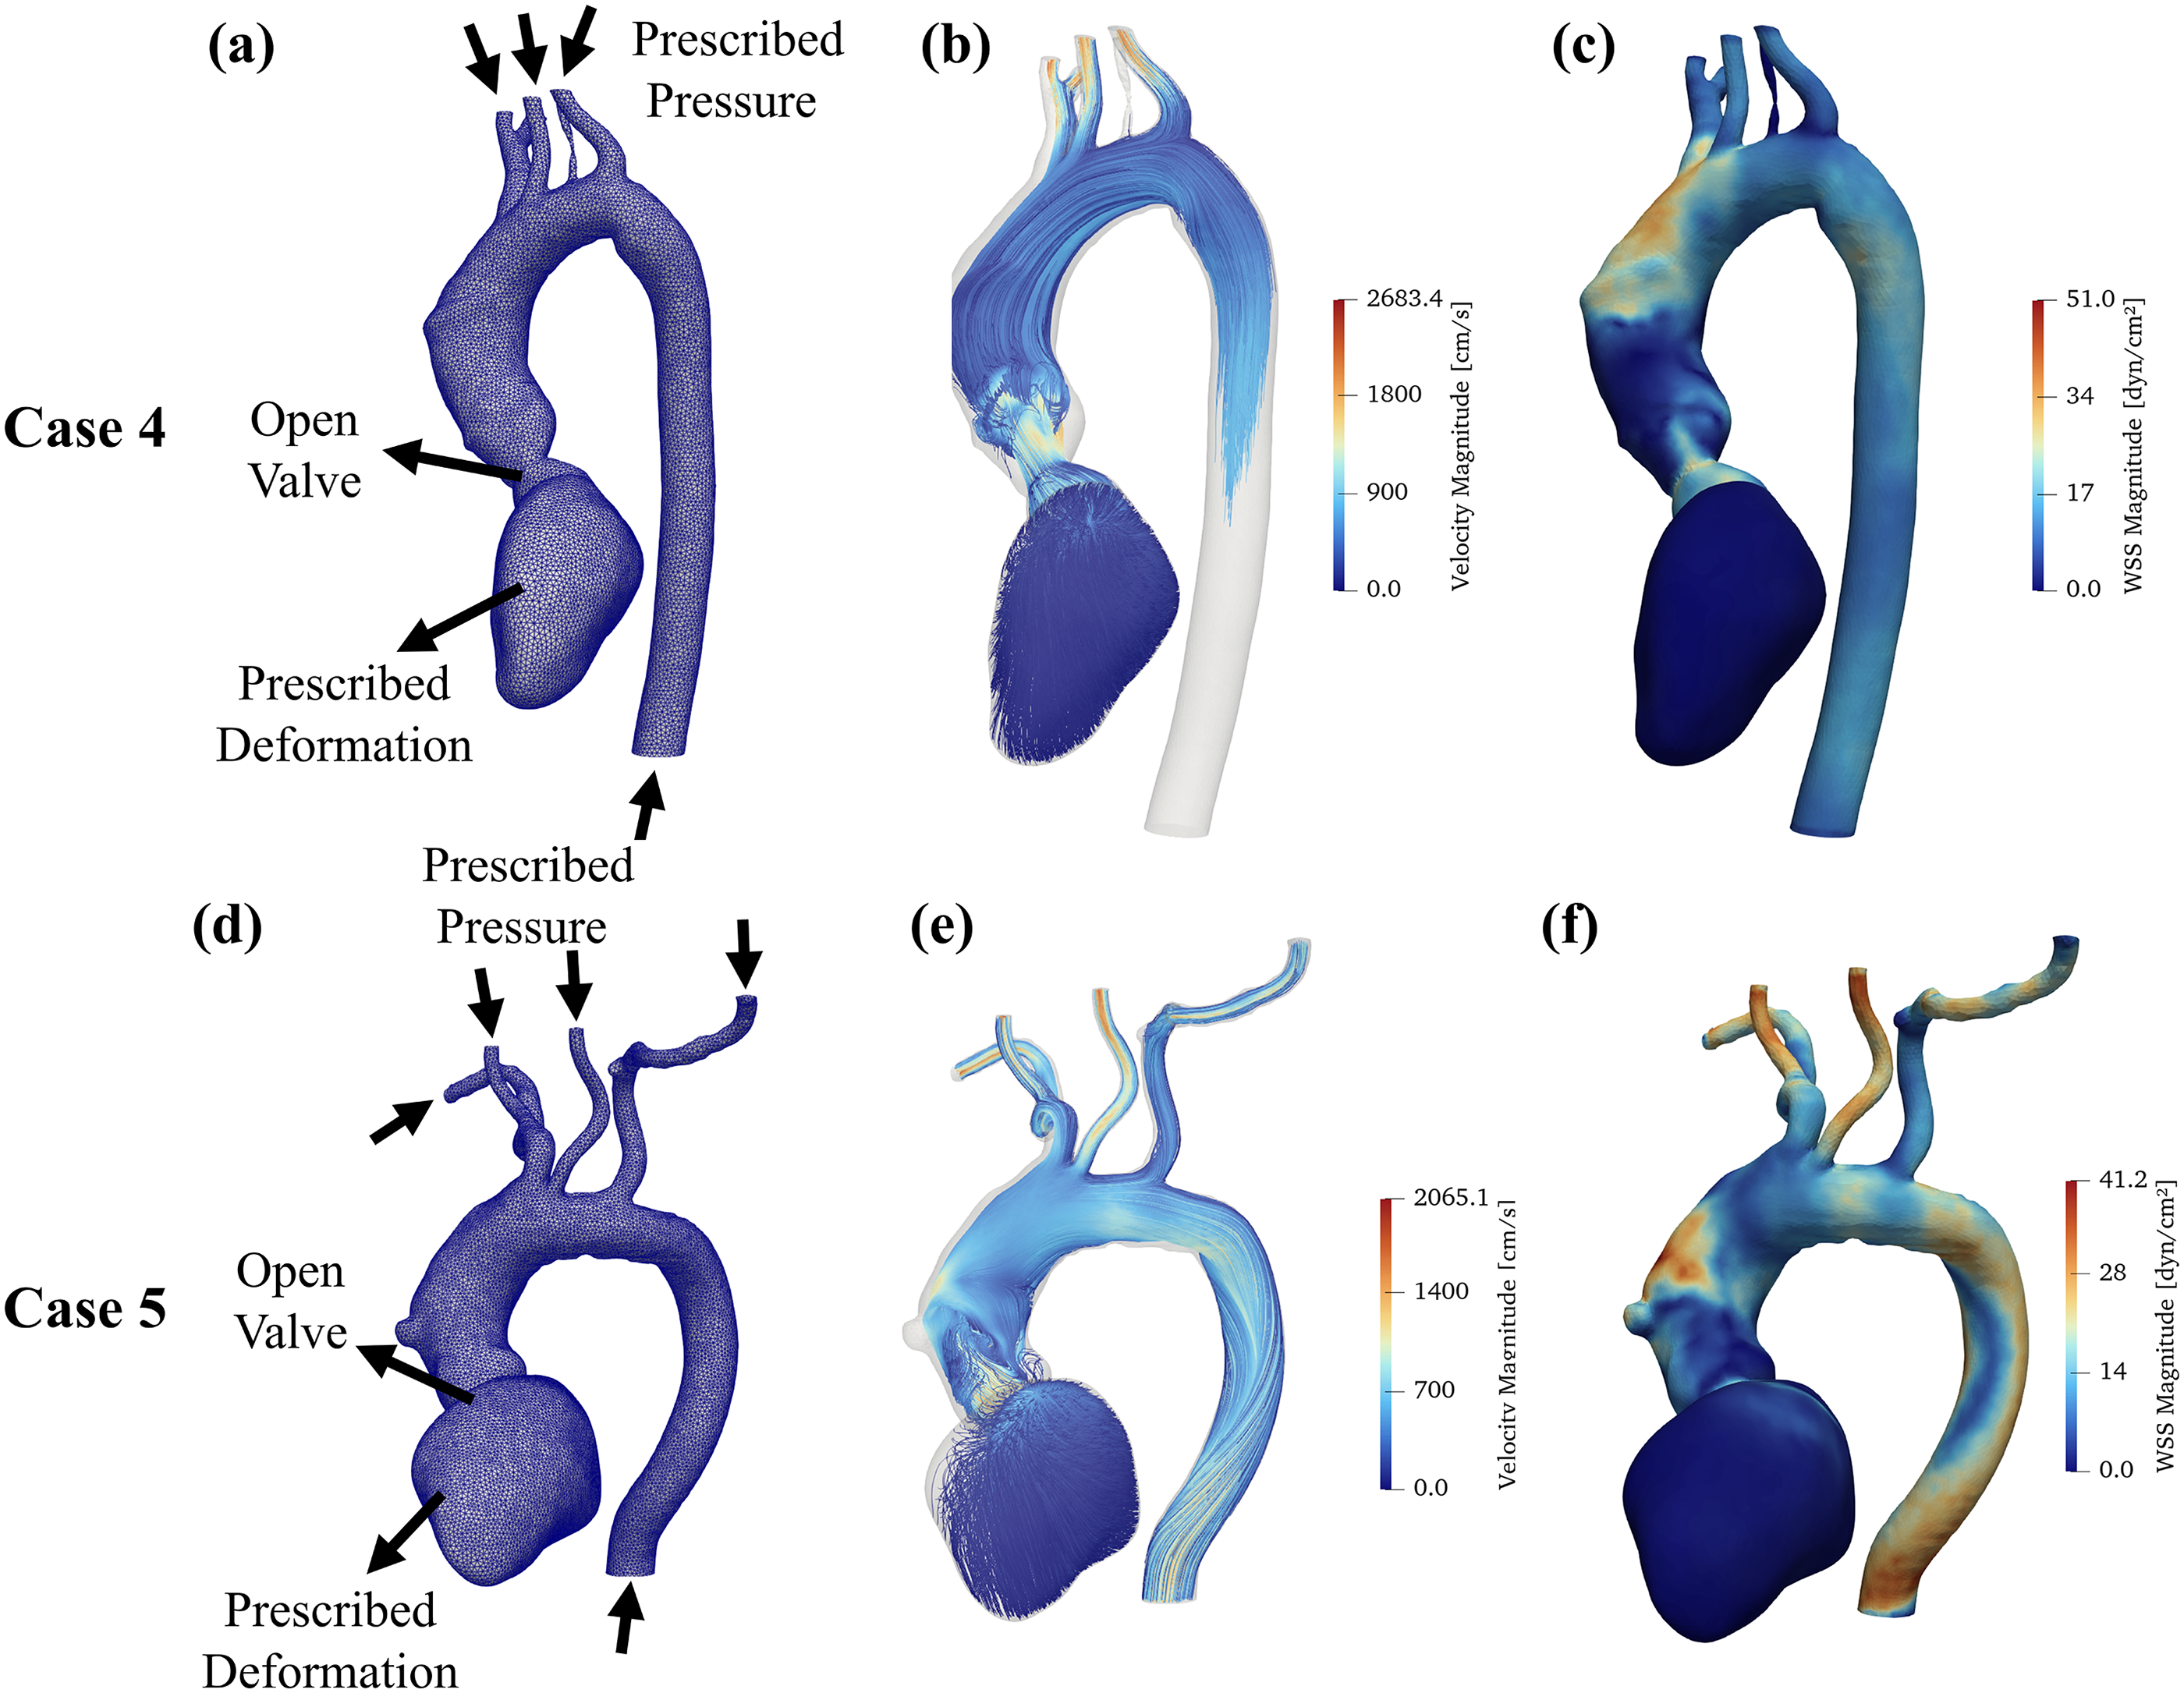
Hemodynamic simulation results using surface meshes acquired using MeshGrow (cases 4 and 5 in Appendix Tables 1 to 3). Deformation boundary condition was prescribed on LV with pressure prescribed at outlets and an open aortic valve (a,d). Streamlines passing through aortic valve (color coded for velocity magnitude) (b,e) and wall shear stress (WSS) magnitude (c,f) are shown during systole.
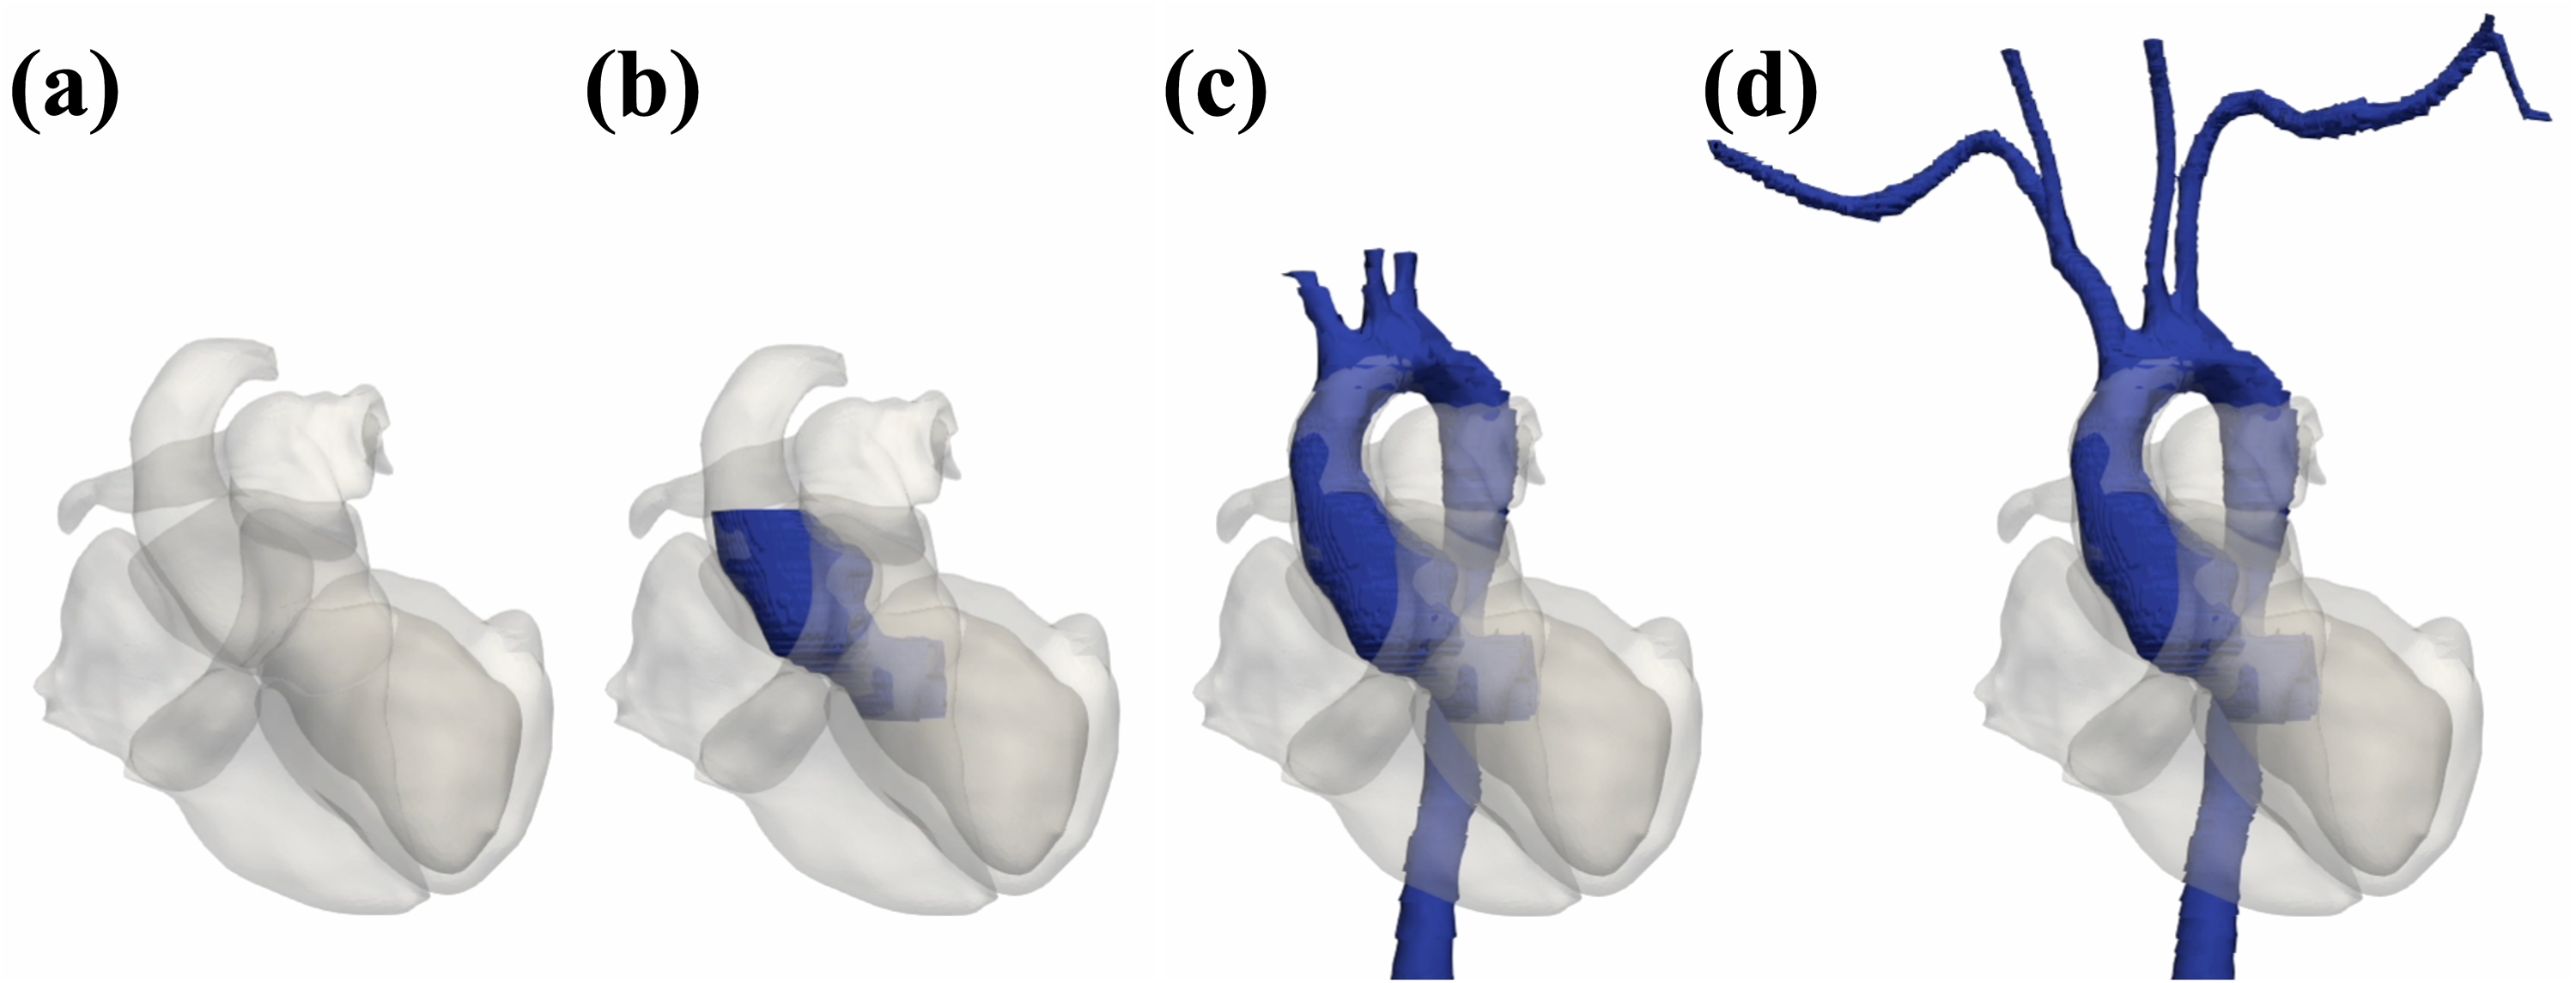
Seed for SeqSeg placed in the aortic root of the predicted cardiac mesh. SeqSeg takes steps to grow the aortic segmentation out from the cardiac mesh. Displayed are the cardiac mesh (a), and final aortic segmentation (d) as well as two intermediate states (b,c).
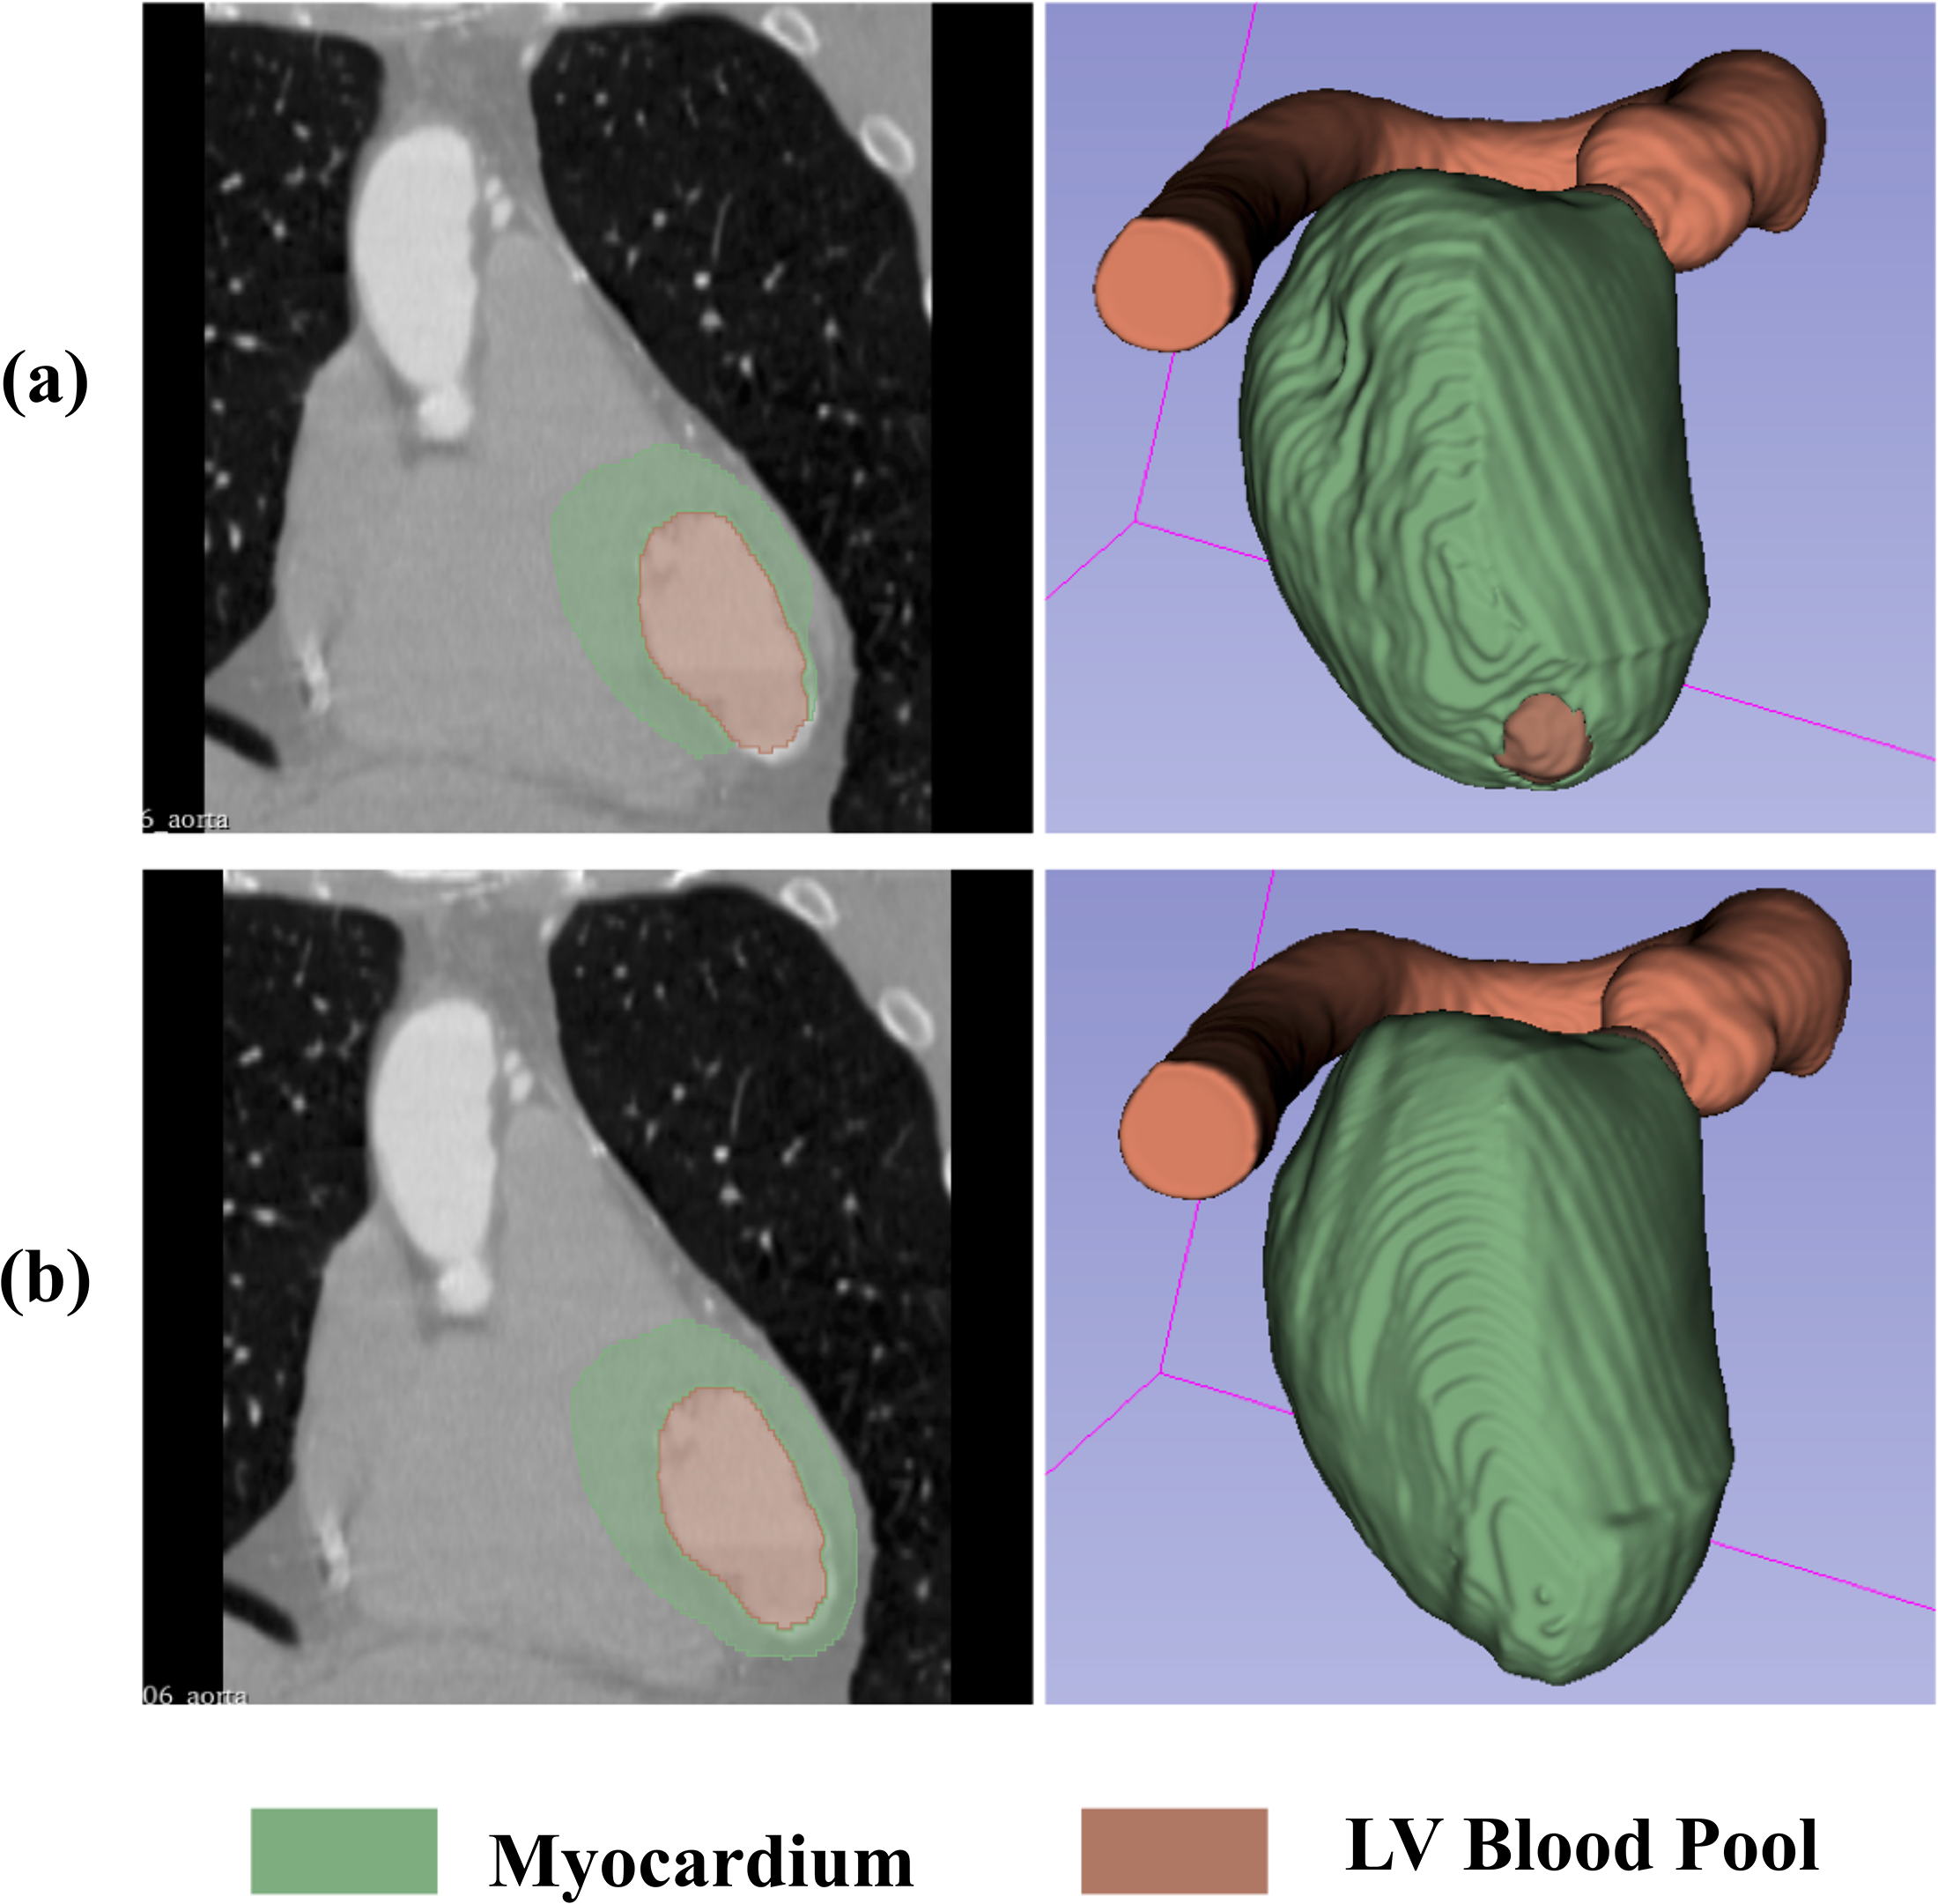
(a) Cardiac segmentations of case 5 (ID O34421) produced by TotalSegmentator contain a hole at the apex of the myocardium. (b) We manually fixed this segmentation for evaluation purposes.
Discussion
We presented a novel automatic cardiovascular model construction method. The method takes in a medical image scan of a patient as input and outputs a patient-specific three-dimensional simulation-ready mesh of the cardiac chambers and the aorta with defined inlets, outlets and aortic valve interface. This is, to our knowledge, the first combined automatic cardiac and vascular model construction method.
Two independent deep-learning-based modeling approaches for cardiac and vascular model construction were used. Both approaches require neural network training. We trained and tested the method on a dataset of CT image scans. We compared the predictions on held-out test datasets to the corresponding manually constructed 3D models. The cardiac chamber segmentations achieved, on average, Dice scores of
Inspired by the template-deformation approaches of Kong, Narayanan, and Shadden,14,15 we adopted the LinFlo-Net paradigm for predicting cardiac chambers. For predicting vasculature, however, the greater topological variability makes template deformation less suitable, so we instead used the step-based vessel-tracking approach of SeqSeg. In this work, we focused on modeling of aortic vasculature for LV-aortic simulations. In future work, we hope that SeqSeg can similarly be applied to modeling of the pulmonary arteries or other connected vasculature.
Because the downstream vascular structures originate from well-defined valve locations, tracking methods that require seed points, such as SeqSeg, become straightforward to deploy. Rather than searching the full image for vascular roots, seed points can be placed directly from the predicted cardiac model. As presented in Appendix Table 6, SeqSeg initialization is robust to seed size and placement, making initialization even simpler.
A primary limitation of this work is the size of the test dataset. No public dataset containing both cardiac and vascular ground truth models currently exists, which required us to build our own and constrained its scale. We hope this work will be expanded to the evaluation of additional image sets, and also the inclusion of other image types, namely MR. Further assessment of the robustness of SeqSeg’s automatic initialization is also needed, including experiments that incorporate segmentation errors. Lastly, future work could explore how these machine-learning-based modeling approaches affect downstream simulation results.
Conclusion
We present an automated method to construct three-dimensional geometric models of the heart and aortic vasculature from medical imaging. We hope this work can facilitate patient-specific cardiovascular simulation research and its further entry into clinical settings for patient care. Future directions can include investigating the effects of machine learning based automated model construction methods on simulation results as well as incorporating additional anatomical features, for example, pulmonary arteries, valve models, and veins.
Footnotes
Acknowledgments
The authors thank the members of the Shadden Lab at the University of California, Berkeley and the Cardiovascular Biomechanics Computation Lab at Stanford University for their support and valuable discussions.

Ethical approval
Contributor statement
NSC, AN, SCS conceptualized the study. NSC, AN developed the MeshGrow framework and conducted experiments. NSC, AN curated the datasets and performed validation. SCS supervised the project. FK generated mesh motion and conducted simulations. NSC, AN wrote the manuscript, SCS edited manuscript. NSC, SCS contributed to the interpretation of results. All authors approved the final version.
Funding
The authors disclosed receipt of the following financial support for the research, authorship, and/or publication of this article: This work was made possible by NSF Awards No. 1663747 and 2310910. Any opinions, findings, and conclusions or recommendations expressed in this material are those of the authors and do not necessarily reflect the views of the NSF.
Declaration of conflicting interests
The authors declared no potential conflicts of interest with respect to the research, authorship, and/or publication of this article.
Appendix
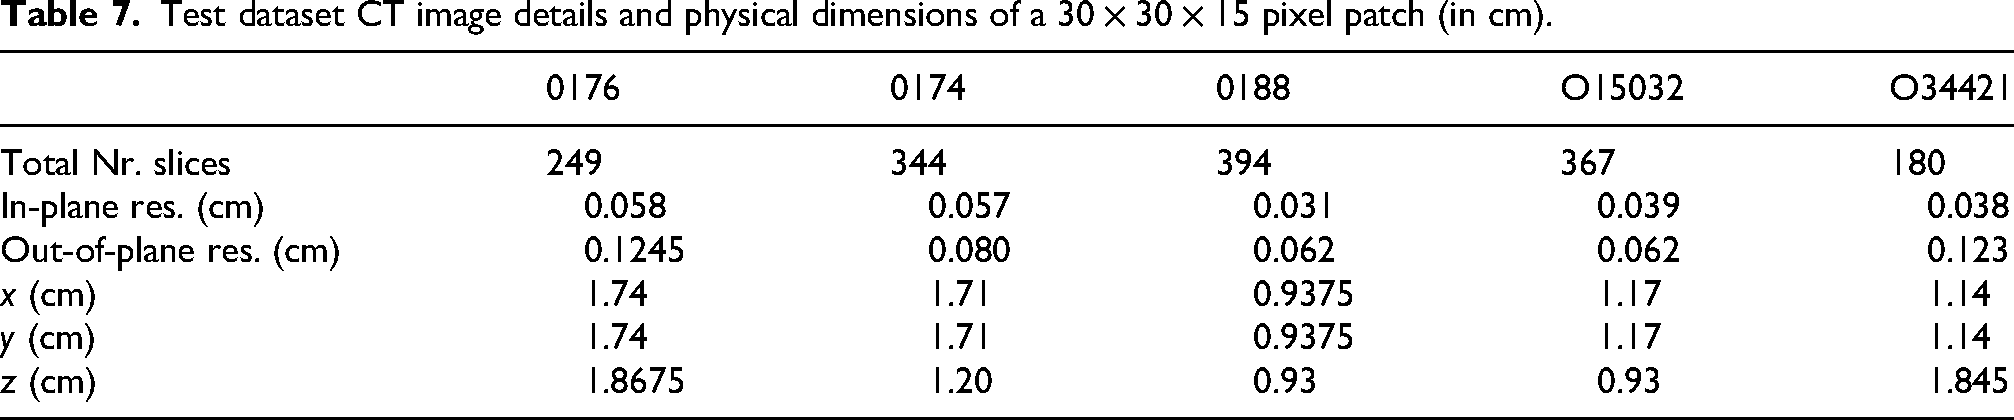
Test dataset CT image details and physical dimensions of a
| 0176 | 0174 | 0188 | O15032 | O34421 | |
|---|---|---|---|---|---|
| Total Nr. slices | 249 | 344 | 394 | 367 | 180 |
| In-plane res. (cm) | 0.058 | 0.057 | 0.031 | 0.039 | 0.038 |
| Out-of-plane res. (cm) | 0.1245 | 0.080 | 0.062 | 0.062 | 0.123 |
| (cm) | 1.74 | 1.71 | 0.9375 | 1.17 | 1.14 |
| (cm) | 1.74 | 1.71 | 0.9375 | 1.17 | 1.14 |
| (cm) | 1.8675 | 1.20 | 0.93 | 0.93 | 1.845 |