
Abstract
Background
Pressure pain threshold (PPT) testing is a widely used quantitative sensory testing method to assess mechanical pain sensitivity. While reference values for PPT at articular-/joint-related and osseous landmarks are available, data on measurement reliability remain limited. This study aimed to determine the intra- and inter-rater reliability of PPT measurements and to report the standard error of measurement (SEM) for joint PPT.
Methods
Healthy participants aged 18–40 years were included in a two-part study. In Part A (N = 40), intra-rater reliability was assessed through three repeated PPT measurements by the same examiner. In Part B (N = 40), inter-rater reliability was evaluated with two different examiners. PPT was measured at joints (elbow, knee, ankle) and reference landmarks (sternum, forehead) using a digital algometer. ICCs (2,k model) and SEM were calculated for each landmark.
Results
Intra-rater reliability was excellent at all landmarks (ICCs ≥ 0.926) except the elbow with a good reliability (ICC = 0.848). Inter-rater reliability was excellent at the sternum (ICC = 0.950) and good at the ankle, knee, elbow, and forehead (ICCs ≥ 0.813). SEM values varied across landmarks, with lowest values observed at reference landmarks sites (e.g., sternum and forehead). ICCs are similar between sexes.
Conclusions
PPT measurements at articular (joints) and bony reference landmarks show good to excellent reliability. These findings support the use of joint PPT in standardized pain sensitivity assessments and provide a basis for clinical and research applications. However, findings are limited to pain-free participants and should be replicated in broader populations.
Keywords
Introduction
Quantitative Sensory Testing (QST) is a standardized psychophysical method used to assess the function of the somatosensory system by applying controlled mechanical, thermal, or pressure stimuli to elicit sensory responses. 1 Among the QST test battery, pressure pain threshold (PPT) testing using pressure algometry is employed to evaluate mechanical pain sensitivity. PPT is defined as the minimum pressure at which a mechanical pressure stimulus is first perceived as painful, offering a semi-objective alternative to solely self-reported pain scales such as visual analogue scales (VAS) or numeric rating scales (NRS). It enables the characterization of localized and widespread hyper- or hypoalgesia relevant in various clinical pain conditions as well as research settings. 2 Pain scales such as the VAS or NRS can validly quantify perceived pain intensity when administered with appropriate instructions and anchors. 3 The combination of pain scales and PPT assessments may contribute to a more comprehensive assessment of pain sensitivity and pain perception. 4 Indeed, measurements of PPT are widely employed as a more objective method to quantify pain sensitivity in various pain-related disorders. 5 PPT can be described as a cost-effective and clinically feasible assessment outcome, characterized by properties (e.g., point of care device and time efficient) that facilitate its implementation in clinical settings for the evaluation and management of, for instance, musculoskeletal pain. 6 Its application as an outcome measure for evaluating the effectiveness of multi-week interventions in musculoskeletal pain conditions has been increasingly recognized.7,8 Furthermore, to evaluate the phenomenon of exercise induced hypoalgesia PPTs are usually utilized to measure pain sensitivity before and after an acute exercise session. 9
Recently, reference values were published for PPT measured at the ankle, knee, and elbow joint as well as further osseous reference landmarks (i.e., sternum and forehead) in healthy individuals. 10 However, the clinical and research application of these specific PPT data remains limited without corresponding information on measurement reliability and measurement error. Previous studies have demonstrated good to excellent PPT reliability in healthy participants and clinical populations, including, for instance, chronic low back pain and distal radius fracture cohorts.11–13 In addition, methodological work has shown that reliability estimates may depend on the number of repetitions and on how inter-session and inter-repetition variability are modeled.11,14 Although this body of literature provides important evidence for the reliability of PPT assessment in general, the transferability of these findings to joint-related landmarks is limited. PPT values have been shown to differ depending on tissue type and anatomical region, indicating that pressure pain sensitivity and measurement properties should be interpreted in a site-specific manner 15 and previous work on, for instance, joint-related sites such as the temporomandibular joint capsule further indicates the relevance of site-specific PPT assessment. 16 Consequently, reliability and measurement-error data derived from muscular landmarks cannot necessarily be generalized to articular or osseous landmarks. This is particularly relevant because joint-related structures are clinically important sources of nociceptive input in many musculoskeletal pain conditions.17–19 Moreover, articular and osseous landmarks may offer methodological advantages because they are often more superficially located than muscular landmarks, potentially allowing more direct mechanical stimulation of the intended anatomical site with less influence of overlying soft tissue.20,21 However, before applying such assessments in clinical populations, reliability should first be established under controlled conditions in pain-free individuals, where potential confounding by ongoing pain, pain sensitization, analgesic medication, structural joint pathology, or disease-related heterogeneity is minimized. Having reliable data on PPT for articular landmarks from a healthy population is essential because these sites are sources of nociceptive input in many musculoskeletal joint conditions.22,23
From a physiological standpoint, articular structures are mainly innervated by high-threshold Aδ as well as polymodal and TrkA + C-fibers concentrated in periosteum, synovium, ligaments, and fat pads, which can become sensitized by, for instance inflammation, acidosis, or nerve sprouting. In contrast, muscle tissue contains a wider range of nociceptors (i.e., mechanosensitive, mechano-heat, and polymodal C-fibers) often activated by ischemia or sustained load. Further, muscle tissue has a high stimulation threshold and is therefore not stimulated physiological movement, muscle stretch, or moderate compression. 24 Thus, articular PPTs can potentially reflect localized joint sensitization, whereas muscle PPTs are more influenced by metabolic stress and diffuse nociceptor activation. 2
This study therefore aims to provide data on intra- and inter-rater reliability of articular joint PPT measurements and to present data on standard error of measurement (SEM). Establishing both intra- and inter-rater reliability ensures that measurements are consistent across time and examiners, which is crucial for individual longitudinal monitoring and research standardization in diverse study designs. Furthermore, reporting the SEM provides clinicians and researchers with practical thresholds in the same units as the original measurement to distinguish true changes in pain sensitivity from deviations related to measurement error.
Methods
Study design
This study was conducted in two parts at the Department of Sports Medicine at the University of Wuppertal, Germany to assess the reliability of joint PPT measurements. Part A examined intra-rater reliability of healthy participants, each of whom was assessed three times by the same rater. Part B evaluated inter-rater reliability using a separate group of healthy participants, with measurements performed independently by two different raters. All raters were experienced research assistants holding a bachelor degree and received a minimum of 6 hours of the same standardized training in PPT assessment procedures prior to data collection. 25 To ensure consistency, all measurements were conducted at the same time of day for each participant. In both study parts, repeated measurements were separated by a minimum of 72 h to reduce the potential influence of temporal factors or sensitization effects. This study was conducted in accordance with the principles of good clinical and ethical practice and was approved by the local ethics commission. In accordance with the Declaration of Helsinki, all participants provided their written consent after being informed about the study protocol. The GRRAS checklist for reporting of studies of reliability and agreement was employed for this study. 26
Participants
For both study parts, the study sample comprised healthy and pain-free adults (convenience sample) recruited via word of mouth and flyers distributed at the local university as well as personal contacts. Inclusion criteria were an age between 18 and 40 years and engagement in a minimum of 150 min of physical activity per week 27 while not being a professional athlete. 28 Exclusion criteria included the presence of acute or chronic pain (NRS > 0), any form of joint disease or recent musculoskeletal injury, as well as regular use of analgesic medication or analgesic intake within 24 h prior to testing. This information was attained via a short structured verbal interview. Participants aged 18–40 years were deliberately selected to establish reliability estimates under controlled conditions in a young, pain-free adult sample. This age range was chosen to reduce heterogeneity related to age-associated differences in pressure pain sensitivity, degenerative joint changes, comorbidities, current pain, or medication use. Therefore, the present data should be interpreted as reliability estimates for young healthy adults and not as directly generalizable reference values for older adults or clinical populations with joint pathology. Participants were additionally instructed to refrain from vigorous physical activity for at least 24 h before each assessment session to avoid the potential effects related to exercise induced hypoalgesia.29,30
Pressure pain threshold assessment
For both study parts, the same standardized PPT assessments were performed. All PPT measurements were conducted using a standardized procedure as recently described in detail elsewhere. 10 A digital pressure algometer (FPX 25 Compact Digital Algometer, Wagner Instruments, Greenwich, CT, USA) with a 1 cm2 rubber tip was used to apply pressure to five predefined anatomical landmarks. These included the right elbow (lateral joint space below the lateral humeral epicondyle), right knee (midpoint of the medial joint space below the medial femoral epicondyle), right ankle (lateral joint space between the lateral malleolus and the talus bone), the sternum (2 cm above its lower edge, near the xiphoid process), and the forehead (1 cm above the midpoint of the right eyebrow, at the supraorbital margin). Pictures of the measurements are to be found elsewhere. 10 Prior to formal measurements, the procedure was explained in detail, and each participant completed at least one familiarization trial to minimize bias due to unfamiliarity with the stimulus. Before each trial, participants confirmed their readiness. They were instructed to verbally indicate (“stop”) when the applied pressure first became painful. Each landmark was measured three times using a circuit protocol, 31 meaning that all five landmarks were assessed once before the next measurement round started. This procedure resulted in an interval of at least 40 s between two consecutive measurements at the same landmark. Pressure was applied at a rate of 10 Newtons (N) per second as described before. 10 The order was randomized and the mean of the three measurements was used for analysis. Data are presented as N/cm2.
Statistical analysis
For all reliability analyses, untransformed PPT data were employed, as recommended, since this approach enables an adequate and easy interpretation of untransformed results in the unit of measurement. Besides, due to the robust nature of ANOVA-based intraclass correlation coefficient (ICC) analyses and the sufficiently large sample size, the primarily analyses are performed using the original data. 32 To assess the test-retest and inter-rater reliability of PPT of each landmark, ICCs were calculated. For both parts of the study, the ICC(2,k) model (two-way mixed-effects, absolute agreement, average measures) was used. 33 This was done for the entire population as well as stratified for male and female participants. ICC values are reported with 95% confidence intervals and can be interpreted as follows: < 0.50 = poor, 0.50–0.75 = moderate, 0.75–0.90 = good, and > 0.90 = excellent reliability. 34
The Standard Error of Measurement (SEM) was calculated using the formula: SEM = SD × √(1 – ICC), where SD is the mean standard deviation of measurements. This was performed for both parts of the study using the ICCs and SD of the respective study parts. In addition, the coefficient of variation (CV) was calculated as the standard deviation divided by the mean, expressed as a percentage, to assess the relative variability of the data.
Further, the Friedman test was used to explore whether PPT values were different between the three measurements performed during the intra-rater reliability testing. Besides, the Wilcoxon test was used to test for significant differences between measurements performed as part of the inter-rater reliability testing. In case of observed significant main effect, post-hoc tests with Bonferroni adjustment were performed. Data were analyzed using the statistical software IBM SPSS Statistics 29.0 and the p-value for significance was set at 0.05.
The sample size was calculated with an effect size based on two previous studies investigating the reliability of PPT that reported good to excellent reliability estimates (ICC >0.75).18,17 A minimum acceptable reliability for ICC (ρ0) of 0.4, an expected reliability for ICC (ρ1) of 0.75, a significance level of 0.05 and a power (1 – β) of 90% was employed for 2 raters/repetitions per subject (k). This resulted in a minimum sample size for reliability testing of N = 36. Hence, a minimum sample size of N = 40 was deemed to be appropriate to acknowledge a possible dropout rate of 10% for both parts of this study. 35
Results
For intra-rater reliability assessment, 40 participants (18 female, 22 male, age: 25.8 ± 3.4 yrs, weight: 74.6 ± 12.0 kg, height: 177.6 ± 8.6 cm, BMI: 23.5 ± 2.5) were successfully included. For inter-rater reliability assessment, 40 separate participants (18 female, 22 male, age: 27.7 ± 4.7 yrs, weight: 72.2 ± 12.1 kg, height: 175.6 ± 8.9 cm, BMI: 23.3 ± 2.6) were successfully included. No dropouts occurred and no adverse events of any kind were observed.
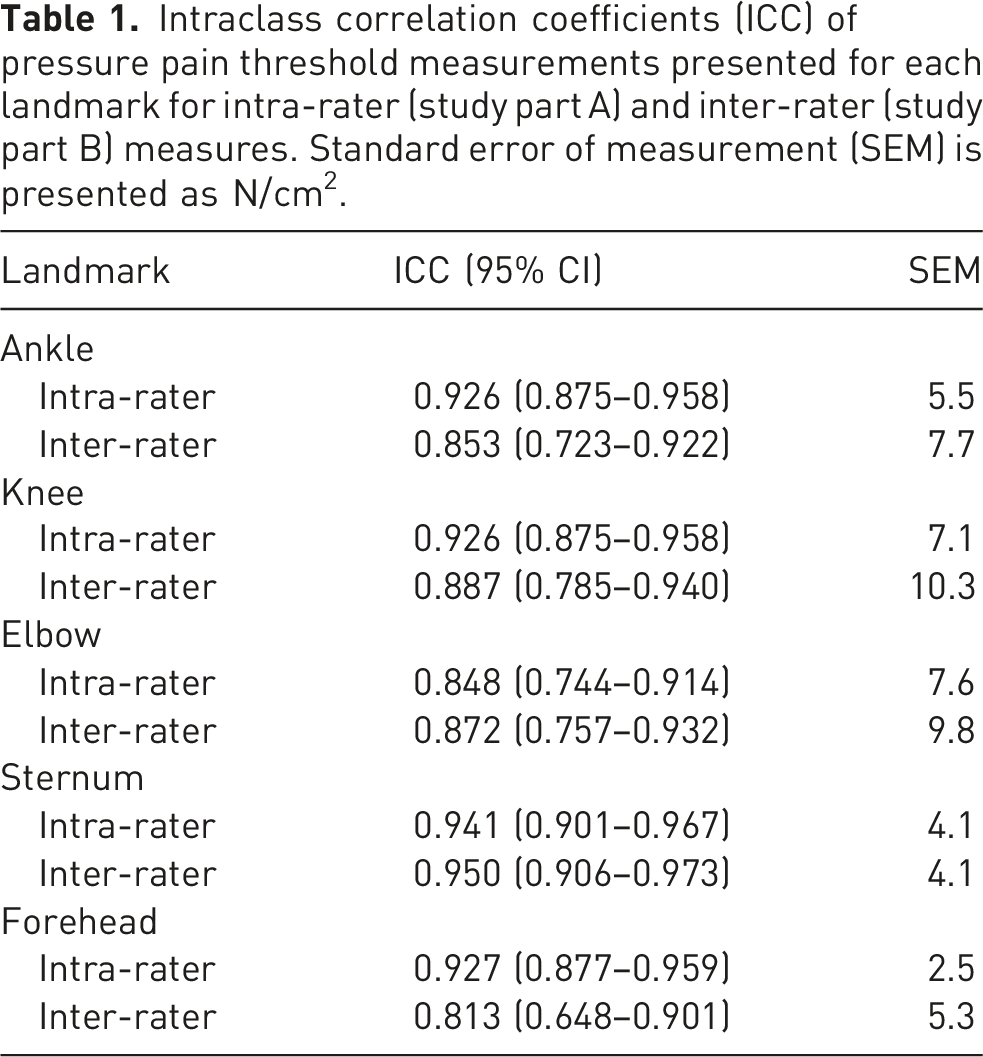
Intraclass correlation coefficients (ICC) of pressure pain threshold measurements presented for each landmark for intra-rater (study part A) and inter-rater (study part B) measures. Standard error of measurement (SEM) is presented as N/cm2.
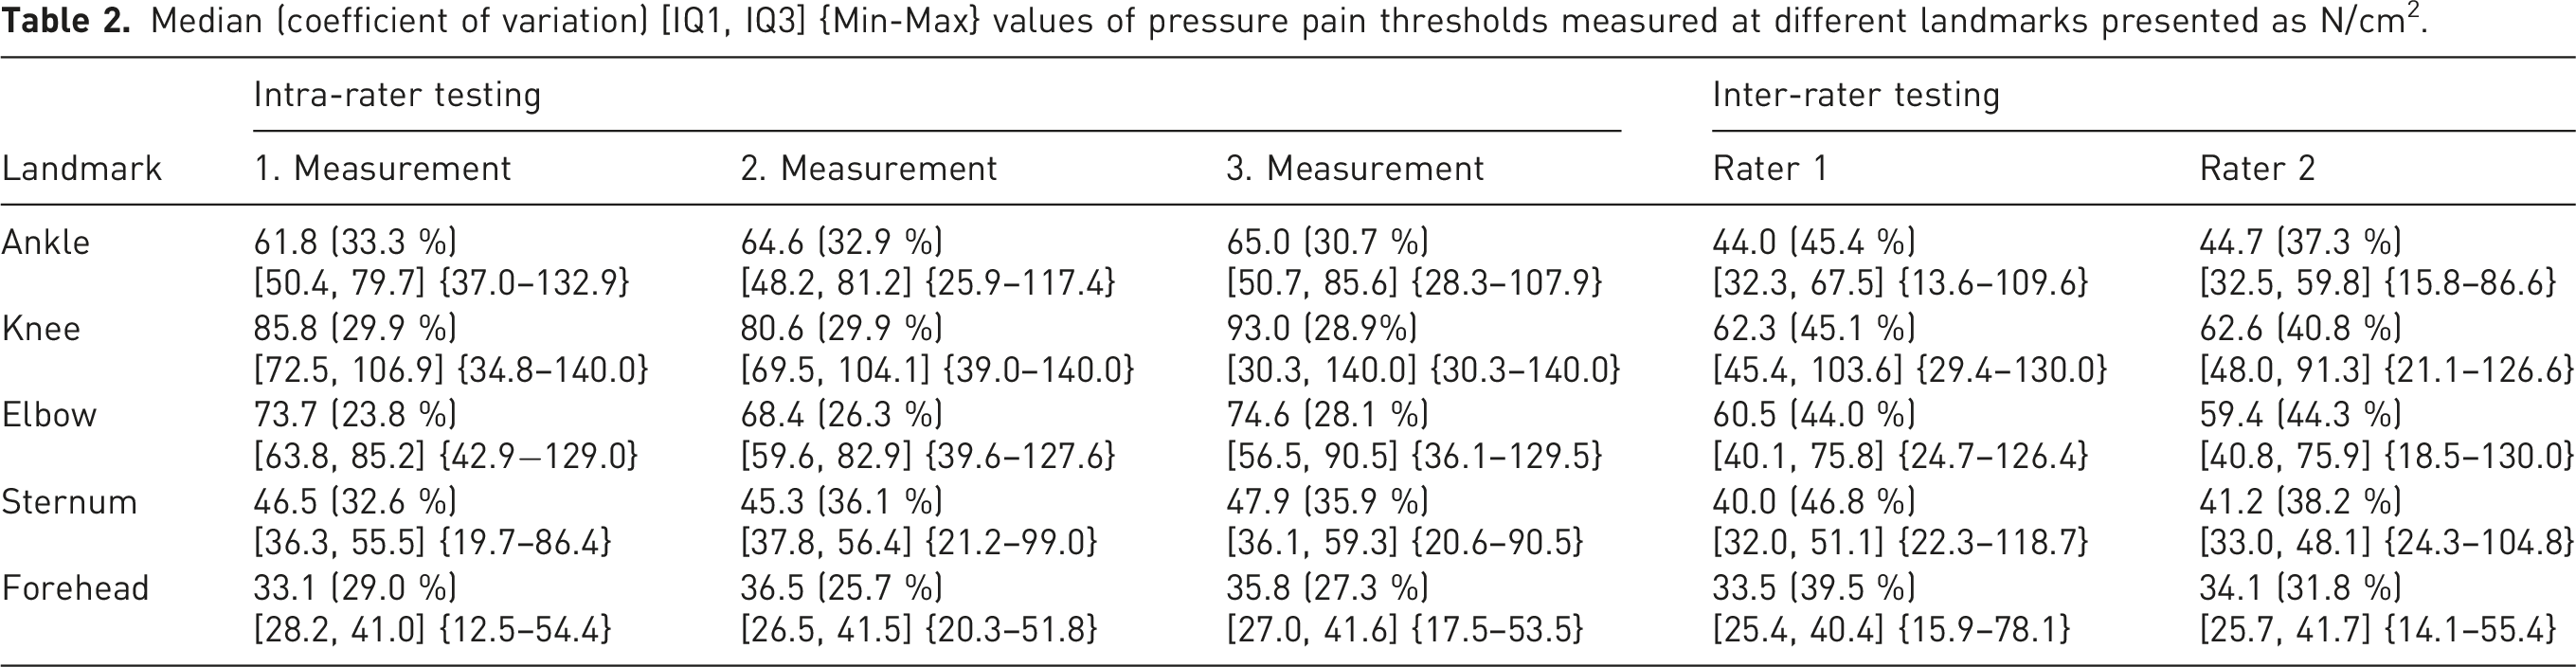
Median (coefficient of variation) [IQ1, IQ3] {Min-Max} values of pressure pain thresholds measured at different landmarks presented as N/cm2.
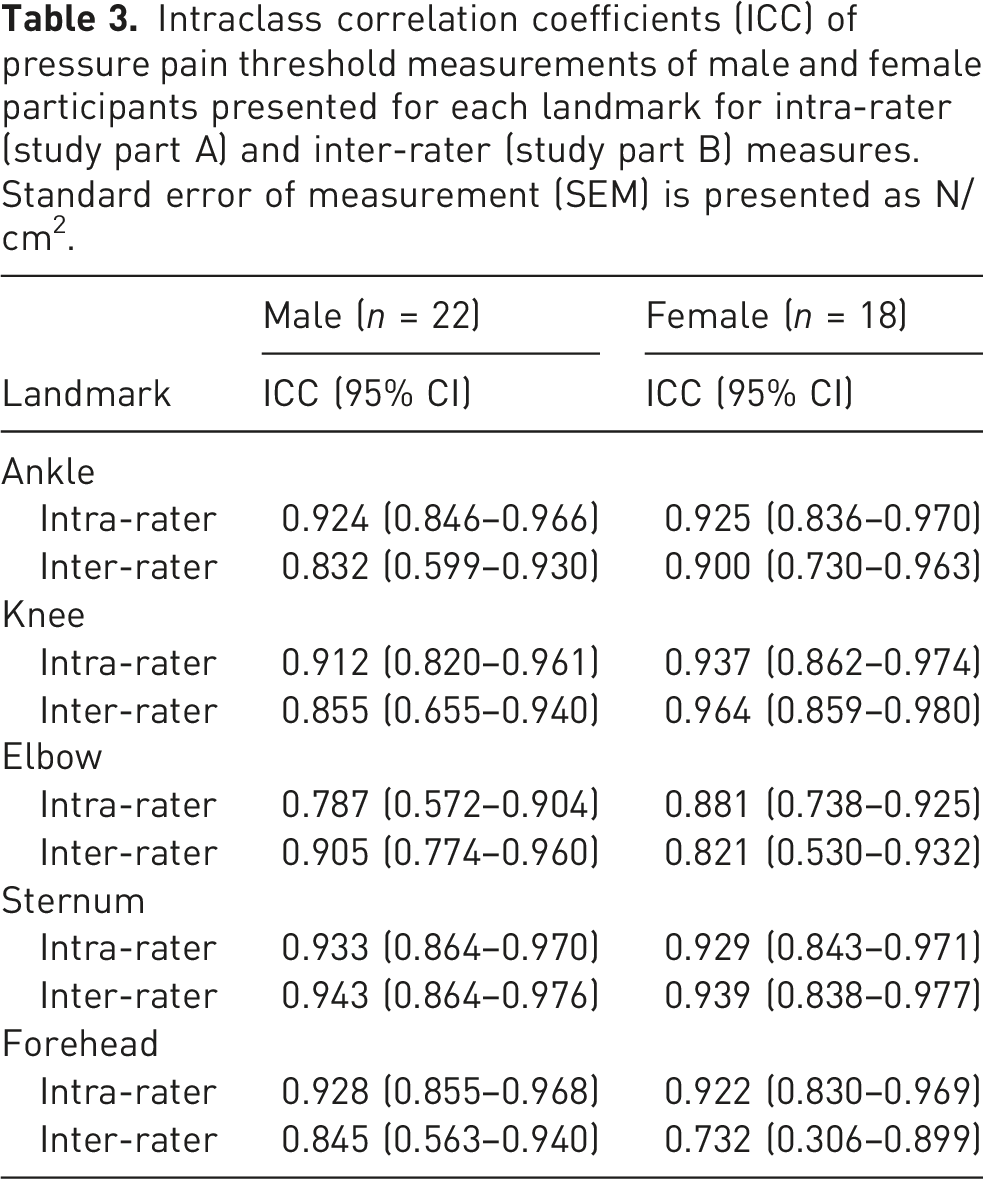
Intraclass correlation coefficients (ICC) of pressure pain threshold measurements of male and female participants presented for each landmark for intra-rater (study part A) and inter-rater (study part B) measures. Standard error of measurement (SEM) is presented as N/cm2.
Discussion
This study aimed to evaluate the intra- and inter-rater reliability of PPT measurements across joint and reference landmarks in a healthy population and to report the SEM. Overall, a good to excellent reliability was found for this PPT protocol. The results demonstrated excellent intra-rater reliability for all landmarks (ICCs ≥ 0.926) with the exception of the elbow, where a good reliability (ICC = 0.848) is found. Inter-rater ICCs show excellent reliability at the sternum (ICC = 0.950) and good reliability (ICCs = 0.813 − 0.887) at other measured landmarks. Besides, no statistically significant differences are observed between PPT values between individual measurements as part of the intra- as well as inter-rater reliability testing.
In more detail, intra-rater reliability was highest at the sternum (ICC = 0.941) while the lowest was observed at the elbow (ICC = 0.848). Inter-rater reliability was strongest at the sternum (ICC = 0.950), with the forehead showing the lowest inter-rater reliability (ICC = 0.813; see Table 1). These findings are consistent with previous literature demonstrating good to excellent reliability of PPTs in the healthy population and the present results are comparable to, for instance, the reliability results observed at the tibialis anterior muscle in 18 healthy participants with an observed intra-rater reliability of 0.96 and 0.92 (ICCs of two raters) and inter-rater reliability of 0.94 and 0.96 (ICCs of two time points). 17 Besides, similar high ICCs are observed for the upper trapezius muscle in a sample of 60 healthy participants. Here, intra-rater reliability was 0.97 and inter-rater-reliability was 0.89. 19 Also in healthy participants, mostly excellent within-session reliability was reported and showed that repeated PPT measurements reduced measurement error compared with single measurements. 11 This supports the use of repeated measurements and averaging in the present protocol.
In a clinical pain population, generally excellent within-session reliability was reported in individuals with chronic low back pain, although systematic test-retest differences were observed at the painful lower back region. 12 This indicates that reliability estimates may differ between pain-free and painful sites and supports the need to establish reliability data under controlled conditions in healthy adults. In addition, another study showed that reliability estimates may depend on how inter-session and inter-repetition variability are modeled, highlighting that ICC values should be interpreted in relation to the specific measurement protocol. 14 Clinical work in persons with conservatively managed wrist fractures further suggests that PPT can be reliably assessed in joint-related clinical conditions, although rater effects remain relevant and repeated assessments should preferably be performed by the same examiner when possible. 13 Recent evidence from older adults undergoing foot PPT testing also supports the need for site- and population-specific reliability data. 36 Therefore, the present study adds to the existing literature by providing intra- and inter-rater ICCs and SEM values for predefined articular and osseous landmarks using a specific measurement protocol in young healthy adults.
The SEM provides important context for interpreting measured PPT values since the same units as the original variable are presented. The SEM reflects the precision of the measurement (i.e., the expected error in a single measurement) without being affected by between-subject variability. 37 For example, while the sternum had a low SEM (4.1 N/cm2), the knee had a higher SEM (10.3 N/cm2) in the inter-rater testing, highlighting the increased variability at that site along with higher median values observed (see Table 2). However, SEM at the knee based on intra-rater reliability is lower (7.1 N/cm2). In general, the present results show that SEM values are lower based on the intra-rater reliability results. Given the manual nature of pressure algometry used in the present study, repeated clinical assessments should preferably be performed by the same rater to reduce rater-related variability. This is also supported by previous clinical work in persons with conservatively managed wrist fractures, where intra-rater reliability was more favorable than inter-rater reliability. 13 In another study on healthy participants, mean PPT values at the tibialis anterior of 82.2 and 75.5 N/cm2 were observed along with a SEM of 12.2 N/cm2. 17 Besides, a mean PPT of 25.2 N/cm2 (±10.2) at the upper trapezius was observed along with a SEM of 1.8 and 5.3 N/cm2 for intra- and inter-rater measurements, respectively. 19 These findings and comparisons highlight that anatomical site and methodology influence PPT measurement consistency. Therefore, landmark-specific reliability and measurement-error data are essential to provide a basis for reliable and precise assessments as well as accurate interpretation. The interpretation of SEM also depends on the underlying PPT magnitude and a larger SEM is still to be interpreted as acceptable with high mean or median PPT values. In the present analysis, the CV values ranged from 23.8 % to 36.1 % for intra-rater testing and from 31.8 % to 46.8 % for inter-rater testing, indicating moderate to high relative variability. Such comparatively high CVs are, however, common in PPT testing, as reported in previous research on PPT testing. For instance, CV values of up to 62.7 % are observed depending on the landmark measured. 38 These values suggest that, although measurement reliability is generally high to excellent, notable variability might remain between raters, underscoring the importance of standardized protocols and examiner training in PPT assessments.
The sex-stratified findings (see Table 3) further suggest broadly comparable reliability between male and female participants, although these subgroup analyses were exploratory and not powered to detect small sex-specific differences.
The major strength of the present study is that PPT of joint and reference landmarks were tested for both intra- and inter-rater reliability in a sample based on a sample size calculation including both sexes. The results build on the recently published reference values for these landmarks 10 and together, these two studies provide a solid basis for the use of these PPT measurements for future clinical and research use. However, there are some limitations that should be mentioned to adequately interpret the results presented. The sample comprised only healthy, pain-free, physically active male and female adults aged 18–40 years, which limits the generalizability of the findings to older adults, highly sedentary individuals, and clinical populations with acute or chronic pain conditions. Moreover, although the total sample size was calculated a priori and was considered adequate for the primary reliability analyses, the study was not powered to detect small subgroup effects. Therefore, the sex-stratified ICC analyses should be interpreted as exploratory and descriptive rather than as confirmatory evidence for or against sex-specific differences in PPT reliability. Further, although intra- and inter-rater reliability were assessed across repeated sessions separated by at least 72 h, the study design did not evaluate long-term measurement stability over extended time periods, which would be relevant for longitudinal monitoring in clinical or research settings. No information regarding contraceptive use, phase of the menstrual cycle, or further pain associated phenomena associated with the menstrual cycle (e.g., dysmenorrhea or recurrent menstrual pain 39 ) was obtained in female participants. Yet, all participants indicated a subjective pain intensity of 0 making it unlikely that such pain states were present in female participants of this study. In addition, potential short-term influences on pain perception, such as alcohol or nicotine consumption prior to testing, were not systematically recorded. Although participants were instructed to avoid vigorous physical activity and analgesic medication before testing, these additional factors may have contributed to interindividual variability in PPT values. Lastly, body composition and local subcutaneous tissue thickness were not assessed. This should be acknowledged because experimental and modeling data indicate that overlying adipose tissue might influence stress and strain transmission during pressure algometry, particularly when deeper soft tissues such as muscle are targeted. 21 However, the use of articular and osseous landmarks may also be regarded as a methodological strength of the present protocol. Due to the superficial anatomical location of the selected joint-related and bony landmarks, the influence of overlying subcutaneous adipose tissue is likely lower than at many muscular landmarks, where the target tissue is commonly covered by more soft tissue. 20 This may allow comparatively direct and standardized mechanical stimulation of the intended anatomical site, although future studies should verify this by assessing local tissue thickness and by including soft-tissue comparison landmarks since such soft-tissue landmarks were not considered in the present study.
Conclusion
This study demonstrates good to excellent intra- and inter-rater reliability of PPT measurements at articular and osseous reference landmarks in healthy male and female individuals. The presentation of SEM values enhances the use of these measures by defining thresholds for detecting changes beyond measurement error. These findings support the use of joint PPT in standardized pain sensitivity assessments and provide a basis for clinical and research applications. However, results are limited to healthy, pain-free participants of both sexes, and future research should confirm these findings in clinical populations.
Footnotes
Acknowledgments
The authors would like to thank Nina Simonis, Lina Schmidt, and Isabella Knapp for their support in this study.
Ethical considerations
Ethical approval for both study parts was obtained by the ethics committee of the University of Wuppertal (MS/AE 220811, SK/AE 240803, MS/AE 220203, MS/BBL 190517).
Consent to participate
All participants provided written informed consent to participate in this study.
Author contributions
FT wrote the manuscript, performed statistical analyses, performed data curation, was responsible for data acquisition, and had the idea of the study. TH revised the manuscript, supervised the study, and had the idea of the study.
Funding
The authors received no financial support for the research, authorship, and/or publication of this article.
Declaration of conflicting interests
The authors declared no potential conflicts of interest with respect to the research, authorship, and/or publication of this article.
Data Availability Statement
The data that support the findings of this study are available from the corresponding author upon reasonable request.