
Abstract
Background:
Adequate micronutrient absorption remains key for tuberculosis control.
Objective:
To evaluate the frequency of vitamin D receptor polymorphisms, FokI, TaqI, and BsmI, and their relationship with total vitamin D and cathelicidin levels in patients with pulmonary tuberculosis (PTB) and healthy controls (HC) in the province of Colon, Panama.
Design:
Pilot cross-sectional study, PTB (n = 80) and HC (n = 50).
Methods:
We measured total vitamin D (25-OH-vitamin D, 25(OH)D) and cathelicidin (LL-37) levels by enzyme-linked immunosorbent assays and analyzed vitamin D receptor (VDR) polymorphisms by PCR-RFLP. We compared the total 25(OH)D and cathelicidin levels across participant demographics and explored the associations with vitamin D receptor polymorphisms.
Results:
We observed no significant difference in vitamin D levels between PTB and HC (median (IQR) = 36.6 (27.6–48.7) ng/mL and 32.5 (18–46.3) ng/mL, respectively, p = 0.067). In terms of sex, vitamin D levels in women were higher in the PTB group compared to HC (median (IQR) = 33.9 (26.8–48.1) versus 19.5 (11.8–33.4) ng/mL, p = 0.002). Regarding LL-37, PTB unemployed participants showed higher levels compared to HC (median (IQR) = 59.4 (42.4–79.3) versus 28.2 (13.9–42.8) ng/mL, p = 0.048), as well as Hispanic PTBs (59.6 (48.2–71.41) versus 38.9 (19.5–49.2) ng/mL, p = 0.014). As for the treatment phase, vitamin D levels in PTB within 1 month of treatment were higher than HC (median (IQR) = 39.9 (28.5–50.51) versus 32.5 (18–46.3) ng/mL, p = 0.06). When stratifying by sex, these differences were observed only in women (median (IQR) = 41.4 (27.9–55.5) versus 19.5 (11.8–33.4) ng/mL for PTB and HC, respectively; p = 0.01). A statistically significant association was observed between the BsmI VDR polymorphism and serum 25-hydroxyvitamin D levels, with a significant difference between PTB and HC (p = 0.004).
Conclusion:
The observed associations between VDR polymorphisms, vitamin D levels, and cathelicidin levels highlight the need for further studies to clarify the role of host genetic and sociodemographic factors in pulmonary tuberculosis susceptibility and immune response.
Plain language summary
Vitamin D is a micronutrient of vital importance in many functions of the body, especially in the immune system as it enables the body to cope with infectious diseases such as tuberculosis (TB). Vitamin D is processed differently in people due to socio-economic conditions and due to variations in their genes, especially in the vitamin D receptor (VDR) region. In this research, we worked with patients with pulmonary tuberculosis (PTB) and healthy control (HC) in the province of Colon, Panama, We analyzed three gene variants in the vitamin D receptor: FokI, TaqI and BsmI. We measured the levels of vitamin D and cathelicidin. We were able to identify that PTB had slightly higher vitamin D values than HC, especially in PTB who were in their first month of treatment. In other words, vitamin D levels increased in PTB during anti-TB treatment, but returned to normal by month six. In reference to gender, women PTB had higher vitamin D levels than HC women. In relation to ethnicity, PTB Hispanics had the lowest vitamin D levels to HC Afro-descendant with a statistically significant difference. According to genetic analysis, BsmI gene (BB genotype) of PTB showed lower vitamin D levels respect to rest gene. These findings suggest that the VDR BsmI BB genotype may influence to vitamin D levels again to the tuberculosis. Pilot studies show that genetic variability can generate changes in vitamin D levels in the face of tuberculosis. We recommend extending the studies to other settingof the populations, correlating sex, ethnicity, month of treatment and other variables.
Background
According to the World Health Organization (WHO) in 2023, 1.5 million people died of tuberculosis (TB), 1 being the 13th leading cause of death worldwide and the second leading cause of infectious disease death after COVID-19. Despite its economic growth, Panama has reported a high mortality rate of 3.9 per 100,000 inhabitants in 2023, compared to other Central American countries. 2 In 2024, a total of 2353 TB cases were reported nationwide, with the WHO estimating a rate of 63 TB cases per 100,000 inhabitants, and the province of Panama (urban setting) had the highest number of TB cases.3,4 Previous reports have inversely associated vitamin D with the risk of tuberculosis,5,6 probably due to the role of vitamin D signaling in the stimulation of innate immune responses to the threat of pathogens, including Mycobacterium tuberculosis. 7 It has also been identified that nutritional deficiency negatively affects cellular immunity. 4 Thus, nutritional support to enhance the performance of anti-TB therapy ensures a favorable outcome. 4
Vitamin D is a lipophilic, steroidal molecule derived from 7-dehydrocholesterol (7-DHC). It is also considered a pro-hormone because it requires modification to achieve biological activity.8,9 In the skin, 7-DHC is converted to 25(OH)D3 (cholecalciferol) and transported to the liver for its first hydroxylation, into calcidiol, the main circulating form. A second hydroxylation occurs in the kidney by the enzyme 1α-hydroxylase, transforming it into 1,25(OH)2D3, also known as calcitriol, the biologically active form of vitamin D. When coupled to the vitamin D receptor (VDR), calcitriol can trigger an immune response against M. tuberculosis10,11 by: (1) activating monocytes and lymphocytes, and (2) inducing the production of human antimicrobial peptides (AMPs) to respond to the disease.12,13
Cathelicidin (LL-37) is a human antimicrobial peptide derived from the hCAP-18 precursor protein encoded by the CAMP gene. 14 During M. tuberculosis recognition by Toll-like receptors (TLR1/2), the calcitriol–VDR complex translocates into the nucleus and binds to VDR elements. Altogether activate promoters of the CAMP gene encoding the hCAP-18 protein. 15 This hCAP-18 is processed by the enzyme proteinase 3, leading to the release of cathelicidin, which in turn binds to the membrane of M. tuberculosis, forming pores. The cathelicidin also aids in phagosome maturation by inducing autophagy—a critical process for destroying M. tuberculosis. 16
Genetic variability between populations, especially in the VDR gene, can modulate the cellular response to calcitriol. 17 Different studies have shown that single-nucleotide polymorphisms (SNPs) in the VDR genes FokI, TaqI, and BsmI may act as biomarkers for pulmonary tuberculosis.18–20 Other studies suggest that mutant alleles in the VDR region may be associated with higher or lower VDR mRNA expression, which could also affect protein function. 21 Additionally, in the absence of cathelicidin, vitamin D would have no protective effect against MTB. Thus, higher levels of vitamin D would help to positively regulate the LL-37 expression in macrophages. Hence, the vitamin D and cathelicidin mechanism is key for strengthening the innate immune system and containing the infection. 22 As a result, VDR SNPs and their relationship to vitamin D in tuberculosis are areas of interest for research.
Panama has no evidence on vitamin D or cathelicidin levels in PTB as a genetic factor related to the VDR polymorphism. Therefore, this cross-sectional study aims to evaluate the frequency and role of FokI, TaqI, and BsmI polymorphisms in healthy and tuberculosis-affected populations in the province of Colon, Panama, and assess their association with vitamin D and cathelicidin levels.
Experimental section
Study design
This pilot cross-sectional study was conducted prospectively with recruitment and data collection from June 2022 to December 2023 in Colon, Panama. The Bioethics Committee of the University of Santander-Panama approved the study protocol and the informed consent form for participants (CBI-USantander-M-041-2022- P203). The final sample size is 130 participants (Figure 1). These included 80 pulmonary tuberculosis patients (PTB) and 50 healthy controls (HC). This amount was primarily determined by the total number of PTB reported in the province of Colon during 2021 (n = 89), representing approximately 90% coverage of the affected population that year. A power analysis was conducted using a PTB–HC framework, assuming an expected odds ratio of 3.5 and an HC exposure proportion of 11%, based on a previous similar study. 5 Under these assumptions and considering the observed PTB-to-HC ratio, the achieved sample size provided an estimated statistical power of approximately 72%, which is regarded as acceptable for observational epidemiological studies. The final sample size reflects a balance between statistical considerations, feasibility, and representativeness of the local population.
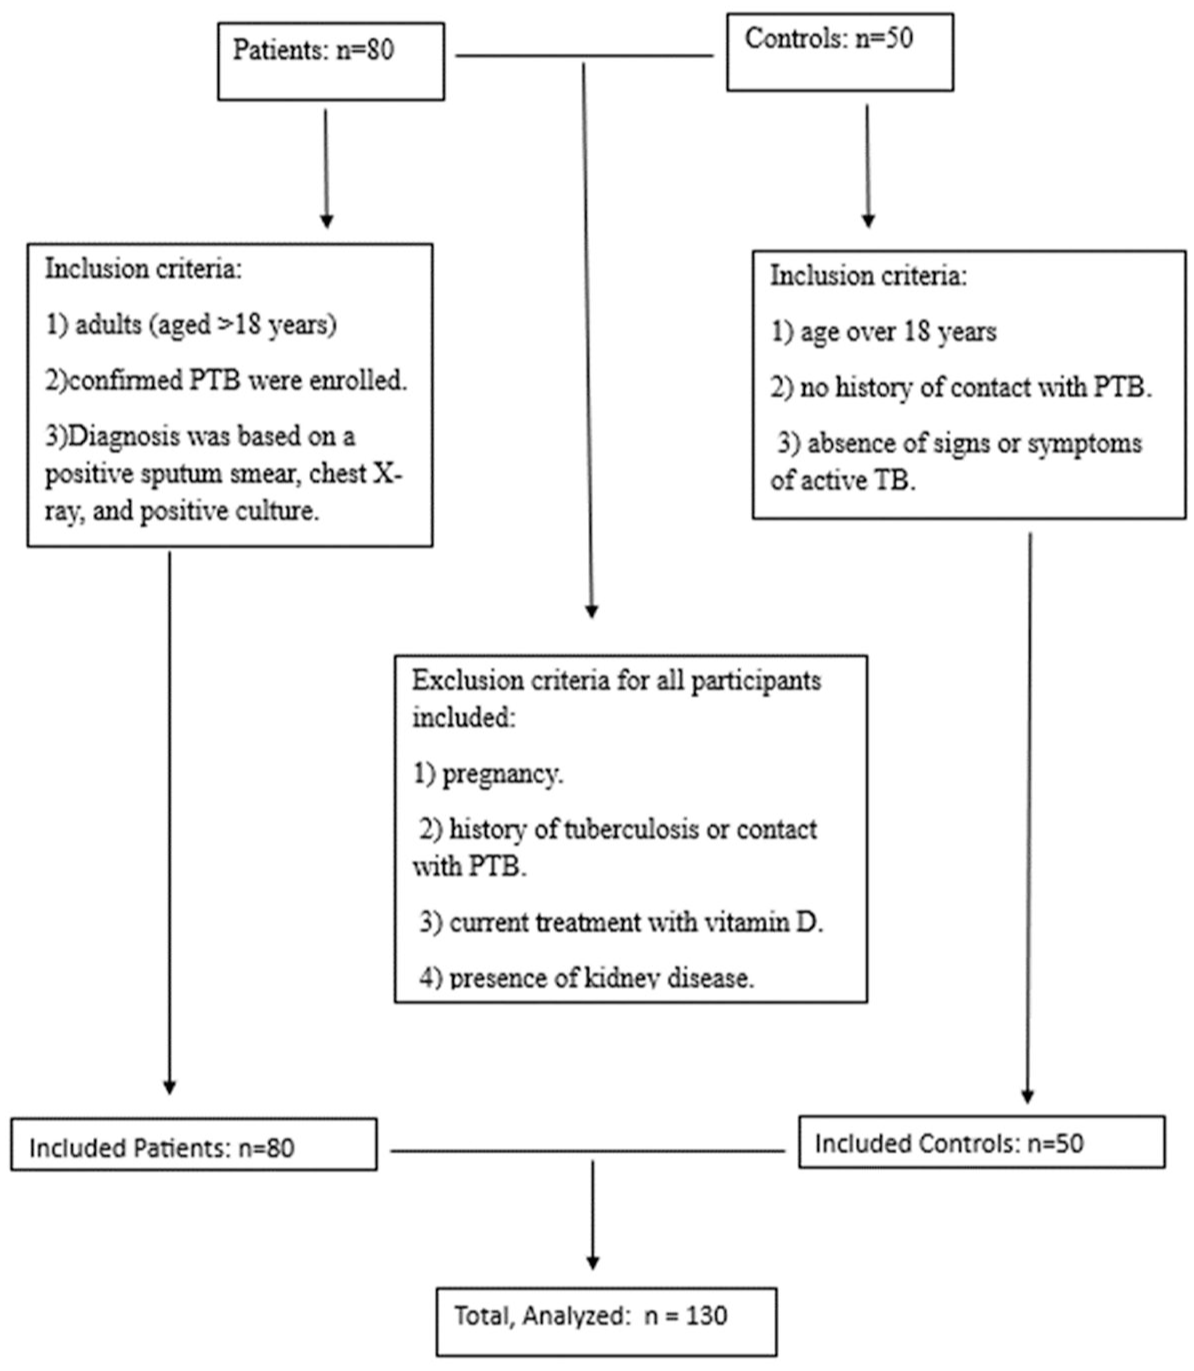
STROBE flow diagram.
Participants were recruited from the Manuel Amador Guerrero Hospital, the Hugo Spadafora, Sabanitas, and Patricia Duncan primary care centers. A total of 80 adults (aged > 18 years) with confirmed PTB were enrolled. Diagnosis was based on a positive sputum smear, chest X-ray, and positive culture. Only two PTB were reported as HIV positive. Only three PTB reported taking multivitamin supplements containing vitamin D, but they did not know the dosage. None of the PTB reported being prescribed vitamin D in conjunction with their anti-tuberculosis treatment. PTB were recruited when they began anti-tuberculosis treatment, and each participant provided a single sample.
Additionally, 50 HC were recruited from the blood bank of the Manuel Amador Guerrero Hospital. The HC blood samples were collected between June 2022 and December 2023. Panama does not have distinct summer and winter seasons; thus, solar radiation remains nearly constant with very little variation throughout the entire country, as described by Becker in 1987. 23 Inclusion criteria for HC included: (1) age over 18 years, (2) no history of contact with PTB, and (3) absence of signs or symptoms of active TB. Exclusion criteria for all participants included: (1) pregnancy, (2) history of tuberculosis or contact with PTB, (3) current treatment with vitamin D, and (4) presence of kidney disease. Sociodemographic data were collected from all participants, including age, sex, ethnicity and occupation. All participants were provided with information about the study, the procedures, and potential risks. We gave them time to review the information and ask questions so they could make an informed decision. All participants understood the study and provided their written informed consent before participating in the study. We followed the Strengthening the Reporting of Observational Studies in Epidemiology (STROBE) guidelines for reporting this study.
Sample collection
A total of 5 mL of blood was drawn from each participant using additive-free collection tubes. The tube was centrifuged at 1500 rpm for 5 min, and the serum was transferred to a new additive-free collection tube. Both tubes were stored at −80°C until use, and deoxyribonucleic acid was extracted from 300 μL of blood using the NucleoSpin Tissue kit (GmbH & Co. KG, Machery-Nagel, Düren, Germany).
Quantification of 25-hydroxy-vitamin D
To quantify total 25(OH)D, 25 μL of serum previously extracted from each study participant was used. We used the enzyme-linked immunosorbent assay (ELISA) kit (IBL International GmbH, Hamburg, Germany) according to the manufacturer’s instructions. Optical density (OD) was measured spectrophotometrically at 450 ± 2 nm, and the 25(OH)D concentration was calculated by comparing the OD to the standard calibration curve. We used the Endocrine Society’s classification as a reference for 25(OH)D levels: deficiency (<20 ng/mL), insufficiency (21–29 ng/mL), and sufficiency (⩾30 ng/mL) toxicity (>150 ng/mL). 24
Cathelicidin (LL-37) quantification
We used 100 μL of serum extracted from each study participant. Cathelicidin levels were measured using an ELISA kit (Novus Biologicals, a Biotechne Brand, Europe) following the manufacturer’s instructions. This kit has a sensitivity of 0.94 ng/mL and a detection range of 1.56–100 ng/mL. This kit specifically recognizes human LL-37 without cross-reactivity. The OD is proportional to the concentration of human LL-37, measured spectrophotometrically at 450 ± 2 nm, and the concentration of LL-37 in the samples was calculated by comparing the OD to the standard calibration curve.
Genotyping of VDR Fok1, Taq1, and Bsm1 polymorphisms
VDR gene polymorphisms were identified by polymerase chain reaction-restriction fragment length polymorphism (PCR-RFLP). Each PCR reaction contained 2 μL of each primer (FokI, TaqI, and BsmI), 10 μL of Master Mix, 9 μL of nuclease-free water, and 2 μL of DNA for a total of 25 μL per reaction. We used primer sequences described previously by Wilkinson et al. 25 Cycling conditions were 94°C for 4 min for all reactions, followed by 35 cycles at 94°C for 30 s, 65°C for 30 s, 65°C for 30 s, 72°C for 45 s, 72°C for 5 min, (FokI); 35 cycles at 94°C for 5 min, 94°C for 30 s, 68°C for 30 s, 72°C for 72°C for 30 s, 72°C for 10 min (TaqI); or 35 cycles at 94°C for 3 min, 94°C for 45 s, 62°C for 45 s, 72°C for 1 min, 72°C for 10 min (BsmI). PCR products were digested for 3 h with restriction endonucleases under the following conditions: 17 μL of nuclease-free water, 2 μL of 10XfastDigest, 10 μL of PCR product, and 1 μL of fast digest enzyme. The product was visualized using 3.5% agarose gel electrophoresis25,26 (Figures 2 and 3). To confirm genotyping accuracy, partial samples were sequenced with forward and reverse primers (Macrogen Inc., Seoul, South Korea; Supplemental Material). Common SNPs in the VDR gene, such as FokI and Bsml, were analyzed for their associations with tuberculosis risk.
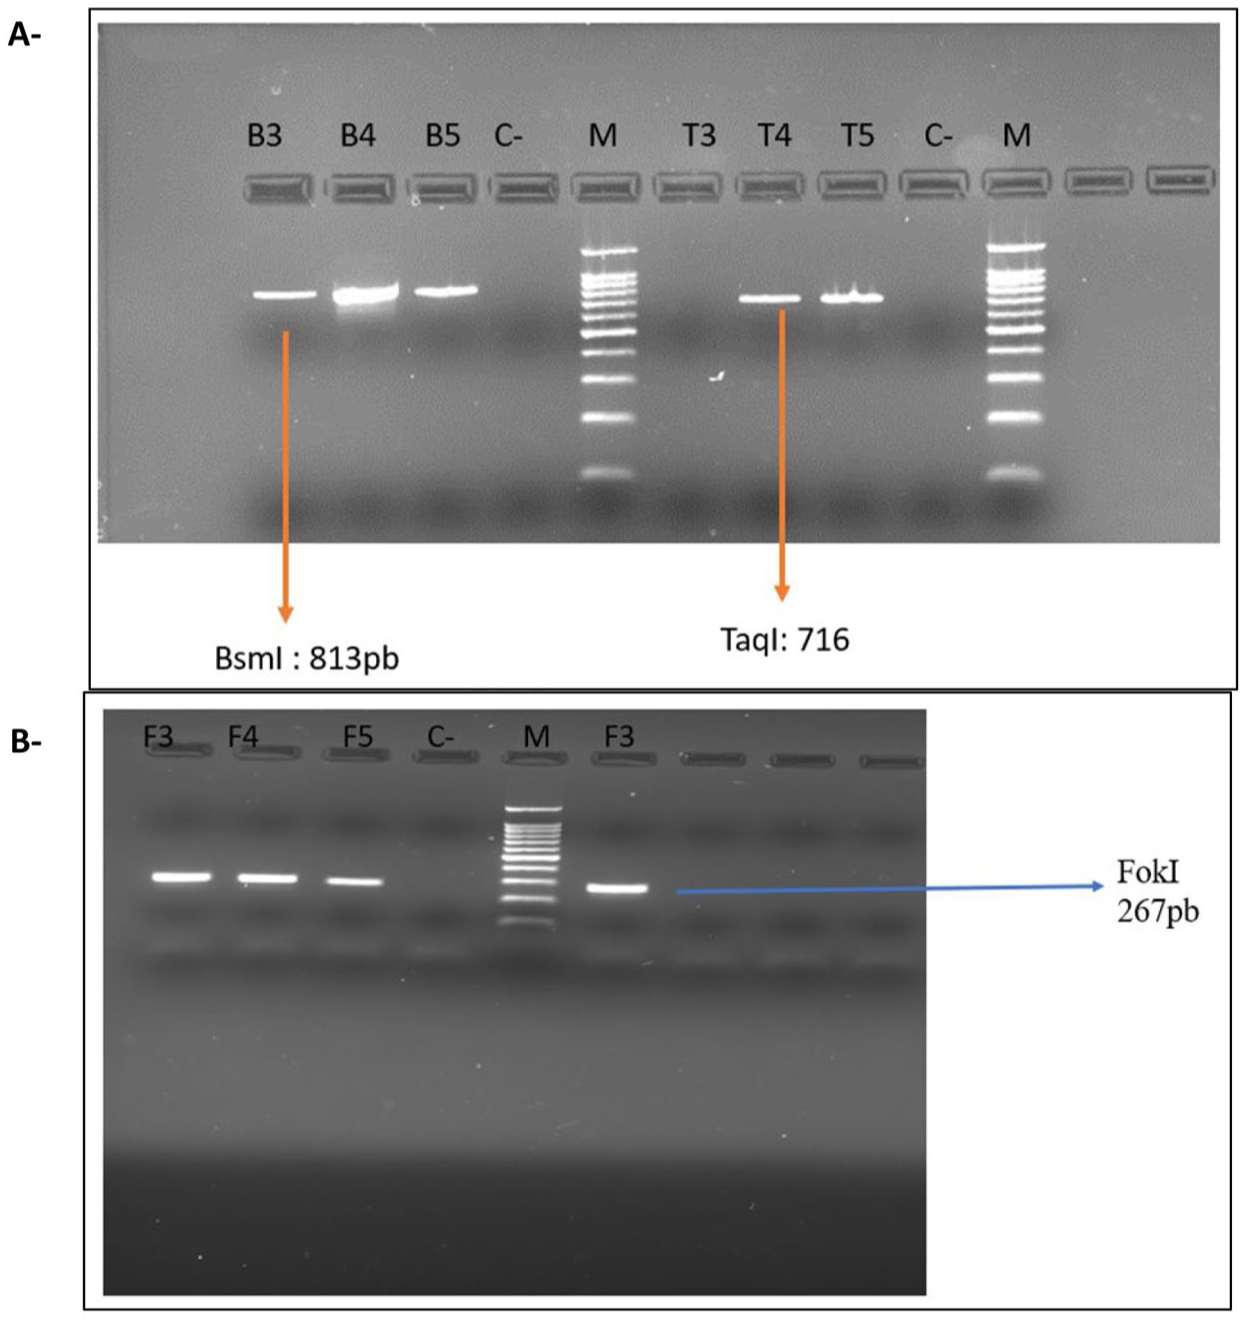
Standardization of PCR amplification of BsmI, TaqI, and FokI fragments. Electrophoresis gel at 2.5% and 80 volts. (a) B3–B5 = products of BsmI amplification, T3–T5 = products of TaqI amplification. (b) F3–F5 = products of FokI amplification. The gels were developed on a ChemiDoc device. Model: ImagingSystem MP, Brand: BioRad. Serial Number: 734BR5159. Version: 3.0.1.14.
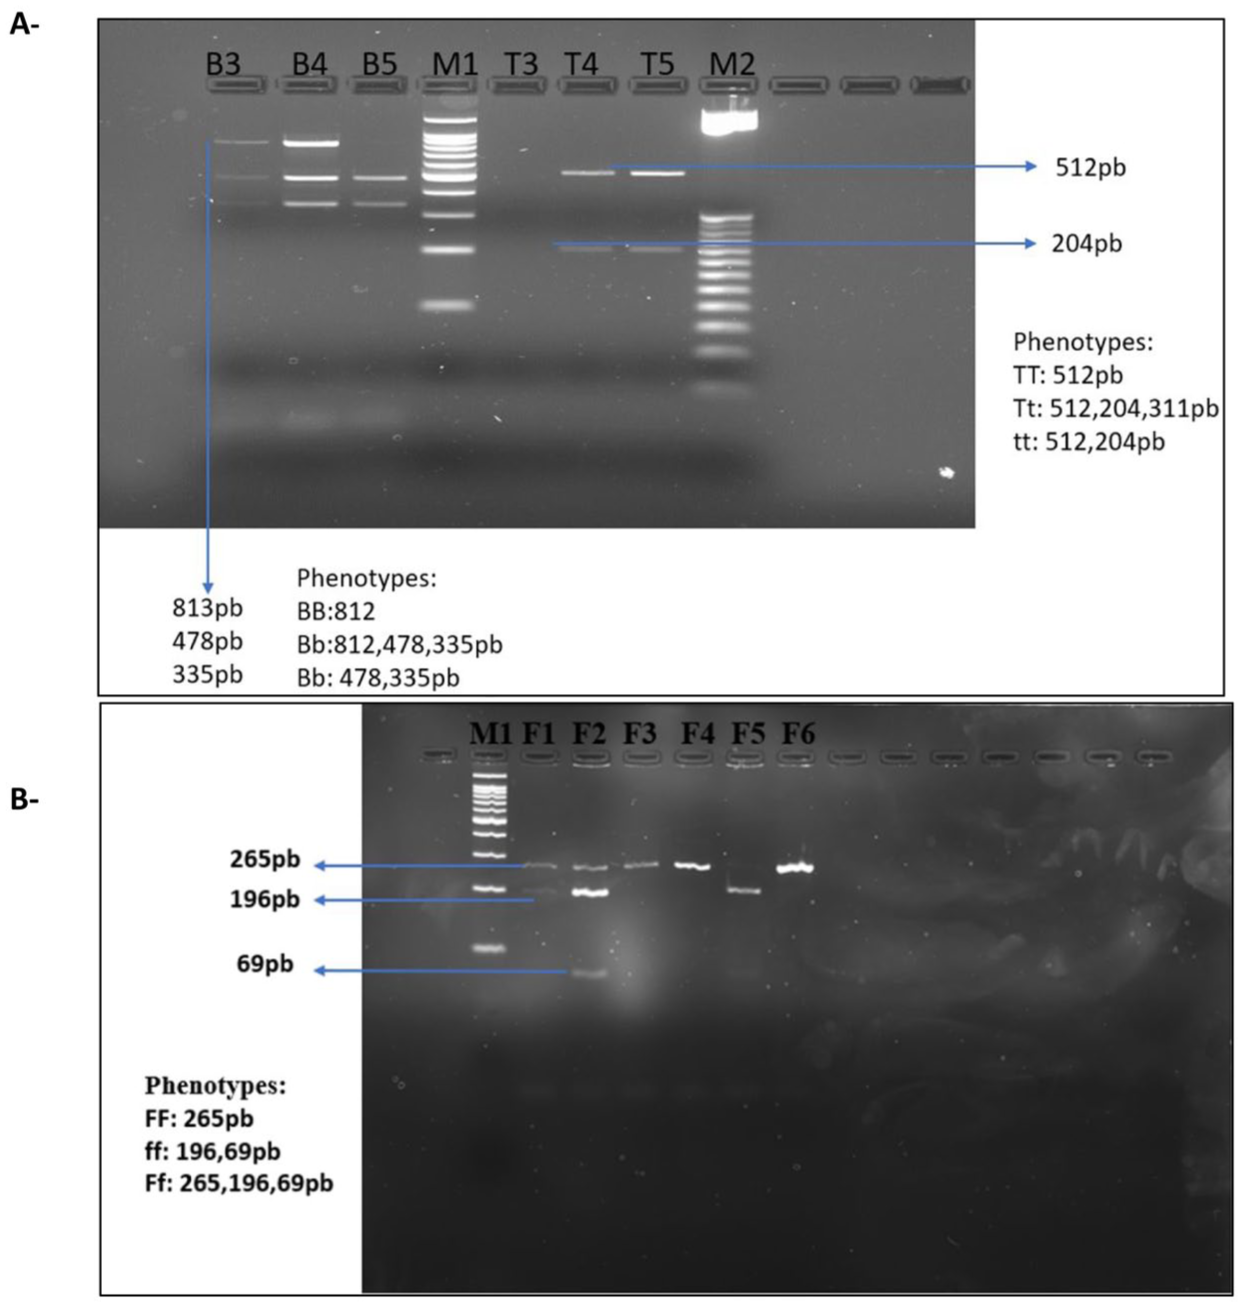
Standardization of fragment amplification by enzymatic digestion using FokI, TaqI, and BsmI digestion enzymes. Electrophoresis gel at 3.5% and 80 volts. (a) M1 and M2 = Molecular weight marker, B1–B5 = samples digested with BsmI, T3–T5 = samples digested with TaqI, and (b) F1–F3 = samples digested with FokI. The gels were developed on a ChemiDoc device. Model: ImagingSystem MP, Brand: BioRad. Serial Number: 734BR5159. Version: 3.0.1.14.
Data analysis
Although no ethnic group was excluded, the study was conducted in a predominantly Afrodescendant region, leading to a final stratification into Afrodescendants and Hispanics. Analyses were also stratified by sex and treatment month.
Data distribution
Normality of continuous variables was evaluated using the Shapiro–Wilk test. Given the moderate sample size and the robustness of non-parametric tests, all quantitative data are presented as median (interquartile range) and compared using appropriate non-parametric methods.
Statistical tests
Vitamin D and LL-37 stratified by sociodemographic variables and treatment month
Quantitative variables were described using the median and interquartile range (IQR), while categorical variables were expressed as absolute frequencies and percentages. Comparisons of vitamin D (VD) and LL-37 levels between PTB and HC were conducted, stratified by sociodemographic variables (age, sex, ethnicity, employment) and month of treatment, using non-parametric tests. Data are presented as median (IQR). The Wilcoxon rank-sum test was used to compare two independent groups; the Kruskal–Wallis test was applied for comparisons involving more than two groups; the Mann–Whitney U test was used to compare the first month of treatment against subsequent months; and the Scheirer–Ray–Hare test—a non-parametric extension of the Kruskal–Wallis test for factorial designs—was employed to assess interactions between multiple factors. A p-value < 0.05 was considered statistically significant.
Genotyping and analysis of VDR polymorphisms
The distribution of FokI, TaqI, and BsmI polymorphisms in the VDR gene was compared between PTB and HC using Fisher’s exact test, with results expressed as absolute frequencies and percentages. Associations between these polymorphisms and clinical status (PTB vs HC) were further assessed by calculating odds ratios (ORs) and 95% confidence intervals (CIs) for each genotype and allele using contingency tables. Hardy-Weinberg equilibrium was evaluated using Fisher’s exact test, and equilibrium was confirmed across all polymorphisms, suggesting stable genotypic frequencies in the absence of strong evolutionary forces.
Measures of 25(OH)D and LL-37 levels from serum and study groups were compared using aligned rank transform ANOVA (ART ANOVA), a non-parametric method suitable for detecting main effects and interactions. Results are presented as medians and interquartile ranges (IQR). A p-value < 0.05 was considered statistically significant.
Software
All data tables were initially constructed in Microsoft Excel (Microsoft Corp., version 2506, Build 18925.20138, Redmon, WA, USA) and subsequently exported in comma-separated value (CSV) format for statistical analysis in RStudio (version 2025.05.1, Build 513, Posit Software, PBC, USA) using R (version 4.5.1, R Core Team, 2025). Data preprocessing, management, and analysis were performed using a combination of base R functions and the following packages: dplyr and tidyr (for data wrangling), gtsummary (for descriptive tables), ggplot2 and ggpubr (for data visualization), rstatix and stats (for non-parametric testing), epiR (for epidemiological statistics and odds ratios), genetics (for Hardy-Weinberg equilibrium tests), ARTool and emmeans (for aligned rank transform ANOVA and post hoc comparisons), and pwr (for power analysis). All statistical tests were two-sided, and p-values < 0.05 were considered statistically significant.
Results
Baseline demographic and socioeconomic characteristics of PTB (n = 80) and HC (n = 50) are shown in Figure 1 and Table 1. No differences were found among groups except for the variables “age” and “occupation.” PTB were older than HC (median, IQR = 42.5 (35–53) vs 35 (26–35) years, p = 0.006). When analyzing the occupation variable, we found a statistically significant difference between the PTB and HC groups (p < 0.001). Among the PTBs, 51.2% (41/80) were unemployed, 32.5% (26/80) reported jobs involving sun exposure, and 16.2% (13/80) reported jobs without sun exposure. Half of the HC (25/50) reported working in jobs without sun exposure, 38% (19/50) reported working with sun exposure and (12%) were unemployed. We observed differences in vitamin D levels between the PTB and the HC groups. Among the PTB, 63.8% (51/80) had sufficient levels, 28.7% (23/80) had insufficient levels, and 7.5% (6/80) had deficient levels. Among the HC, 54% (27/50) had sufficient levels, 16% (8/50) had insufficient levels, and 30% (15/50) had deficient levels. When analyzing the gender variable, men in both the PTB and HC groups had a higher proportion of sufficient levels 69.2% (36/52) in the PTB and 66.7% (20/30) in the HC. Among women, we found a lower frequency of sufficient values. Regarding ethnicity, Hispanic PTB had more sufficient values 73% (11/15) compared to those of Afrodescendant 61.5% (40/65). Among the HC, those of Afrodescendant had a higher proportion of deficient levels 35.3% (12/34). When analyzing occupation, unemployed PTB had higher rates of sufficient levels (73.2%). Among the HC with occupations involving no sun exposure, we identified a higher rate of insufficiency (53.8%), Table 2.
Baseline characteristics of the study population.
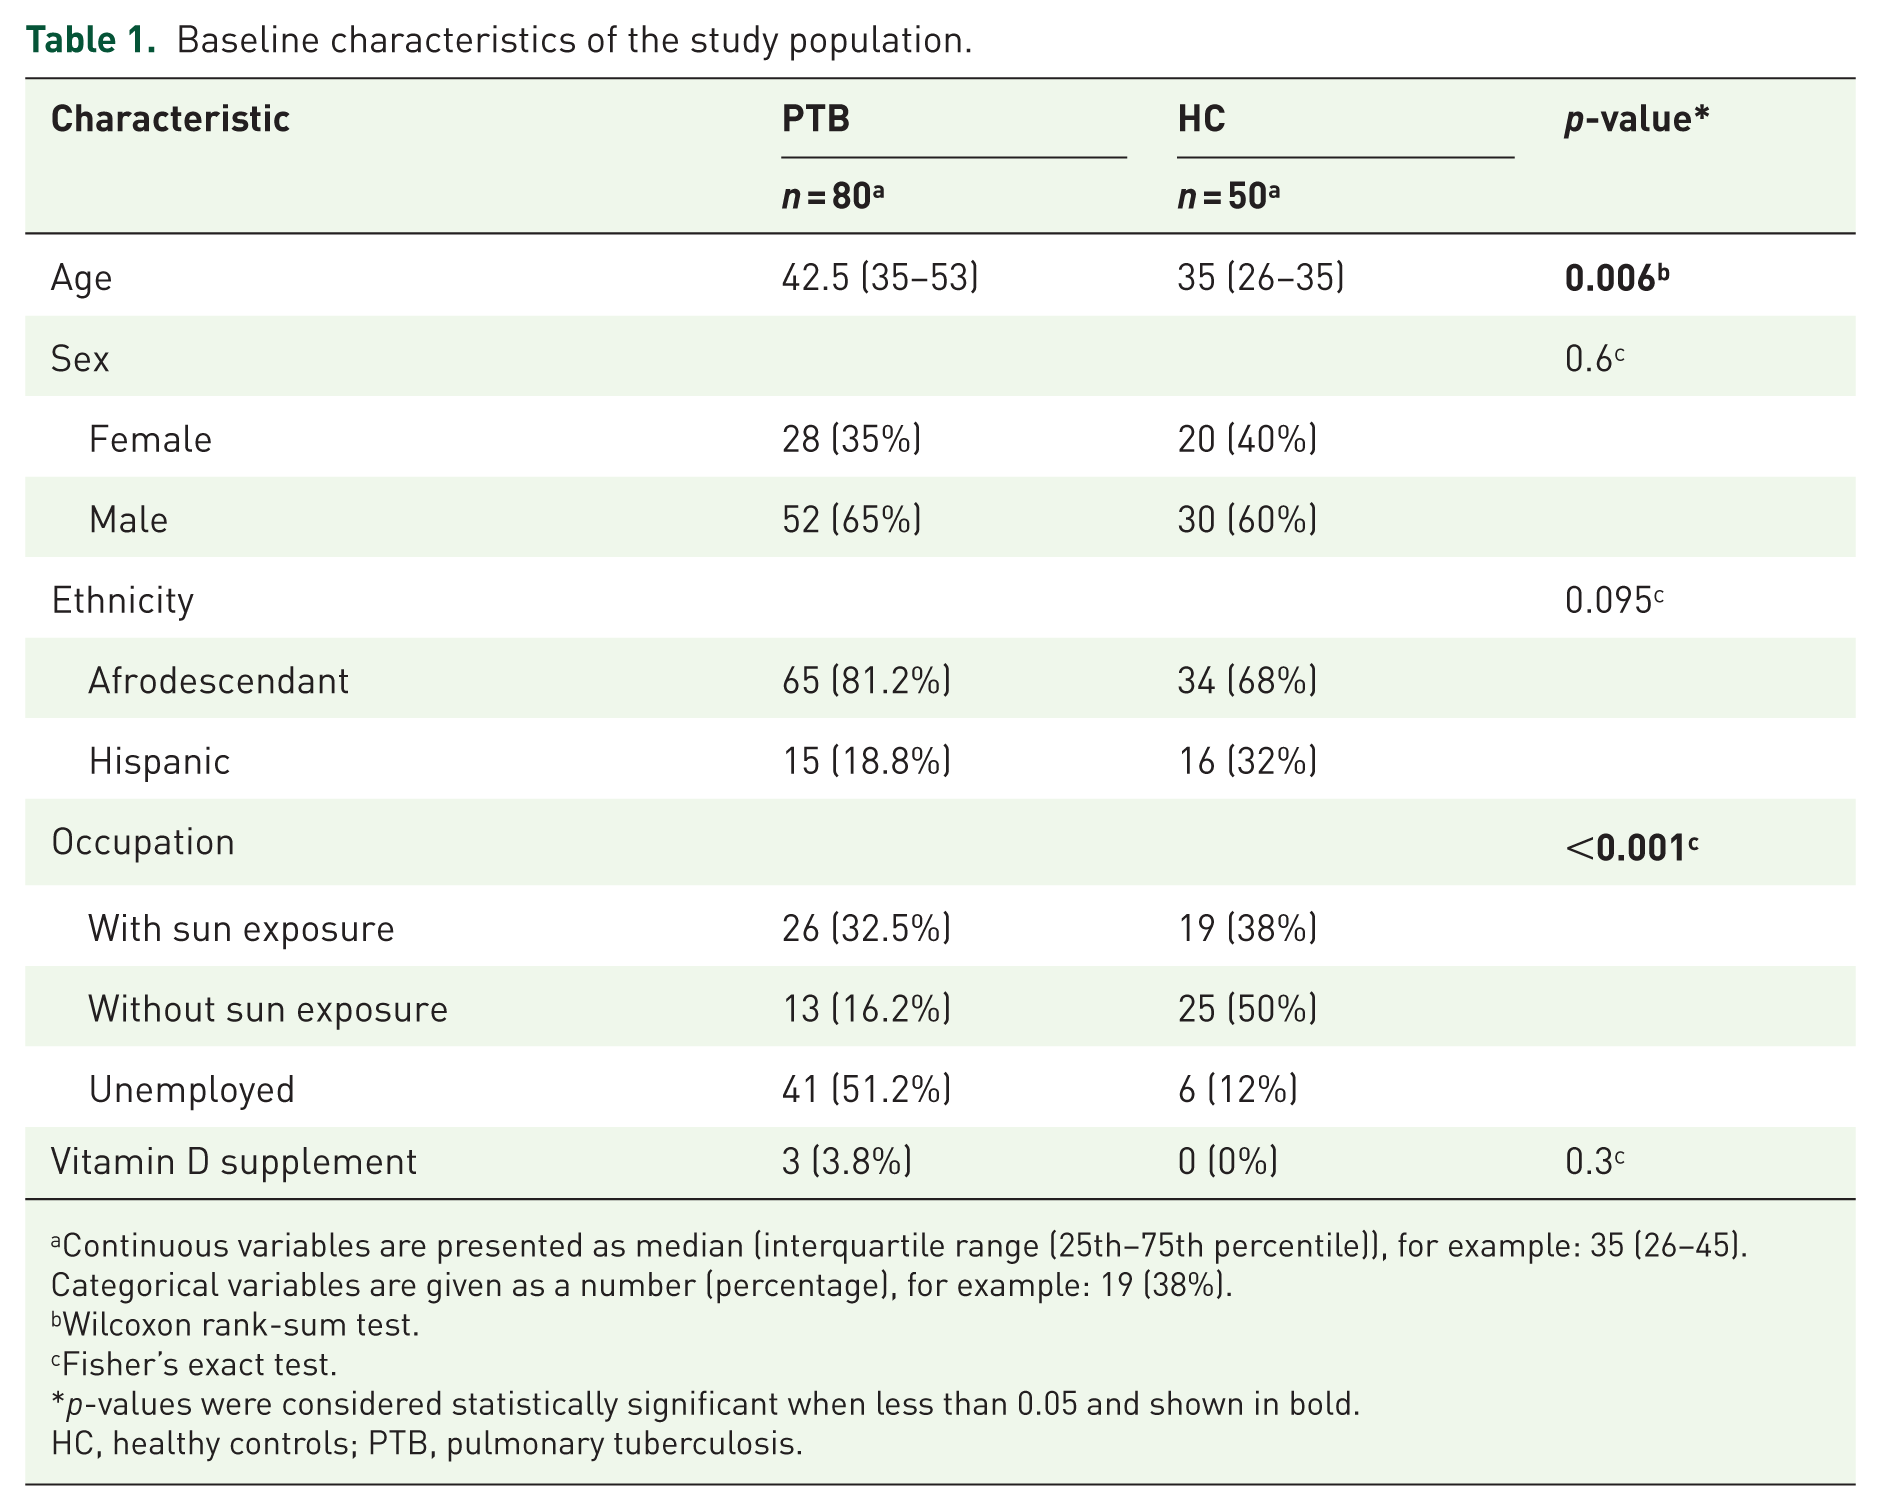
Continuous variables are presented as median (interquartile range (25th–75th percentile)), for example: 35 (26–45). Categorical variables are given as a number (percentage), for example: 19 (38%).
Wilcoxon rank-sum test.
Fisher’s exact test.
p-values were considered statistically significant when less than 0.05 and shown in bold.
HC, healthy controls; PTB, pulmonary tuberculosis.
Sociodemographic characteristics of the study population and their vitamin D levels.
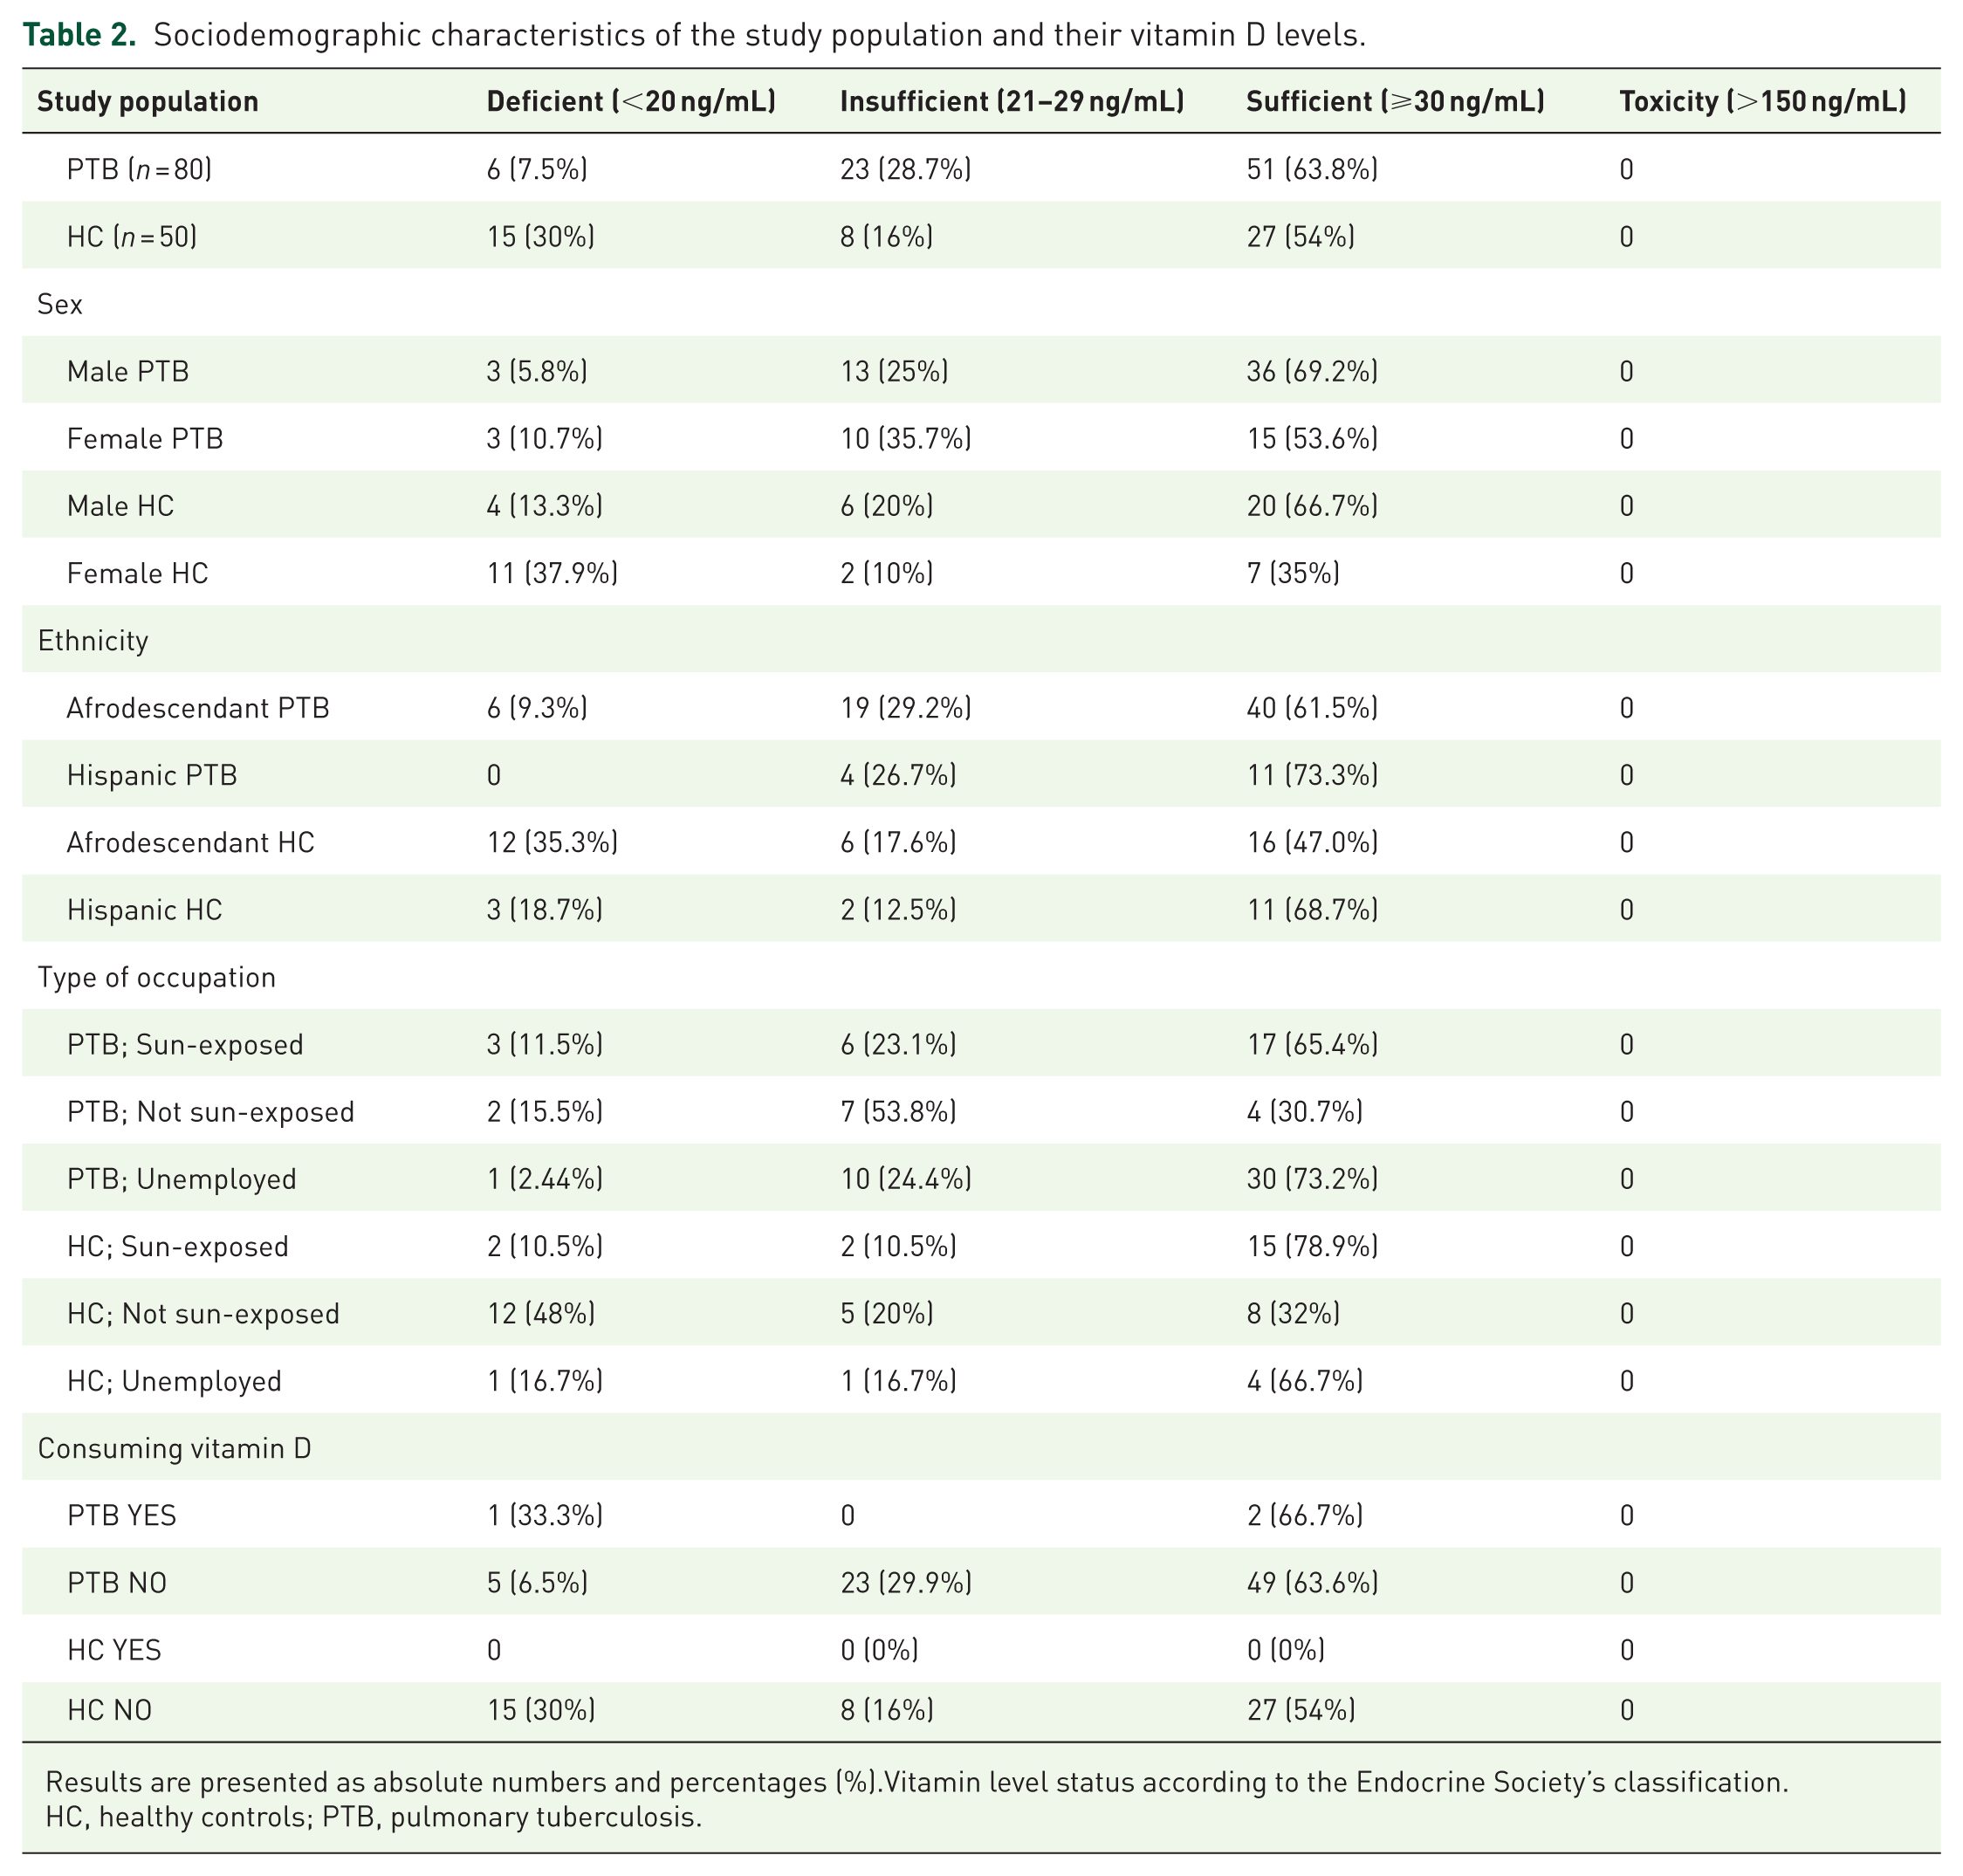
Results are presented as absolute numbers and percentages (%).Vitamin level status according to the Endocrine Society’s classification.
HC, healthy controls; PTB, pulmonary tuberculosis.
When looking at cathelicidin levels, we found the PTB group levels ranged from 9.47 to 1.36 ng/mL (mean 58.4 ± 28.3). For the HC group (n = 50), levels ranged from 1.4 to 139 ng/mL (mean 52.4 ± 30.6). In our study population, some values exceeded the 100 ng/mL limit, meaning they were outside the quantification range specified by the manufacturer and were reported as the original value. Most of our results fell within the range established by the kit. We did not find a universal reference range for high or low cathelicidin levels in human serum; therefore, our analysis consisted of comparisons between PTB and HC values.
Vitamin D and cathelicidin levels in PTB and HC, stratified by sociodemographic characteristics
When we analyzed serum levels of vitamin D and cathelicidin in relation to sociodemographic characteristics, we found that in women with PTB, vitamin D levels were significantly higher (median (IQR) =33.9 ng/mL (26.8–48.1)) compared to women in the HC group (median (IQR) = 19.5 ng/mL (11.8–33.4); p = 0.002). In contrast, we found no differences regarding cathelicidin among women. The men showed very similar vitamin D levels between PTB and HC (p = 0.988), with a tendency toward higher cathelicidin levels in PTB (median (IQR) = 58.8 ng/mL (41.1–75.4)) compared to HC (median (IQR) = 41.2 ng/mL (33.2–71.7); p = 0.190). Regarding ethnicity, Hispanic PTBs showed higher levels of cathelicidin (median (IQR) = 59.6 ng/mL (48.2–71.4)) than Hispanic HC (median (IQR) = 38.9 ng/mL (19.5–49.2); p = 0.014); no differences were detected among African American PTBs and HC. When analyzing the occupation variable, unemployed PTBs had higher levels of cathelicidin (median (IQR) = 59.4 ng/mL (42.4–79.3)) compared to unemployed HCs (median (IQR) = 28.2 ng/mL (13.9–42.8); p = 0.048); however, we did not detect significant differences in vitamin D levels across the occupational groups Figure 3 and Table 3. We did not detect a significant correlation between vitamin D levels and cathelicidin. When comparing the control group (n = 50; r = 0.001) and the total patient group (n = 80; r = 0.085), the correlation was very weak and not statistically significant. When stratifying patients by month of treatment, we found that patients in month 1 of treatment (n = 44) showed no correlation (n = −0.011), unlike patients in months 2 through 6 (n = 36), who showed a correlation, albeit a very weak 1 (r = 0.278).
Serum levels of vitamin D (ng/mL) and cathelicidin LL-37 (ng/mL) in HC and PTB according to sociodemographic characteristics.
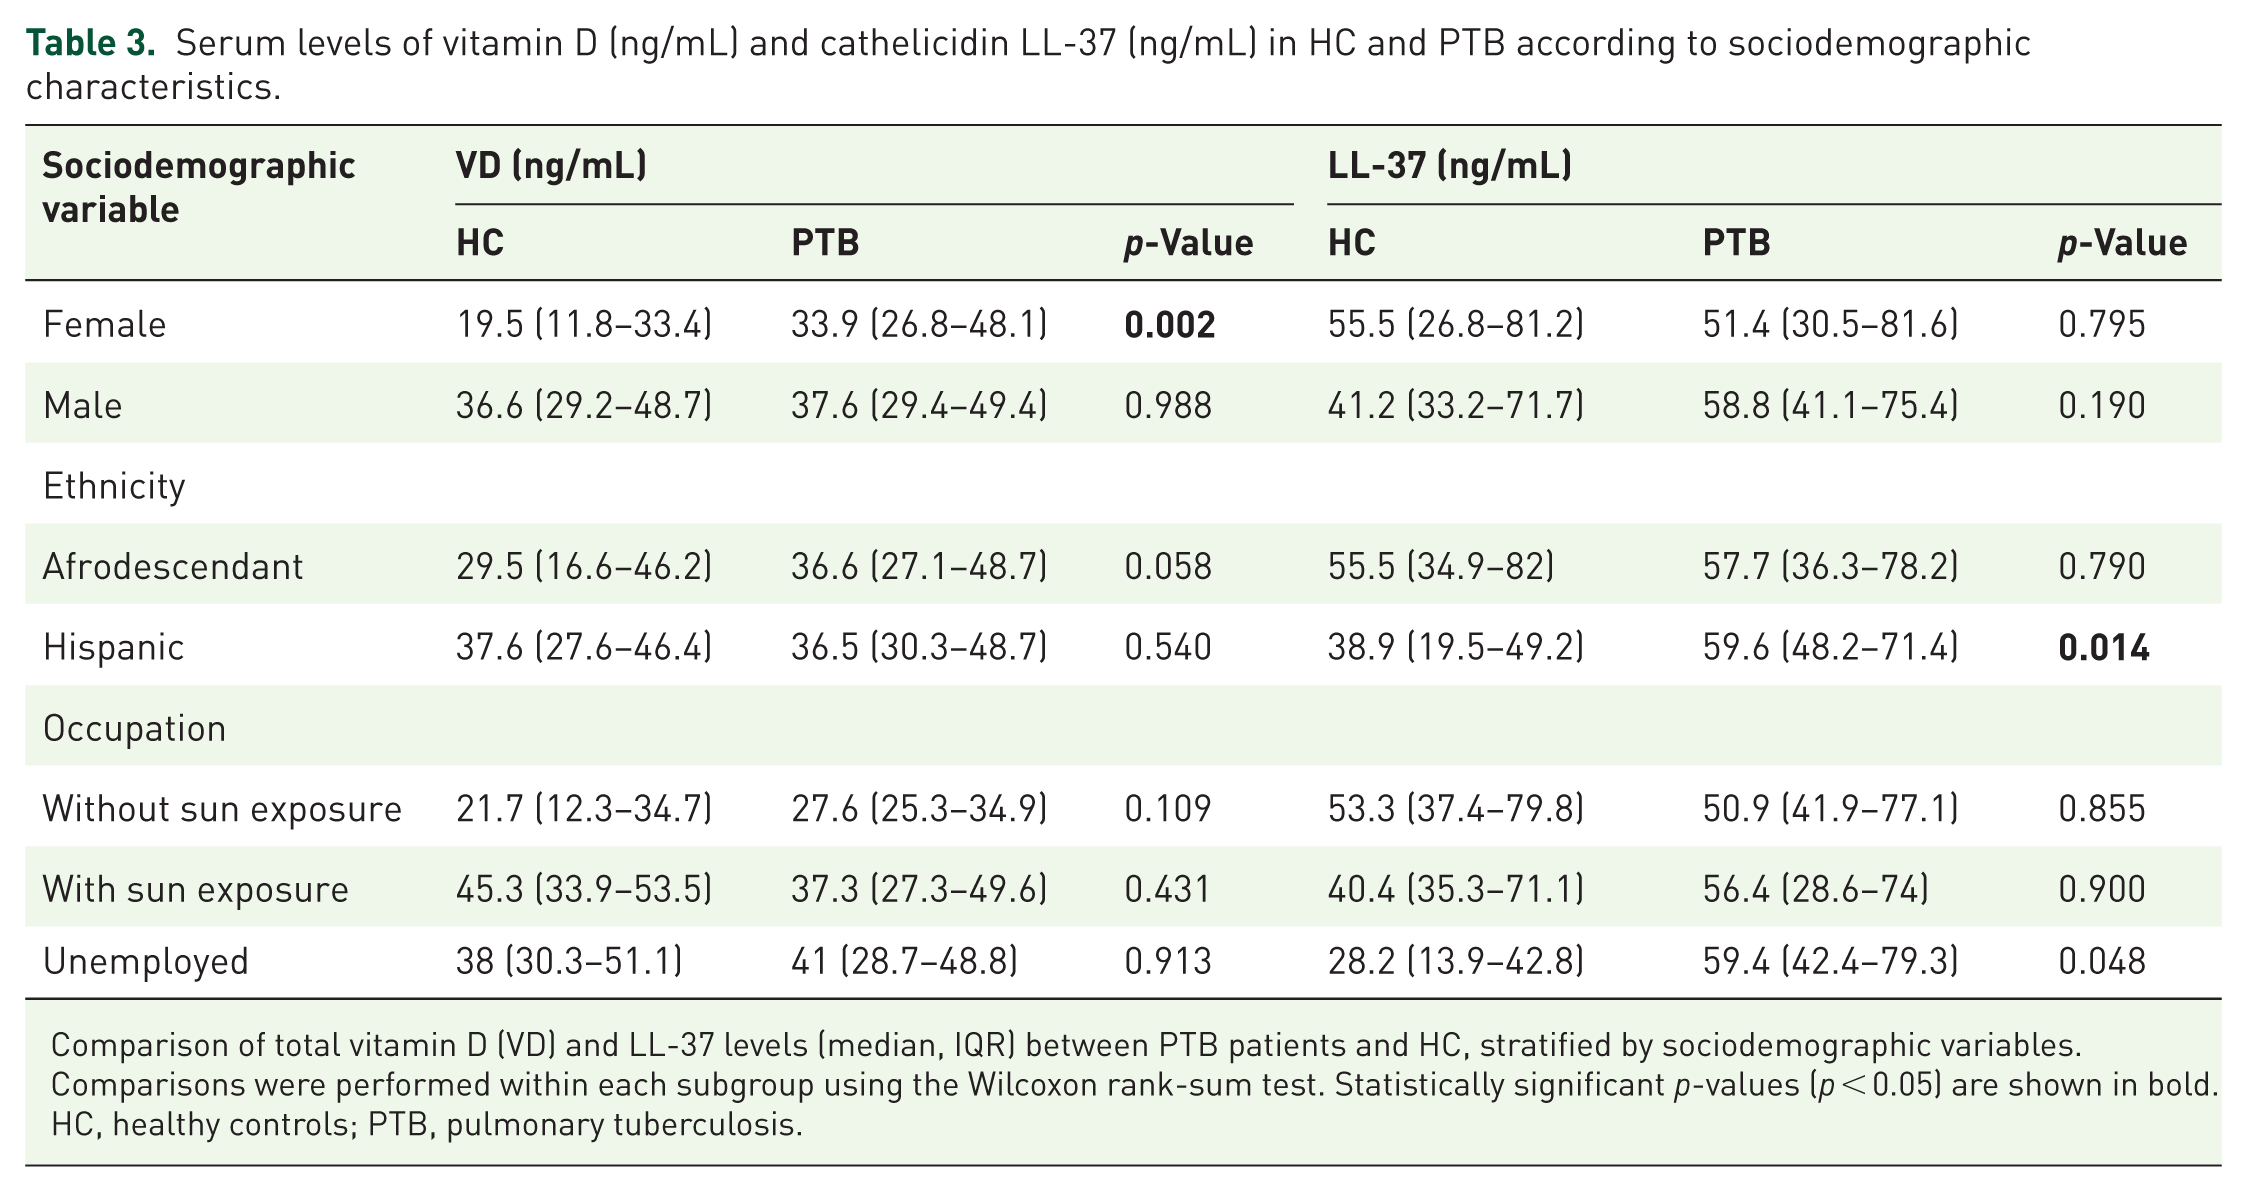
Comparison of total vitamin D (VD) and LL-37 levels (median, IQR) between PTB patients and HC, stratified by sociodemographic variables. Comparisons were performed within each subgroup using the Wilcoxon rank-sum test. Statistically significant p-values (p < 0.05) are shown in bold.
HC, healthy controls; PTB, pulmonary tuberculosis.
Vitamin D and cathelicidin levels in PTB and HC during the treatment
Vitamin D levels in PTB resulted slightly higher than those in healthy controls (median (IQR) = 36.6 ng/mL (27.6–48.7) vs median (IQR) = 32.5 ng/mL (18–46.3); p = 0.067). At month 1 of treatment, vitamin D levels in PTB were higher (median (IQR) = 39.9 ng/mL (28.5–50.5)) than in HC, with a significant difference (p = 0.026). Vitamin D levels in PTB decreased in months 2 and 3, increased in months 4 and 5, and decreased in month 6 of treatment. When analyzing the age variable, PTB women aged 45–59 years in month 1 of treatment had significantly higher levels than HC (p = 0.0358). Regarding the sex variable in month 1 of treatment, PTB women had higher vitamin D levels (median (IQR) = 41.4 ng/mL (27.9–55.5) than in HC women (median (IQR) = 19.5 ng/mL (11.8–33.4); p = 0.010). Regarding cathelicidin, no overall differences were observed between PTB and HC (median (IQR) = 57.8 ng/mL (37.3–77.4) vs median (IQR) = 47.3 ng/mL (32.6–72.9); p = 0.283). At month 1 of treatment, no difference was detected between PTB and HC, but an increase was observed at months 2 and 4 and a decrease at months 5 and 6 of treatment in the PTB. In the PTB aged 18–29 years, we detected significantly higher values than in the HC at month 1 of treatment (p = 0.023). We found no significant differences in cathelicidin levels by ethnicity or sex between PTB and HC across the treatment months Table 4 and Figure 4.
Vitamin D and cathelicidin levels between PTB at different months of treatment and PTB within 1 month of treatment versus HC in relation to sex, ethnicity, and age.
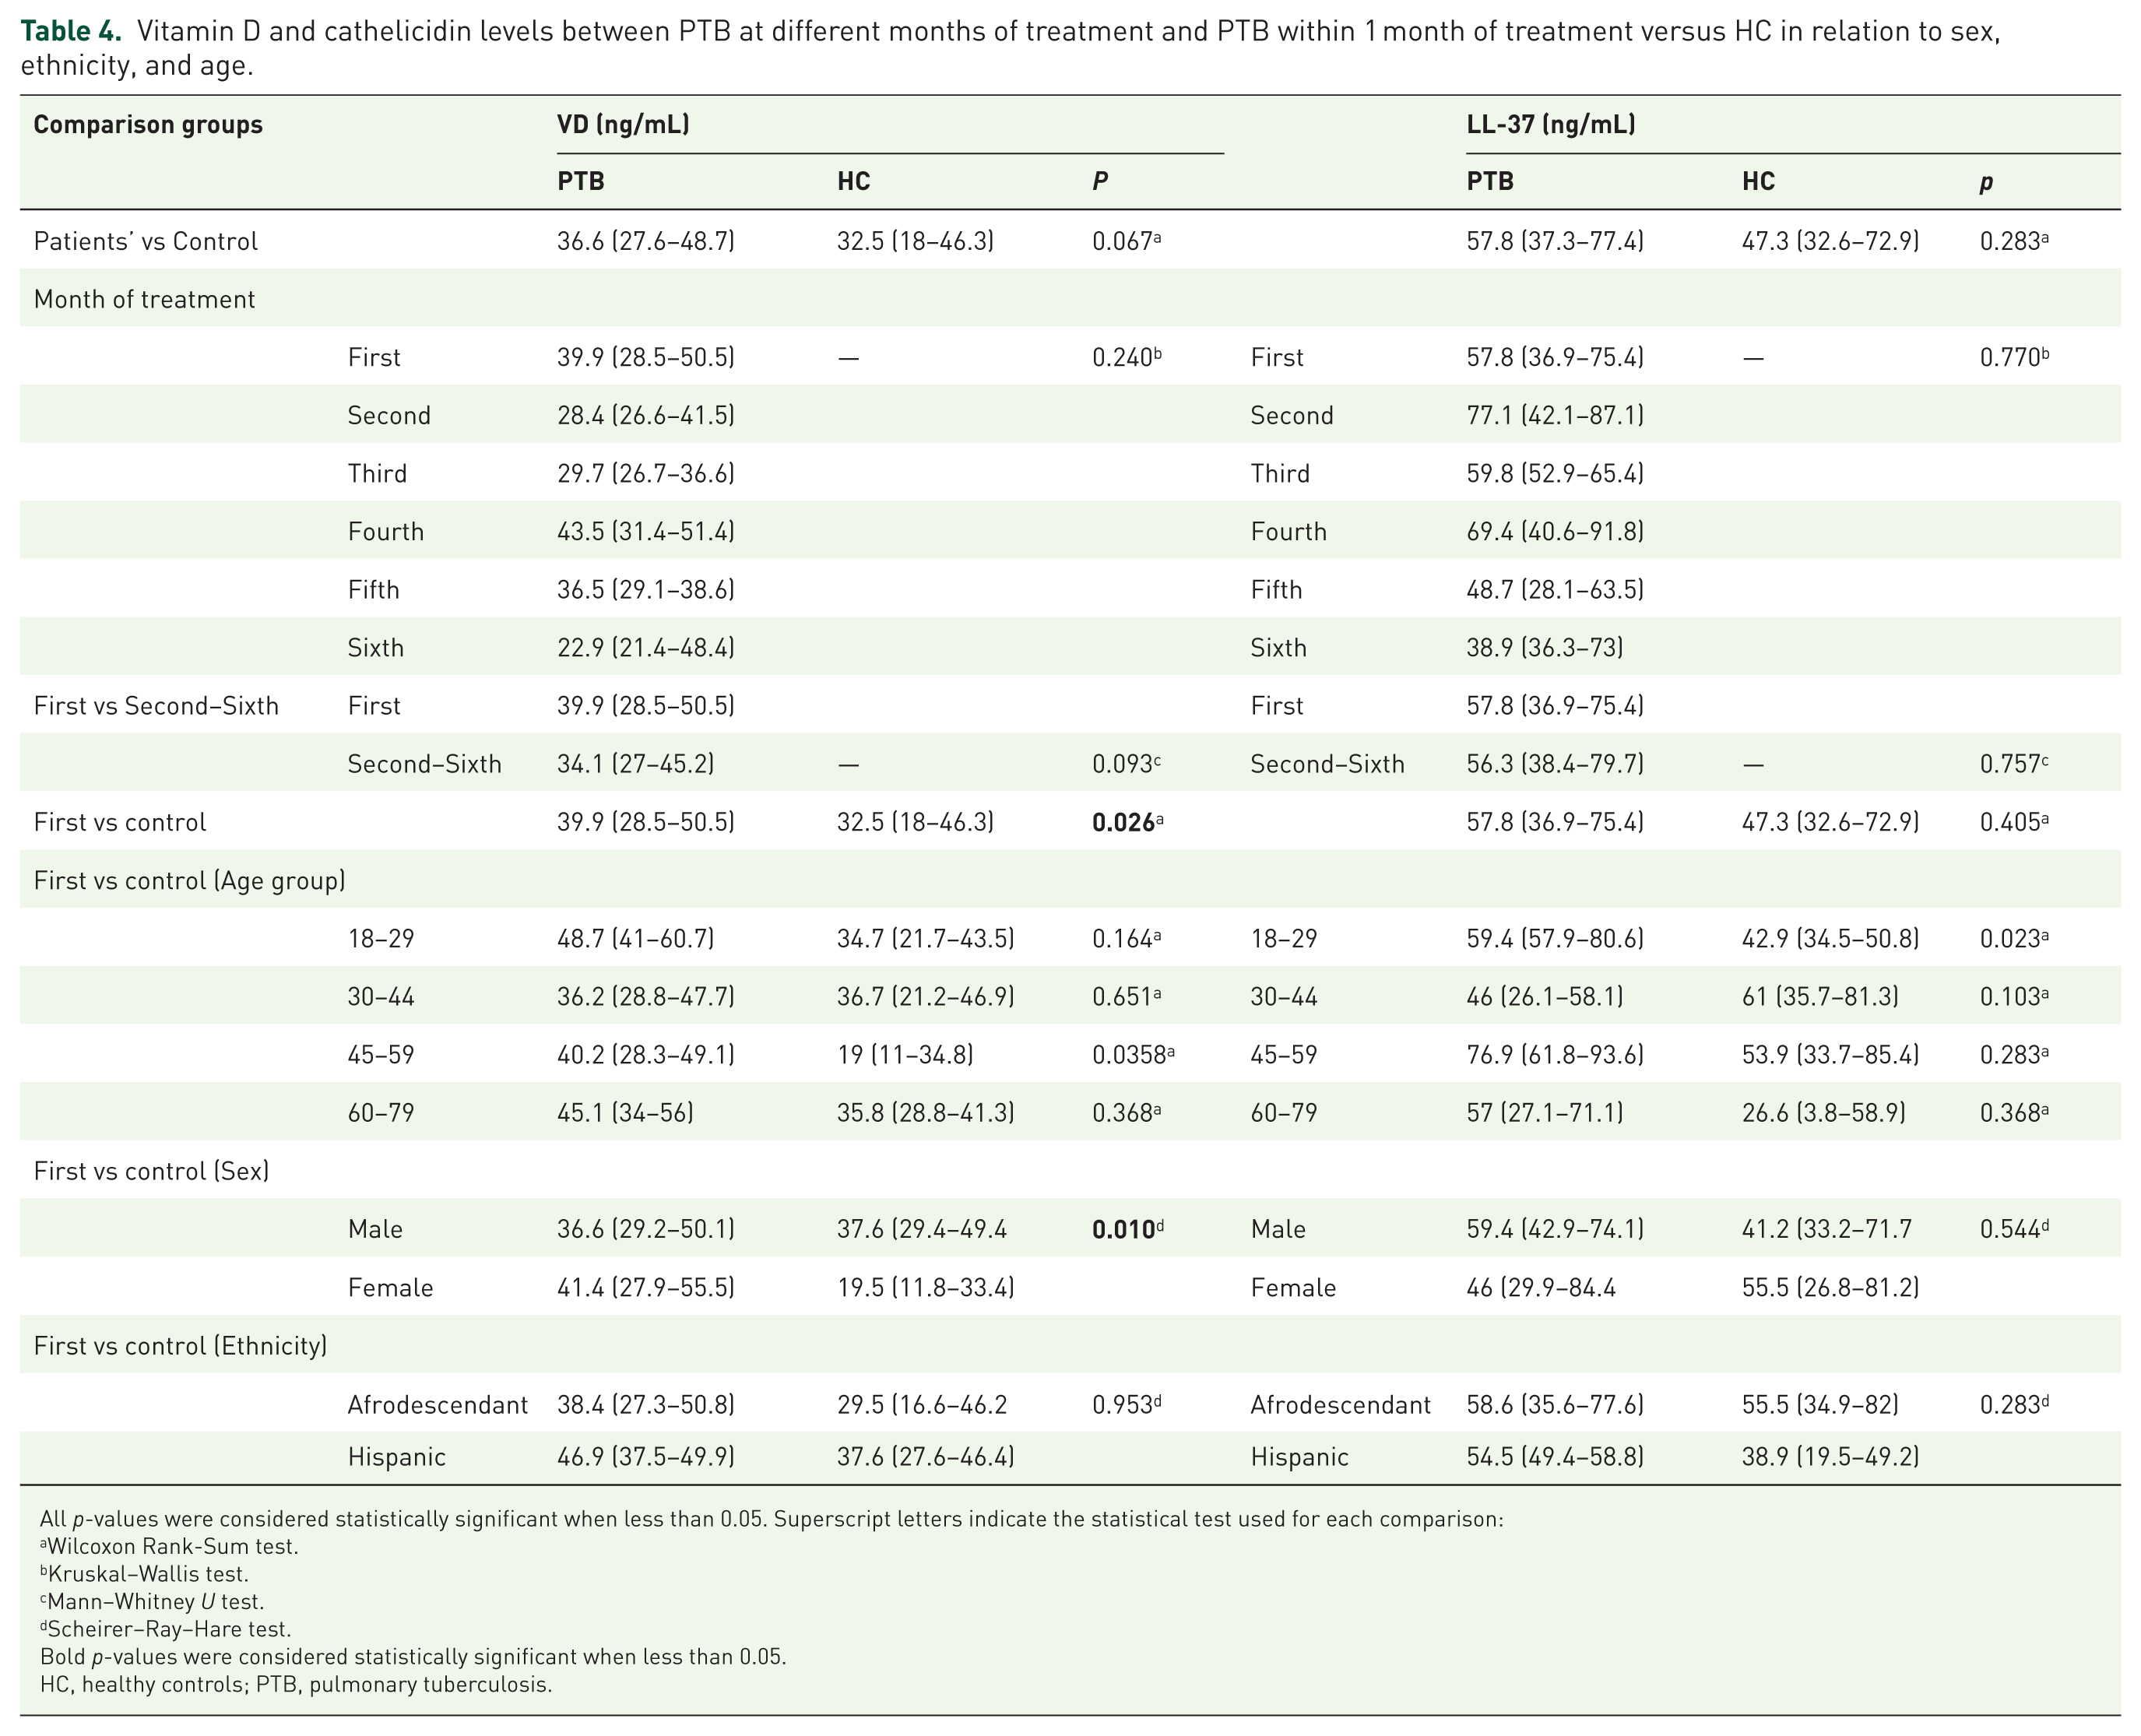
All p-values were considered statistically significant when less than 0.05. Superscript letters indicate the statistical test used for each comparison:
Wilcoxon Rank-Sum test.
Kruskal–Wallis test.
Mann–Whitney U test.
Scheirer–Ray–Hare test.
Bold p-values were considered statistically significant when less than 0.05.
HC, healthy controls; PTB, pulmonary tuberculosis.
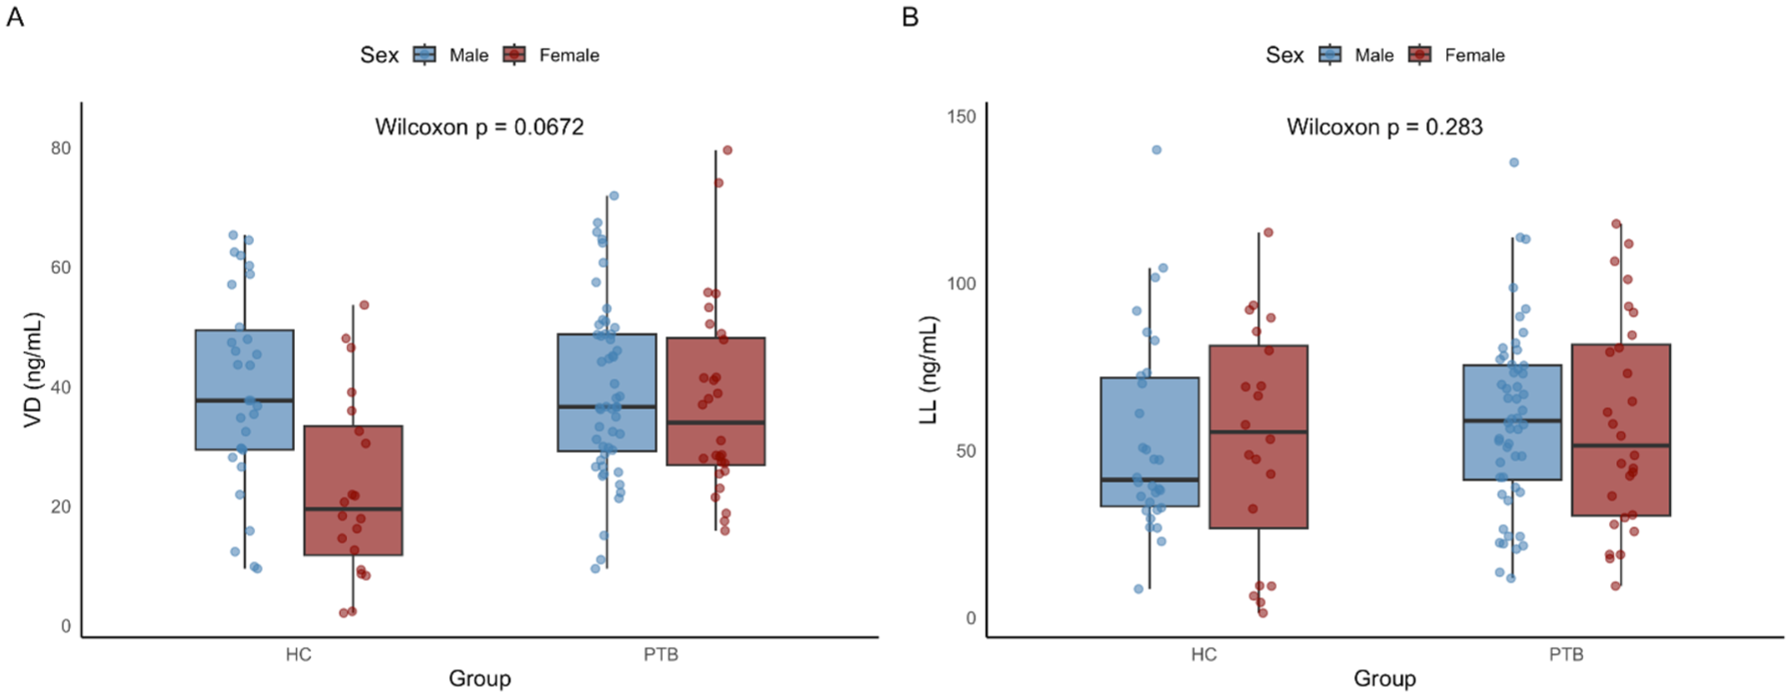
Comparison of total vitamin D and LL levels between PTB and HC. These boxplots display the distribution of total vitamin D (a) and LL (b) levels between PTB and HC, stratified by sex. A Wilcoxon rank-sum test was used to compare groups.
VDR polymorphisms (FokI, TaqI, BsmI) and their association with vitamin D and cathelicidin levels in PTB and HC
When we analyzed the DNA of the PTB and HC groups, we did not detect any significant differences in the distribution of polymorphisms (Table 5). Upon evaluating vitamin D levels in relation to haplotypes, we were unable to detect any significant differences between the PTB and HC groups with regard to the FokI and TaqI polymorphisms. For the BsmI polymorphism, we found that the BB genotype showed a significant difference between PTB and HC (p = 0.004). For cathelicidin levels, we did not detect significant differences between PTB and HC in these polymorphisms (Table 6). The odds ratio (OR) and 95% CI resulted from the association between the VDR gene polymorphism in PTB and HC; in this study, we did not detect a significant association between the polymorphisms and tuberculosis (Table 7). VDR variants of the partial sample were sequenced, confirming the heterozygous genotype for FokI and BsmI (Supplemental Material 1).
Distribution of FokI, TaqI, and BsmI polymorphisms in PTB and HC.
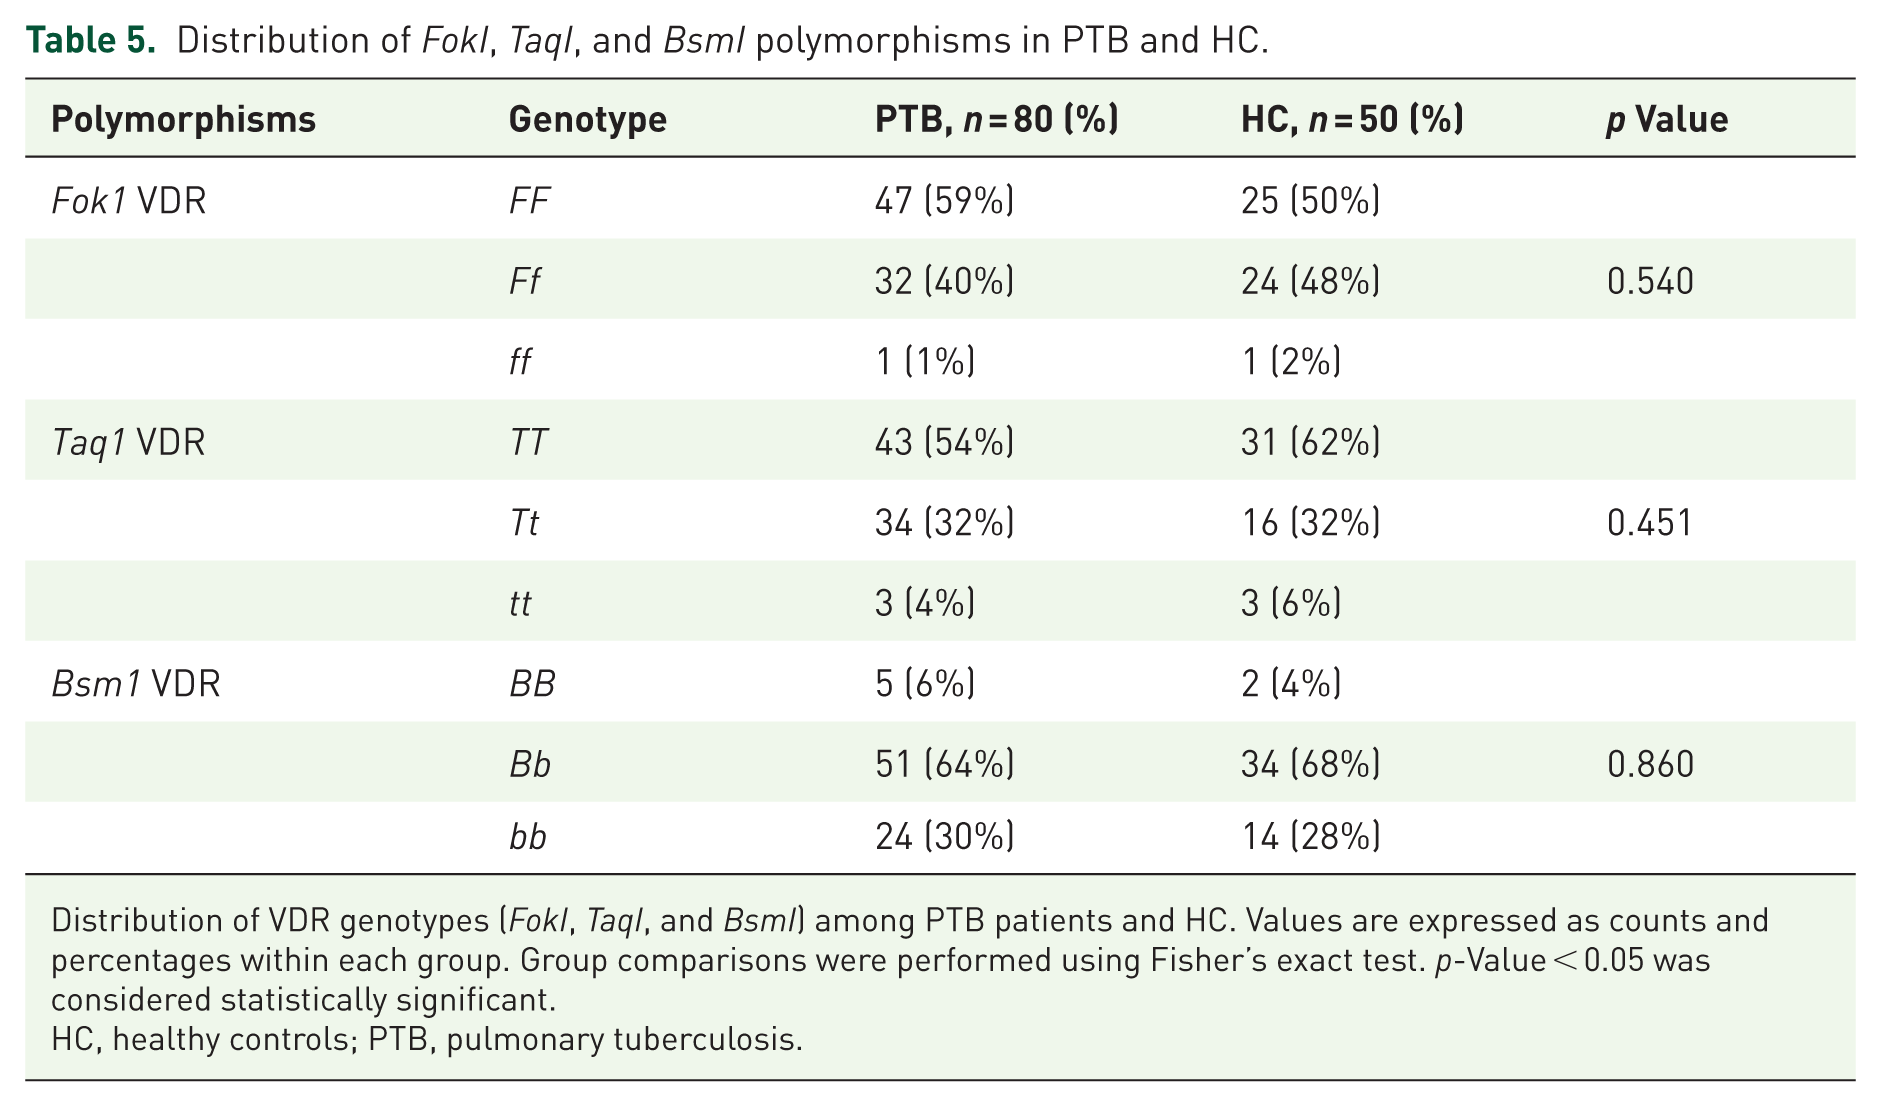
Distribution of VDR genotypes (FokI, TaqI, and BsmI) among PTB patients and HC. Values are expressed as counts and percentages within each group. Group comparisons were performed using Fisher’s exact test. p-Value < 0.05 was considered statistically significant.
HC, healthy controls; PTB, pulmonary tuberculosis.
Relationship between genotypic frequencies of the VDR receptor polymorphism and 25-hydroxy-vitamin D and cathelicidin levels.
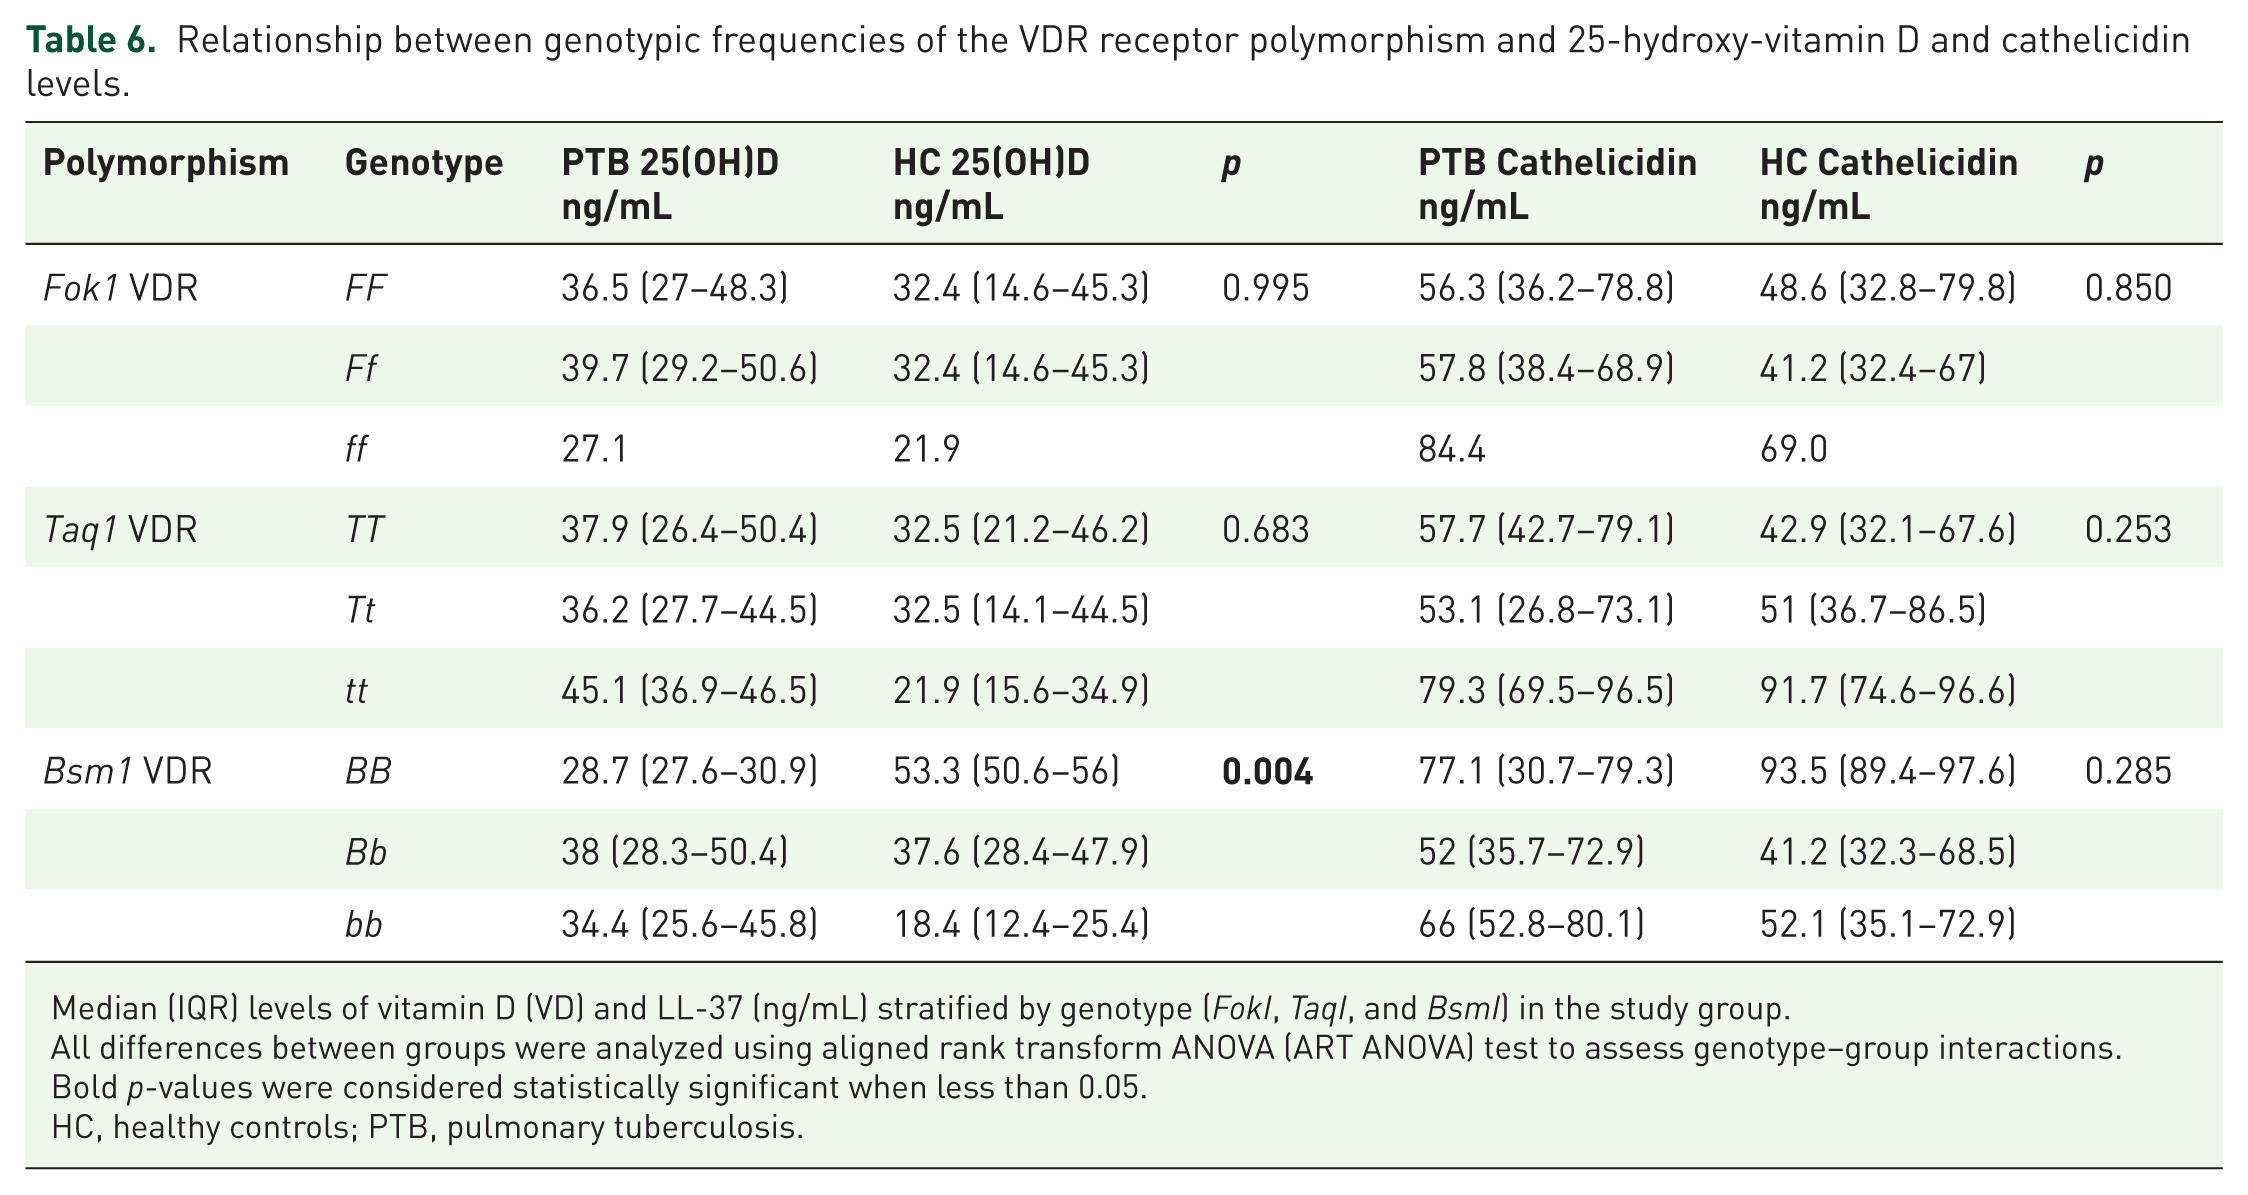
Median (IQR) levels of vitamin D (VD) and LL-37 (ng/mL) stratified by genotype (FokI, TaqI, and BsmI) in the study group.
All differences between groups were analyzed using aligned rank transform ANOVA (ART ANOVA) test to assess genotype–group interactions.
Bold p-values were considered statistically significant when less than 0.05.
HC, healthy controls; PTB, pulmonary tuberculosis.
OR and 95% CI results of the association between VDR gene polymorphism in PTB and HC.
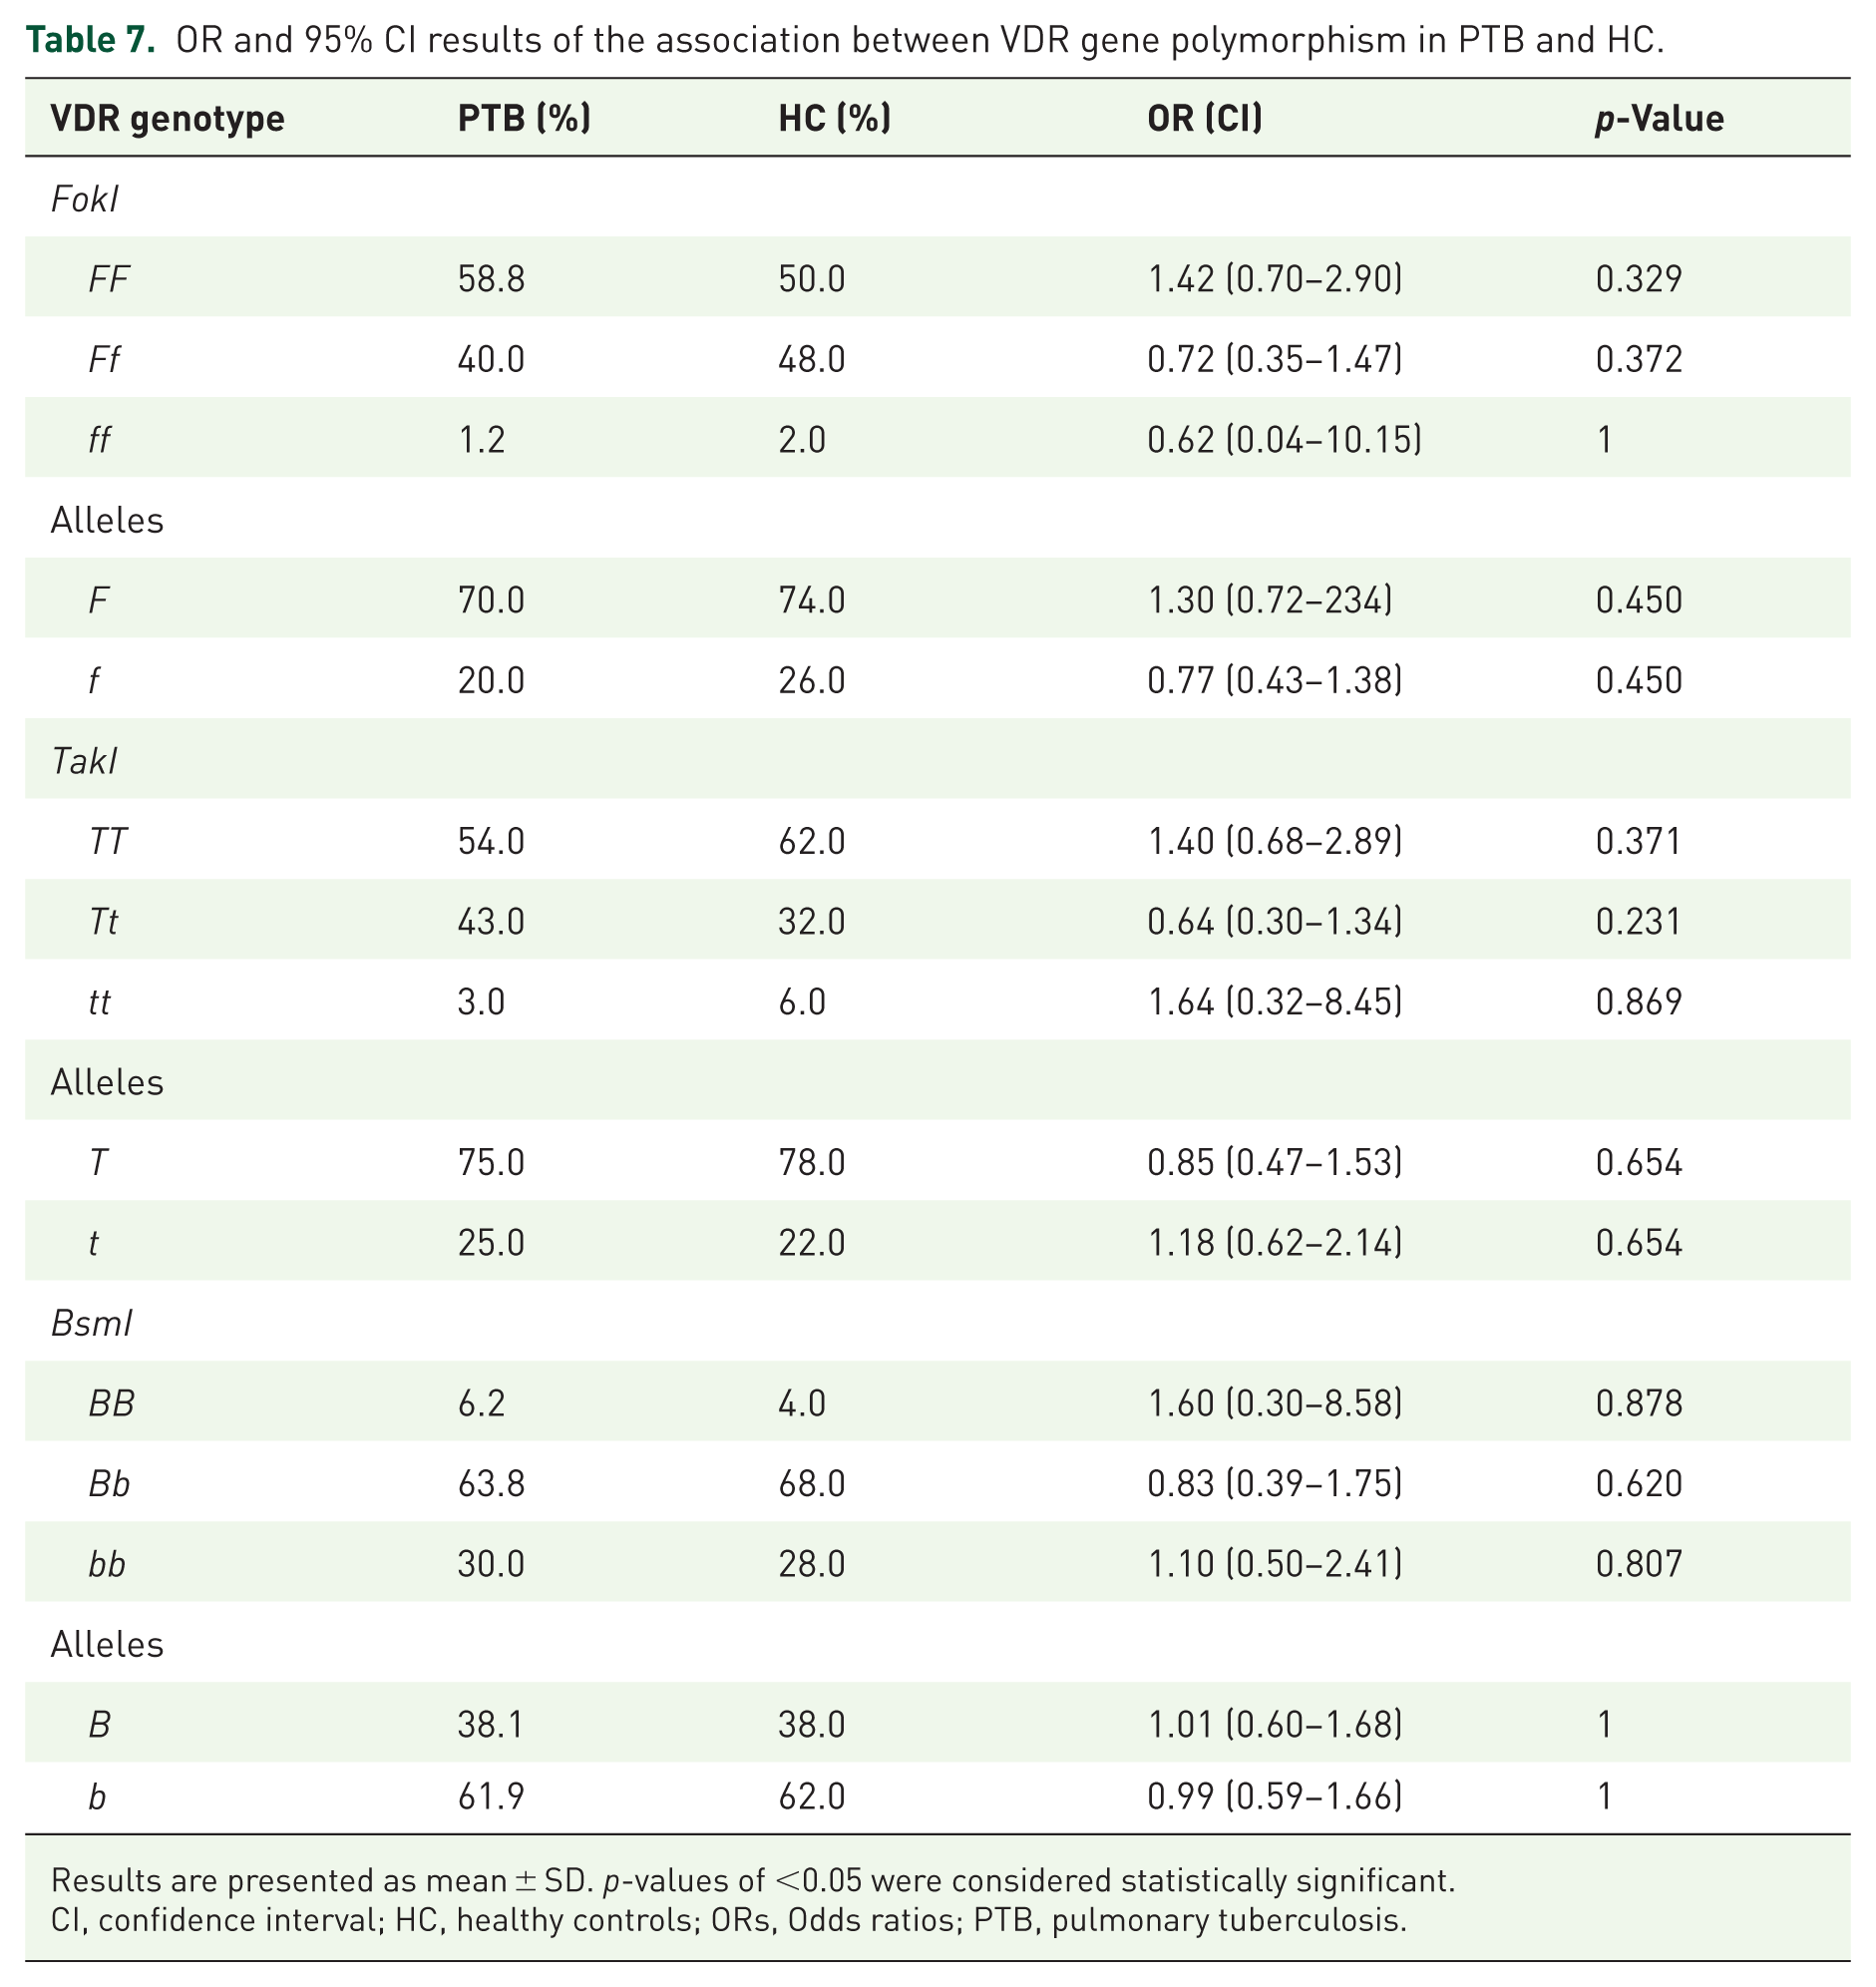
Results are presented as mean ± SD. p-values of <0.05 were considered statistically significant.
CI, confidence interval; HC, healthy controls; ORs, Odds ratios; PTB, pulmonary tuberculosis.
Discussion
In this study, we analyzed the frequency of vitamin D receptor polymorphisms and their relationship with vitamin D and cathelicidin levels in PTB and HC in the province of Colon, Panama. Although no significant associations were observed between VDR genotypes and disease, a close relationship with disease status was identified. In our study, the VDR-BsmI BB genotype was associated with significantly lower 25(OH)D levels. From previous reports is clear that BsmI does not alter the structure of the VDR protein, but it affects mRNA stability and transcriptional signaling. Thus, BsmI polymorphisms have been linked to TB risk, particularly in Asian populations.34,35 This may be relevant to countries like Panama, with a historical Asian population background, where BsmI remains significantly associated with TB in individuals of Asian ancestry. 20 In fact, we previously reported endemic transmission of the Asian strain M. tuberculosis Beijing sublineage L2.2M3 in 31.7% of PTB cases. 27 On the other hand, we found that the FokI polymorphism did not show significant differences among genotypes, which may indicate a lesser effect in our study population. Regarding TaqI, there was a tendency toward a slight increase in cathelicidin levels in individuals with the tt genotype without statistically significant differences. Taken altogether, while VDR polymorphisms may not have a direct role in TB susceptibility, they could modulate host immune responses through 25(OH)D levels and other antimicrobial pathways such as cathelicidin expression.
According to Wilkinson et al., findings related to serum 25(OH)D levels and VDR polymorphisms may be also influenced by patients’ nutritional status, sunlight exposure, and immune response to M. tuberculosis. In their study, serum 25(OH)D levels were lower in PTB compared with HC.16,25 In contrast, our results showed higher 25(OH)D levels in PTB than in HC, suggesting that vitamin D status may represent an important population-specific indicator of immune response in our setting. Similarly, Musarurwa et al. 28 reported sufficient 25(OH)D levels in PTB in Zimbabwe, attributing these findings to genetic differences and the complex biological actions of vitamin D, particularly the role of polymorphisms and enzymes involved in its metabolism. On the other hand, a key finding in our study was the significant association between cathelicidin levels and ethnicity (p = 0.014), with more pronounced differences between Afrodescendant and Hispanic populations. This may reflect genetic variation in SNPs related to calcidiol metabolism and innate immune responses. Cathelicidin is a direct target of the VDR, regulated by a vitamin D response element (VDRE), linking vitamin D signaling to antimicrobial activity. 29 VDR polymorphisms of FokI, TaqI, BsmI modulate VDR mRNA stability and transcriptional activity, thereby influencing cathelicidin expression and immune regulation.
Our results indicate that vitamin D and cathelicidin levels in PTB were higher than in HC. Data very similar to those presented here showed that vitamin D concentrations help improve the expression of cathelicidin by macrophages during the TB infection.16,30 There are a few where PTB had higher vitamin D levels. Another study conducted in Zimbabwe 28 reported higher vitamin D levels in PTB than in controls, suggesting that patients’ genetic factors could be affected by vitamin D levels. On the other hand, our findings suggest a possible relationship between vitamin D and sex. A study by Samah Sidahmed reported higher vitamin D levels in male PTB than in female PTB, findings similar to ours, which detected significant differences between male and female PTB and HC.5,31 On one hand, we could not detect significant differences in ethnicity or age when we analyzed vitamin D levels in PTB without stratifying by month of treatment; on the other hand, PTB had higher vitamin D mean values than HC.31,32 This increase may be due to the patient’s immune cells detecting bacilli via TLR1/2, which increases the transport of 25(OH)D by DBP in the bloodstream, enabling its transformation into the active form calcitriol within the affected immune response cells.11,33,34
Tuberculosis treatment may also influence vitamin D levels. In our study, we compared total vitamin D levels in PTB and HC. We found that PTB in the first month of treatment had significantly higher total vitamin D levels than HCs. These PTB were newly diagnosed and either newly started or in the early stages of treatment. To further explore the effect of treatment duration, we analyzed 25(OH)D levels in PTB across different treatment periods, from month 1 to month 6. Overall, no significant differences in vitamin D levels were observed across treatment months. However, PTB in month 1, corresponding to the intensive phase of treatment (isoniazid, rifampicin, pyrazinamide, and ethambutol), had higher 25(OH)D levels than those in months 2–6, when the continuation phase begins (isoniazid and rifampicin). Despite this trend, the differences between month 1 and months 2–6 were not statistically significant. Our findings differ from those reported by Rathored et al., who observed low vitamin D levels in newly diagnosed tuberculosis patients in North India. Differences in population characteristics and environmental conditions may explain this discrepancy. Panama’s tropical location provides high solar radiation throughout most of the year, with only seasonal variation during the rainy months (May to November), which may contribute to higher vitamin D levels in this population compared with those in other geographic regions.23,35
Some of the limitations of this study include its cross-sectional design, which restricts causal inference, and potential selection bias due to the study population’s ethnic heterogeneity and sex. Furthermore, unmeasured nutrition, continuous monitoring of treatments, co-infections and other comorbidities could influence the observed associations. Future research should employ case-control and longitudinal studies incorporating nutritional assessments, sun exposure, and advanced metabolite analysis (LC-MS/MS) to validate these findings. Specifically, studies are warranted to understand vitamin D metabolism to aid in delineating the exact altered pathway in each patient to provide personalized medicine. The study of the vitamin D metabolite ratio remains a novel biomarker strategy that could provide more accurate information on vitamin D metabolism and functional status. 36
In summary, our findings suggest that the VDR-BsmI BB genotype is associated with lower vitamin D levels in TB patients, potentially affecting immune responses. Differences related to sex and ethnicity may further influence vitamin D metabolism. Given the limited sample size, results should be interpreted cautiously; however, they highlight the importance of evaluating vitamin D–related genetic polymorphisms in larger, more diverse cohorts. The strength of our study lies in the integration of genetic, immunological, and metabolic data, which led us to identify an association between the BsmI genotype and vitamin D in our study population; this finding helps us improve our understanding of genetic interactions and the immune response in populations with a high burden of tuberculosis.
Conclusion
This study demonstrated that the FokI and TaqI polymorphisms were not significantly associated with vitamin D or cathelicidin levels during tuberculosis. In contrast, the BsmI polymorphism was significantly associated with vitamin D levels. Specifically, BsmI BB polymorphisms of the vitamin D receptor VDR tend to be associated with lower levels of 25(OH)D in tuberculosis, but without a significant association with cathelicidin. Due to our limited sample size, we were unable to infer causality, highlighting the need for longitudinal and interventional studies, as well as univariate, multivariate, and independent association statistical analyses. Our results suggest that the genetic diversity of our study population may influence vitamin D levels and could affect the host’s immune response.
Supplemental Material
sj-docx-1-tai-10.1177_20499361261458154 – Supplemental material for Vitamin D receptor BsmI haplotype BB confers lower 25(OH)D levels during tuberculosis: a pilot cross-sectional study
Supplemental material, sj-docx-1-tai-10.1177_20499361261458154 for Vitamin D receptor BsmI haplotype BB confers lower 25(OH)D levels during tuberculosis: a pilot cross-sectional study by Dilcia Sambrano, Sandra Martín-Peláez, Kharla Salazar, Priya Patel, Fermín Acosta, Johanna Elizabeth Ku, Anabel Argelis García, Emilio Romero, Yaracelis Cuadra, Stephanie Hawkins, Isolina Martínez, Odemaris Luque, Laura Solís, Geydi Cañate, Mariela Vergara, Lizbeth Garibaldi, Julio Jurado and Amador Goodridge in Therapeutic Advances in Infectious Disease
Footnotes
Acknowledgements
We thank all study participants, including patients and healthy controls. We also thank Dr. Milton Alvear, Medical Director of the Manuel Amador Guerrero Hospital in the province of Colón; Aixa Caraballo and Amable Herrera of the Blood Bank; Dr. Carmelo Donato, Medical Director; Nistyari Chifundo, nurse of the Programa Regional de Control Tuberculosis at the Hugo Spadafora Policlinic.
Declarations
ORCID iDs
Supplemental material
Supplemental material for this article is available online.
References
Supplementary Material
Please find the following supplemental material available below.
For Open Access articles published under a Creative Commons License, all supplemental material carries the same license as the article it is associated with.
For non-Open Access articles published, all supplemental material carries a non-exclusive license, and permission requests for re-use of supplemental material or any part of supplemental material shall be sent directly to the copyright owner as specified in the copyright notice associated with the article.