






Abstract
Background
With global population aging, the prevalence of gastric cancer among patients aged 60 years and older continues to rise. Radical gastrectomy frequently induces postoperative skeletal muscle loss, which correlates with poor clinical prognosis. Currently, few prediction models are available to screen for new-onset postoperative low muscle mass in older gastric cancer patients. This study aimed to construct and internally validate a preoperative prediction model for low muscle mass at six months after radical gastrectomy in this elderly population.
Methods
A total of 69 eligible older adult patients with pTNM stage I–III gastric adenocarcinoma were retrospectively enrolled. Those with preoperative low muscle mass, neoadjuvant therapy, or incomplete clinical and imaging data were excluded. Postoperative low muscle mass was diagnosed using L3-level skeletal muscle index based on Asian cutoff criteria. Univariate and multivariate logistic regression analyses were applied to screen independent predictors. Model performance was assessed via ROC curves, calibration curves, and leave-one-out cross-validation (LOOCV).
Results
Among all participants, 17 patients (24.6%) developed postoperative low muscle mass. Preoperative BMI, skeletal muscle area, lymphocyte-monocyte ratio, and surgical method were confirmed as independent influencing factors. The established model yielded an AUC of 0.857, with a sensitivity of 94.1% and specificity of 67.3%, and the LOOCV AUC reached 0.832. Total gastrectomy was linked to a higher risk of low muscle mass compared with partial gastrectomy.
Conclusions
Preoperative BMI, SMA, and LMR can independently predict postoperative low muscle mass in older adult gastric cancer patients. The model shows moderate-to-good predictive performance in this single-center cohort and may help identify high-risk patients preoperatively. Prioritizing partial gastrectomy when oncologically safe and providing preoperative nutritional and exercise support may help reduce muscle loss.
Keywords
1. Introduction
Gastric cancer remains the fifth most common malignant tumor and the third leading cause of cancer-related death worldwide, with a particularly high disease burden in the older adult population (≥60 years). 1 Radical gastrectomy is the standard curative treatment for resectable gastric cancer, but it disrupts gastrointestinal anatomy and physiology, reduces gastric reservoir function, impairs absorption of protein, vitamin B12, and other nutrients, and alters secretion of appetite-regulating hormones such as ghrelin.2,3 These changes increase the risk of malnutrition and skeletal muscle loss in older adult patients. 4
Postoperative low muscle mass affects 20%–40% of older adult patients with gastric cancer and is closely associated with anastomotic leakage, prolonged hospital stay, decreased quality of life, and reduced long-term survival.5,6 Most existing studies focus on the prognostic impact of preoperative low muscle mass, while research on predicting new-onset postoperative low muscle mass remains insufficient. 7 Current prediction models for gastric cancer-related outcomes rarely integrate CT-derived muscle mass parameters or inflammation-immune indicators, leaving an unmet need for risk stratification tools tailored to older adult patients. 8
Early preoperative identification of high-risk patients allows timely interventions such as protein supplementation and resistance training to preserve muscle mass.9,10 Surgical extent may also affect muscle loss: total gastrectomy leads to more severe nutrient malabsorption and stronger inflammatory responses than partial gastrectomy, which may accelerate muscle degradation. 11 However, the independent contribution of surgical method and its interaction with baseline characteristics remain unclear.
This study aimed to: 1) Identify preoperative clinical, anthropometric, and laboratory predictors of low muscle mass at 6 months after surgery in older adult patients with gastric cancer; 2) Develop and internally validate a logistic regression-based prediction model; 3) Explore the relationship between inflammation, muscle mass, and postoperative muscle loss; 4) Compare the risk of low muscle mass among different surgical approaches to support clinical decision-making.
2. Materials and methods
2.1. Study population
This retrospective study enrolled
Inclusion Criteria: 1) Age ≥60 years; 2) American Society of Anesthesiologists (ASA) physical status classification < III 12 ; 3) Pathologically confirmed gastric adenocarcinoma (pTNM stages I–III) with R0 resection; 4) Preoperative (within 1 week) and 6-month postoperative abdominal CT scans available for muscle measurement; 5) No preoperative low muscle mass (SMI > 40.8 cm2/m2 for males, > 34.9 cm2/m2 for females) 13 ; 6) Complete clinical and laboratory data.
Exclusion Criteria: 1) Neoadjuvant chemotherapy, radiotherapy, or targeted therapy; 2) Metastatic, recurrent, or residual gastric cancer; 3) Previous gastrectomy or enterectomy; 4) Incomplete imaging or laboratory data.
2.2. Data collection
2.2.1. Baseline characteristics
Age, sex, smoking, drinking, comorbidities (hypertension, diabetes, chronic obstructive pulmonary disease [COPD]), pTNM stage (AJCC 8th edition), 14 surgical method (total, proximal, distal gastrectomy), and postoperative hospital stay were collected.
2.2.2. Nutritional and laboratory indicators
Body mass index (BMI) was calculated as weight (kg)/height 2 (m2). 15 The Controlling Nutritional Status (CONUT) score was used to evaluate nutritional status. 16 Routine blood tests included albumin, prealbumin, hemoglobin, C-reactive protein (CRP), creatinine, lymphocytes, monocytes, etc. The lymphocyte-monocyte ratio (LMR) was calculated.
2.2.3. Muscle mass measurement
L3-level skeletal muscle area (SMA) and psoas major muscle area (PMMA) were measured on abdominal CT using ImageJ software. The skeletal muscle index (SMI) was calculated as SMA (cm2)/height 2 (m2).17,18 Two experienced radiologists performed measurements independently; the intraclass correlation coefficient (ICC) was 0.92, indicating good consistency.
2.3. Statistical analysis
Data were analyzed using SPSS 21.0 and GraphPad Prism 9.0. Continuous variables were expressed as mean ± standard deviation or median (interquartile range). Categorical variables were expressed as case numbers and percentages. Univariate analysis was performed using t-test, Mann-Whitney U test, or χ2 test. Variables with P<0.1 were entered into multivariate logistic regression. The model was evaluated using ROC curves, calibration curves, and LOOCV.19,20 A two-sided P<0.05 was considered statistically significant.
3. Results
3.1. Baseline characteristics
Baseline characteristics and univariate comparison between patients with and without postoperative low muscle mass.
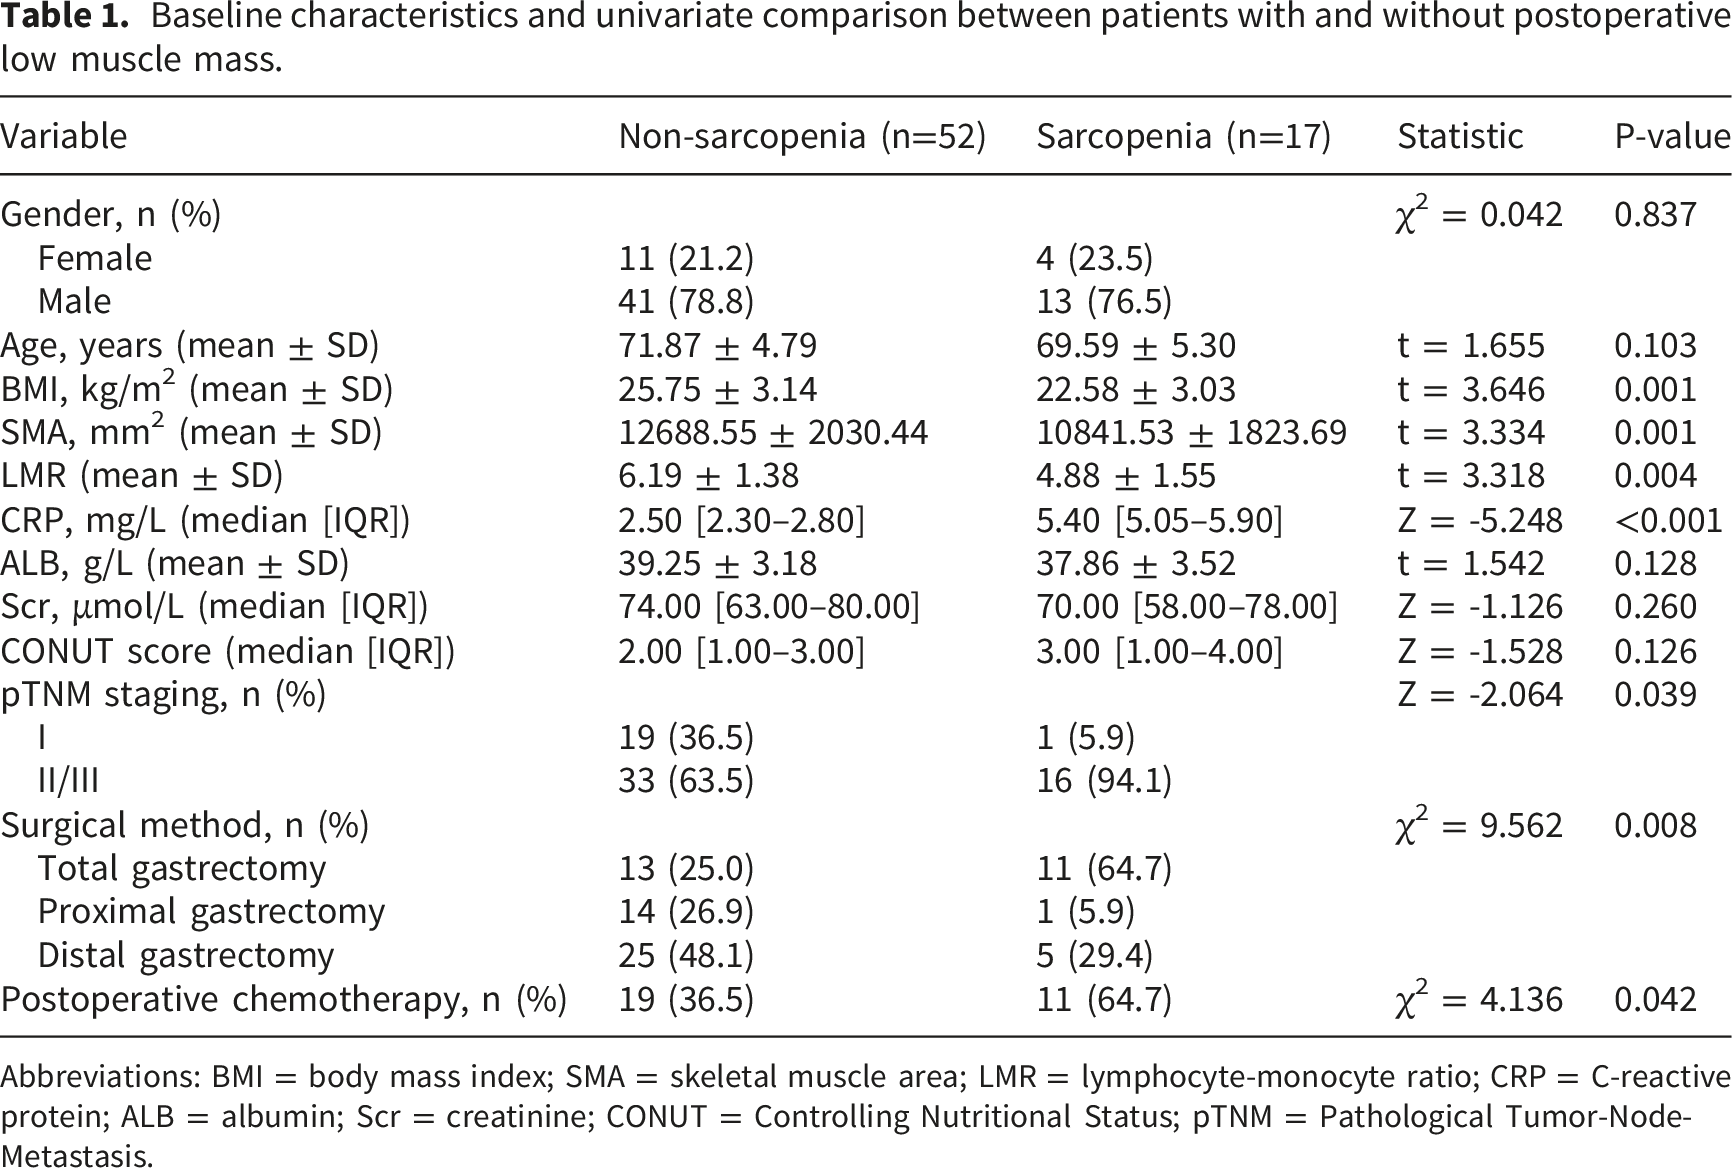
Abbreviations: BMI = body mass index; SMA = skeletal muscle area; LMR = lymphocyte-monocyte ratio; CRP = C-reactive protein; ALB = albumin; Scr = creatinine; CONUT = Controlling Nutritional Status; pTNM = Pathological Tumor-Node-Metastasis.
3.2. Predictors of postoperative low muscle mass
Multivariate logistic regression analysis of independent predictors for postoperative low muscle mass.
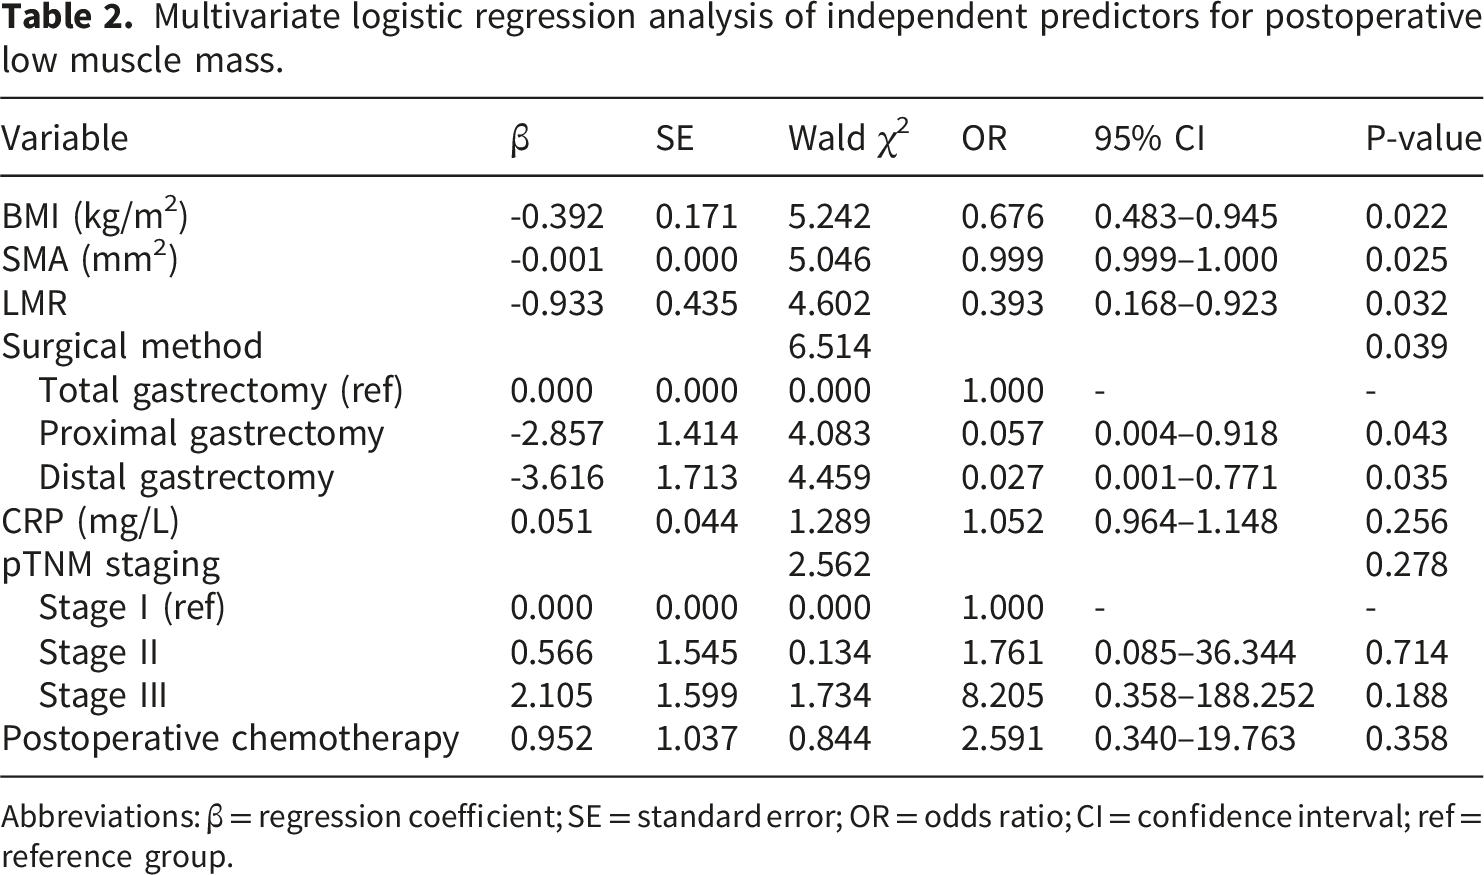
Abbreviations: β = regression coefficient; SE = standard error; OR = odds ratio; CI = confidence interval; ref = reference group.
3.3. Development and validation of the prediction model
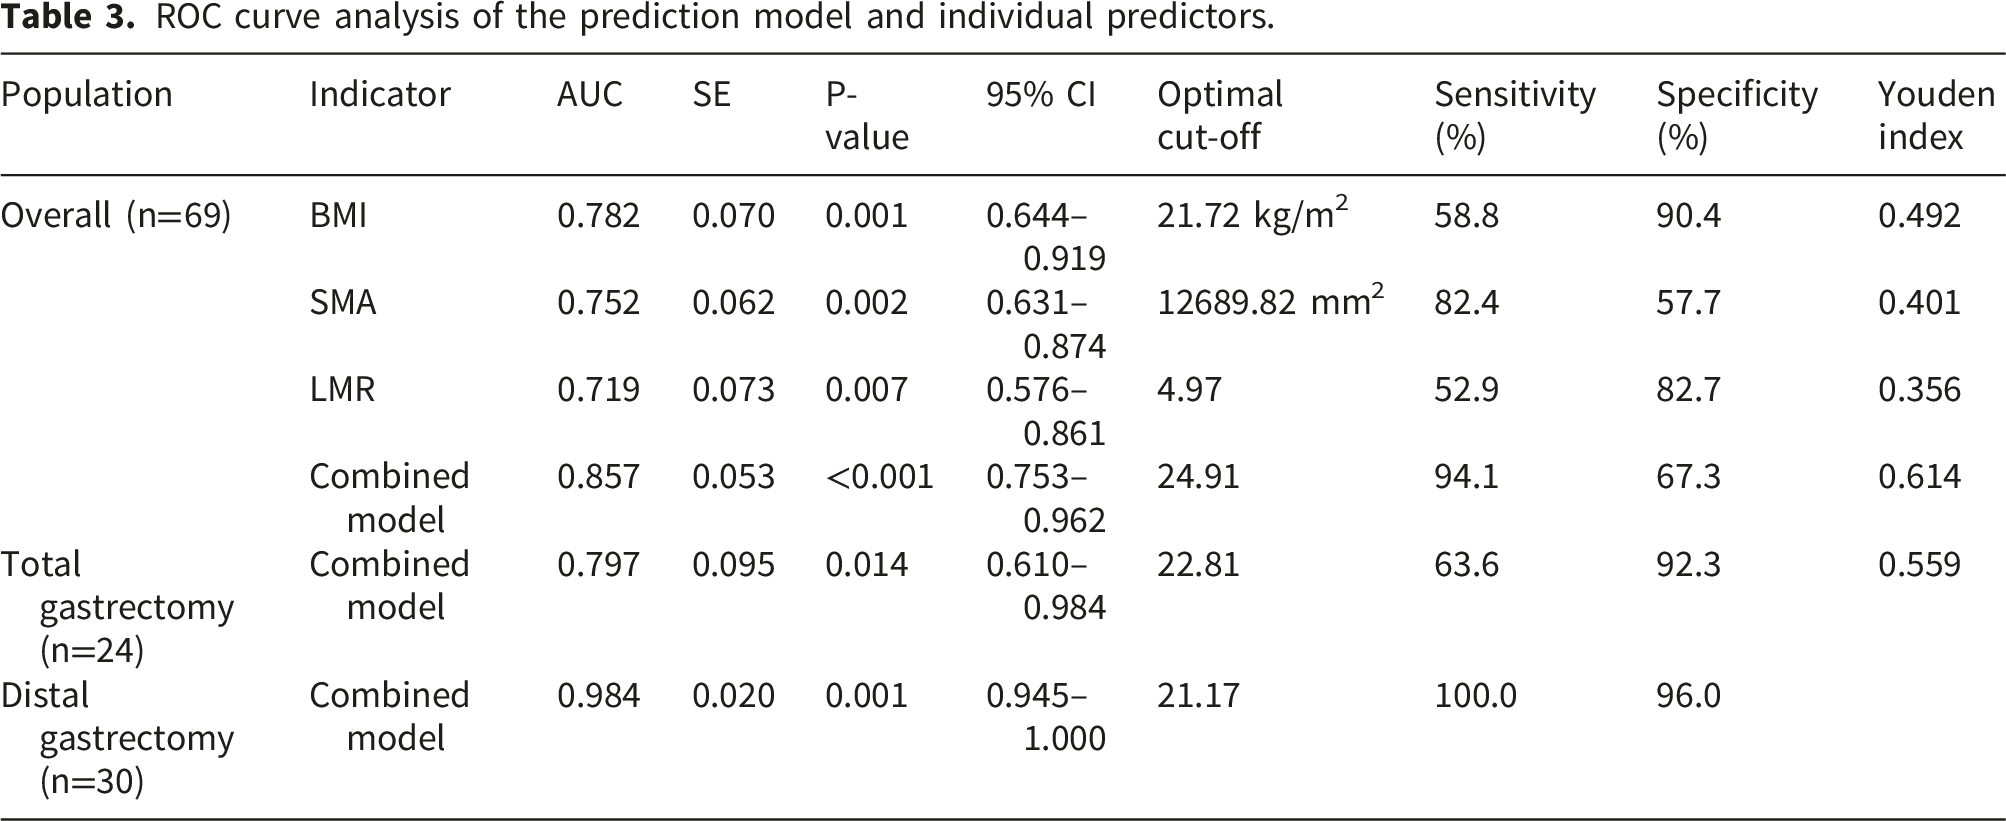
Multivariate analysis identified three continuous independent predictors: BMI, SMA, and LMR. A simplified clinical prediction model was constructed: P = 0.356×BMI + 0.001×SMA + 0.599×LMR. To ensure reproducibility, the full logistic regression equation including intercept and dummy-coded surgical method is reported: Logit(P) = −15.236 + 0.356×BMI + 0.001×SMA + 0.599×LMR − 2.864×Proximal − 3.296×Distal. ROC curve analysis for the overall cohort is presented in Figure 1(a). ROC curve analysis for the overall cohort is presented in Figure 1(a). The model AUC was 0.857 (95%CI: 0.753–0.962, P<0.001), cut-off 24.91, sensitivity 94.1%, specificity 67.3%. The Hosmer–Lemeshow test indicated good calibration (χ2=5.236, P=0.682, Figure 2(a)). LOOCV AUC was 0.832. ROC curves of the prediction model (a) Overall population (n=69): AUC = 0.857 (95% CI: 0.753–0.962, P < 0.001). (b) Total gastrectomy subgroup (n=24): AUC = 0.797 (95% CI: 0.610–0.984, P = 0.014). (c) Distal gastrectomy subgroup (n=30): AUC = 0.984 (95% CI: 0.945–1.000, P = 0.001). The dashed line represents the reference (AUC = 0.5). Calibration curves of the prediction model (a) Overall population (n=69): Hosmer-Lemeshow test, χ2 = 5.236, P = 0.682. (b) Total gastrectomy subgroup (n=24): Hosmer-Lemeshow test, χ2 = 4.182, P = 0.524. (c) Distal gastrectomy subgroup (n=30): Hosmer-Lemeshow test, χ2 = 1.836, P = 0.870. The solid line represents the ideal calibration (predicted probability = actual probability). The dashed line represents the model’s calibration.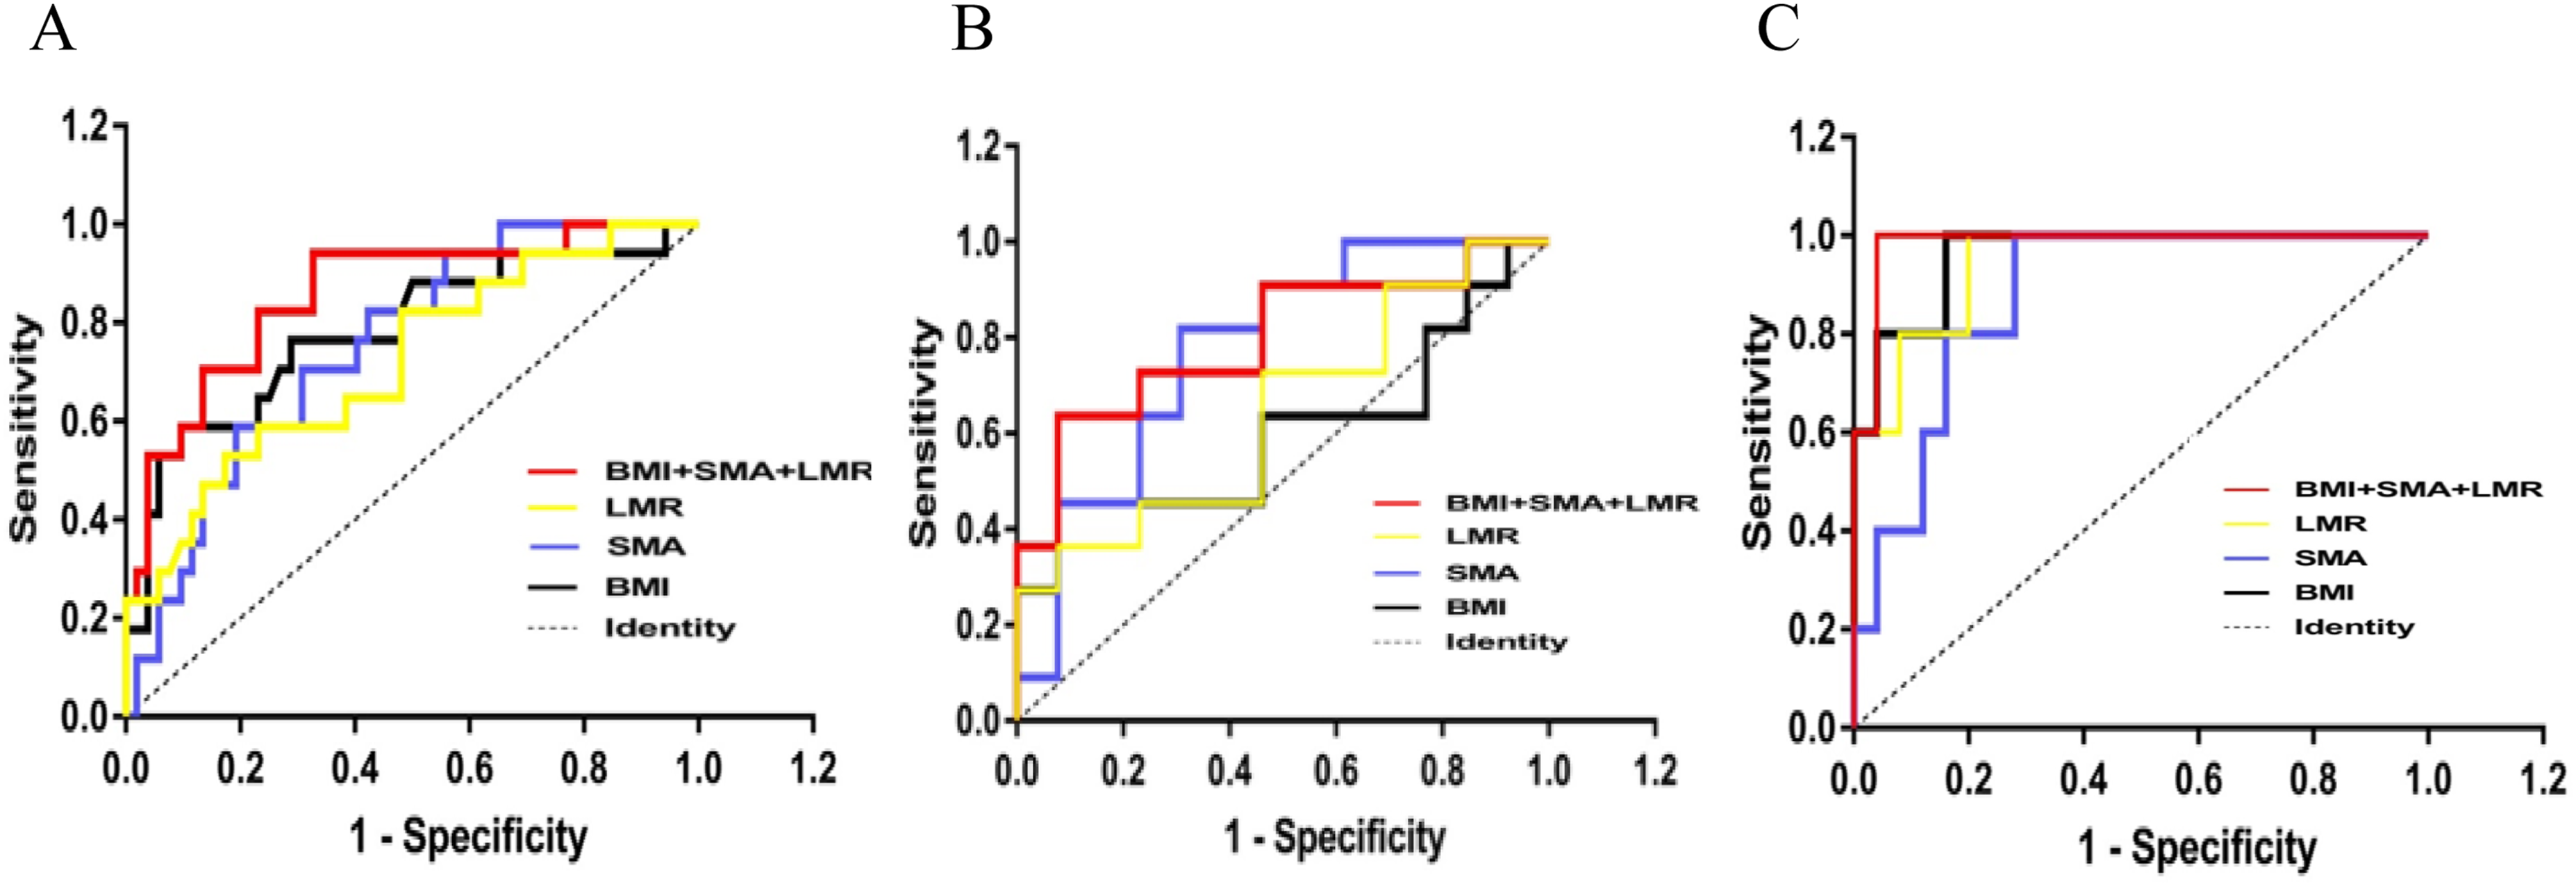
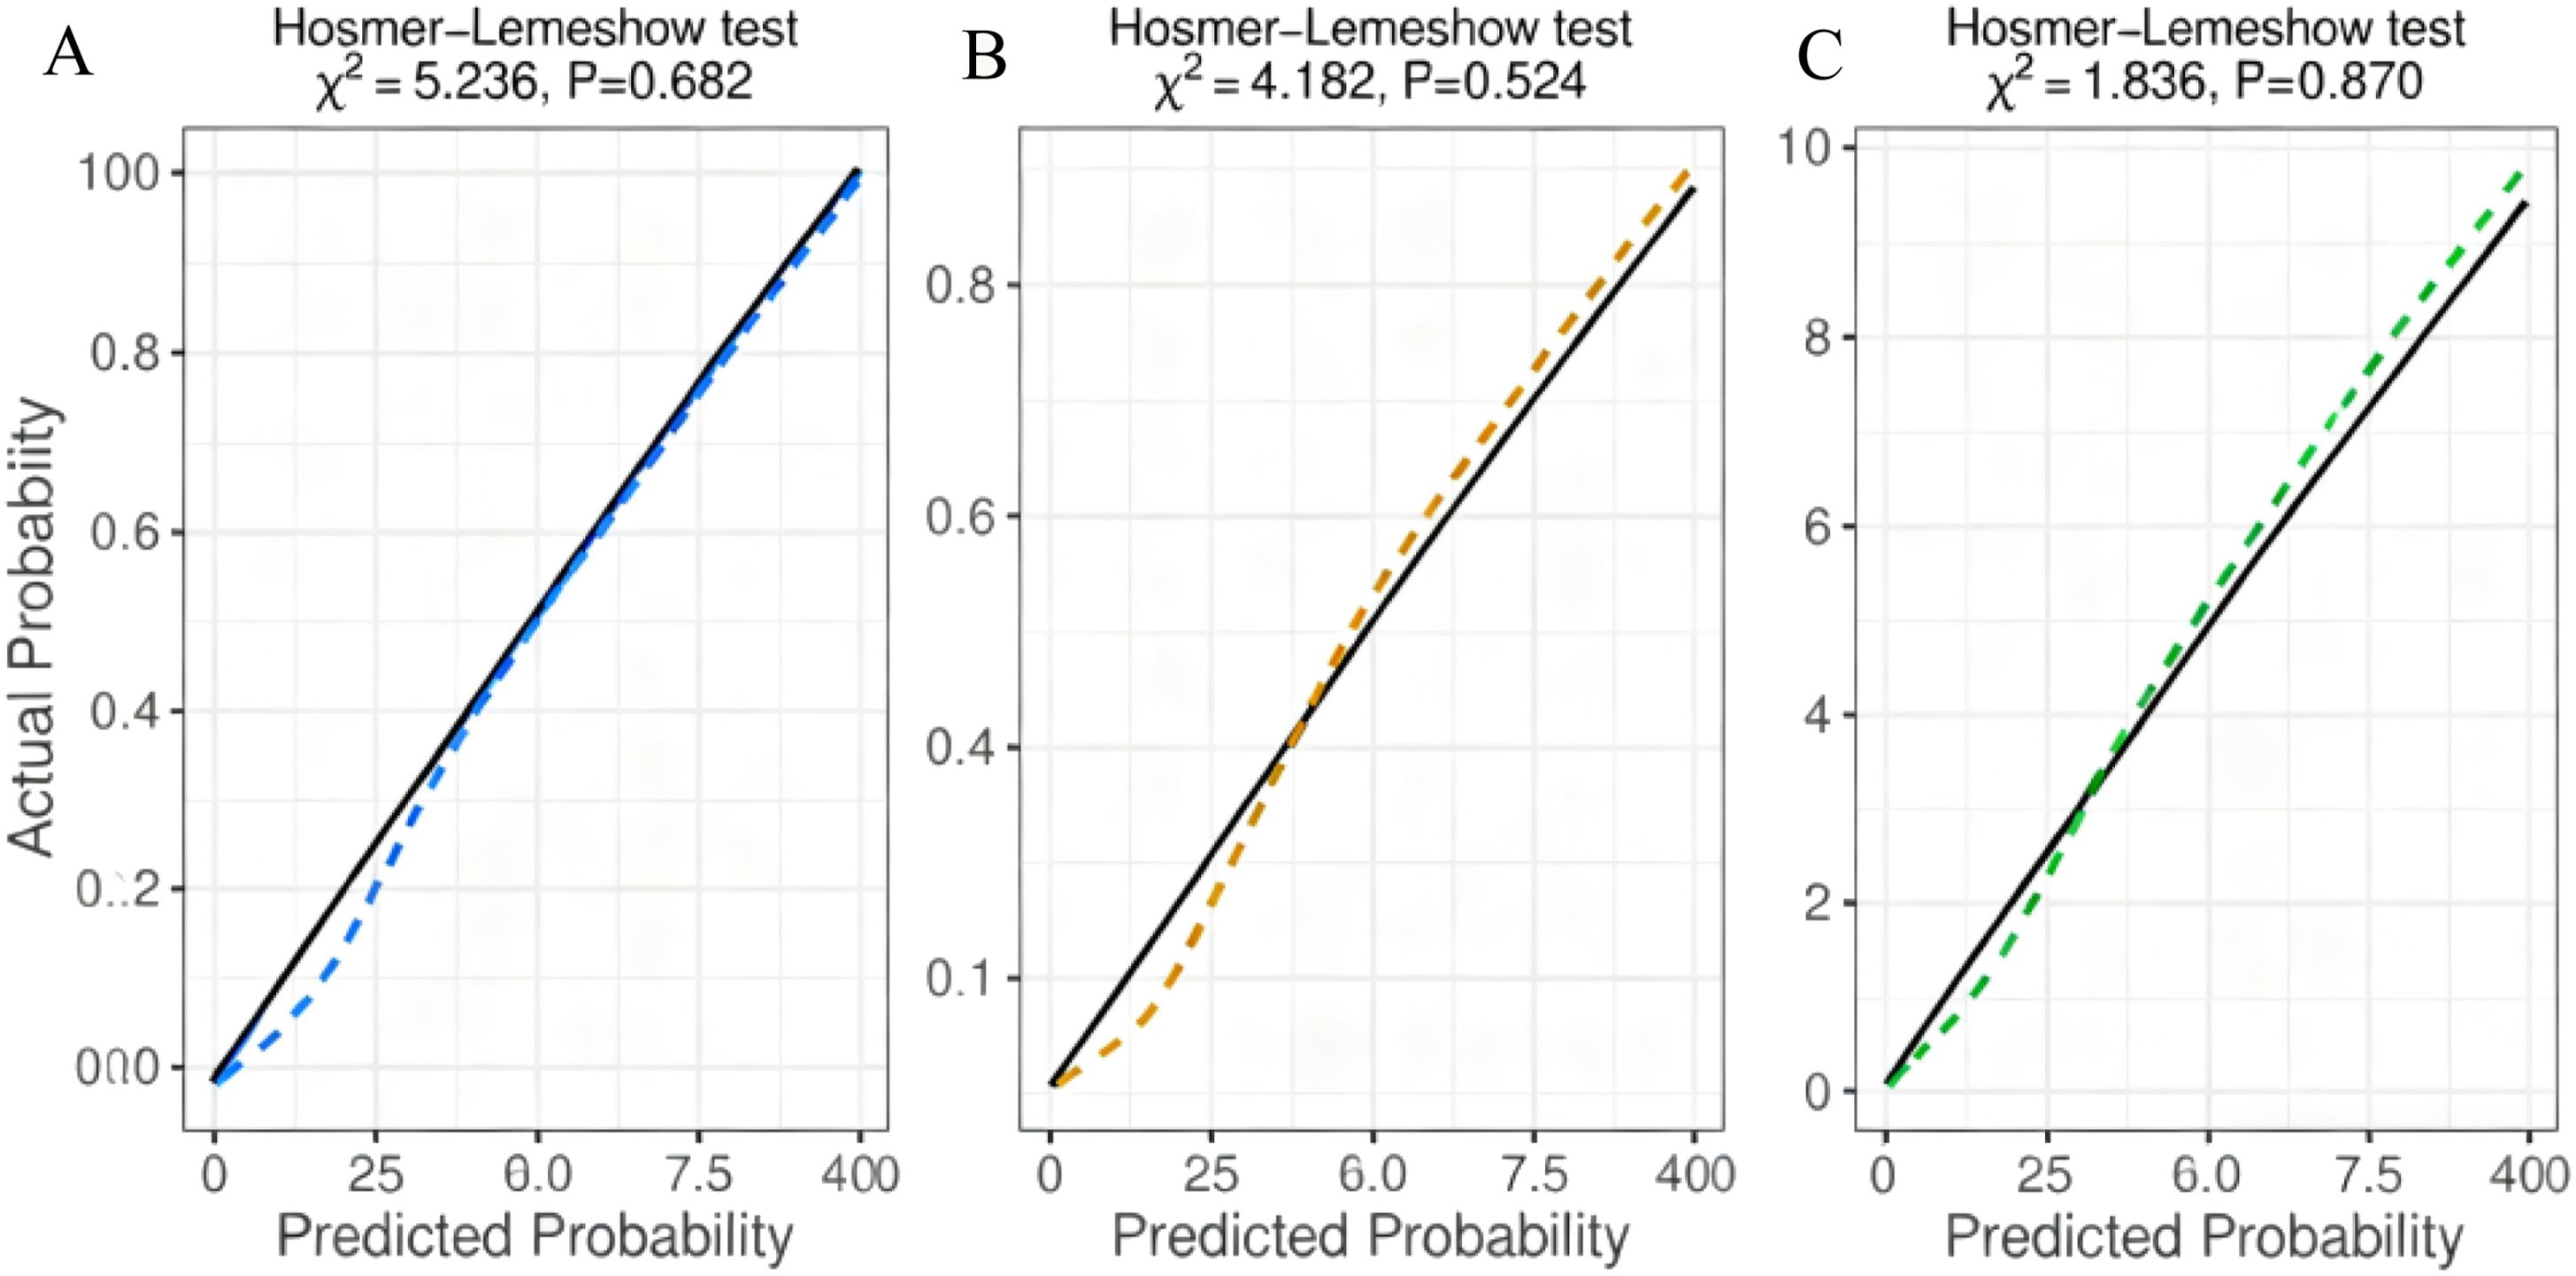
ROC curve analysis of the prediction model and individual predictors.
3.4. Postoperative changes in muscle and inflammatory markers
At 6 months postoperatively, all groups presented increased CRP, decreased creatinine and reduced LMR. The total gastrectomy group had the lowest psoas major muscle area (PMMA), indicating more severe central muscle loss. Postoperative PMMA differed significantly among three surgical approaches, while other muscle and inflammatory indices showed no significant intergroup differences.
4. Discussion
This study developed and internally validated a preoperative prediction model for 6-month postoperative low muscle mass in older adult patients with gastric cancer using three routinely available indicators: BMI, SMA, and LMR. The model showed moderate-to-good predictive performance in this single-center cohort. Total gastrectomy was an independent risk factor, supporting the choice of partial gastrectomy when oncologically feasible.
4.1. Key predictors
BMI reflects nutritional reserve; low BMI is associated with insufficient protein intake and reduced muscle synthesis.22,23 SMA directly quantifies baseline muscle mass and is a reliable prognostic marker in gastric cancer.24,25 LMR reflects immune-inflammatory status: high LMR indicates anti-inflammatory balance and reduced muscle breakdown.26–28 Total gastrectomy causes more severe ghrelin deficiency, nutrient malabsorption, and inflammatory stress, leading to greater muscle loss.3,29,30
4.2. Model application
The simplified formula enables rapid preoperative risk calculation. Patients with scores ≤24.91 may benefit from preoperative high-protein supplementation (1.2–1.5 g/kg/d) and resistance training.31,32 Partial gastrectomy should be preferred when tumor location and stage permit. 33
4.3. Limitations
5. Conclusions
Preoperative BMI, SMA, and LMR are independent predictors of postoperative low muscle mass in older adult patients with gastric cancer. The prediction model shows moderate-to-good performance in this single-center cohort and may help identify high-risk patients preoperatively. Total gastrectomy increases the risk of muscle loss. These findings are hypothesis-generating and require prospective validation before widespread clinical use.
Footnotes

Ethical considerations
This study was conducted in accordance with the Declaration of Helsinki and approved by the Ethics Committee of The Second Affiliated Hospital of Soochow University (No. 2021-068). The institutional ethics review board granted a formal waiver of written informed consent for all participants. The waiver was justified based on the retrospective, non-interventional nature of the research: all analyzed data were fully de-identified to eliminate patient identifiable information, and no additional clinical interventions, physical examinations, or direct patient contact were performed for this study.
Consent to participate
The institutional ethics review board granted a formal waiver of written informed consent for all participants. The waiver was justified based on the retrospective, non-interventional nature of the research: all analyzed data were fully de-identified to eliminate patient identifiable information, and no additional clinical interventions, physical examinations, or direct patient contact were performed for this study.
Author contributions
Linfang Li and Rong Zhang: Data curation, formal analysis, writing – original draft; Yuexuan Liu, Bai Li, Zhihui Zhang, Han Sun: Data collection, statistical analysis, visualization; Shuhua Wu: Conceptualization, methodology, supervision, writing – review and editing, funding acquisition.
Funding
The authors disclosed receipt of the following financial support for the research, authorship, and/or publication of this article: This study was supported by the Jiangsu Geriatric Health Research Project (LKZ2023007), Pre-research Fund of The Second Affiliated Hospital of Soochow University (SDFEYGZ2219), and Key Supported Medicine Discipline of Suzhou: Geriatrics (SZFCXK302113).
Declaration of conflicting interests
The authors declared no potential conflicts of interest with respect to the research, authorship, and/or publication of this article.