
Abstract
Purpose:
To examine the relationship between deprivation and upper tract calculus formation, and provide a contemporary estimate of the incidence of upper urinary tract stone disease.
Methods:
A retrospective review of hospital episodes for patients presenting to our institution with upper urinary tract stone disease in a 3-year period between 2010 and 2014. Incidence of stone disease was calculated and stratified according to deprivation, as measured by the index of multiple deprivation (IMD) and its subdomains. Poisson regression was used to model the relationship between deprivation and stone disease.
Results:
The overall incidence of upper urinary tract stone disease was 115 patients/100,000 person-years (95% confidence interval (CI) 108–122 per 100,000 person-years). There is a link between the IMD (as well as a number of its subdomains) and stone disease. The rate of incident stone disease was 50.6% higher in the most deprived quintile of the IMD when compared to the least deprived (p < 0.001). Multivariate Poisson regression found that education, skills and training deprivation was the subdomain that predicted stone disease most strongly, with the incidence rate ratio being 1.15 (95% CI 1.053–1.261) for each increase in quintile.
Conclusion:
This study provides a contemporary measure of the incidence of upper urinary tract stone disease derived from a population in the Midlands of England. It informs our understanding of the link between types of deprivation and stone occurrence.
Level of evidence:
2b
Introduction
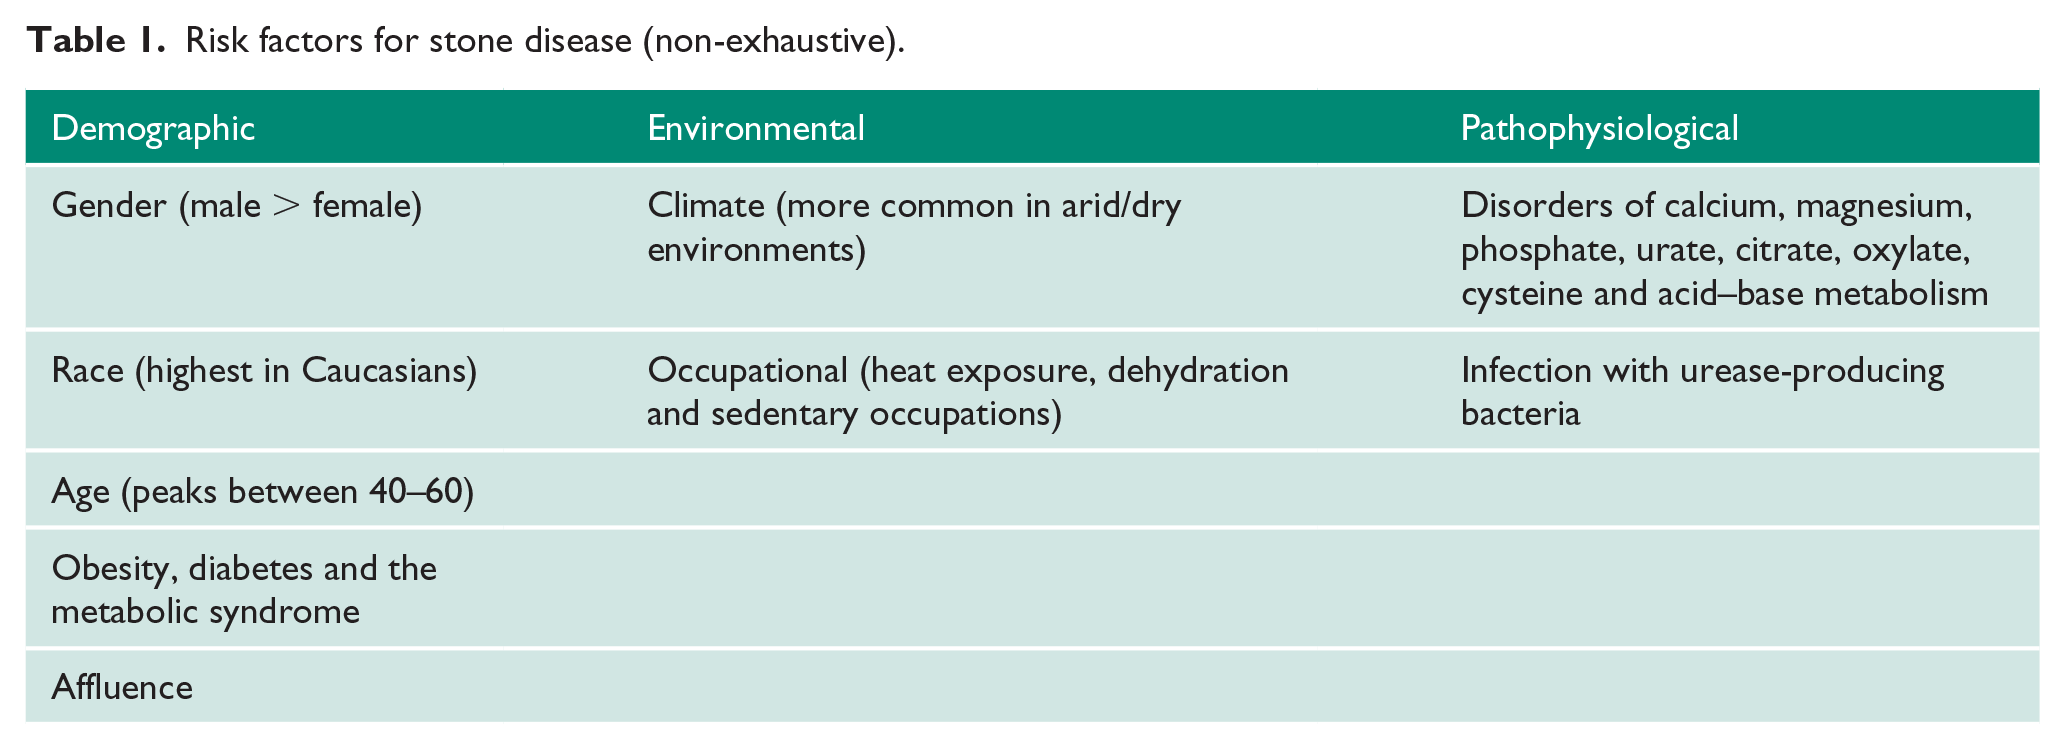
Upper urinary tract stone disease is a common condition. A UK study from 1987 estimated incidence at 28/100,000 person-years (py). 1 More recent estimates of incidence in the UK are difficult to find. Recent studies looking at European rates have shown incidence of 138/100,000 py 2 in Iceland and as high as 720/100,00 py 3 in Germany. Risk factors for stone disease can be categorised as demographic, environmental and pathophysiological (see Table 1). In the latter half of the last century, Robertson et al. demonstrated that affluence was associated with a higher risk of stone disease.4,5 They used a postal survey of the population Leeds, England to study 160 male idiopathic calcium stone formers. They surveyed factors including socioeconomic class, diet history and expenditure on food.
Risk factors for stone disease (non-exhaustive).
One might infer that deprived populations have lower rates of stone disease. However, deprivation is not the absence of affluence. For instance, an area may have few individuals on high incomes (low affluence) and also have few individuals on low incomes (low deprivation). Therefore, we aimed to explore the association between deprivation and stone disease.
Methods
Geographical area
In order to define a population in which individuals with stone disease would be treated at our hospital and not another unit, we restricted the geographical extent of our study to an area where we would expect a patient to be admitted to our unit.
We considered the geographical area for which the distance to our hospital is at most one-half of the distance to the next nearest hospital with urology services. This area was subdivided into Lower Layer Super Output Areas (LSOAs), which are defined by the UK Office for National Statistics as ‘homogenous small areas of relatively even size (around 1500 people)’. 6
Measure of deprivation
The index of multiple deprivation (IMD) is based on the assumption that deprivation is comprised of a number of domains of deprivation that can be recognised and measured separately. It is the official measure of relative deprivation for small areas in England used by the English government. The index is used commonly in health research in the UK. The IMD is a combination of seven domains: (a) income deprivation: measuring the proportion of adults who are deprived due to low income; (b) employment deprivation: looking at those of working age involuntarily excluded from the labour market; (c) health deprivation and disability: measuring premature death and poor health (both mental and physical); (d) education, skills and training deprivation: comprising school attainment, absence from school, staying on for post-16 education, entry into higher education, adult skills and English language proficiency; (e) barriers to housing and services (such as a General Practitioner, supermarket, primary school or post office); (f) crime (including violence, burglary, theft and criminal damage); and living environment deprivation (including for instance: air quality, road traffic accidents and houses without central heating).
The level of each of these deprivation domains is calculated at the LSOA level by the Department for Communities and Local Government. These are then assigned a weighting and combined. For each LSOA, an associated level of deprivation is described by its IMD score, with a higher score indicating greater deprivation.
Study population
English hospitals collect data related to patient diagnoses by using International Classification of Diseases, 10th edition codes. All patients aged 16 and older, living within the geographical area defined above, attending our hospital with one or more episode coded N20.0 (calculus of kidney) or N20.1 (calculus of ureter) in the 4 years between 1 January 2010 and 1 January 2014 were identified. These individuals formed our study population. The LSOA in which each patient lived was identified. For each LSOA an IMD score was obtained, and so an IMD score was associated with each patient.
Statistical analysis
Statistical analysis was carried out using R. 7 Income and employment deprivation scores relate to the proportion of the population experiencing that type of deprivation. As such, these subdomains were treated as continuous for regression analysis. The remaining subdomains and the IMD itself do not relate straightforwardly to the proportion of the population experiencing deprivation. It is common practice to divide these measures into ranked quintiles, as we have. A Poissonness plot was used to visually confirm the appropriateness of a Poisson model. Multivariate Poisson regression was used to investigate the association between subdomains of deprivation and stone occurrence, using both forward and backward stepwise techniques to fit the most appropriate model. The non-parametric Kruskal–Wallis test was used to test if the occurrence of stones varied according to the quintiles of the IMD or its subdomains. Exact rate ratio tests were used to compare rates between two groups.
Results
In total, 166 LSOAs were identified as meeting our geographical criterion. A total of 1014 patients aged ⩾16 were identified as having a renal or ureteric calculus from a parent population of 220,239 living within these LSOAs, giving a crude incidence of 115 patients/100,000 py (95% confidence interval 108–122/100,000 py).
The distribution of incident cases of stones, and how the IMD and its subdomains are distributed geographically are shown in the maps in Figure 1. Hotter colours represent higher levels of deprivation or a higher incidence of stone disease.
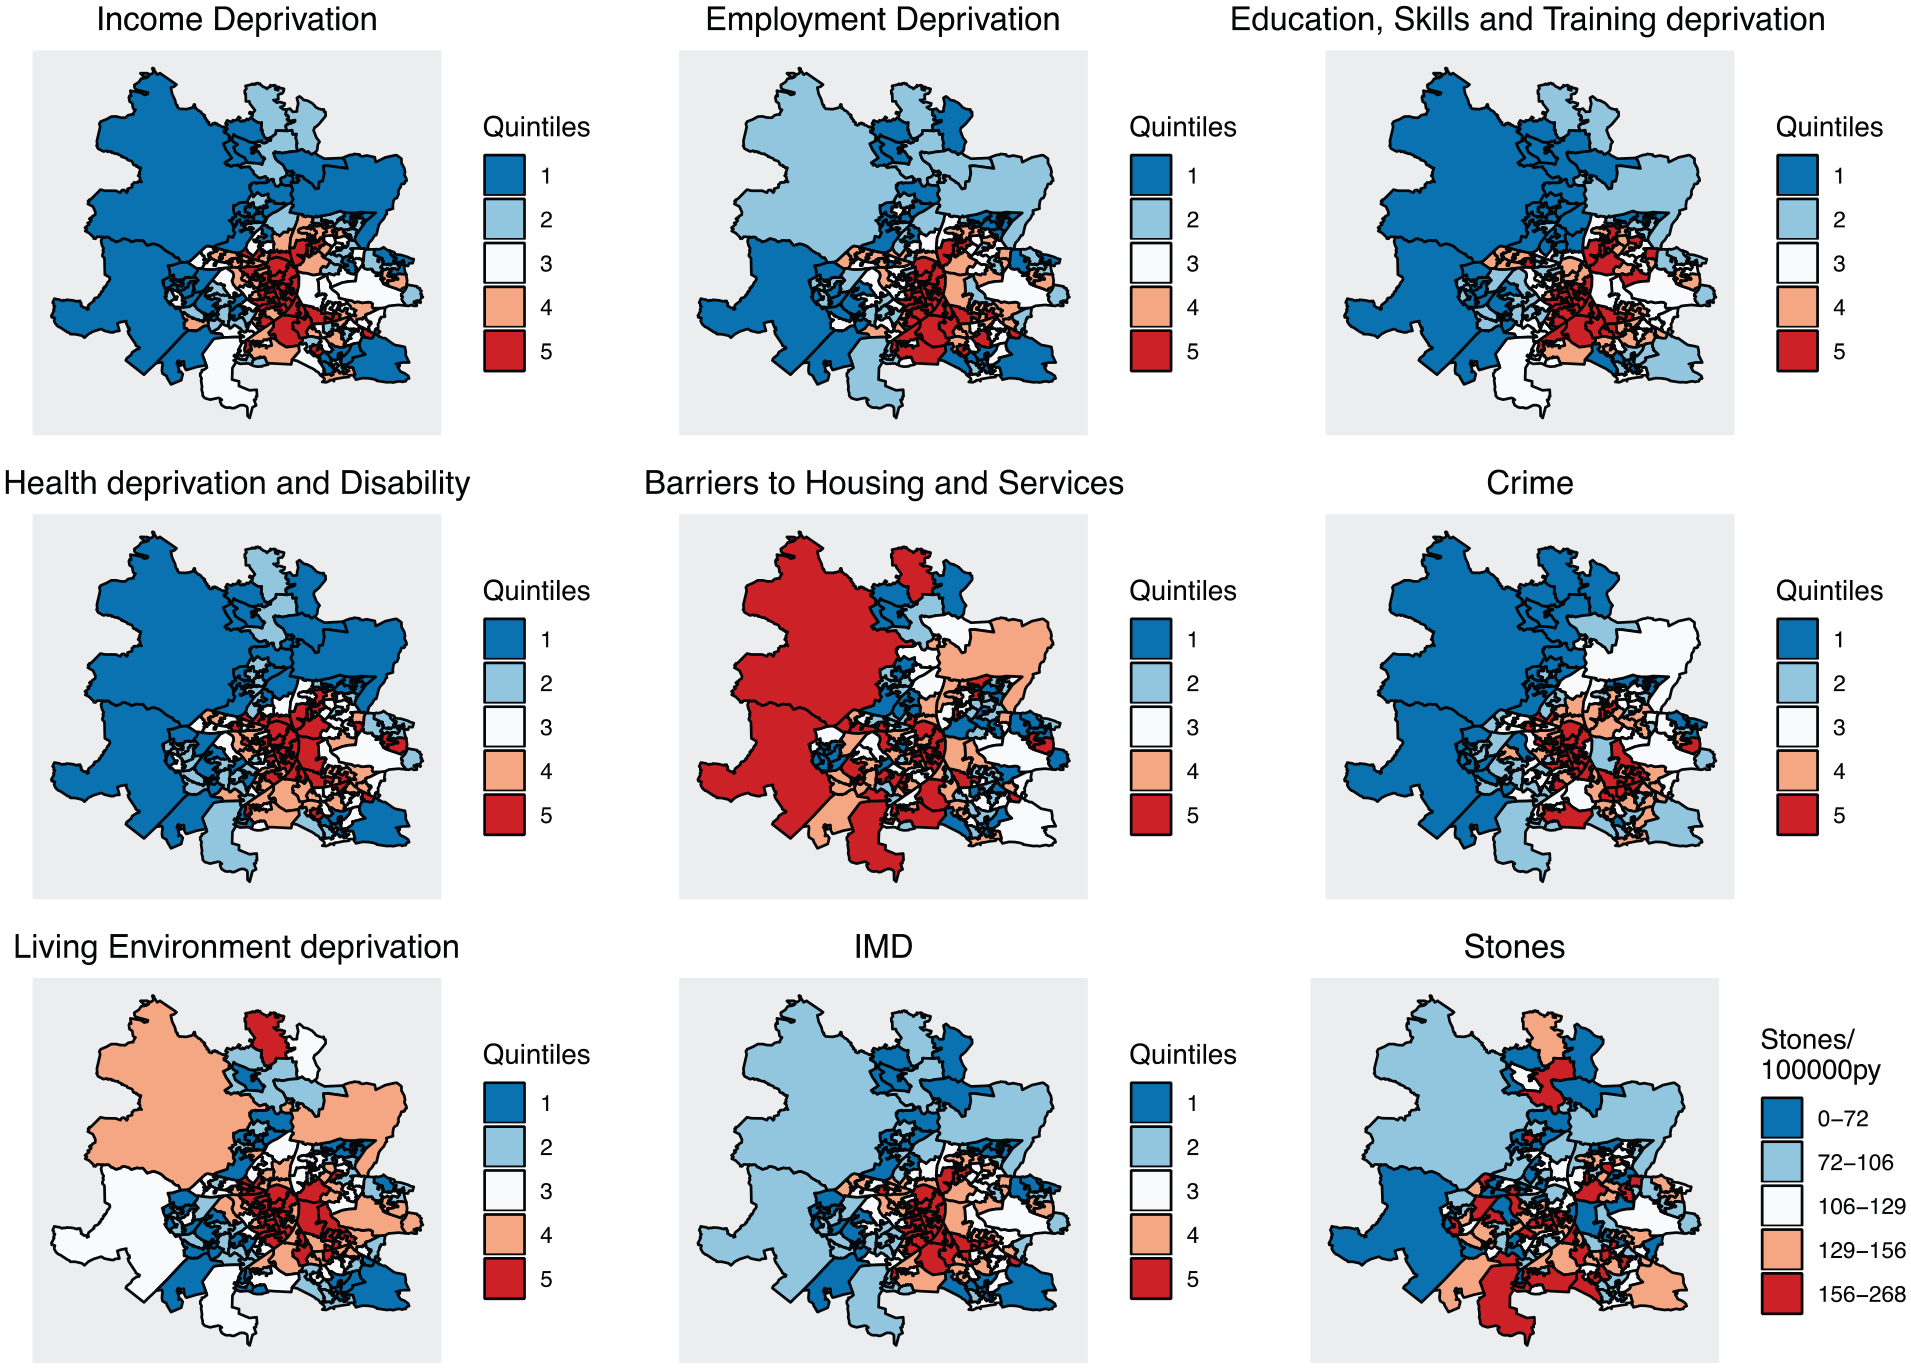
Maps showing the geographical distribution of the index of multiple deprivation, its subdomains and stone occurrence.
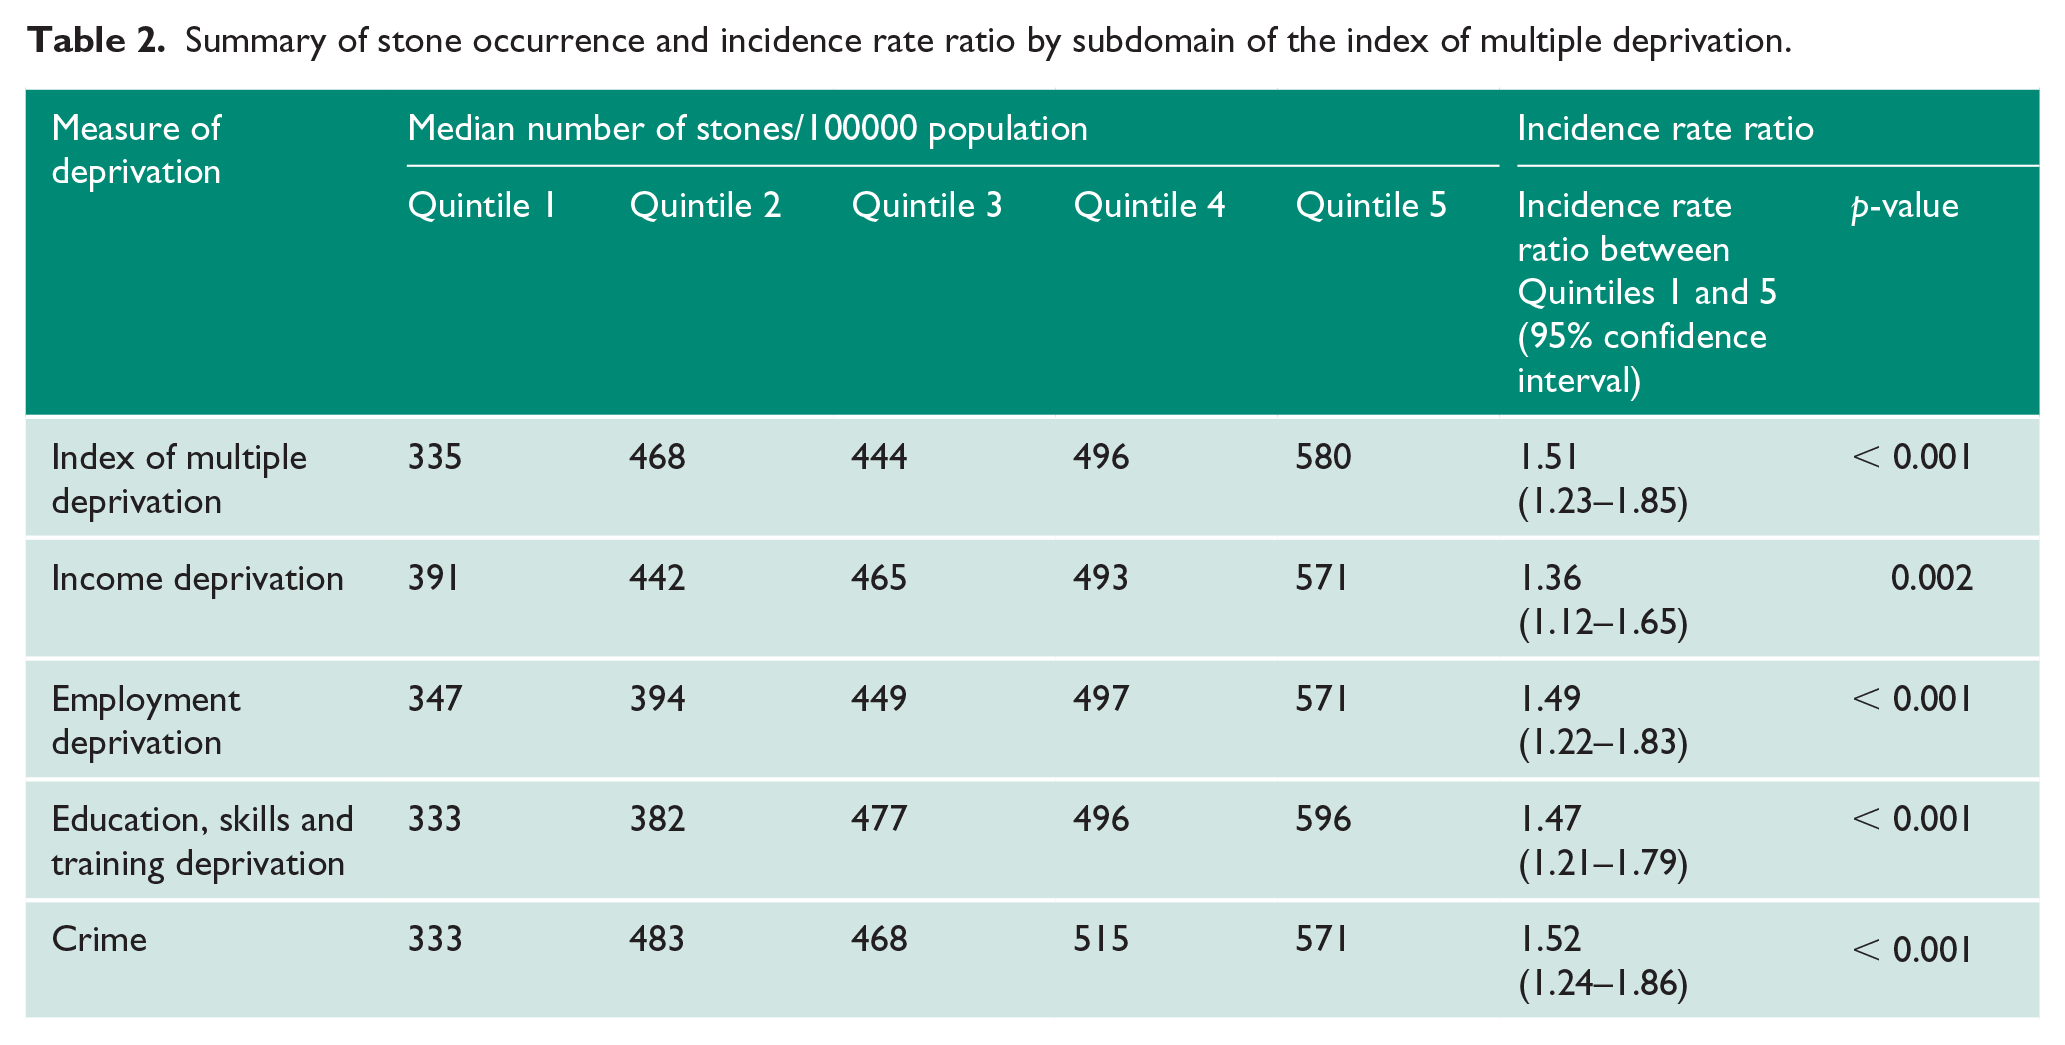
Figure 2 shows box and whisker plots for the incidence of stone disease according to the IMD and its subdomains. The non-parametric Kruskal–Wallis test showed a significant association between stone occurrence and the IMD, income deprivation, employment deprivation, education skills and training deprivation, and the crime domain. The box and whisker plots for these subdomains show a generally increasing rate of stone disease with higher deprivation. Stone occurrence in these subdomains is summarised in Table 2 along with the incidence rate ratio when comparing the least and most deprived quintiles and the associated p-value for the exact rate ratio test assuming Poisson counts.
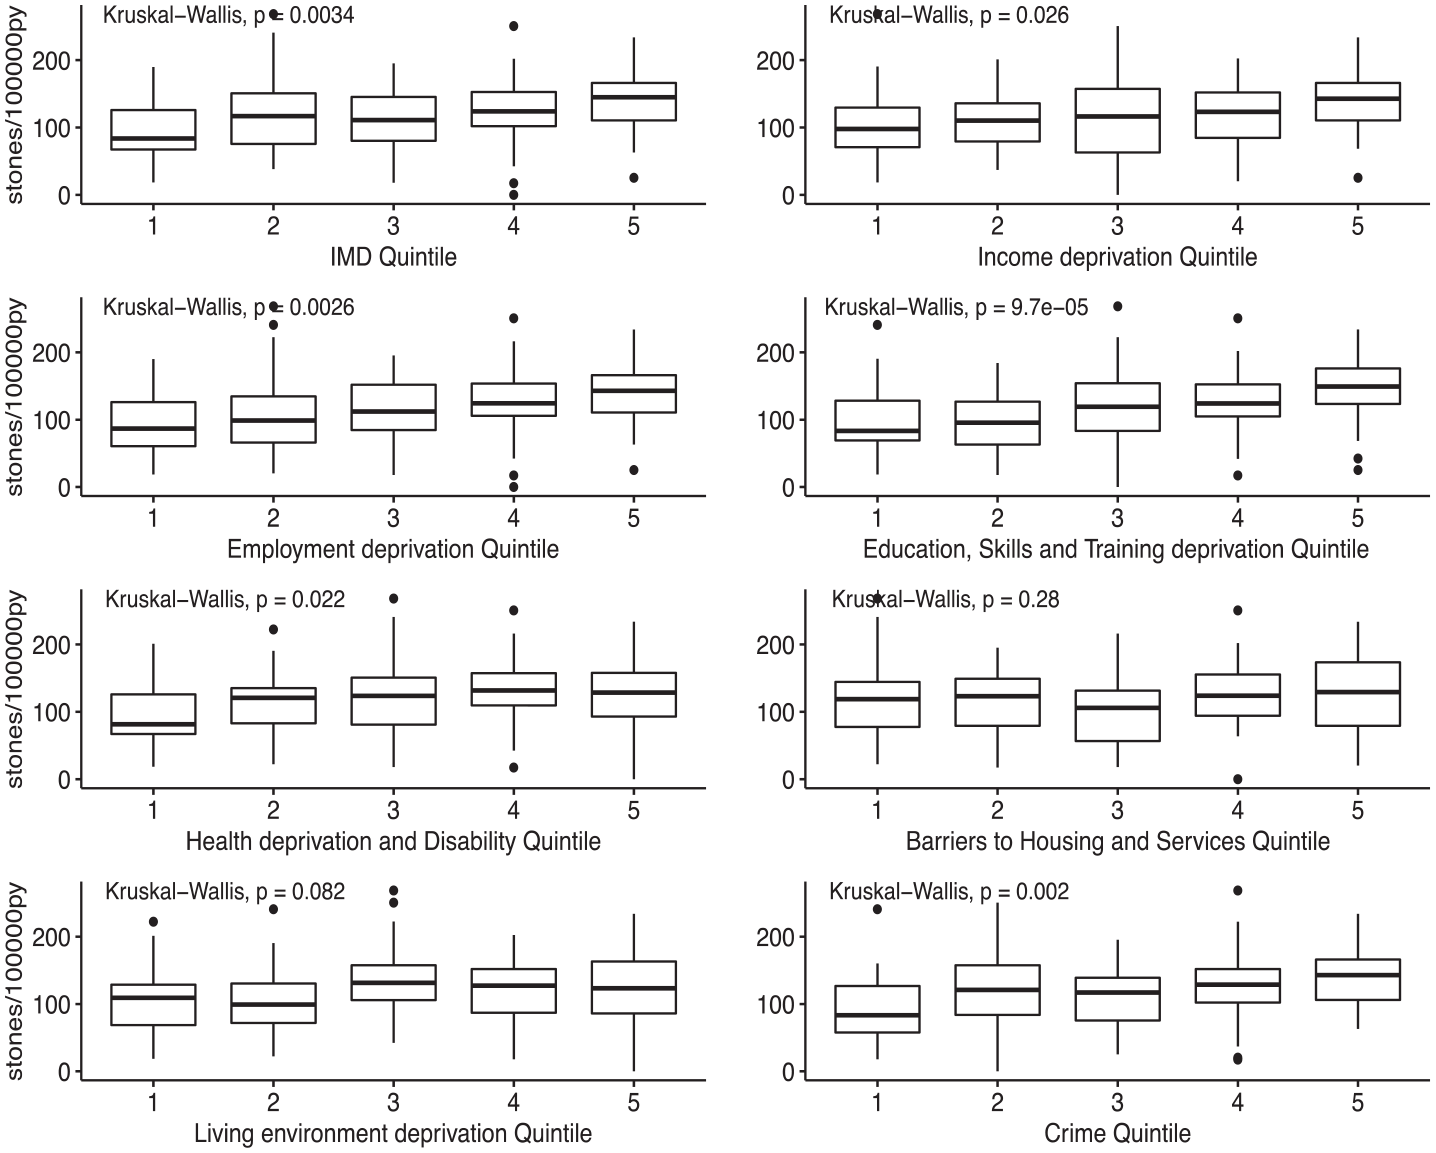
Box plots of stone incidence by the index of multiple deprivation and its subdomains.
Summary of stone occurrence and incidence rate ratio by subdomain of the index of multiple deprivation.
Before performing uni- and multivariate Poisson regression, three methods were used to check that the assumption of a Poisson distribution was reasonable. Firstly, a Poissonness plot for our data is shown in Figure 3, suggesting that the choice of a Poisson model was not unreasonable. Secondly, the average number of stones per LSOA was 6.11 and the variance was 7.67. That these values lie close to each other favours the use of a Poisson model. Finally, a goodness of fit test using the minimum chi-squared method shows no evidence for the rejection of the hypothesis that the data is Poisson (p = 0.063).
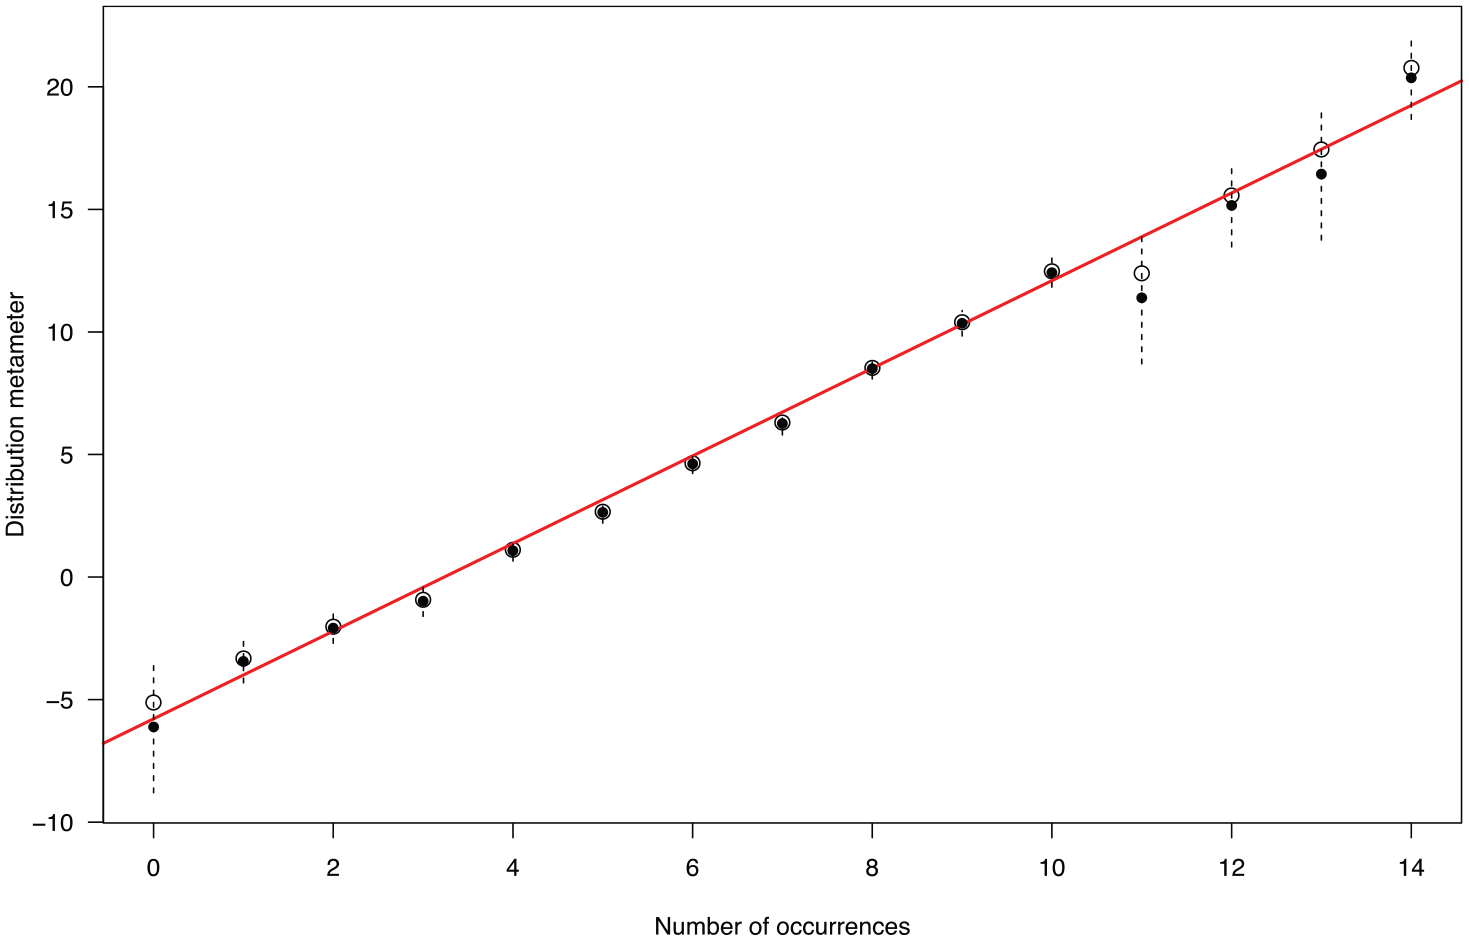
Poissonness plot.
For regression, all parameters except income and employment deprivation were fitted as ordered categorical variables. Income and employment were fitted as continuous variables ranging from a minimum of 0 to a maximum of 5. A range of 0–5 was used to allow the incidence rate ratio estimates to be comparable between these continuous variables and those treated as ranked quintiles.
The saturated and univariate models are summarised in Table 3. The IMD is not included in the saturated model as it is a linear combination of the other predictor variables.
Summary of multivariate and univariate Poisson regression models.
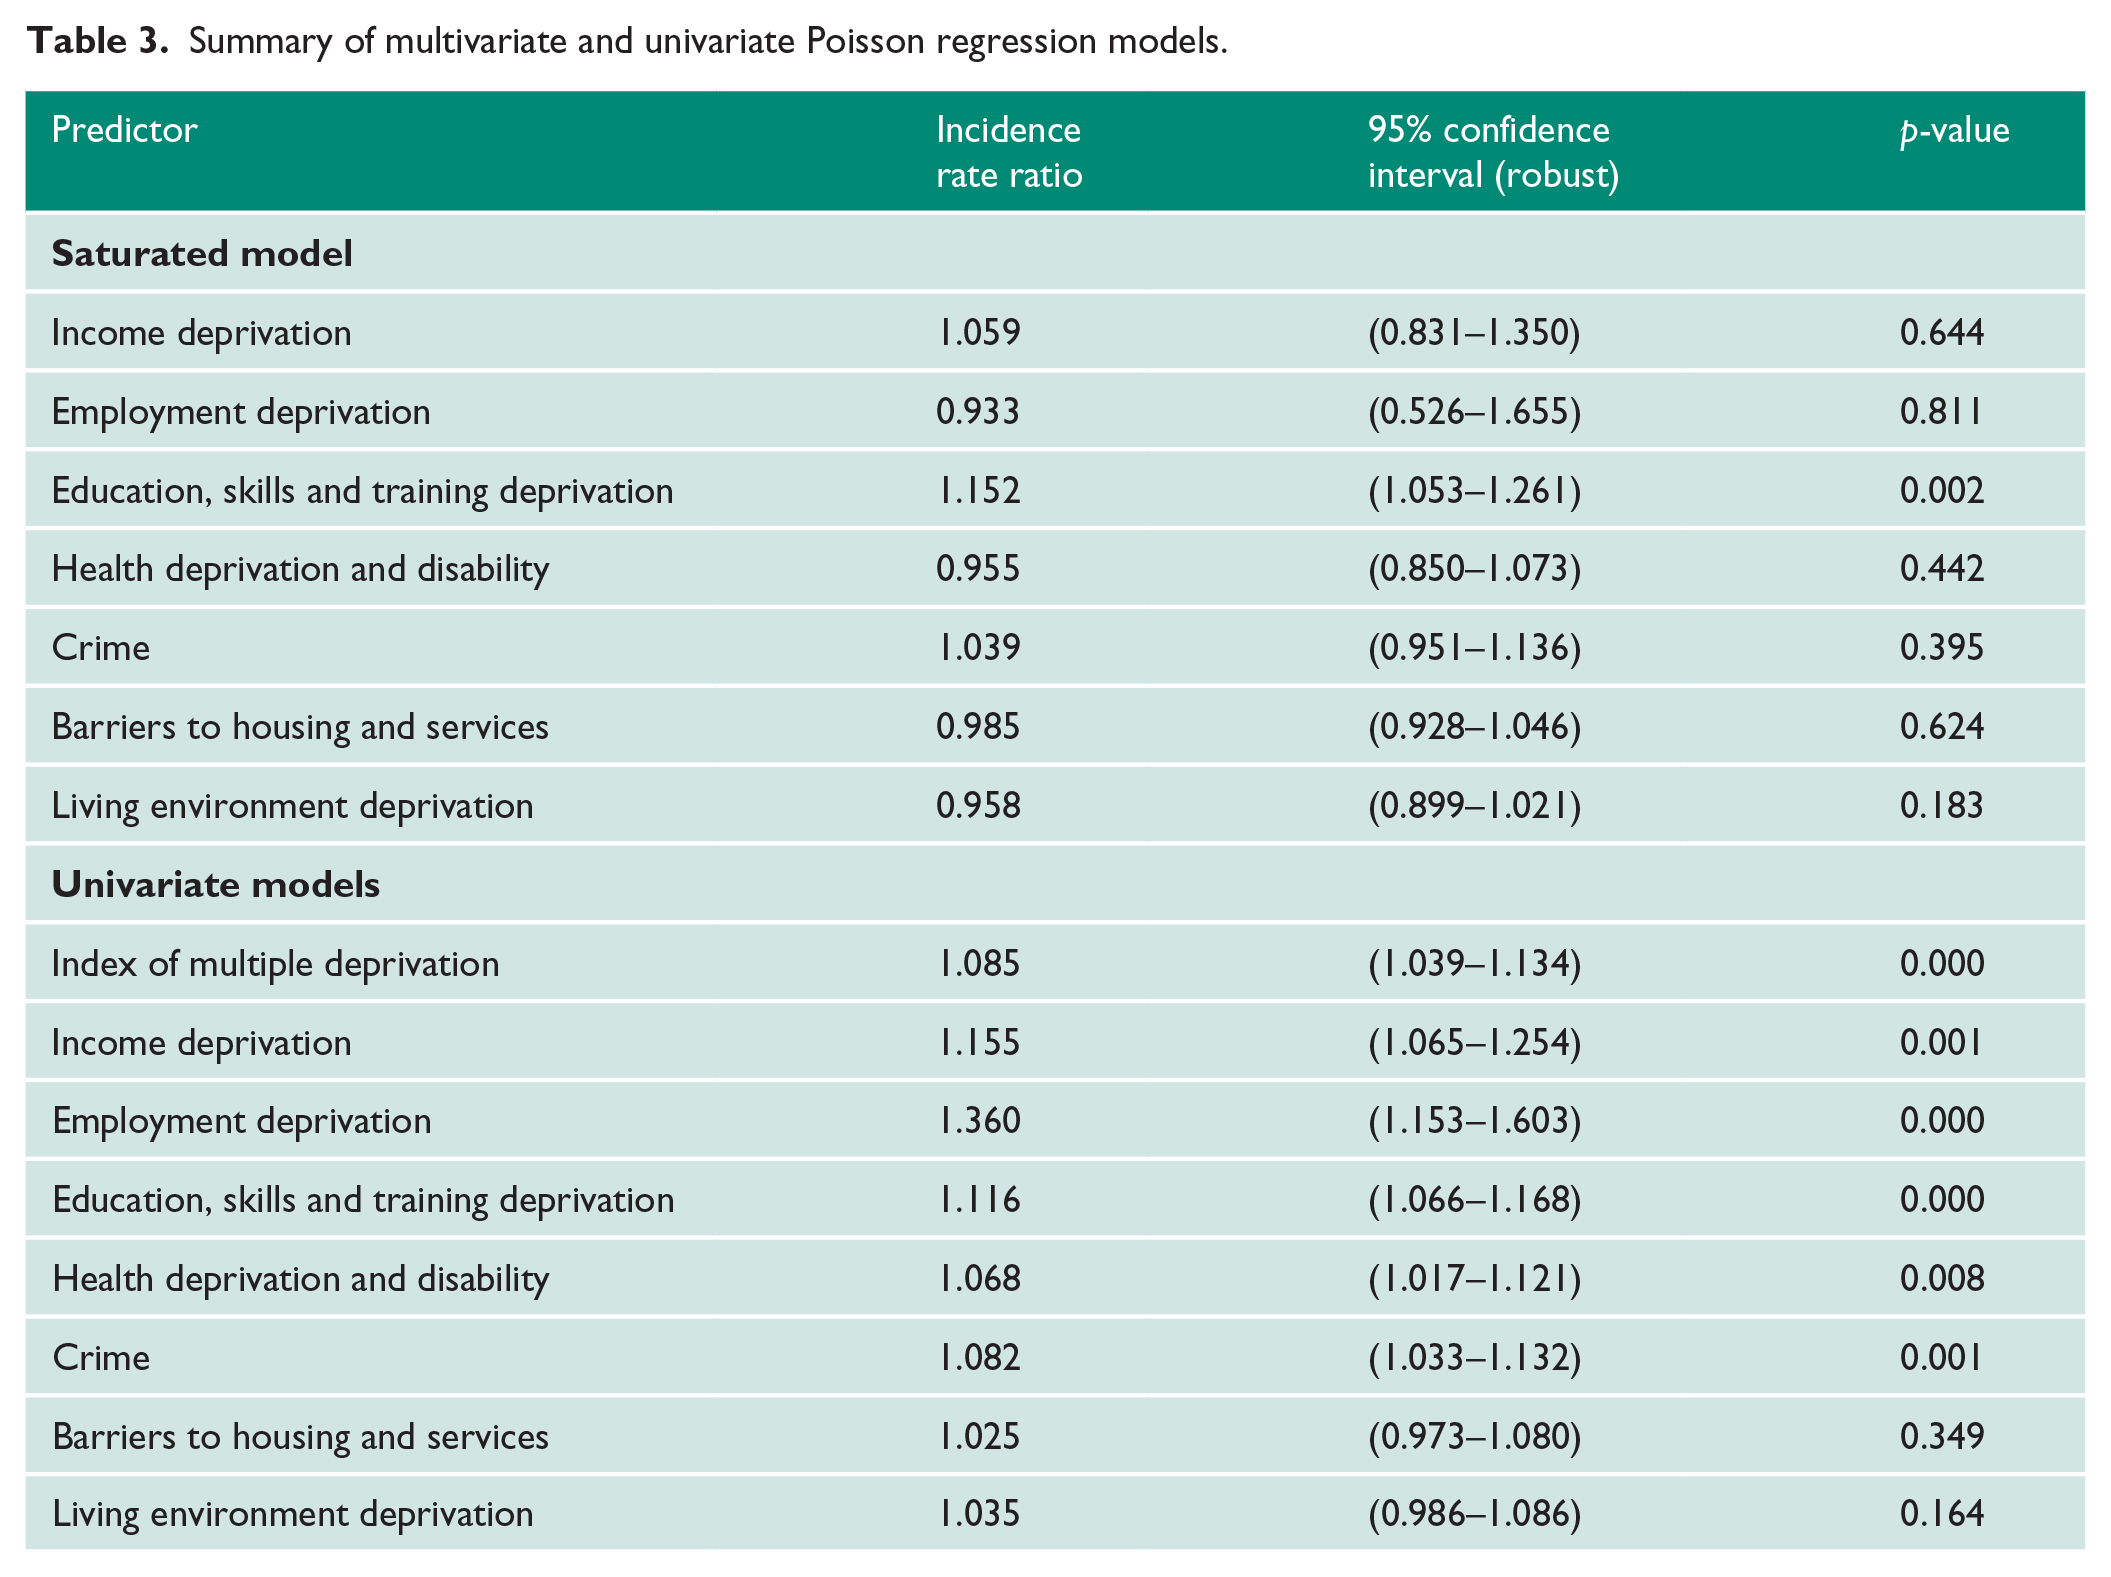
Stepwise multivariate Poisson regression was performed in order to select predictors of stones, using the population aged ⩾ 16 in each LSOA as an offset. Following stepwise regression, the fitted model included only education, skills and training deprivation. This model performed better than the univariate IMD model.
Discussion
Limitations
Our study demonstrates an association between deprivation and stone disease; however it was not designed to look for a causal relationship. Indeed, it is possible that the IMD and its subdomains are associated with known risk factors for stone disease such as diabetes, obesity or certain dietary habits.8,9
It may be that patients within our geographical area were treated for stone disease elsewhere. We mitigated against this by restricting our study population to those who lived close to our institution and so would be less likely to be referred elsewhere.
Our cases consisted of individuals treated at our National Health Service hospital. There may have been individuals who were treated at private hospitals, and so were not incident cases in our study. Anecdotally, this number is small.
Our study only counted incident patients with a diagnosis of stone disease following a hospital episode. It did not capture asymptomatic stone disease or stones that may have been treated conservatively in the community.
Conclusions
Firstly, this study gives a contemporary estimate for the incidence of upper urinary tract stone disease in the UK of 115/100,00 py. This estimate is based on an urban population in the Midlands area of England. It is well documented that the occurrence of stones varies between 3 and within countries. 10
Our calculated incidence of 115/100,000 py is considerably higher than the 28/100,000 arrived at by Power et al. 1 in 1987. However, it is known that the incidence of stone disease is increasing, 11 and our figure is comparable with more recent estimates from the US 12 and Japan. 13
Secondly, we have shown an association between deprivation and the incidence of stone disease, with an increase in incidence of > 50% when the least-deprived group is compared to the most-deprived group. This has implications for our understanding of stone disease. Given the link between stone formation and affluence, 5 we may have assumed that more stones would occur in less-deprived areas, whereas this study suggests that this is not the case.
Furthermore, we have shown that there is an association between the subdomains of the IMD and stone disease, and that education, skills and training deprivation predicts stone disease particularly well.
Footnotes
Acknowledgements
None.
Conflicting interests
The authors declare that there is no conflict of interest.
Funding
The authors received no financial support for the research, authorship and/or publication of this article.
Ethical approval
This observational study did not require ethics approval.
Informed consent
This observational study did not require informed consent.
Guarantor
RR
Contributorship
SM: study conception and design, data collection and manuscript writing/editing. RS: study conception and design, data collection and manuscript writing/editing. RR: data analysis and manuscript writing/editing. SW: study conception and design, and manuscript writing/editing.