
Abstract
The purpose of this article is to explain and illustrate the methodological approach used to test moderated mediation effects (conditional indirect effects) in marketing. A moderated mediation effect indicates the presence, in a single model, of one or more mediating variables and one or more moderating variables. Having first described the main methodological approaches used to test moderated mediation effects, with an emphasis on their respective advantages and disadvantages, we go on to recommend the method used by Hayes, which we illustrate through several marketing applications. This method makes it possible rigorously and simultaneously to test both mediating and moderating effects. Recommendations are also made to guide marketing researchers in the analysis of moderated mediation.
Introduction
Mediating and moderating effects are often tested by marketing researchers (Caceres and Vanhamme, 2003; Zhao et al., 2011). A mediating effect, also known as an indirect effect, is defined by the presence of one or more variables that intervene to transmit the influence of variable X on variable Y (Baron and Kenny, 1986; MacKinnon, 2008; MacKinnon et al., 2012; Shrout and Bolger, 2002; Zhao et al., 2010, 2011). A moderating effect is defined by the presence of one or more variables that modulate the influence of variable X on variable Y by impacting the nature, direction and/or strength of this influence, which can vary in accordance with the values of the moderating variable (Aguinis and Gottfredson, 2010; Baron and Kenny, 1986; Caceres and Vanhamme, 2003; Dawson, 2014; Jaccard and Turrisi, 2003; Sharma et al., 1981). Edwards (2008) uses the term conditional effect to describe a moderating effect. The procedures used to test mediating and moderating effects separately and rigorously are increasingly stable and widely adopted (Aguinis and Gottfredson, 2010; Aiken and West, 1991; Preacher and Hayes, 2004, 2008; Zhao et al., 2011). However, the considerable advances being made in marketing research now encourage researchers to move beyond the separate analysis of mediating and/or moderating effects and instead to understand the simultaneous mechanisms underlying these effects (‘how’) and the conditional limits of these effects (‘when’ or ‘under what conditions’; Edwards and Lambert, 2007; Hayes, 2013a, 2013b).
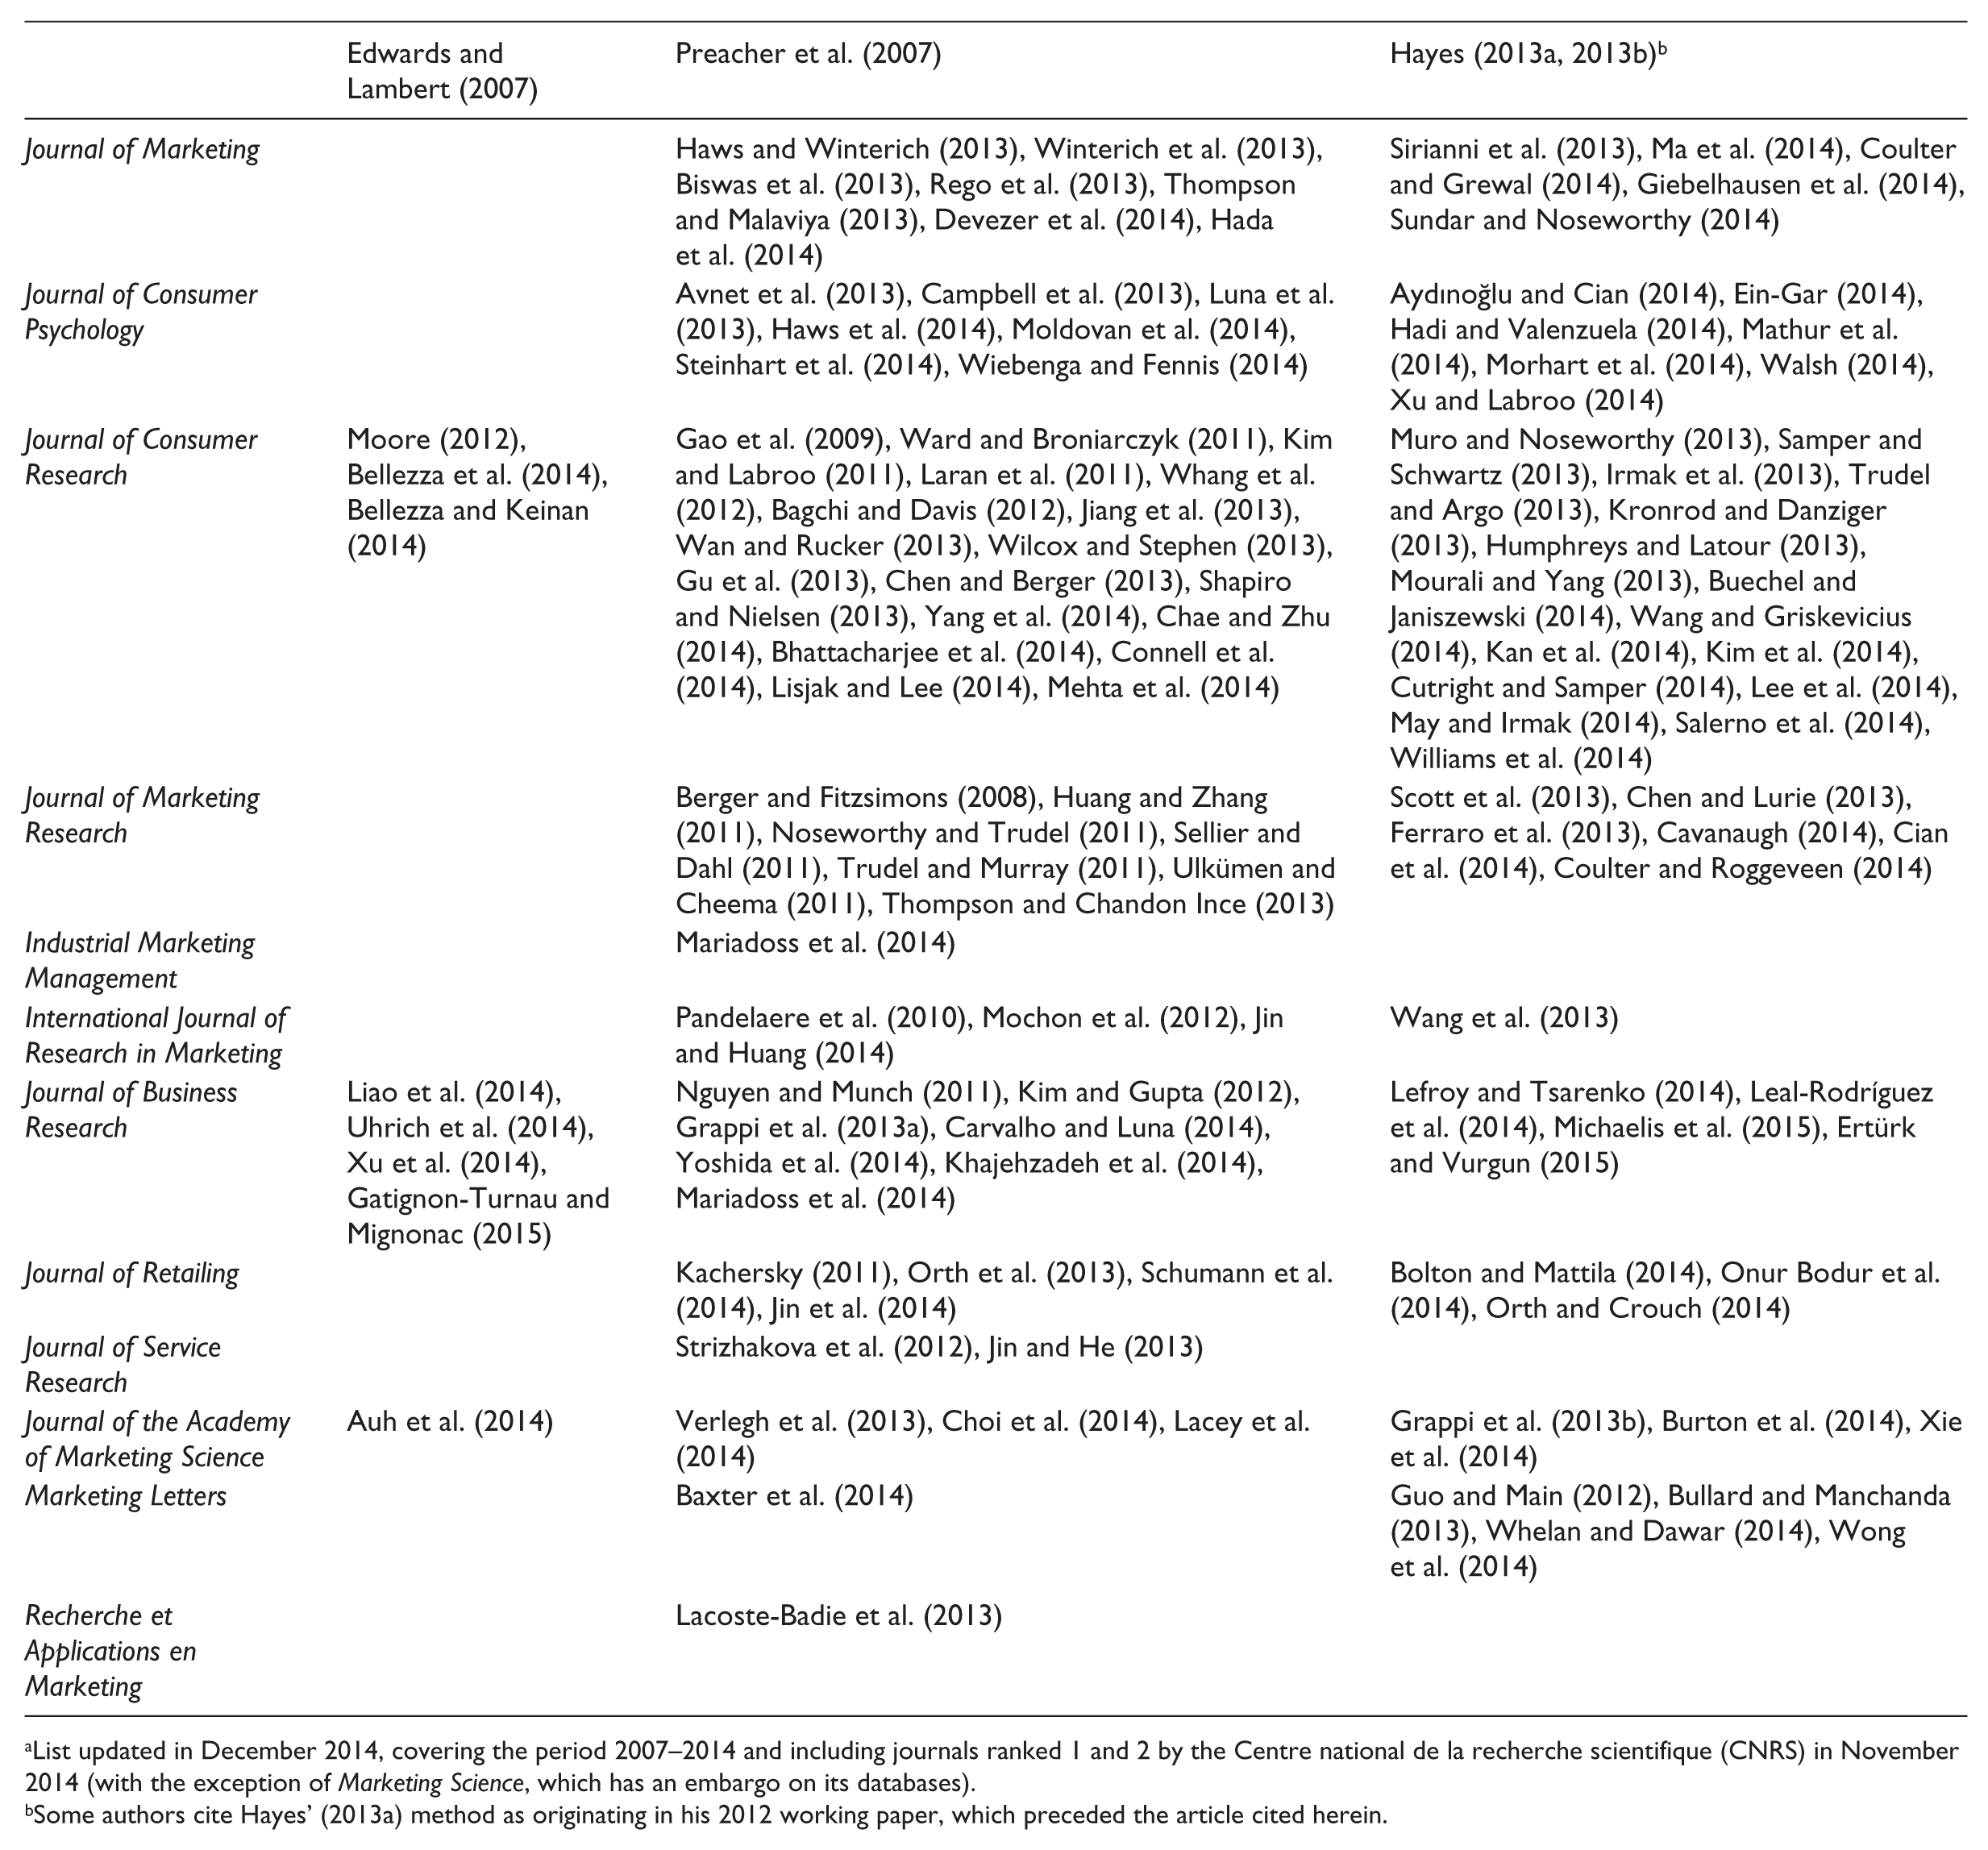
Marketing researchers currently face an increasing number of models that use both mediating and moderating variables, giving rise to so-called moderated mediation, mediated moderation (Edwards and Lambert, 2007) or conditional indirect effects (Preacher et al., 2007). The term ‘moderated mediation’ is conventionally used as a generic term to describe multiple effects (Edwards and Lambert, 2007; Fairchild and McQuillin, 2010; Muller et al., 2005; Preacher et al., 2007). Indeed, the methodological approach presented herein applies to all of these effects. We therefore use the term ‘moderated mediation’ to refer to all cases in which the moderating effect is transmitted via one or more mediating variables. In other words, moderated mediation is present when the magnitude, size or direction of the indirect effect of variable X on variable Y via a mediating variable M varies in accordance with the value of a moderating variable Z (Preacher et al., 2007). For example, Sellier and Dahl (2011) demonstrated that the impact of a greater rather than a limited choice of inputs on consumer creativity is mediated by the pleasure associated with the creative process and that this indirect impact varies according to the consumer’s level of expertise. By studying the partnerships between buyers and sellers, Celuch et al. (2011) found that the indirect effect of a partner’s communication on conflict resolution via the attribution of responsibility is determined by the level of trust between the buyer and seller. Bibliographical research covering the period from early January 2007 to late December 2014 in marketing journals ranked 1 and 2 1 reveals a growing interest among researchers in the analysis of moderated mediation effects (see Appendix 1). However, the number of articles that use rigorous analytical approaches remains limited (from a sample of several hundred articles, we identified 118 which explicitly deal with moderated mediation), which might generate a risk that inadequate methods will be used leading to incorrect results and conclusions. The majority of these 118 articles (61, or 51.7%) were based on the approach recommended by Preacher et al. (2007). Although recent, Hayes (2013a, 2013b) updated version of this approach has already been used in 49 articles (41.5%), no more than 8 articles (6.8%) make reference to the method suggested by Edwards and Lambert (2007; see Appendix 1). It is worth noting that, since it was first revealed, Hayes’ method (2013a, 2013b) has taken on significant importance in the marketing literature. In 2013, 14 articles used this method (compared to 20 in which that of Preacher et al., 2007 was used). This rose to 33 in 2014 (compared to 23 for Preacher et al., 2007). So, while the method proposed by Preacher et al. (2007) continues to dominate in terms of the overall number of studies between 2007 and 2014, Hayes’ method (2013a, 2013b) was used more often in 2014. This rising influence suggests that this method, which we recommend, is currently becoming the dominant approach in marketing research.
Many authors have recently emphasised that traditional procedures are insufficient and inadequate when it comes to simultaneously and rigorously testing moderated mediation effects (Edwards and Lambert, 2007; Hayes, 2013a, 2013b; Preacher et al., 2007). These procedures often involve initially testing for mediating effects and then for moderating effects, before reaching a conclusion about the presence of moderated mediation effects. In other cases, a multi-group analysis is used: the sample is first split into subgroups according to various values of the moderating variable, after which the significance of the mediating effect is tested in each subgroup (Wegener and Fabrigar, 2000). Most of these methods do not allow the user to formally test for conditional indirect effects, therefore making it impossible to formulate clear statistical inferences in this regard (see Table 1). It is also possible to use structural equations to simultaneously test an overall model of moderated mediation (Dabholkar and Bagozzi, 2002; Hayes and Preacher, 2013). However, the use of structural equation methods to test this type of model is complex and sometimes runs the risk of breaching the conditions for normal probability and linearity distribution of the tested effects, 2 especially when the sample size is insufficient (Cortina et al., 2001; Edwards, 2008). Different authors emphasise the importance of (1) using robust methods such as bootstrapping which allow the user to rigorously test for non-linear effects and, in the case of non-normal distribution, to calculate confidence intervals (CIs); (2) testing the significance of indirect effects for various values of the moderating variable and (3) making methods for testing moderated mediation effects more intuitive and easy to use by developing macros that can be readily used by researchers (Hayes, 2013a; Preacher et al., 2007).
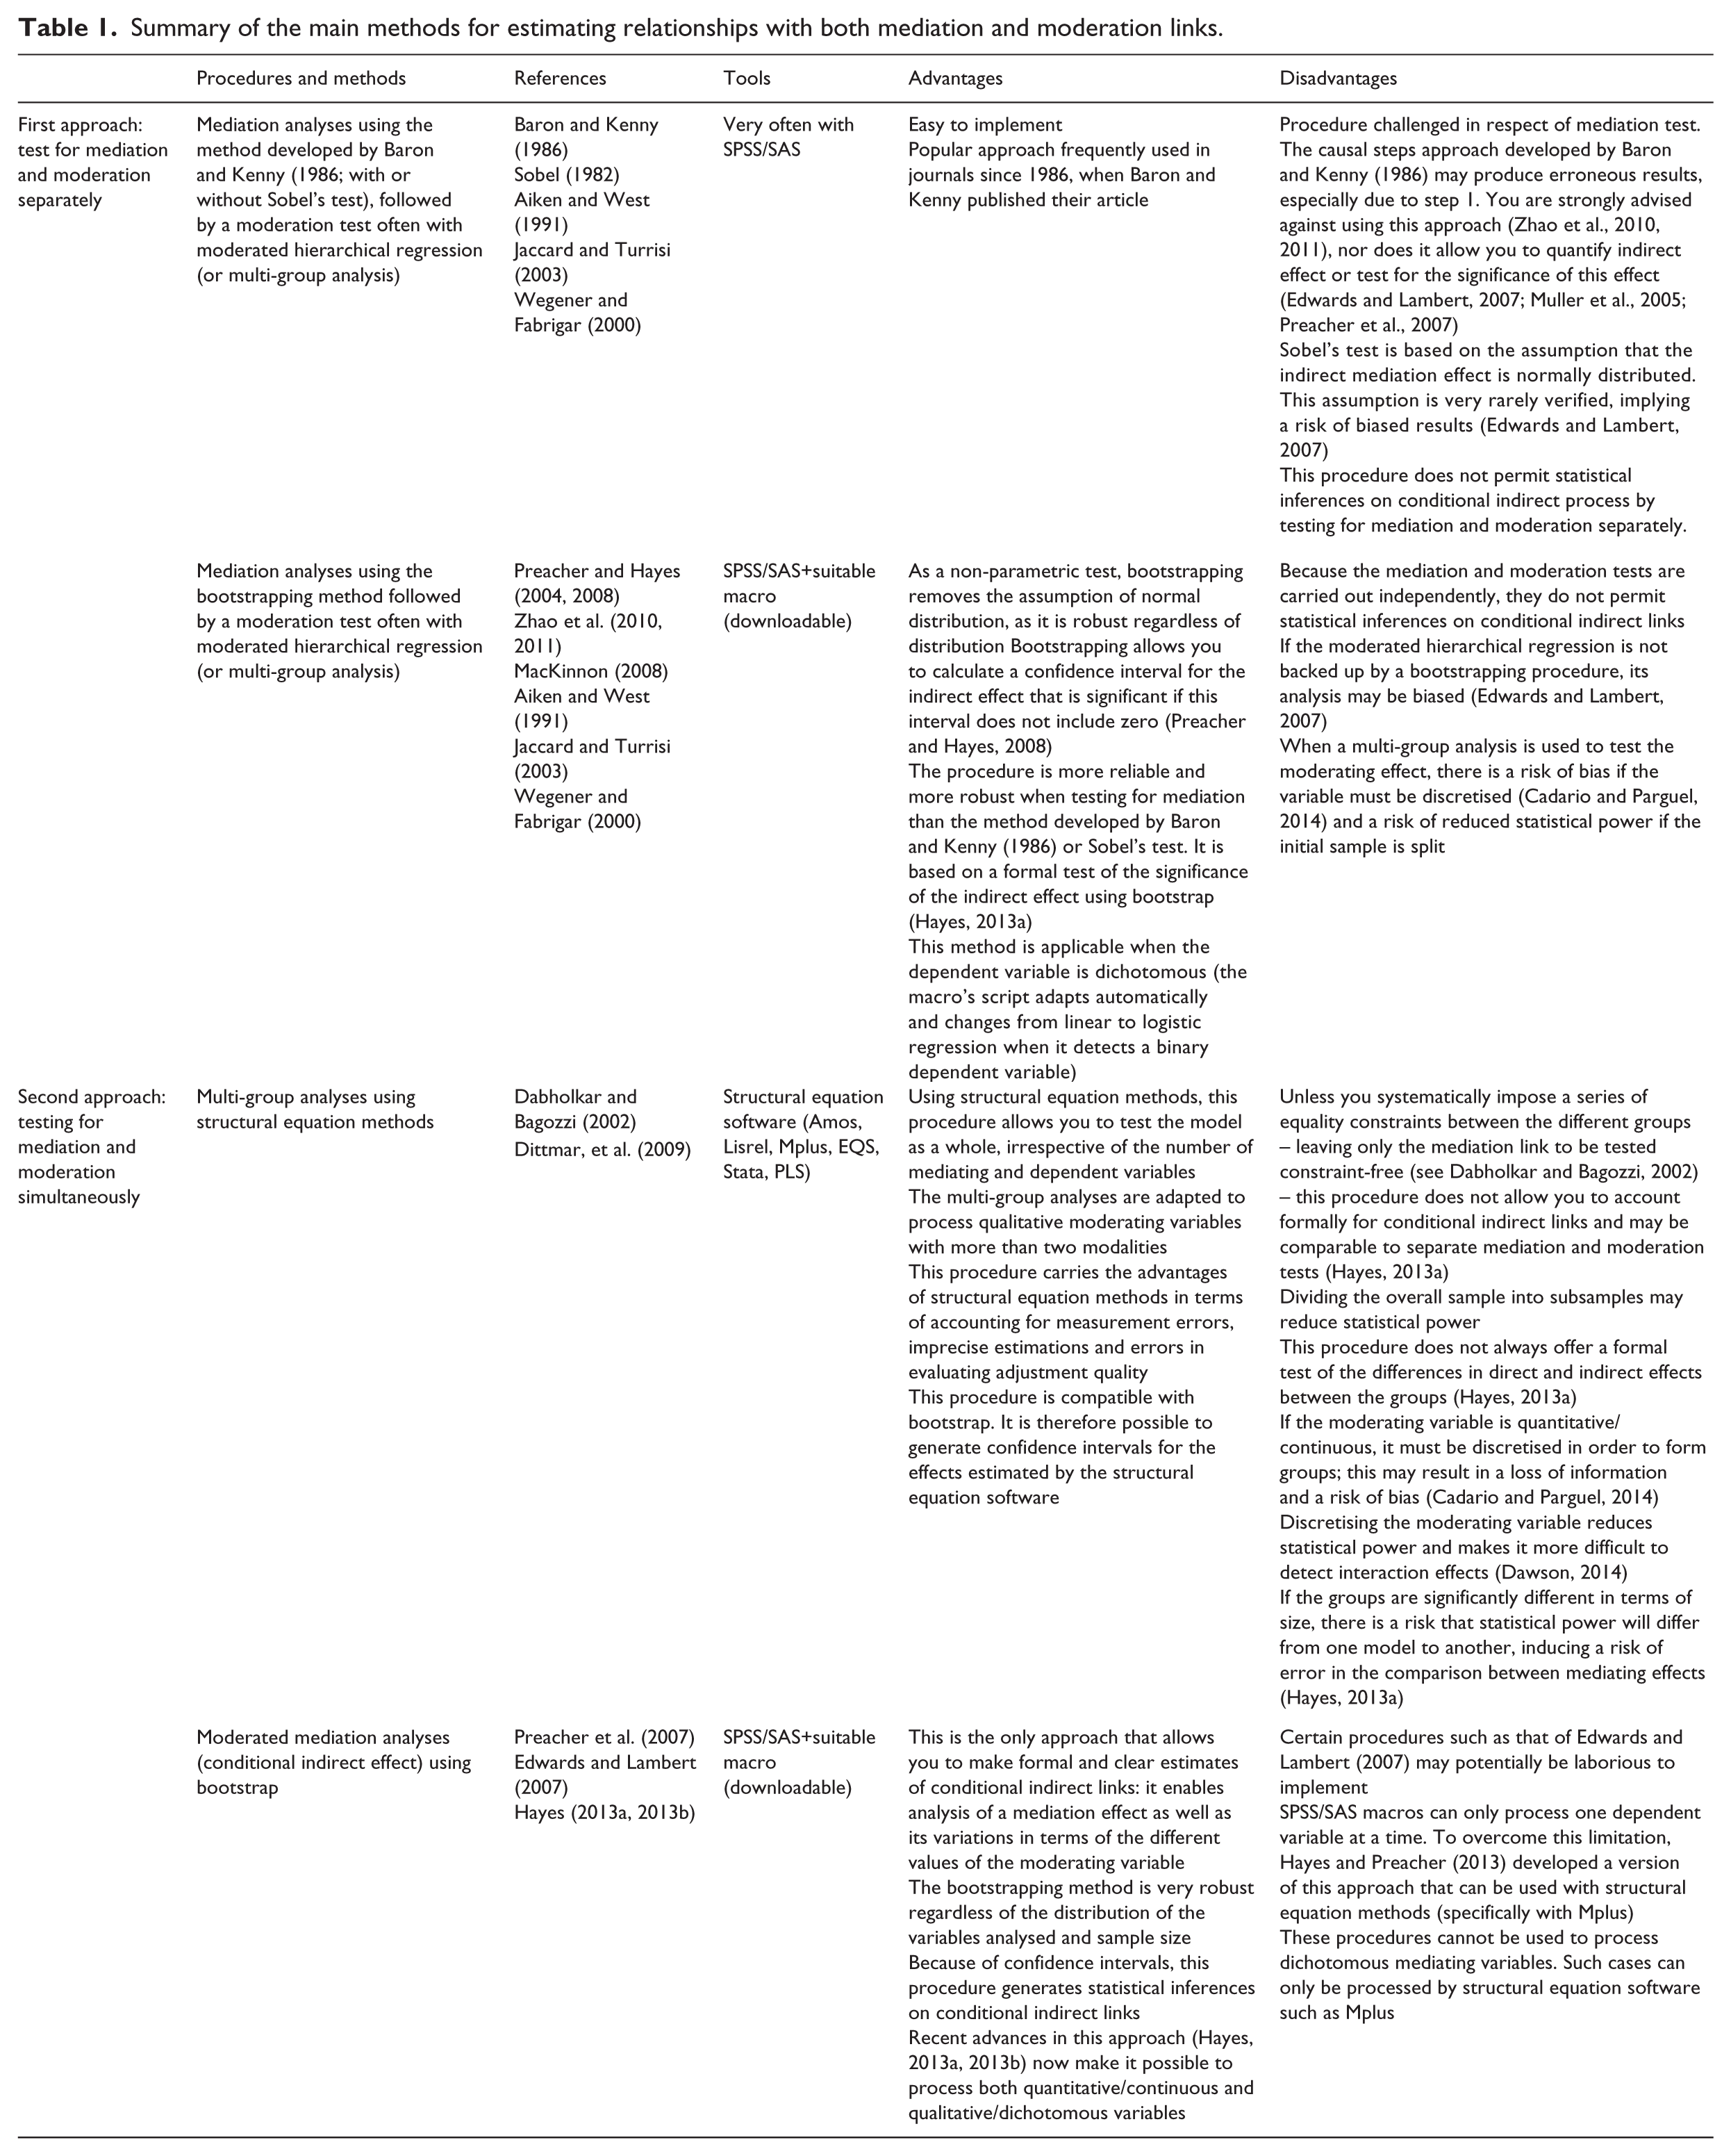
Summary of the main methods for estimating relationships with both mediation and moderation links.
The objective of this article is to present, explain and illustrate the methodological approach to be adopted when testing moderated mediation effects. Having first clarified what is meant by moderated mediation, mediated moderation and conditional indirect effects, we outline the main methods used to study these effects, highlighting the contributions and limitations of each analytical procedure. We then provide an illustration of this approach in the context of marketing through several applications of our recommended method, that of Hayes (2013a, 2013b), before finally concluding with a series of recommendations for marketing researchers who want to test moderated mediation effects.
Definition and fundamental principles of moderated mediation
In order to understand moderated mediation effects, one must first grasp what is meant by mediation and moderation. Despite the advanced state of methods with which to analyse mediation and moderation effects, there remains some confusion between the two, although they represent distinct processes and require different methods of analysis (Hayes, 2013a, 2013b).
Mediation effects: Direct and indirect effects
A mediation effect relates to the mechanism through which an independent variable X has an impact on a dependent variable Y via an intermediary variable M located between X and Y (MacKinnon, 2008). The mediation effect can often be broken down into direct and indirect effects. Two regression equations can be used as a simplified method to test these effects. The first links the independent variable X and the mediating variable M

The second equation represents the estimation of Y by both X and M, thereby enabling the impact of M on Y to be tested while controlling for X

The indirect effect is represented by the product (a × b) in equations (1) and (2). The total effect of X on Y is the sum of the direct and indirect effects (a × b + c′), whereby c′ represents the direct effect in the presence of M.
Several methods are used to test mediating effects: (1) the causal steps approach developed by Baron and Kenny (1986), (2) the Sobel (1982) test and the significance of the indirect effect (MacKinnon et al., 2007) and (3) the bootstrapping method (Preacher and Hayes, 2004, 2008). It is not the purpose of this article to present these methods; the strengths and weaknesses of each one are summarised in Table 1. We direct the reader to a range of excellent studies that provide a critical overview of the methods used to test mediation effects (Hayes, 2013a; MacKinnon, 2008; MacKinnon et al., 2012; Zhao et al., 2010, 2011).
The following is an overview of the contributions made by these recent studies:
Zhao et al. (2010, 2011) propose a new typology of mediating effects, notably by drawing a distinction between complementary mediation (the indirect effect (a × b) and direct effect (c′) are significant and have the same signs) and competitive mediation (the indirect effect (a × b) and the direct effect (c′) are significant but of opposite signs). This typology moves beyond the traditional distinction between complete mediation and partial mediation, which has increasingly been criticised for its trivial if not unrealistic nature (Hayes, 2013a).
There is now unanimous agreement that the causal steps approach developed by Baron and Kenny (1986) should be rejected. Several authors have demonstrated its significant limitations and the risk of incorrect results (Zhao et al., 2010, 2011; see also Table 1). There is also consensus to support the use of bootstrapping when testing mediation effects (Hayes, 2013a; Preacher and Hayes, 2004, 2008; Shrout and Bolger, 2002). The only condition for the existence of a significant indirect effect is based on a bootstrap test with a CI that excludes zero.
Structural equation methods can be combined with bootstrapping to test mediating effects (Iacobucci et al., 2007; Zhao et al., 2010, 2011). It is recommended to use these methods when the mediating variable is categorical/dichotomous – the software program Mplus is well suited to this scenario (Muthén and Muthén, 2011).
Moderation effects: Interaction effects and conditional effects
A moderation effect refers to the interaction between two or more variables that have an influence on another variable. This effect occurs when the impact of independent variable X on dependent variable Y varies in accordance with the value of a third variable Z (Aiken and West, 1991; Edwards and Lambert, 2007; Jaccard and Turrisi, 2003). Variable Z may be a continuous variable (or an ordinal Likert-type variable with equidistant intervals), such as involvement, or a categorical variable, such as gender (Aguinis, 2004; Aguinis and Gottfredson, 2010). Preacher et al. (2007) recommend using the term conditional effect to describe a moderating effect, given that the moderating variable plays a role as a contingency factor 3 that has an influence on the strength, direction and/or significance of the relationship between two variables. Analysing moderating effects is important as it allows us to understand the conditions for generalisation under which the relationship between the independent variable and the dependent variable can be verified (Fairchild and McQuillin, 2010). Accounting for moderating effects also reflects the level of maturity and sophistication of a research field (Aguinis et al., 2001).
Several methods such as analysis of variance (ANOVA) or multi-group analysis can be used to test moderating effects. Moderated hierarchical regression is also often used to test these effects. This involves testing the significance of the regression coefficient for the product of the independent variable X with variable Z, after the direct effects of X and Z have been introduced to the regression equation. The product XZ represents the interactive term

Z has a moderating effect on the relationship between X and Y if the coefficient β3 is significant (p < 0.05). It should be noted that the moderating variable Z is not necessarily directly linked to the dependent variable Y; in other words, while it is essential from a statistical point of view to include in one’s analysis the direct link between the moderating variable and the dependent variable (Dawson, 2014), the significance of this direct link (β2) is not a requisite condition for the existence of a moderating effect (Carte and Russell, 2003). When adding the interactive term XZ, it is also important to have a significant variation in the explained variance R2. The value of ΔR2 (F test) indicates the extent to which the moderating effect improves the explanatory power of the model beyond the direct linear effects (Aguinis, 2004; Aiken and West, 1991; Fairchild and McQuillin, 2010).
Despite the recent debate on the appeal and necessity of centring variables X and Z before calculating XZ and of carrying out a moderated hierarchical regression to reduce multicollinearity (Dalal and Zickar, 2012; Echambadi and Hess, 2007; Hayes, 2013a), it is still recommended to centre 4 the variables in order to facilitate the interpretation of one’s results (Dawson, 2014). Note that dependent variable Y need not be centred (Dawson, 2014). Finally, to make it easier to interpret the direction and size of interaction effects, it is necessary to produce a graphic representation (plot) 5 of these effects using the method recommended by Aiken and West (1991). This representation also makes it possible to compare the significance of the relationship between X and Y in respect of focal values of Z or where the value of Z is low (typically considered to be equal to the mean value of Z minus its standard deviation) or high (typically considered to be equal to the mean of Z plus its standard deviation). Although this so-called spotlight approach (based on an interpretation of the effects in respect of the focal values of the moderating variable) continues to be dominant, some recent studies have recommended the so-called floodlight approach, which involves interpreting the effects using all of the moderating variable’s values so as to limit the potentially arbitrary choice of focal values (Cadario and Parguel, 2014; Spiller et al., 2013). This approach is based on the identification of regions of significance (all of the values of moderating variable Z for which the relationship between X and Y is significant) according to the procedure developed by Johnson–Neyman which is embedded in macros such as PROCESS (Hayes, 2013a, 2013b). 6
Moderated mediation: Conditional indirect effects
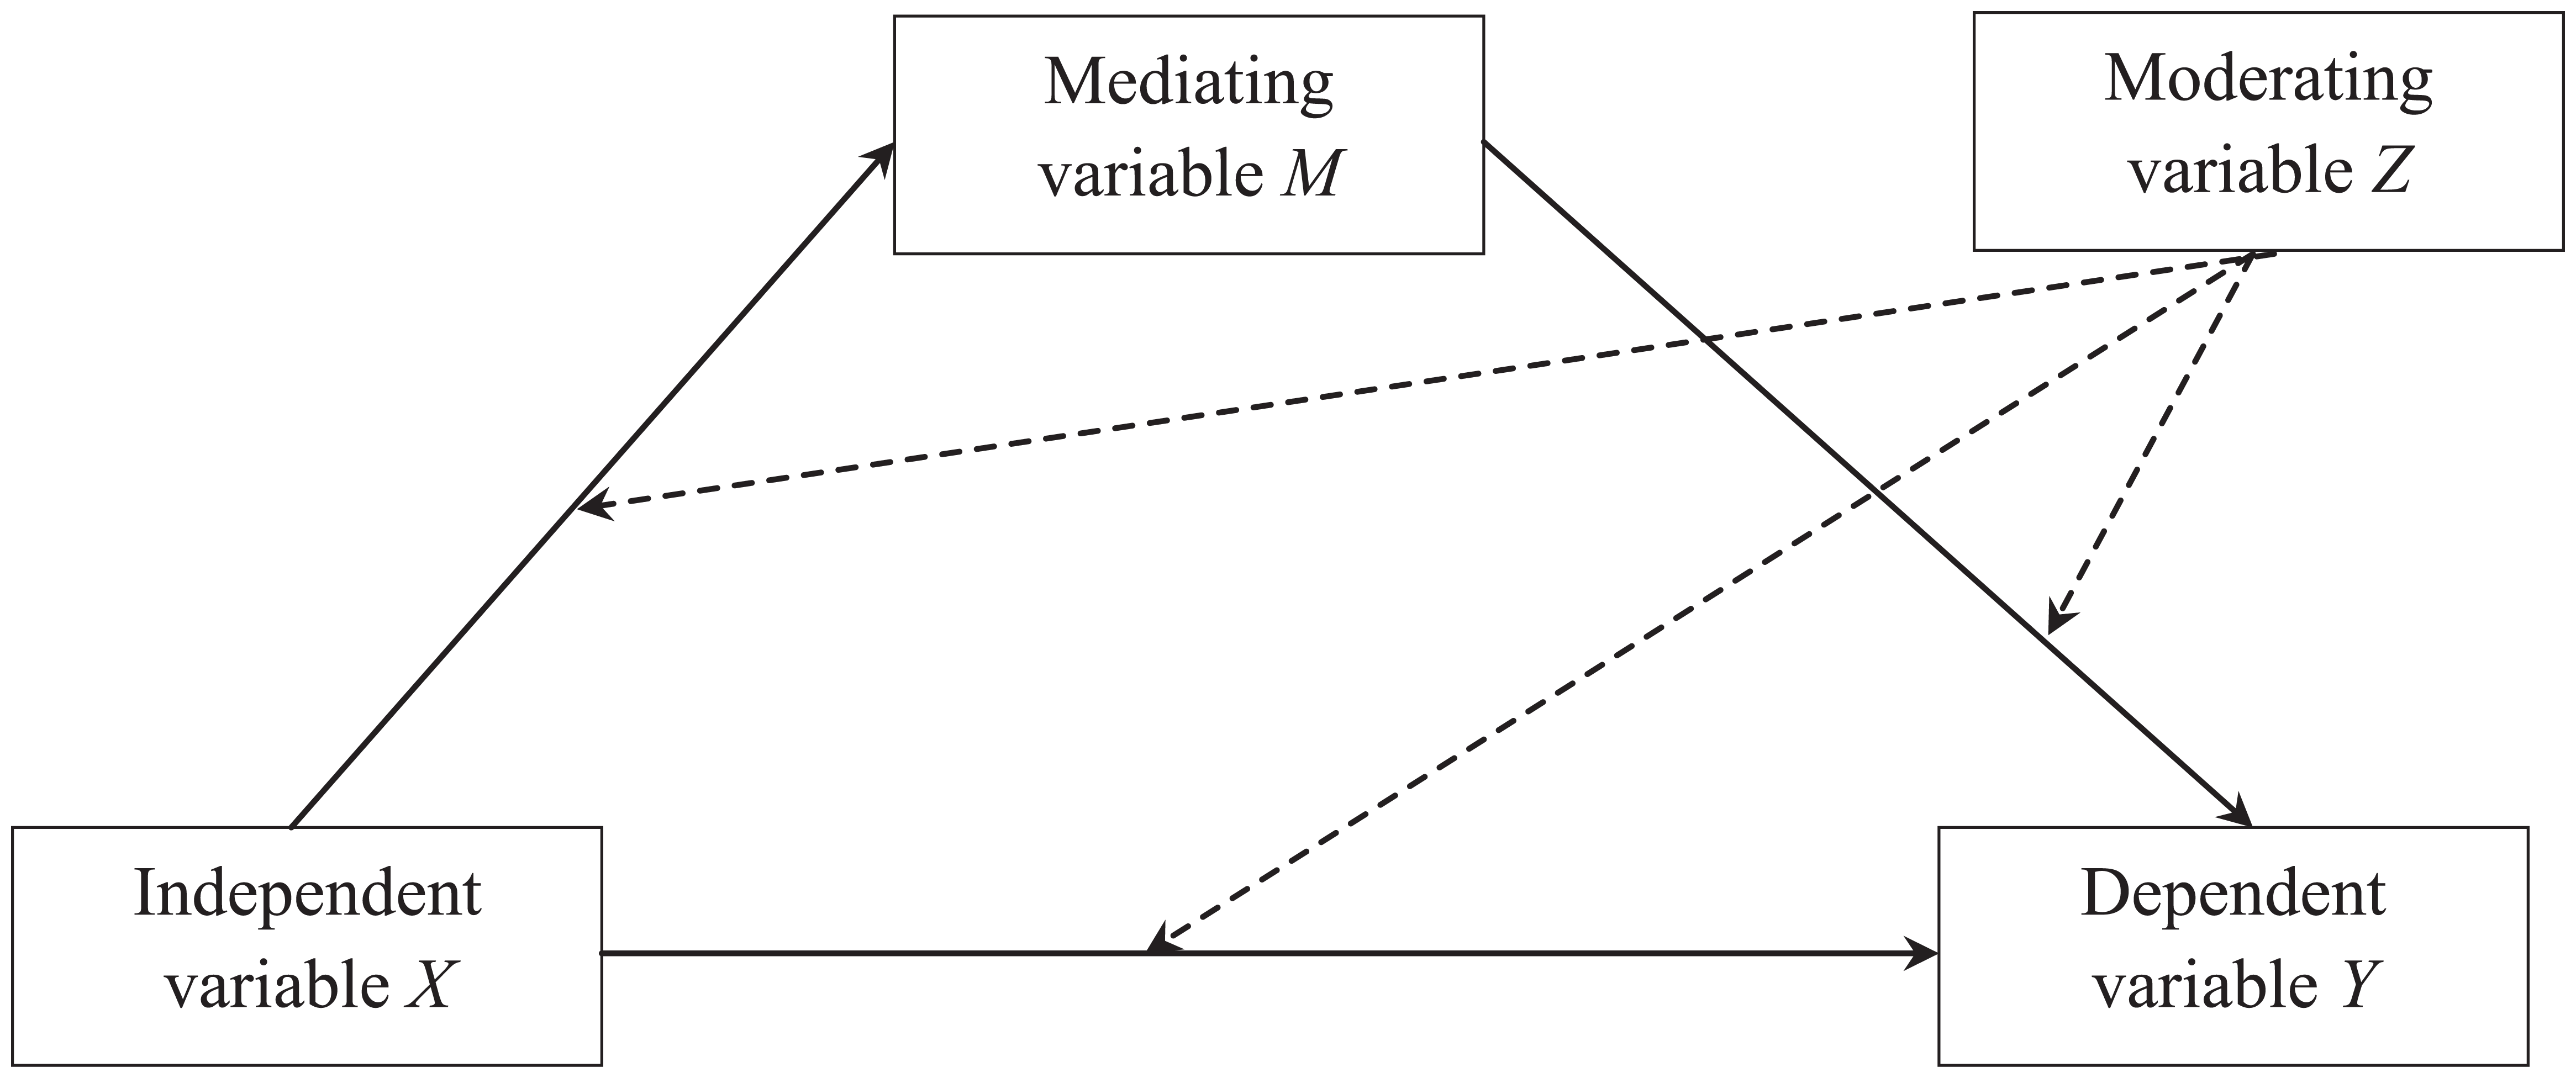
The advances made in marketing research mean that researchers are increasingly confronted with complex models that combine both mediation and moderation effects. Yet some authors process and analyse these effects separately, while others approach them simultaneously (see Table 1). In these models, referred to as conditional process models (Hayes and Preacher, 2013), the indirect and/or direct effects of an independent variable X on a dependent variable Y via one or more mediating variables M are moderated by one or more moderating variables Z. A simple example is given in Figure 1, which shows that both the direct and indirect effects of X on Y via M are moderated by Z. Ultimately, the influence of the independent variable on the dependent variable is determined by the interaction between the mediating and moderating variables.
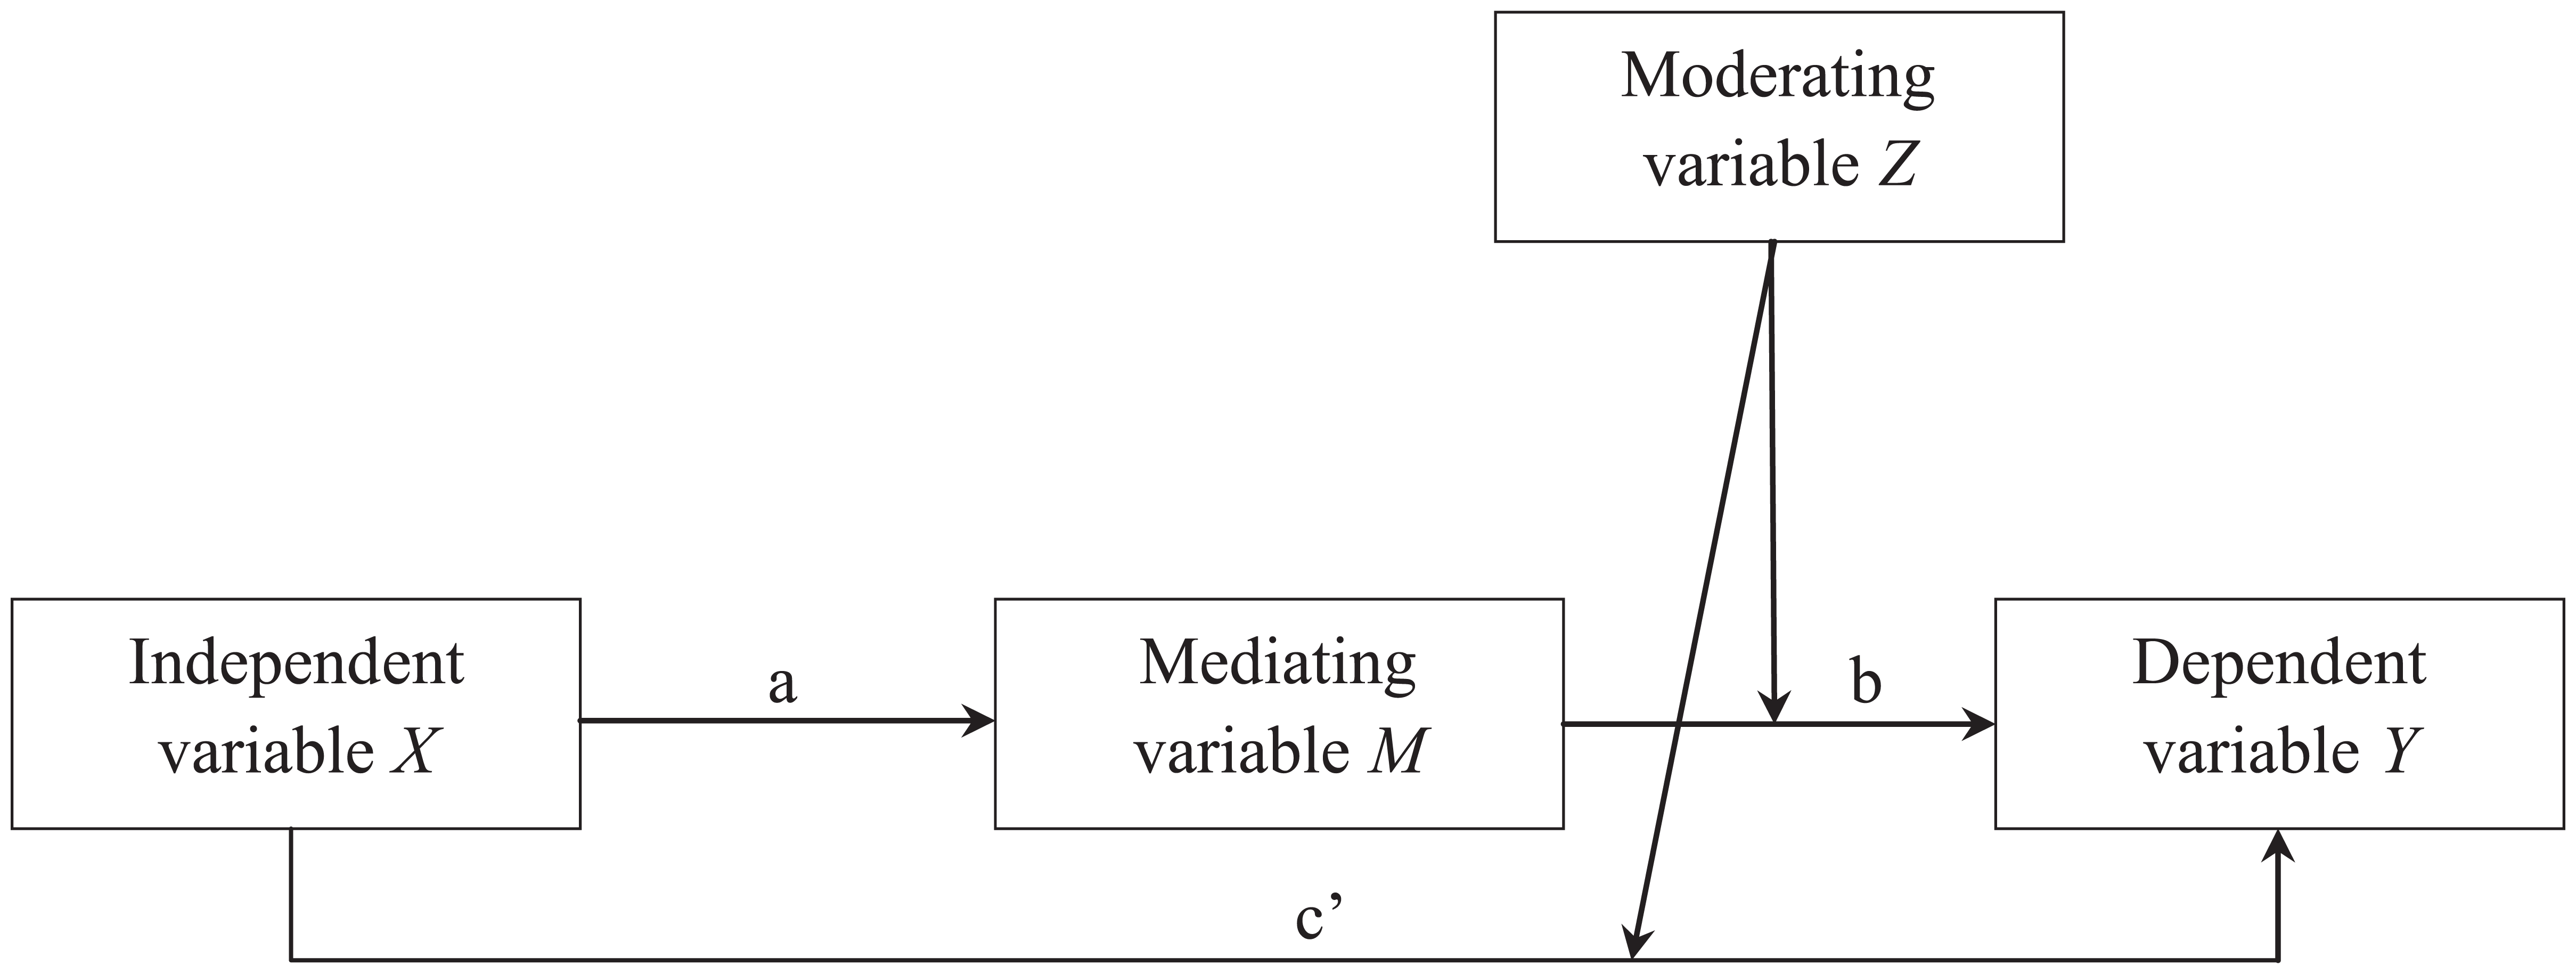
Moderated mediation: a sample model.
Moderated mediation models can be highly varied (Hayes, 2013a, 2013b). This explains the many different terms used to refer to them. According to Edwards and Lambert (2007), mediated moderation refers to a scenario in which the moderating effect is localised within the first sequence of the mediation process, that is, before the mediating variable, around (a) in Figure 1. They consider mediated moderation to be a specific case of moderated mediation. It is, nonetheless, worth noting that this concept is subject to debate. For other authors such as Muller et al. (2005), mediated moderation instead refers to a scenario in which it is the direct link between X and Y that is moderated. Finally, Hayes (2013a) challenges the relevance of the very notion of mediated moderation and advises against using this term. Hayes and Preacher (2013) refer to conditional indirect effects when the moderating variable has an influence on the indirect impact of the independent variable on the dependent variable via the mediating variable ((a) and/or (b) in Figure 1) and to conditional direct effects when the impact of the moderating variable is localised on the direct link between the independent variable and the dependent variable ((c′) in Figure 1).
Simultaneous analysis of these different effects is needed to produce reliable and robust results (Edwards and Lambert, 2007; Hayes, 2013a, 2013b; Preacher et al., 2007). It offers several advantages: (1) it overcomes the limitations of traditional sequential approaches which test for mediation and moderation effects separately, (2) it leads to more rigorous and precise results using the bootstrapping procedure (see Box 1), (3) it can be used both with conventional multiple regressions and with structural equation methods (Hayes and Preacher, 2013) and (4) it has been made increasingly simple and accessible through ready-to-use macros. 7
The advantages of bootstrapping to test for moderated mediation.
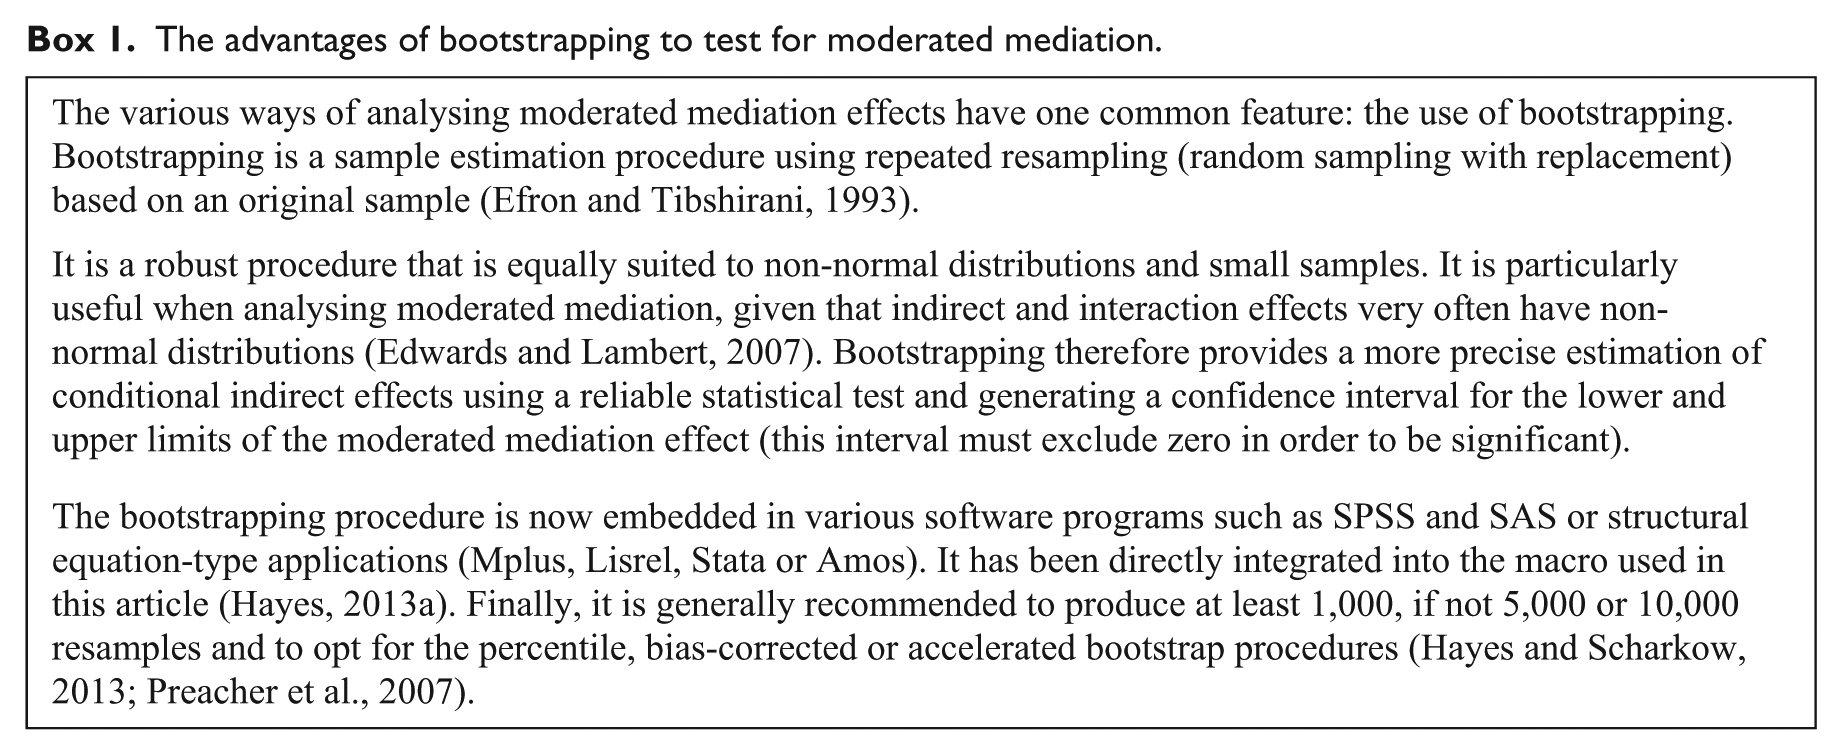
The main bootstrapping procedures for simultaneously testing moderated mediation effects
A review of the literature on moderated mediation (see Appendix 1) reveals three analytical approaches which are increasingly used: that of Edwards and Lambert (2007), that of Preacher et al. (2007) and, more recently, that of Hayes (2013a, 2013b). We outline these methods in the following section; it should be noted that the last two are grouped together (one is an improved version of the other). Table 2 provides details of the main advantages and disadvantages of each method.
Summary of methods for simultaneous analysis of moderated mediation using bootstrap.
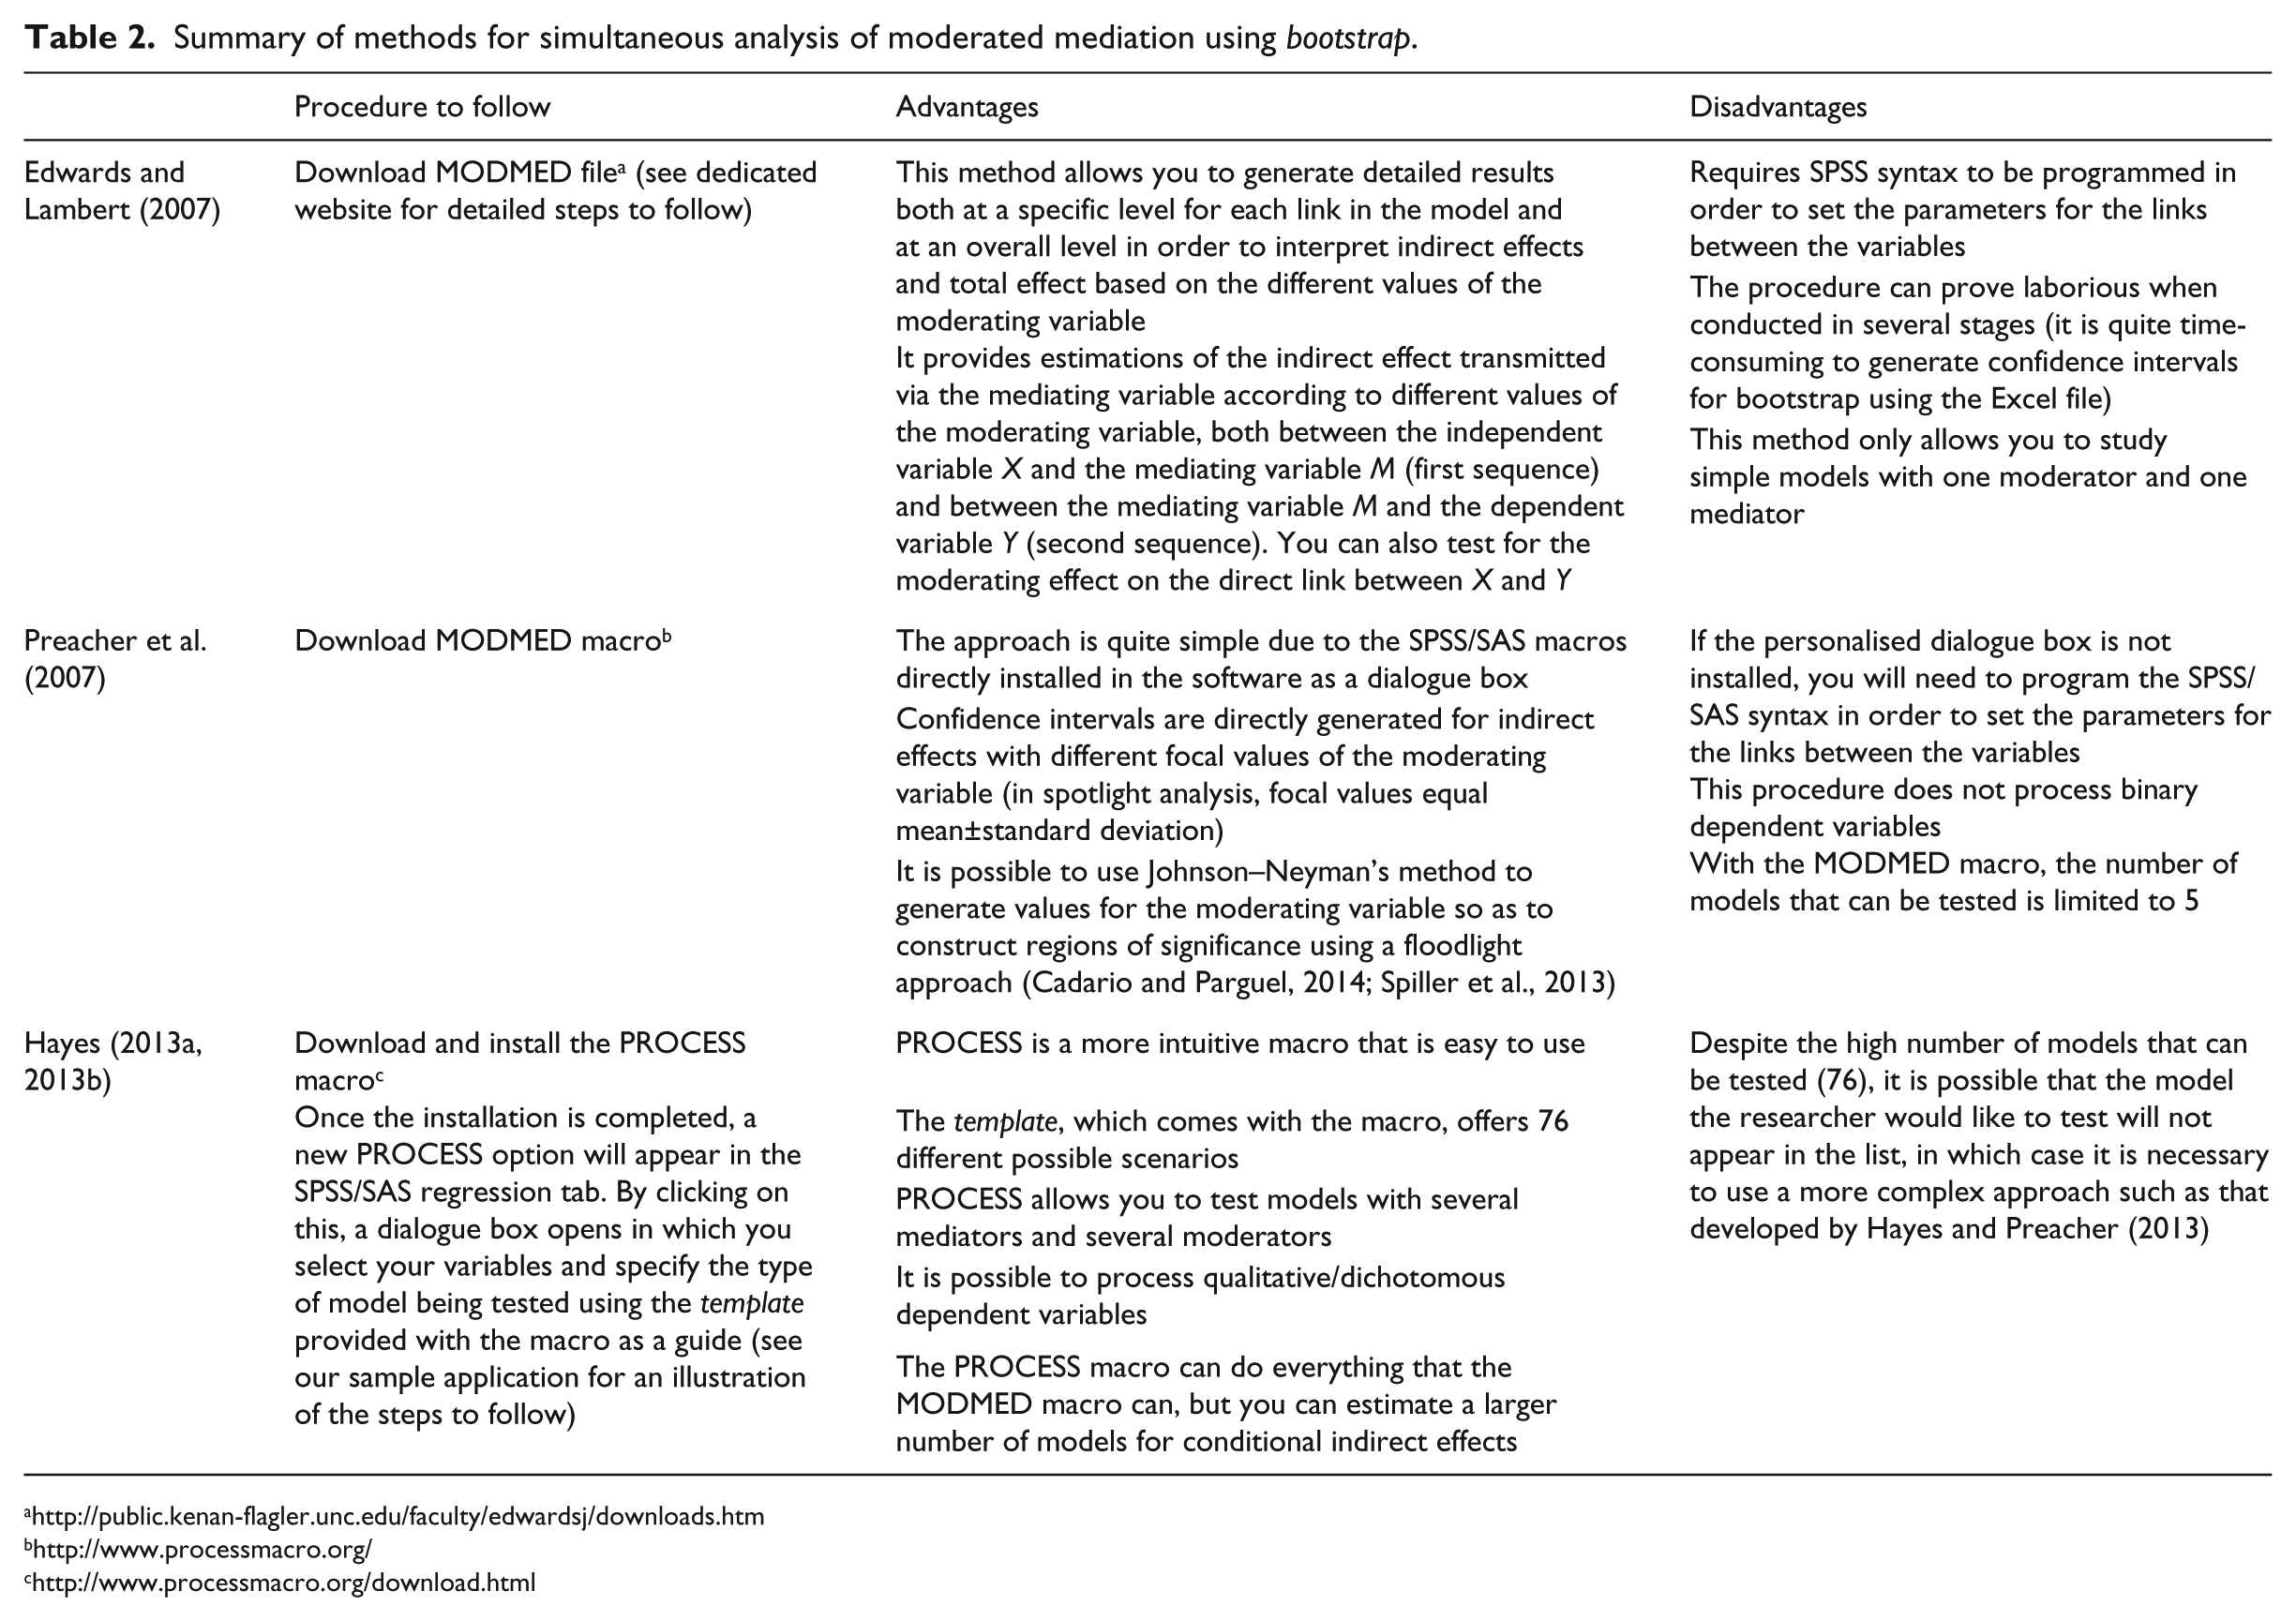
Edwards and Lambert (2007)
The approach developed by Edwards and Lambert (2007) is based on the principle that in a model of moderated mediation, the moderating effect can have an impact on the indirect effect, the direct effect or the overall effect. Moderated mediation is therefore expressed in direct, indirect and overall terms. As Figure 2 illustrates, in each approach the moderating effect of variable Z is tested at several different levels each time: (1) in the first sequence between independent variable X and mediating variable M (first stage), (2) in the second sequence between mediating variable M and dependent variable Y (second stage) and (3) in the direct link between independent variable X and dependent variable Y. According to Edwards and Lambert (2007), in moderated mediation modelling, any sequence of the direct effect between X and Y or the indirect effect via M can be moderated by Z. It is the mediating relationship as a whole that is considered to be moderated (Muller et al., 2005). This is an analytical rather than a theoretical vision of moderated mediation. One’s theoretical arguments must, however, be presented beforehand in a specific and precise manner, thereby making it possible to demonstrate at what level the moderating effect has an impact on the overall process.
Moderated mediation: general model based on Edwards and Lambert (2007).
Edwards and Lambert (2007) developed a MODMED macro 8 that allows the user to test for moderated mediation effects. This macro can be used with continuous or categorical moderating variables. Given the limited number of marketing studies that have used the approach developed by Edwards and Lambert (see Appendix 1), we will not be developing this approach any further, instead directing the reader to the authors’ 2007 article as well as the explanation and application of this approach on the website dedicated to our article. 9
Preacher et al. (2007) and Hayes (2013a, 2013b)
The approach developed by Preacher et al. (2007) to test for conditional indirect effects was recently reworked by Hayes (2013a, 2013b) in a new macro known as PROCESS, 10 which can be downloaded free of charge from Andrew Hayes’ website. The new macro comes in the form of a syntax or dialogue box that operates under SPSS or SAS. It can be used with quantitative/continuous or qualitative/categorical dependent variables. It can also test moderated mediation models with one or more mediating and moderating variables. This new macro makes it possible to analyse a large number of models, with up to 10 mediating variables and 4 moderating variables in a single model (Hayes, 2013a, 2013b). It is also advisable to download the templates document ‘process.pdf’ from the same website, in which 76 possible combinations of moderated mediation are modelled, with their respective scripts (detailed for each model below).
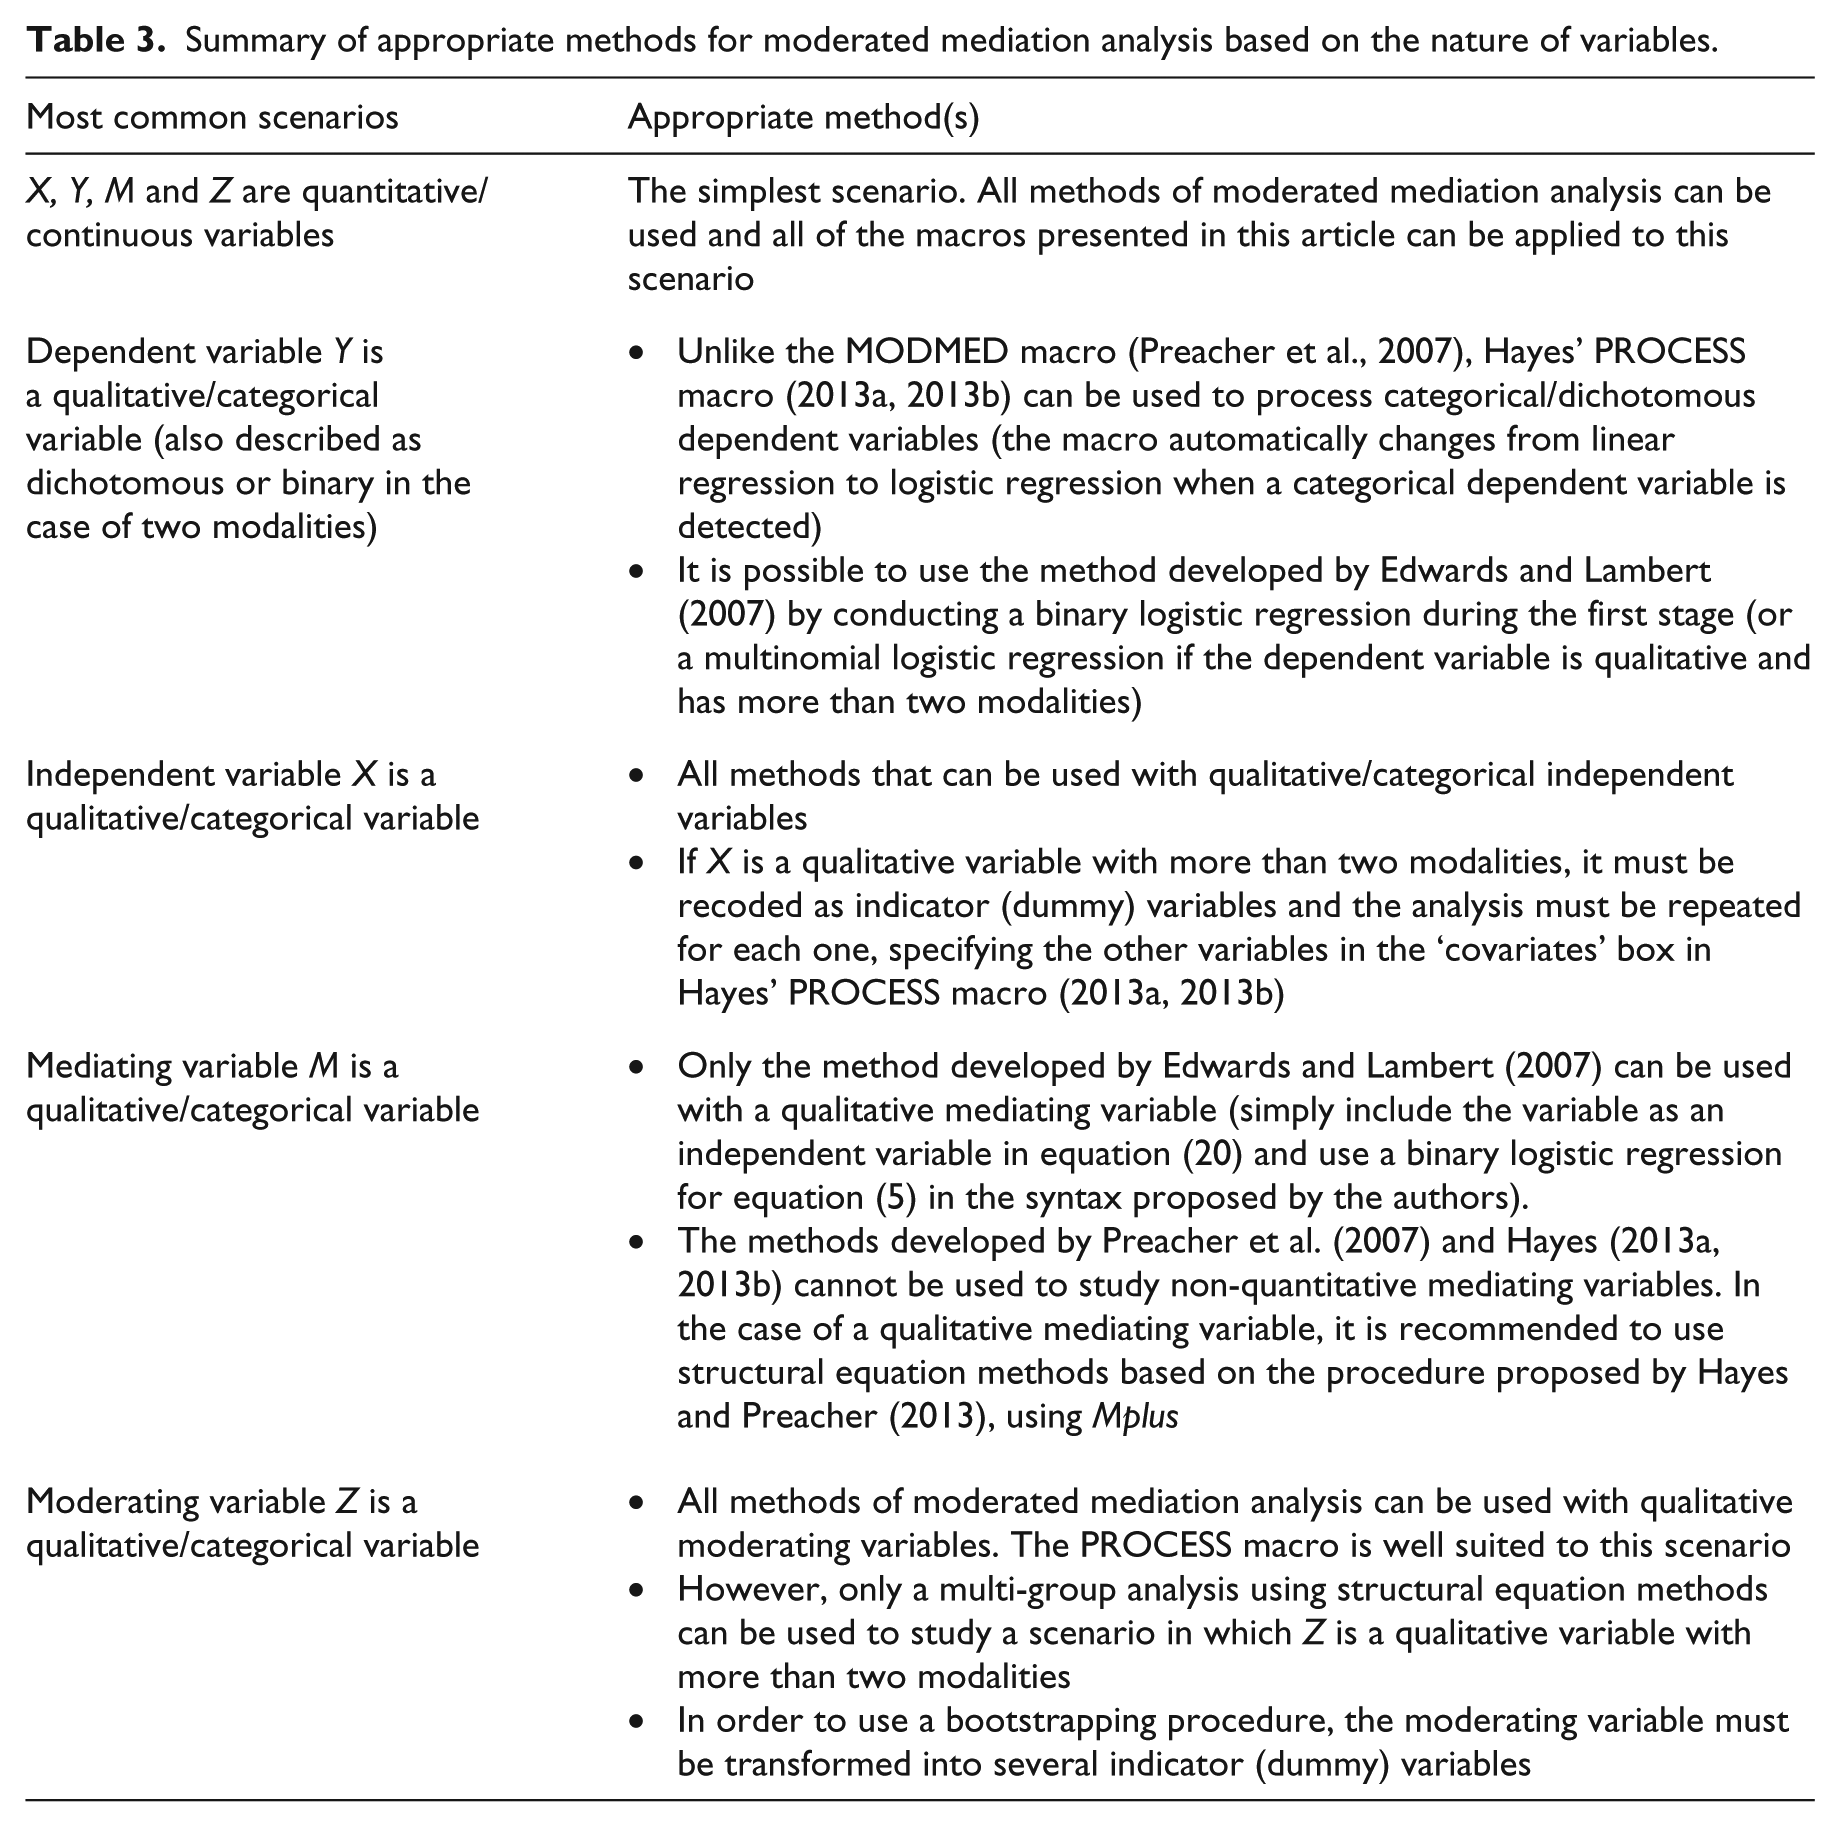
Given the level of refinement and ease of use of the PROCESS macro developed by Hayes (2013a, 2013b), as well as the frequency with which it is used by researchers whose work has been published in the highest ranking marketing journals (see Appendix 1 and Table 2), we recommend using this tool when testing for conditional indirect effects. The user procedure is explained in detail as part of the marketing applications provided in the following section. It should, nonetheless, be noted that one’s choice of method may also depend on the nature of the variables being studied. Valeri and VanderWeele (2013) recently demonstrated the importance of taking into account whether the mediating variables in one’s analysis are of a continuous or categorical nature. Building on these previous studies, we have extended the analysis to the case of moderated mediation, considering the various alternatives based on the nature of the different variables in the model, whether independent, dependent, mediating or moderating. Table 3 indicates the appropriate method(s) for quantitative/continuous or qualitative/categorical variables (dichotomous or binary where variables have no more than two modalities). 11
Summary of appropriate methods for moderated mediation analysis based on the nature of variables.
Developing marketing applications
This section illustrates moderated mediation through several applications in the field of marketing. A website dedicated to our article (see Note 9) further develops these applications and makes the relevant databases available. The first is a simple example of moderated mediation (one mediator and one moderator), with one continuous or dichotomous moderating variable. The second example illustrates a more complex case of moderated mediation, with two mediators and two moderators.
Example 1: Moderated mediation with one mediator and one moderator
Conditional indirect effect hypothesis
This application involves the study of the process through which the perceived physical attractiveness of female models represented in the media (X) has an effect on the perceived congruence with one’s ideal self (M), which in turn affects women’s attitude towards these images (Y). However, the link between congruence with one’s ideal self and attitude towards these images – the second mediation segment – is supposed to be moderated by age (V). The direct link between perceived physical attractiveness and attitude towards the images is also thought to be moderated by age (V). The tested conceptual model is presented in Figure 3.
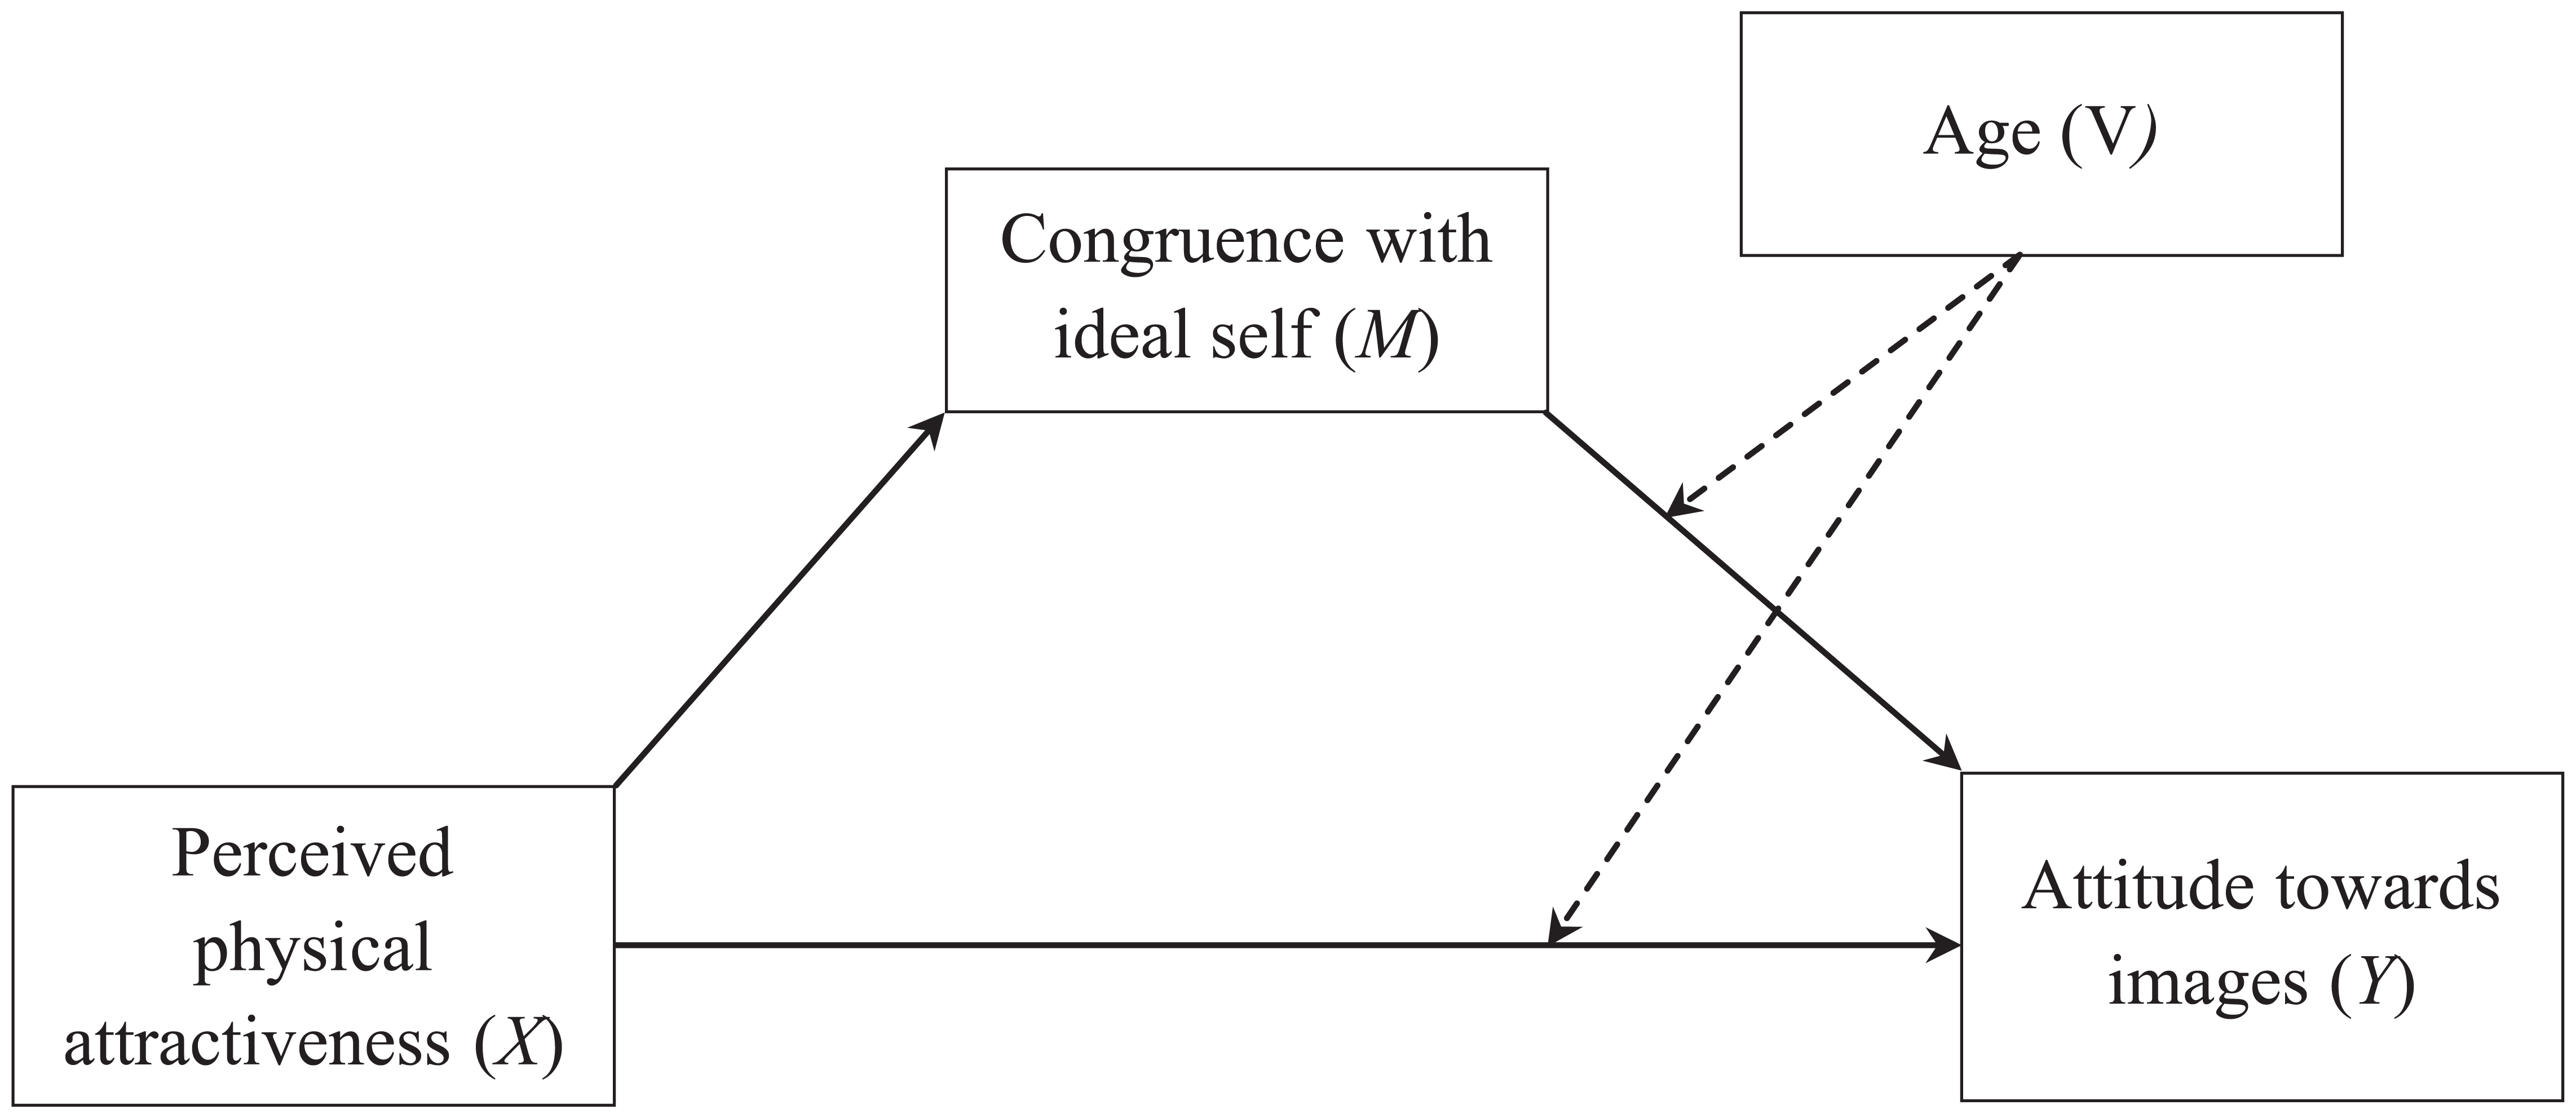
Conceptual research model (Example 1).
The proposed hypothesis for the conditional indirect effect is formulated as follows:
H1. The respondents’ age moderates the strength of the indirect relationship between the perceived physical attractiveness of the female models and attitude towards the images via the congruence with one’s ideal self in such a way that the mediated relationship is weaker (or stronger) when the respondents’ age is high (or low).
Sample and measurement scales
A sample of 509 women aged between 15 and 50 years were interviewed online (average age = 27.3 years; standard deviation = 7.72). Before answering the questionnaire, the respondents were shown a series of images comprising six visual representations of females taken from magazines. All of the measurement scales used are unidimensional and can be considered reliable (Cronbach’s α > 0.80). The ages were provided directly by respondents.
The confirmatory factor analysis, carried out using Amos 17, reveals that the measurement model tested produces very good adjustment indices (Chi-squared/df=1.974 ; RMSEA = 0.044; SRMR = 0.023 ; NFI = 0.986 ; CFI =0.993 ; GFI = 0.975; AGFI = 0.958; AIC = 109/ 4640).
During the data collection, precautions were taken to limit method bias (anonymity and confidentiality were guaranteed and the variables were distributed within the questionnaire). Nonetheless, because the sets of data were collected on a single occasion from the same people, it was necessary to ensure the absence of common method variance bias (Podsakoff et al., 2003). A method factor was therefore introduced and linked to all of the indicators for the model’s latent variables. The results reveal that the additional proportion of total variance (1.97%) falls below the threshold recommended by Williams et al. (1989), therefore ruling out the risk of common method variance bias.
Testing moderated mediation with the PROCESS macro (Hayes, 2013a, 2013b)
In Table 2, we have emphasised the advantages of the approach developed by Hayes (2013a, 2013b) for the analysis of conditional indirect effects. This approach, which provides an easy way to process a large number of moderated mediation models, is used in a PROCESS macro with a bootstrapping procedure (Hayes, 2013a, 2013b) that can be carried out under SPSS (and SAS). The following example illustrates this application under SPSS 19.00:
Download the PROCESS macro (see the detailed procedure in Appendix 2).
Once the macro has been installed, open the SPSS database.
To conduct the moderated mediation analyses, open the PROCESS macro dialogue box (‘Analyses’ > ‘Regression’ > ‘PROCESS’).
In the dialogue box, choose your model:
In the document entitled ‘templates.pdf’, 12 find the conceptual model to be tested from the 76 models provided, and then choose this model by replacing the default value ‘4’ with the corresponding ‘Model Number’. For the purposes of our example, the model number is 15 (see Figure 3). Therefore, ‘Model Number’ = 15.
Specifying your variables.
If the dialogue box is being used, drag the variables to the box, ensuring that the name of each variable in the model is respected; these are specified in ‘templates.pdf’ as variables Y, X, M, W, Z, V or Q (see Appendix 2). The ‘Covariates’ box is reserved for control variables. 13 It is important to ensure that the names of the variables in the SPSS file do not contain more than eight characters. In our example, in accordance with the tags used in Model 15 and Figure 3, we specified the dependent variable by dragging ‘Attitude’ to the ‘Outcome variable (Y)’ box, ‘Attractiveness’ to the ‘Independent variable (X)’ box, the mediating variable(s) (in this case there is just one mediating variable: ‘Congruence’) to the ‘M variables’ box and finally the continuous or categorical moderating variable (in this case ‘Age’) to the ‘Proposed Moderator V’ box (as indicated in Model 15 mentioned above). Regarding the moderating variable(s), note the importance of ensuring that the tag indicated in ‘templates.pdf’ representing the chosen model accurately corresponds to that which appears in the dialogue box (W, Z, V or Q and sometimes M in Models 1, 2 and 3). One final point in relation to the control variables ‘Covariates’ is as follows: as indicated in the bottom right of the dialogue box (tab entitled ‘Covariate(s) in Model(s) of’), the default decision is to control for these variables in respect of both dependent variable Y and mediating variable M. The decision to control only for M or Y must be based on theoretical arguments and will therefore depend on the theory and model tested by the researchers. In our example, we have no control variables so this does not arise.
Setting the number of resamples produced using bootstrap and the level of the CI.
By default, the number of resamples is set to 1,000 in the dialogue box. This should be increased to 5,000 or 10,000. The default value for the CI is 95% in the dialogue box. It is generally recommended to leave this unchanged. Note that while the default proposed bootstrapping method is ‘Bias corrected and accelerated’, it is possible to choose the ‘Percentile’ method, which was recently recommended by Hayes and Scharkow (2013). However, the ‘Bias corrected and accelerated’ method is considered robust and can be used without difficulty (Edwards and Lambert, 2007).
Specifying options and conditions of analysis.
If you decide to center the variables, this can be done automatically by the PROCESS macro. To do this, again using the dialogue box, click on the ‘Options’ tab and tick the box entitled ‘Mean center for products’. Other options such as calculating ‘Effect size’ or comparing ‘Indirect effects’ can be chosen if they correspond to the model being tested. Finally, for some models but not for all, the macro offers the possibility of generating regions of significance for a floodlight analysis (Cadario and Parguel, 2014; Spiller et al., 2013). To choose this option, tick ‘Johnson–Neyman’ in the ‘Conditioning’ tab. For the purposes of our example, we only chose ‘Mean center for products’. The other options and conditions are not available for Model number 15.
To conduct the analysis, click on OK in the dialogue box.
Analysing the results of conditional indirect effects using bootstrap: Two illustrations
We will now present two possibilities, depending on whether the moderating variable is quantitative/continuous or qualitative/dichotomous. When the PROCESS macro is launched as explained above, the results of the moderated mediation will be automatically displayed in the SPSS results window (see Appendices 2 and 3). For the purposes of this application, the products of the variables were centred by ticking the box entitled ‘Mean center for products’ in the ‘Options’ tab within the dialogue box, as already explained. The number of resamples was set at 10.000.
Case 1
Testing for conditional indirect effect in the case of one continuous moderating variable (age declared by respondents in years) (see Table 4 and Figure 4).
In the case of Model 15, with one continuous moderating variable, the moderated mediation index is displayed explicitly in the results (Appendix 3). This is the 95% CI in section ‘Moderated mediation index’ at the bottom of the page. The moderated mediation effect is significant as the CI excludes zero [−0.0222; −0.0033]. H1 is therefore validated.
It is now possible to localise the moderating effect: on the second mediation segment or on the direct effect, as specified in the model tested (see Figure 3). This involves observing the significance and CIs of the interactive terms (in the SPSS output, look at
The final step is to observe the results of the 95% CI in section ‘Conditional indirect effects of X on Y for the different moderator values’ at the bottom of the page. Three CIs are given for each moderator value: (1) mean minus standard deviation, (2) mean and (3) mean plus standard deviation. This application produced the following intervals: Mean minus standard deviation (lower age group): CI = [0.1531; 0.3358]; Mean (average age group): CI = [0.0849; 0.2135]; Mean plus standard deviation (upper age group): CI = [−0.0554; 0.1522].
Testing for conditional indirect effect: the case of a continuous moderating variable (Example 1, Case 1).
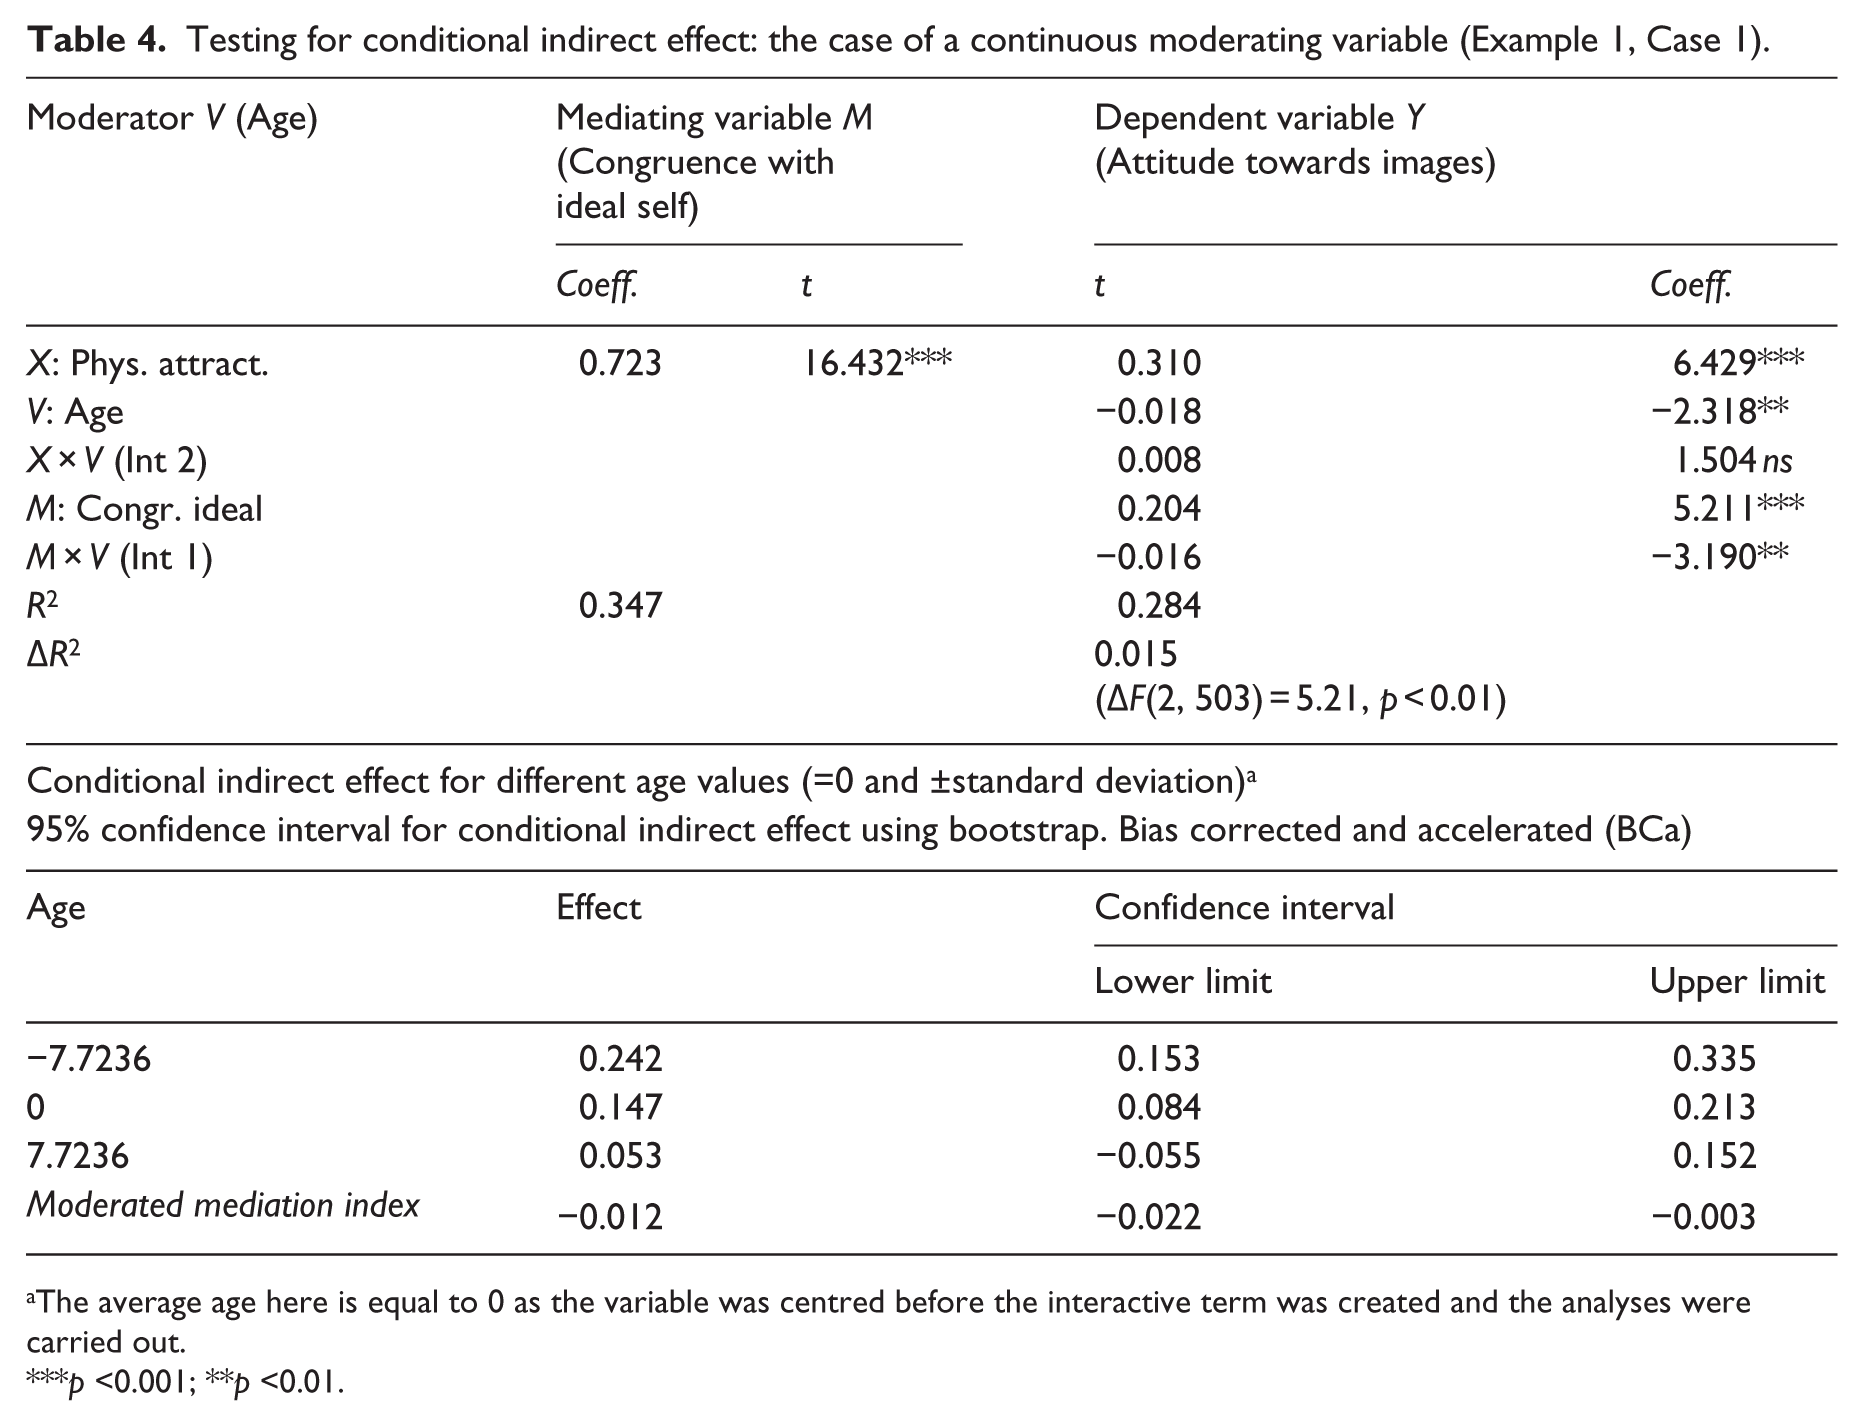
The average age here is equal to 0 as the variable was centred before the interactive term was created and the analyses were carried out.
p <0.001; **p <0.01.
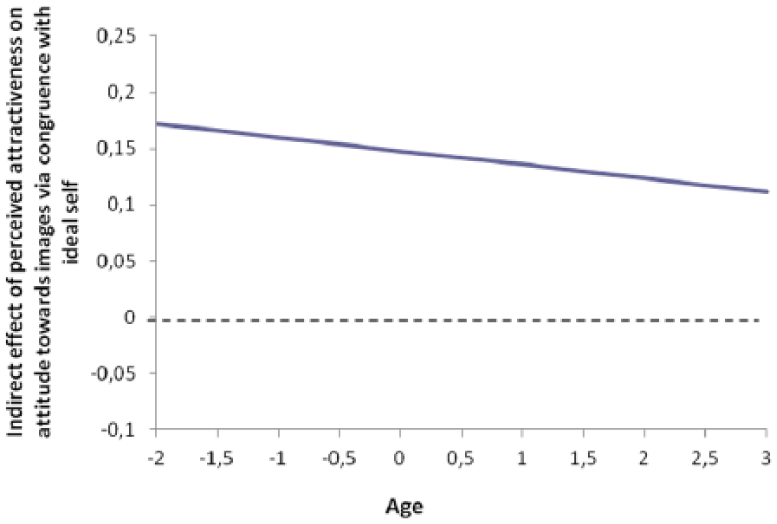
Visual representation of the linear function in relation to the effect of age (continuous variable) on the indirect effect of perceived physical attractiveness on attitude towards images via congruence with ideal self (Example 1, Case 1).
These results show that the conditional indirect effect is significant in the lower and average age groups since the 95% CI excludes zero. In the case of the upper age group, the conditional indirect effect is not significant as the CI includes zero.
Case 2
Testing for conditional indirect effects in the case of one dichotomous moderating variable (in this example, two age groups have been artificially created for the purposes of illustration by discretising the continuous variable previously used 14 ) (see Table 5 and Figure 5).
In order to establish the presence of moderated mediation, you need to observe the result for the 95% CI in section ‘Moderated mediation index’ (in Appendix 4). The moderated mediation effect proves to be significant as the CI excludes zero [−0.3592; −0.1057]. H1 is therefore validated.
Since the moderation hypothesis once again relates to the second mediation segment (M → Y) and the direct effect (X → Y) that corresponds to Model 15, it is important to identify in which case the moderation is significant. To do this, look at the significance and CIs of the interactive terms. In the SPSS output, look at the results for
In order to interpret these results, we must now look at the CIs obtained when testing for the conditional indirect effect of X on Y for the two moderator values (in the case of this study, CI = [0.1900; 0.3514] for the lower moderator value and [−0.0564; 0.1373] for the higher value). These results indicate that when the moderator has a low value (in the case of the lower age group here), the conditional indirect effect is significant as the CI excludes zero. In contrast, when the moderator has a high value (upper age group), the conditional indirect effect is not significant as the CI includes zero.
Testing for conditional indirect effect: the case of a categorical/dichotomous moderating variable (Example 1, Case 2).
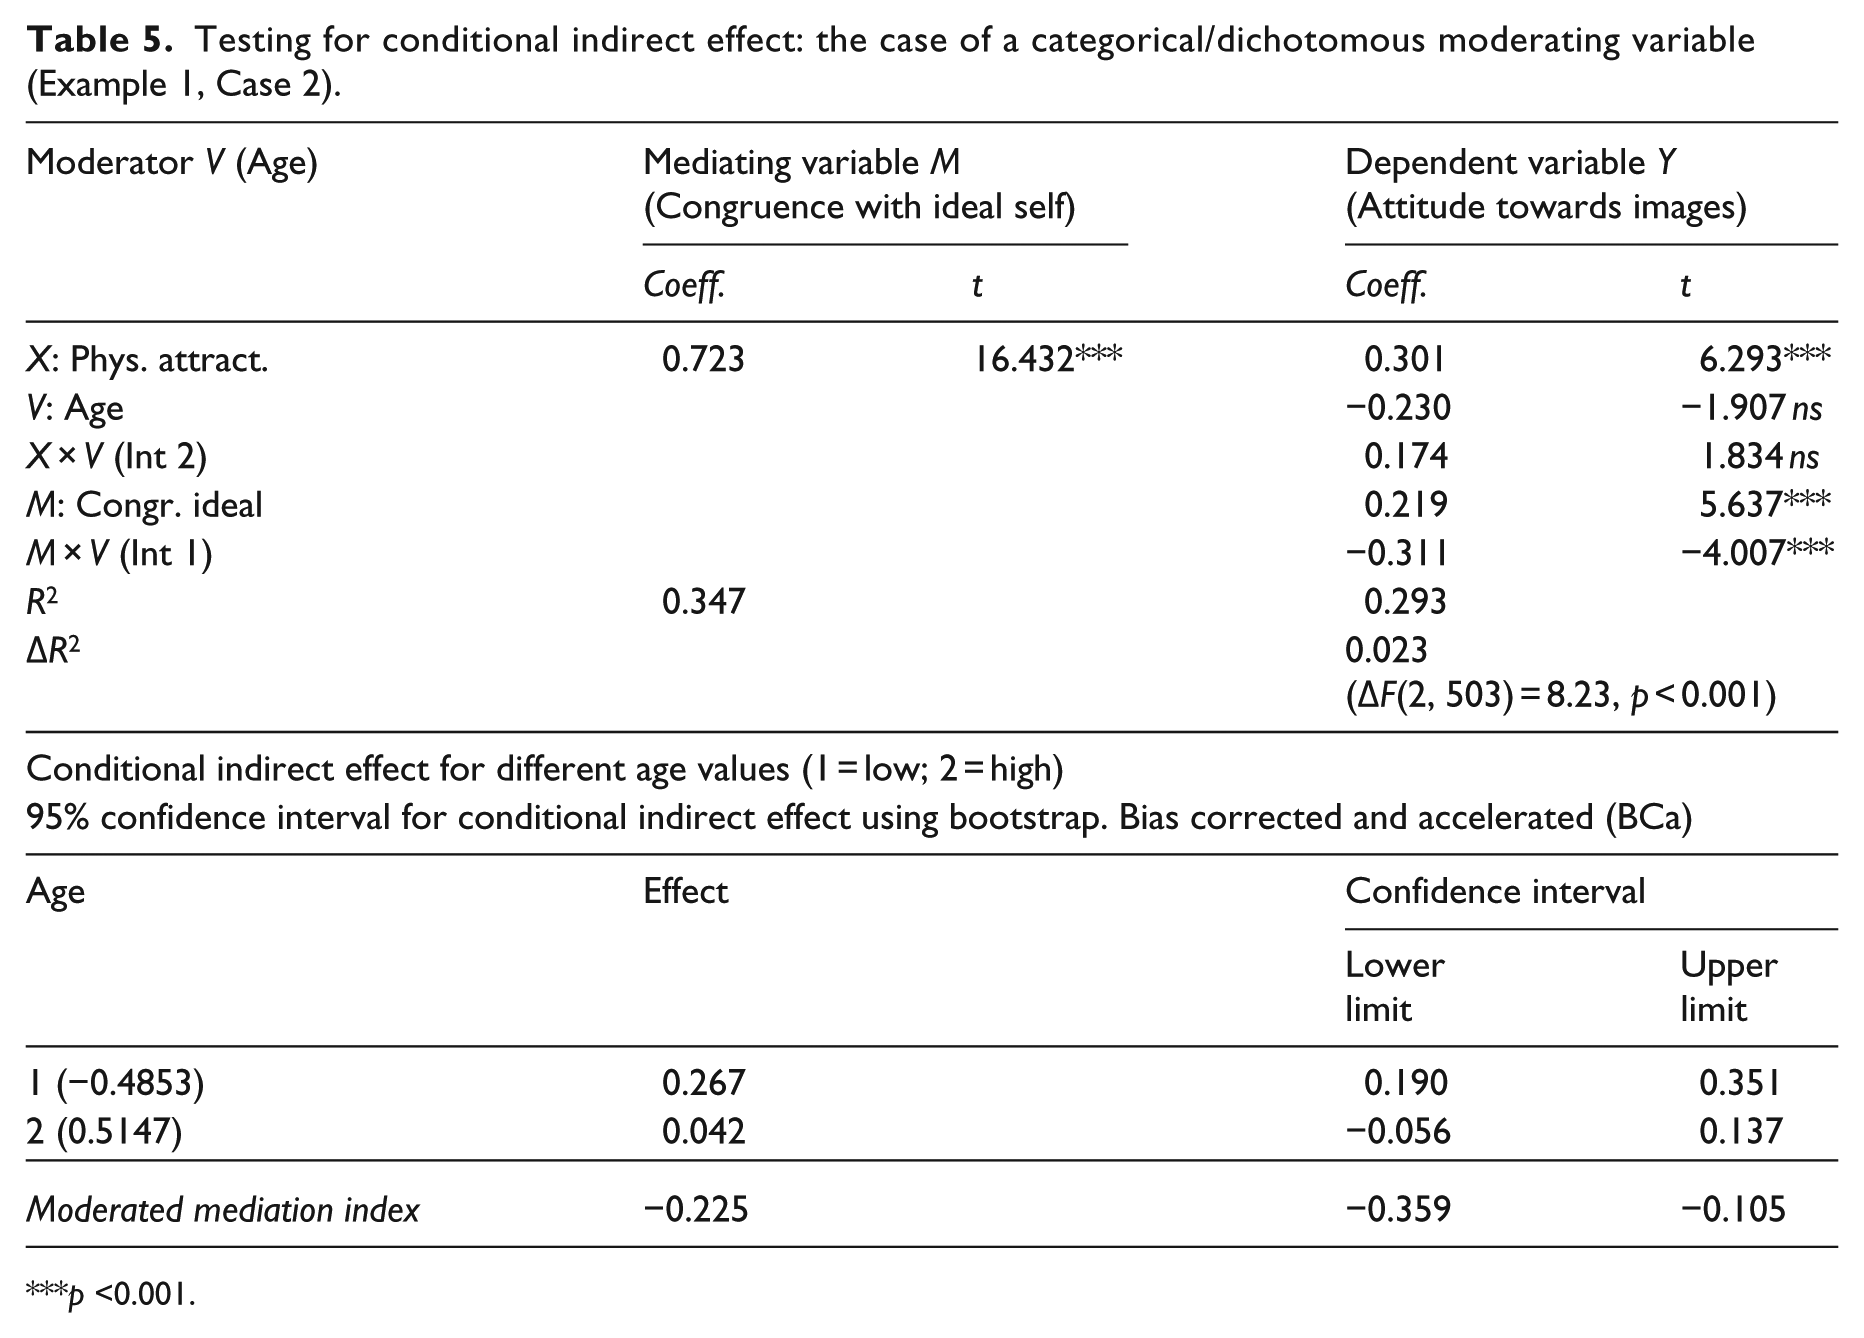
p <0.001.
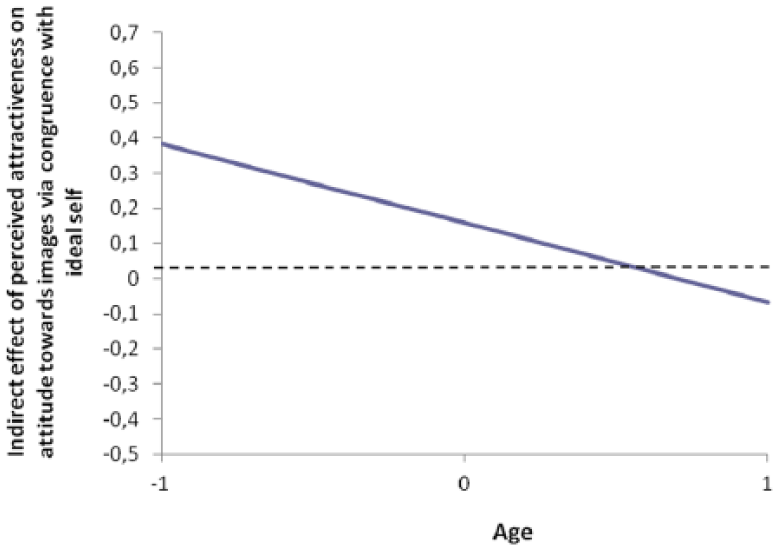
Visual representation of the linear function in relation to the effect of age (binary variable) on the indirect effect of perceived physical attractiveness on attitude towards images via congruence with ideal self (Example 1, Case 2).
Interpreting the results
The proposed hypothesis was that the indirect effect of physical attractiveness on attitude towards the images via the congruence with one’s ideal self is positive. We also postulated that this link is reinforced (or attenuated) when the age of the respondents is low (or high). In both cases analysed above (continuous or dichotomous moderator), the conditional indirect effect is verified. The age of respondents therefore significantly moderates the indirect effect. The indirect effect is only significant in the lower age group (youngest respondents). Regarding the localisation of the moderating effect, our observation of the interaction effects shows that the interactive term ‘Congruence × Age’ does indeed have a negative and significant effect on attitude towards the images (continuous moderating variable: coeff. = −0.0169, p < 0.01/dichotomous moderating variable: coeff. = −0.3113, p < 0.001). Therefore, as the age falls, the relationship between the congruence with one’s ideal self and attitude towards the images is strengthened.
Our model also postulated a moderating effect on the direct link between perceived physical attractiveness and attitude towards the images. However, the factor ‘Attractiveness × Age’ has no impact on attitude towards the images. In other words, age does not moderate the link between perceived attractiveness and attitude towards the images (continuous moderating variable: coeff. = 0.0086, p = ns/dichotomous moderating variable: coeff. = 0.1748, p = ns).
To summarise, when considering our model without accounting for a potential mediation effect, we found that age moderated the second half of the model but not the direct effect. In order to complete the analysis, it is important to calculate the R2 variation (ΔR2), which represents the proportion of explained variance through the interactive term beyond the direct and main effects of the other variables. The PROCESS macro only provides ΔR2 for certain models but not for all of the existing models. In our example, and for Model 15, this value is not given automatically; we obtained it by carrying out a simple moderated hierarchical regression using SPSS (Aguinis, 2004; Aiken and West, 1991; Cohen et al., 2003). In Case 1, when age was taken as a continuous variable, ΔR2 was equal to 0.015 [ΔF[2, 503] = 5.21, p < 0.01]. In Case 2, when age was taken as a dichotomous variable, ΔR2 was equal to 0.023 [ΔF[2, 503] = 8.23, p < 0.001]. These values are significant although they may seem reduced; they correspond to the standard R2 variation in analyses of interaction effects (Dawson, 2014).
Graphic representation
To make it easier to interpret the results, it is always useful to plot the moderating effects (Aguinis and Gottfredson, 2010; Aiken and West, 1991; Dawson, 2014; Hayes, 2013b). Graphic representations of the moderated mediation were produced using Hayes’ approach (2013b). This involves tracing a simple straight line (y = ax + b) that corresponds to a linear function which establishes a link between the indirect effect and the moderator. To determine this equation, simply refer to the Templates file provided with the macro. Depending on the model being studied (Models 1–76 in the Templates file), the gradient of this line is obtained differently. The appropriate equation is therefore indicated under each model in the Templates file. In the case of Model 15, the equation for conditional indirect effect is as follows: ai (b1i + b2iV). This equation can be reformulated as follows:

In this equation, V is the moderator (continuous variable), (a × b1) is the intercept point and (a × b2) is the gradient. The gradient represents the weight of the function that links the indirect effect to the moderator; this is the moderated mediation index (index in the results output under SPSS). So, for the purposes of our application, if age is taken as a continuous moderating variable, we can represent the moderated mediation using the following equation (see boxes in SPSS outputs – Appendices 3 and 4 – to find the following values)
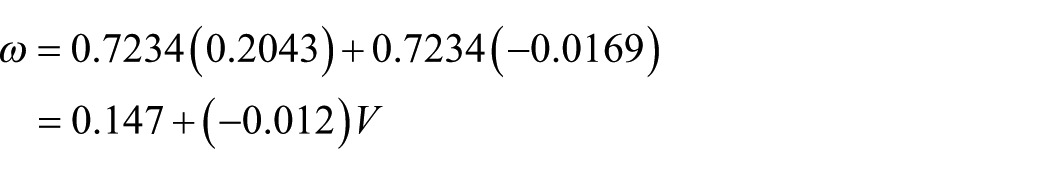
However, when the moderating variable is dichotomous, even though the same model is used, the index (or gradient) is not obtained in the same way. According to Hayes (2013b), if the two figures used to code the groups of a dichotomous moderator are only one point apart (e.g. 1 and 2), the moderated mediation index corresponds to the difference between the two conditional indirect effects. In this case, the index was obtained by calculating the difference between the conditional indirect effect for the upper age group (0.042) and the conditional indirect effect for the lower age group (0.267). This gives us the following equation
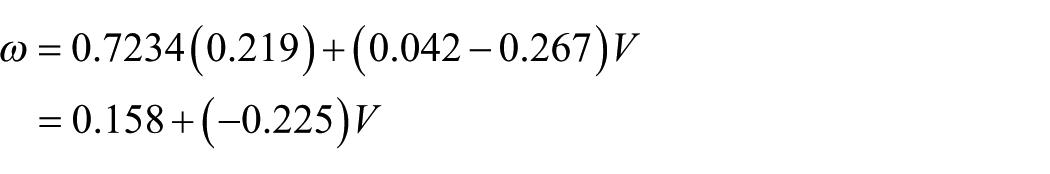
According to our results, the two moderated mediation indices are negative, indicating that the indirect effect of perceived physical attractiveness (X) on attitude towards the images (Y) via the perceived congruence with one’s ideal self (M) is a decreasing function of age (V). The higher the age, the weaker the indirect effect, as is illustrated by the gradient in the previous two graphs. It should, nonetheless, be noted that the gradient is steeper when the moderator is binary; this is in line with recent studies that have criticised the dichotomisation of moderating variables, as this tends to exacerbate the results obtained (see Cadario and Parguel, 2014).
Example 2: Moderated mediation with two mediators and two moderators
Conditional indirect effect hypothesis
In this second application, we study the process through which the perceived originality of an advertisement (X) has an effect on both attitude towards the advertisement (M1) and attitude towards the brand (M2), which in turn affect purchasing intentions (Y). Furthermore, the links between X and M (1 and 2) – the first mediation segments – and the links between M (1 and 2) and Y – the second mediation segments – appear to be moderated by resistance to advertising in general (W) and one’s involvement in the medium in which the advertisement appeared (Z). It is important to point out that this model only includes two-way interactions and not three-way interactions. The conceptual model tested is presented in Figure 6.
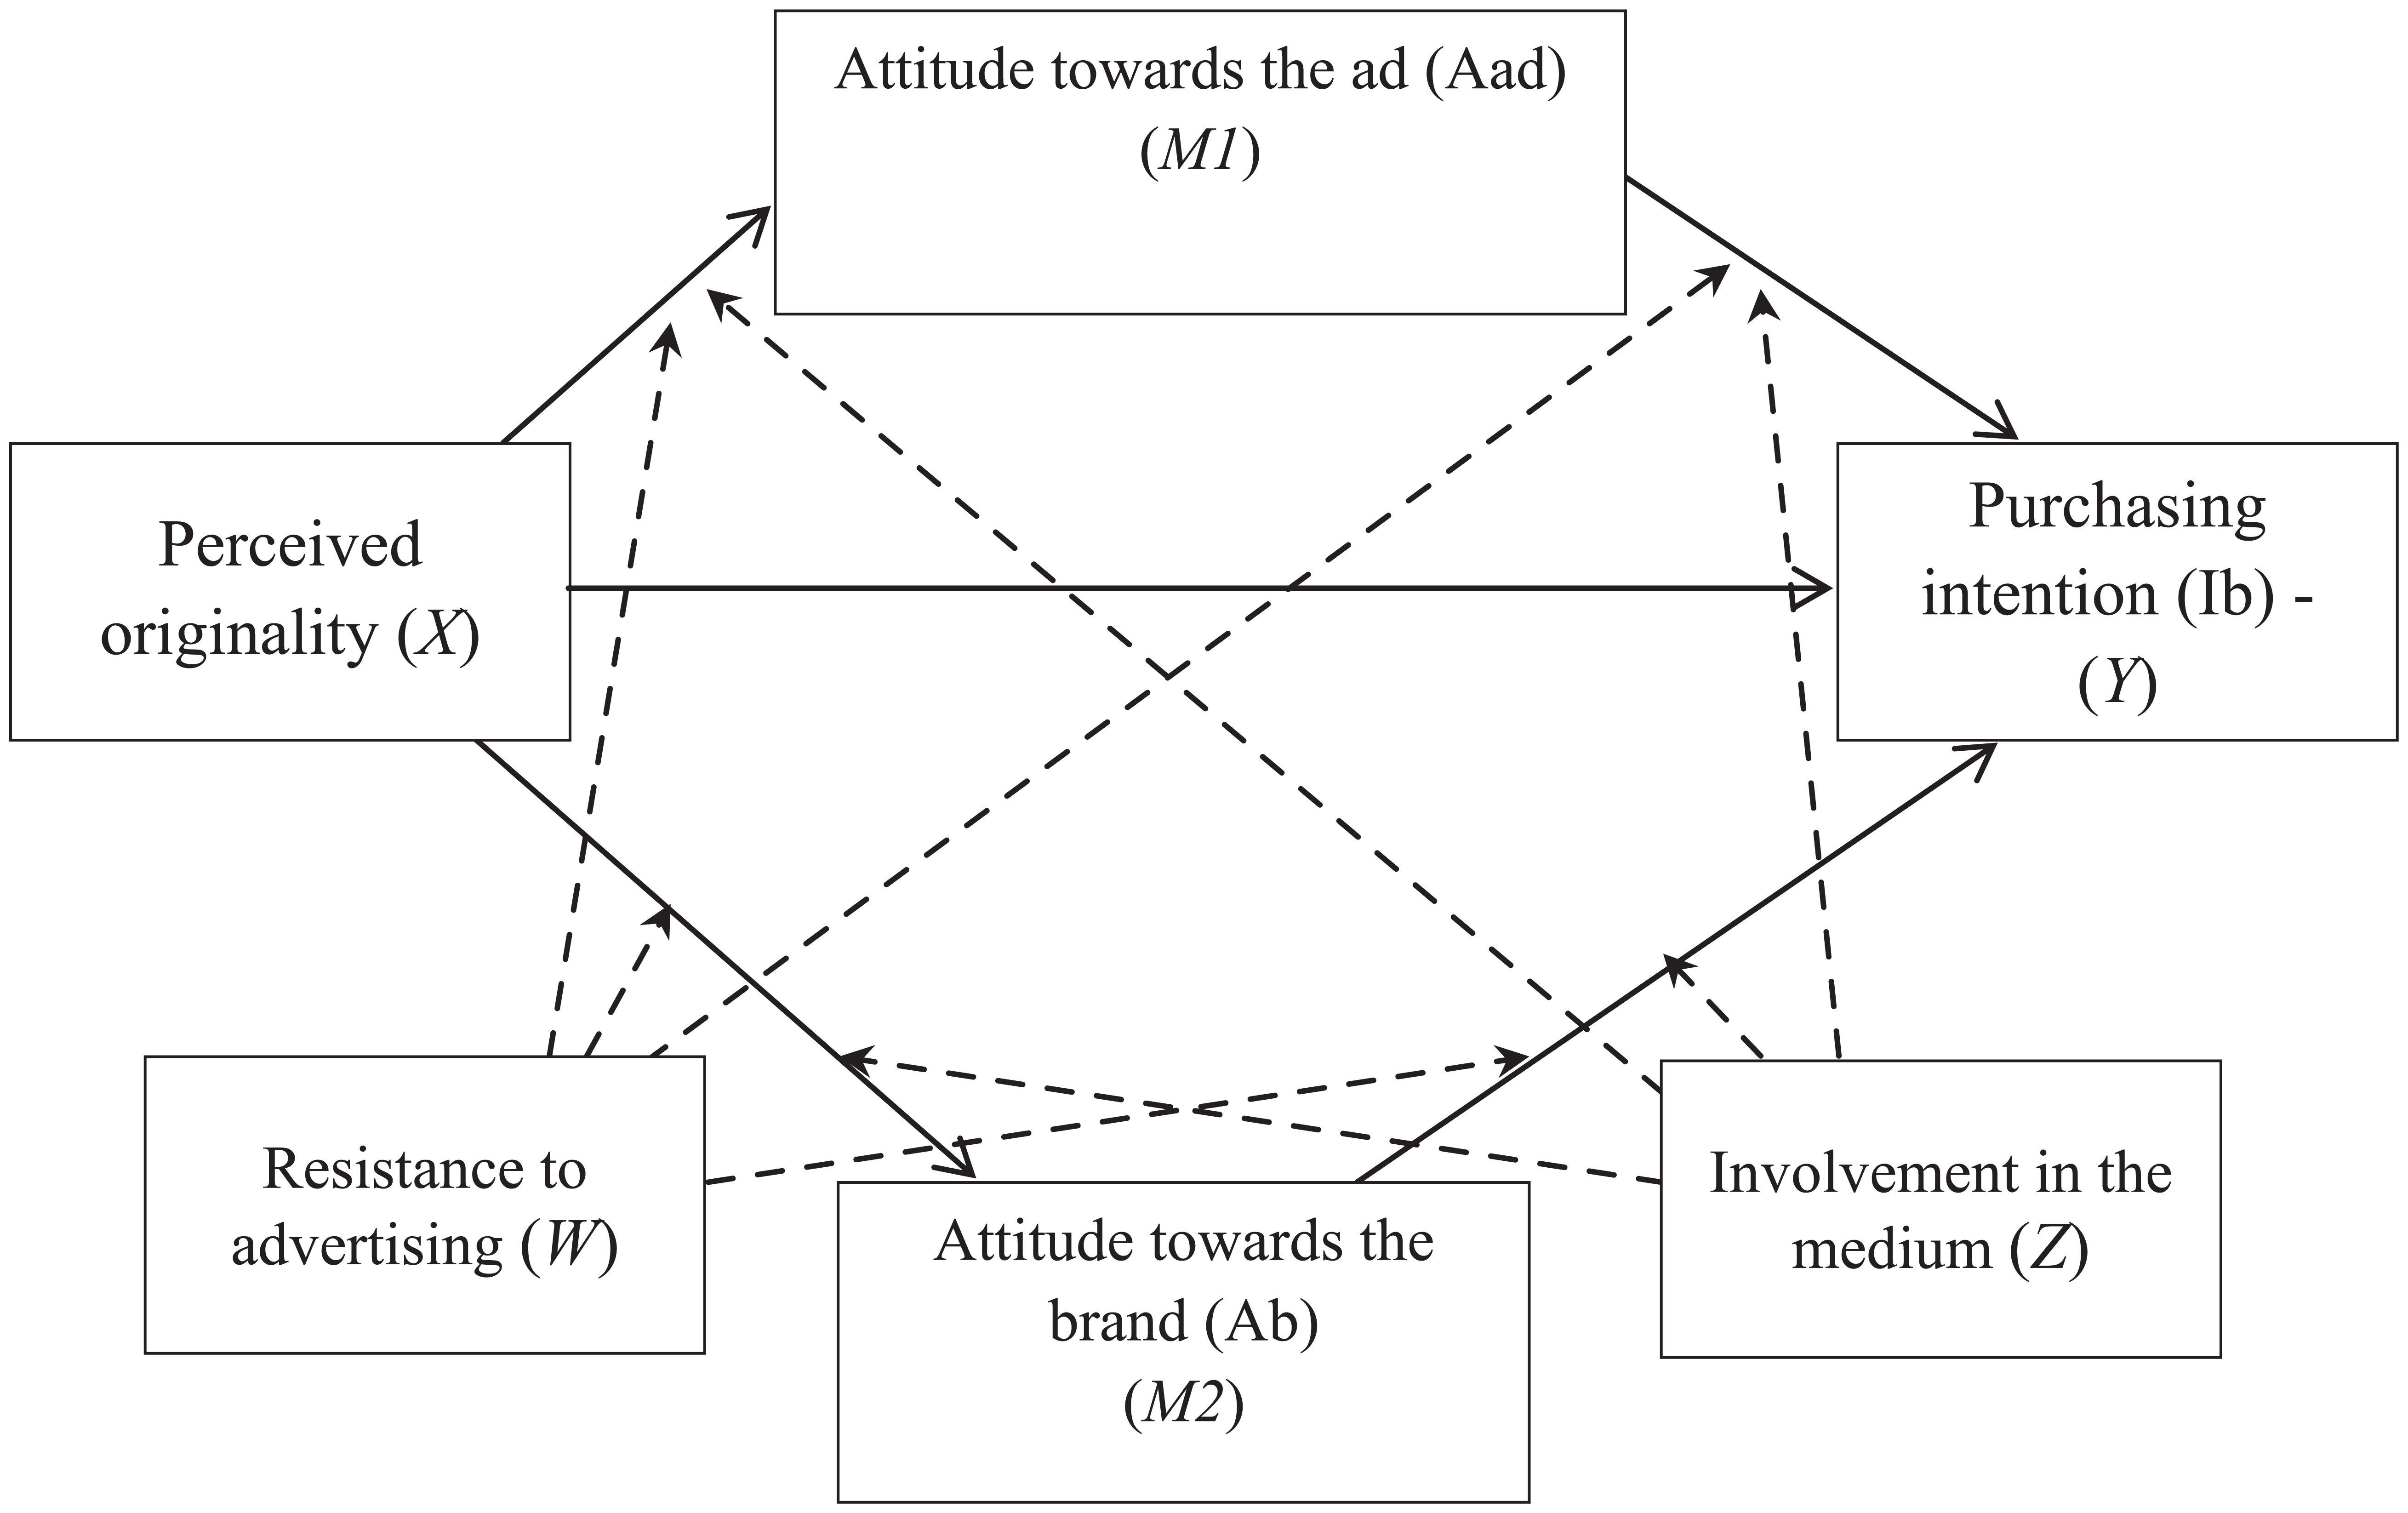
Conceptual research model (Example 2).
The proposed hypothesis for the conditional indirect effect is formulated as follows:
H1. Resistance to advertising and involvement in the medium concerned moderate the strength of the indirect links between the originality of the advertisement and purchasing intentions via attitude towards the advertisement and attitude towards the brand, in such a way that the relationships of mediation are stronger (or weaker) where resistance to advertising and involvement in the medium are high (or low).
Sample and measurement scales
A sample of 373 individuals participated in an online questionnaire. Before providing their answers, the respondents were shown an advertisement. The measurement scales used are all unidimensional and can be considered reliable (Cronbach’s α > 0.90).
The confirmatory factorial analysis, carried out using Amos 17, shows that the model tested produces very good adjustment indices (Chi-squared/df = 1.828, RMSEA = 0.047, SRMR = 0.041, NFI = 0.969, CFI = 0.986, GFI = 0.936, AGFI = 0.912 and AIC = 356/8,205).
During the data collection phase, the same precautions were taken as in the previous example in order to limit common method variance bias (Podsakoff et al., 2003).
Testing moderated mediation with the PROCESS macro (Hayes, 2013a, 2013b)
To test for moderated mediation using the PROCESS macro, all eight stages detailed above in Example 1 must be repeated. Based on the conceptual model being tested, Model 75 was chosen from the document entitled ‘templates.pdf’, and the corresponding variables were specified in the macro: independent variable ‘Originality’ (Independent variable X), mediating variables ‘Attitude towards the advertisement’ and ‘Attitude towards the brand’ (M variables), dependent variable ‘Purchasing intention’ (Outcome variable Y) and finally moderating variables ‘Resistance to advertising’ (Proposed Moderator W) and ‘Involvement in the medium’ (Proposed Moderator Z; as indicated in Model 75). Again, only the option ‘Mean center for products’ has been ticked to centre the products of the variables. Note once again that it is essential to ensure that the names of the variables do not include more than eight characters in the SPSS file.
Analysing the results of conditional indirect effects using bootstrap
In the case of Model 75, the moderated mediation index is not explicitly dis-played in the SPSS results (Appendix 5). The conditional indirect effects for each mediator and each moderator can be seen in section ‘Conditional indirect effects of X on Y for the different moderator values’ at the bottom of the results page (see Step 3).
Before commenting on the results of the conditional indirect effects, and following the same logic as in Example 1, it is possible to localise the moderating effects on the various segments, as specified in the model tested (see Figure 6). To do this, simply look at the significance and CIs of the interactive terms. For the model tested (Model 75 with two mediators and two moderators), a total of six interaction effects are estimated. For example, in the SPSS output,
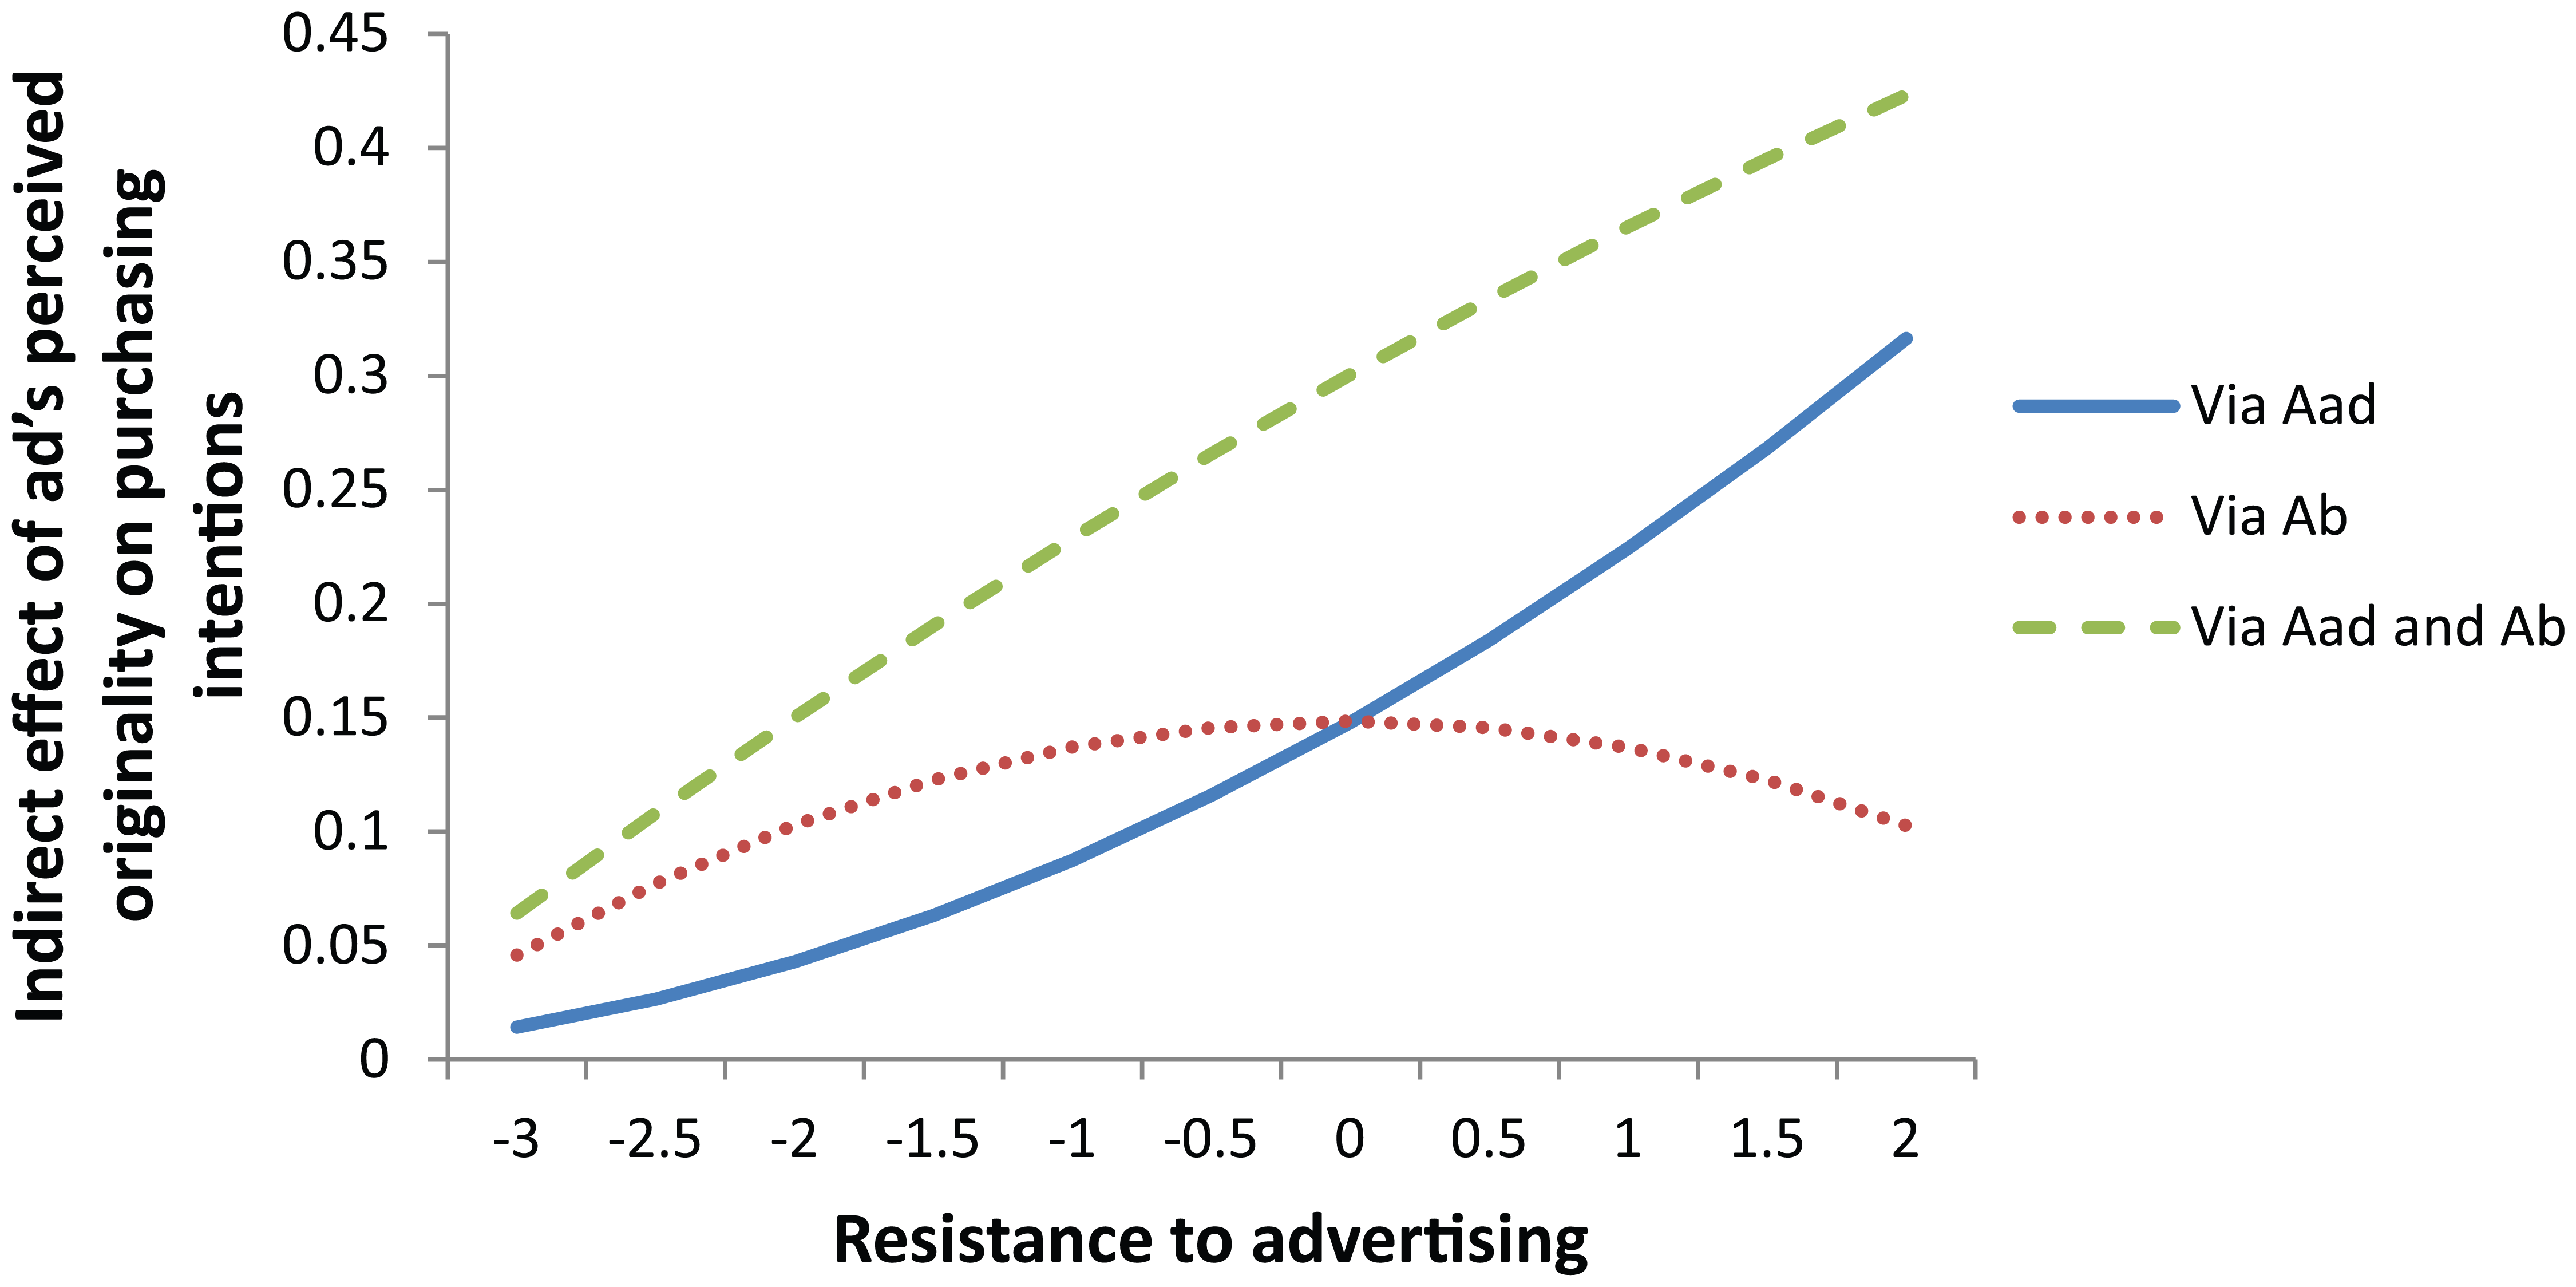
It is during the final step that the results of the conditional indirect effects can be observed. A total of 18 CIs are specified within two blocks, corresponding to the 18 possible combinations between the different mediators and moderators: nine combinations for the first mediator (M1: Attitude towards the advertisement) and nine others for the second mediator (M2: Attitude towards the brand). Within each block, you can see the interaction effects of the two moderators in terms of their respective levels: low (mean minus standard deviation), mean, and high (mean plus standard deviation). In this application, the following intervals can be observed in the first block (where the mediating variable (M1) is Attitude towards the advertisement): When the level of resistance is low, regardless of the level of involvement in the medium (see first three lines of block 1), the indirect effect is not significant as the CI includes zero (CIlow involvement in medium = [−0.0449; 0.1697], CIaverage involvement in medium = [−0.0108; 0.1355] and CIhigh involvement in medium = [−0.0042; 0.1479]). When the level of resistance to advertising is average or high, regardless of the level of involvement in the medium (see last six lines of block 1), the conditional indirect effects are all significant as the 95% CIs exclude zero.
Testing for conditional indirect effects (Example 2).
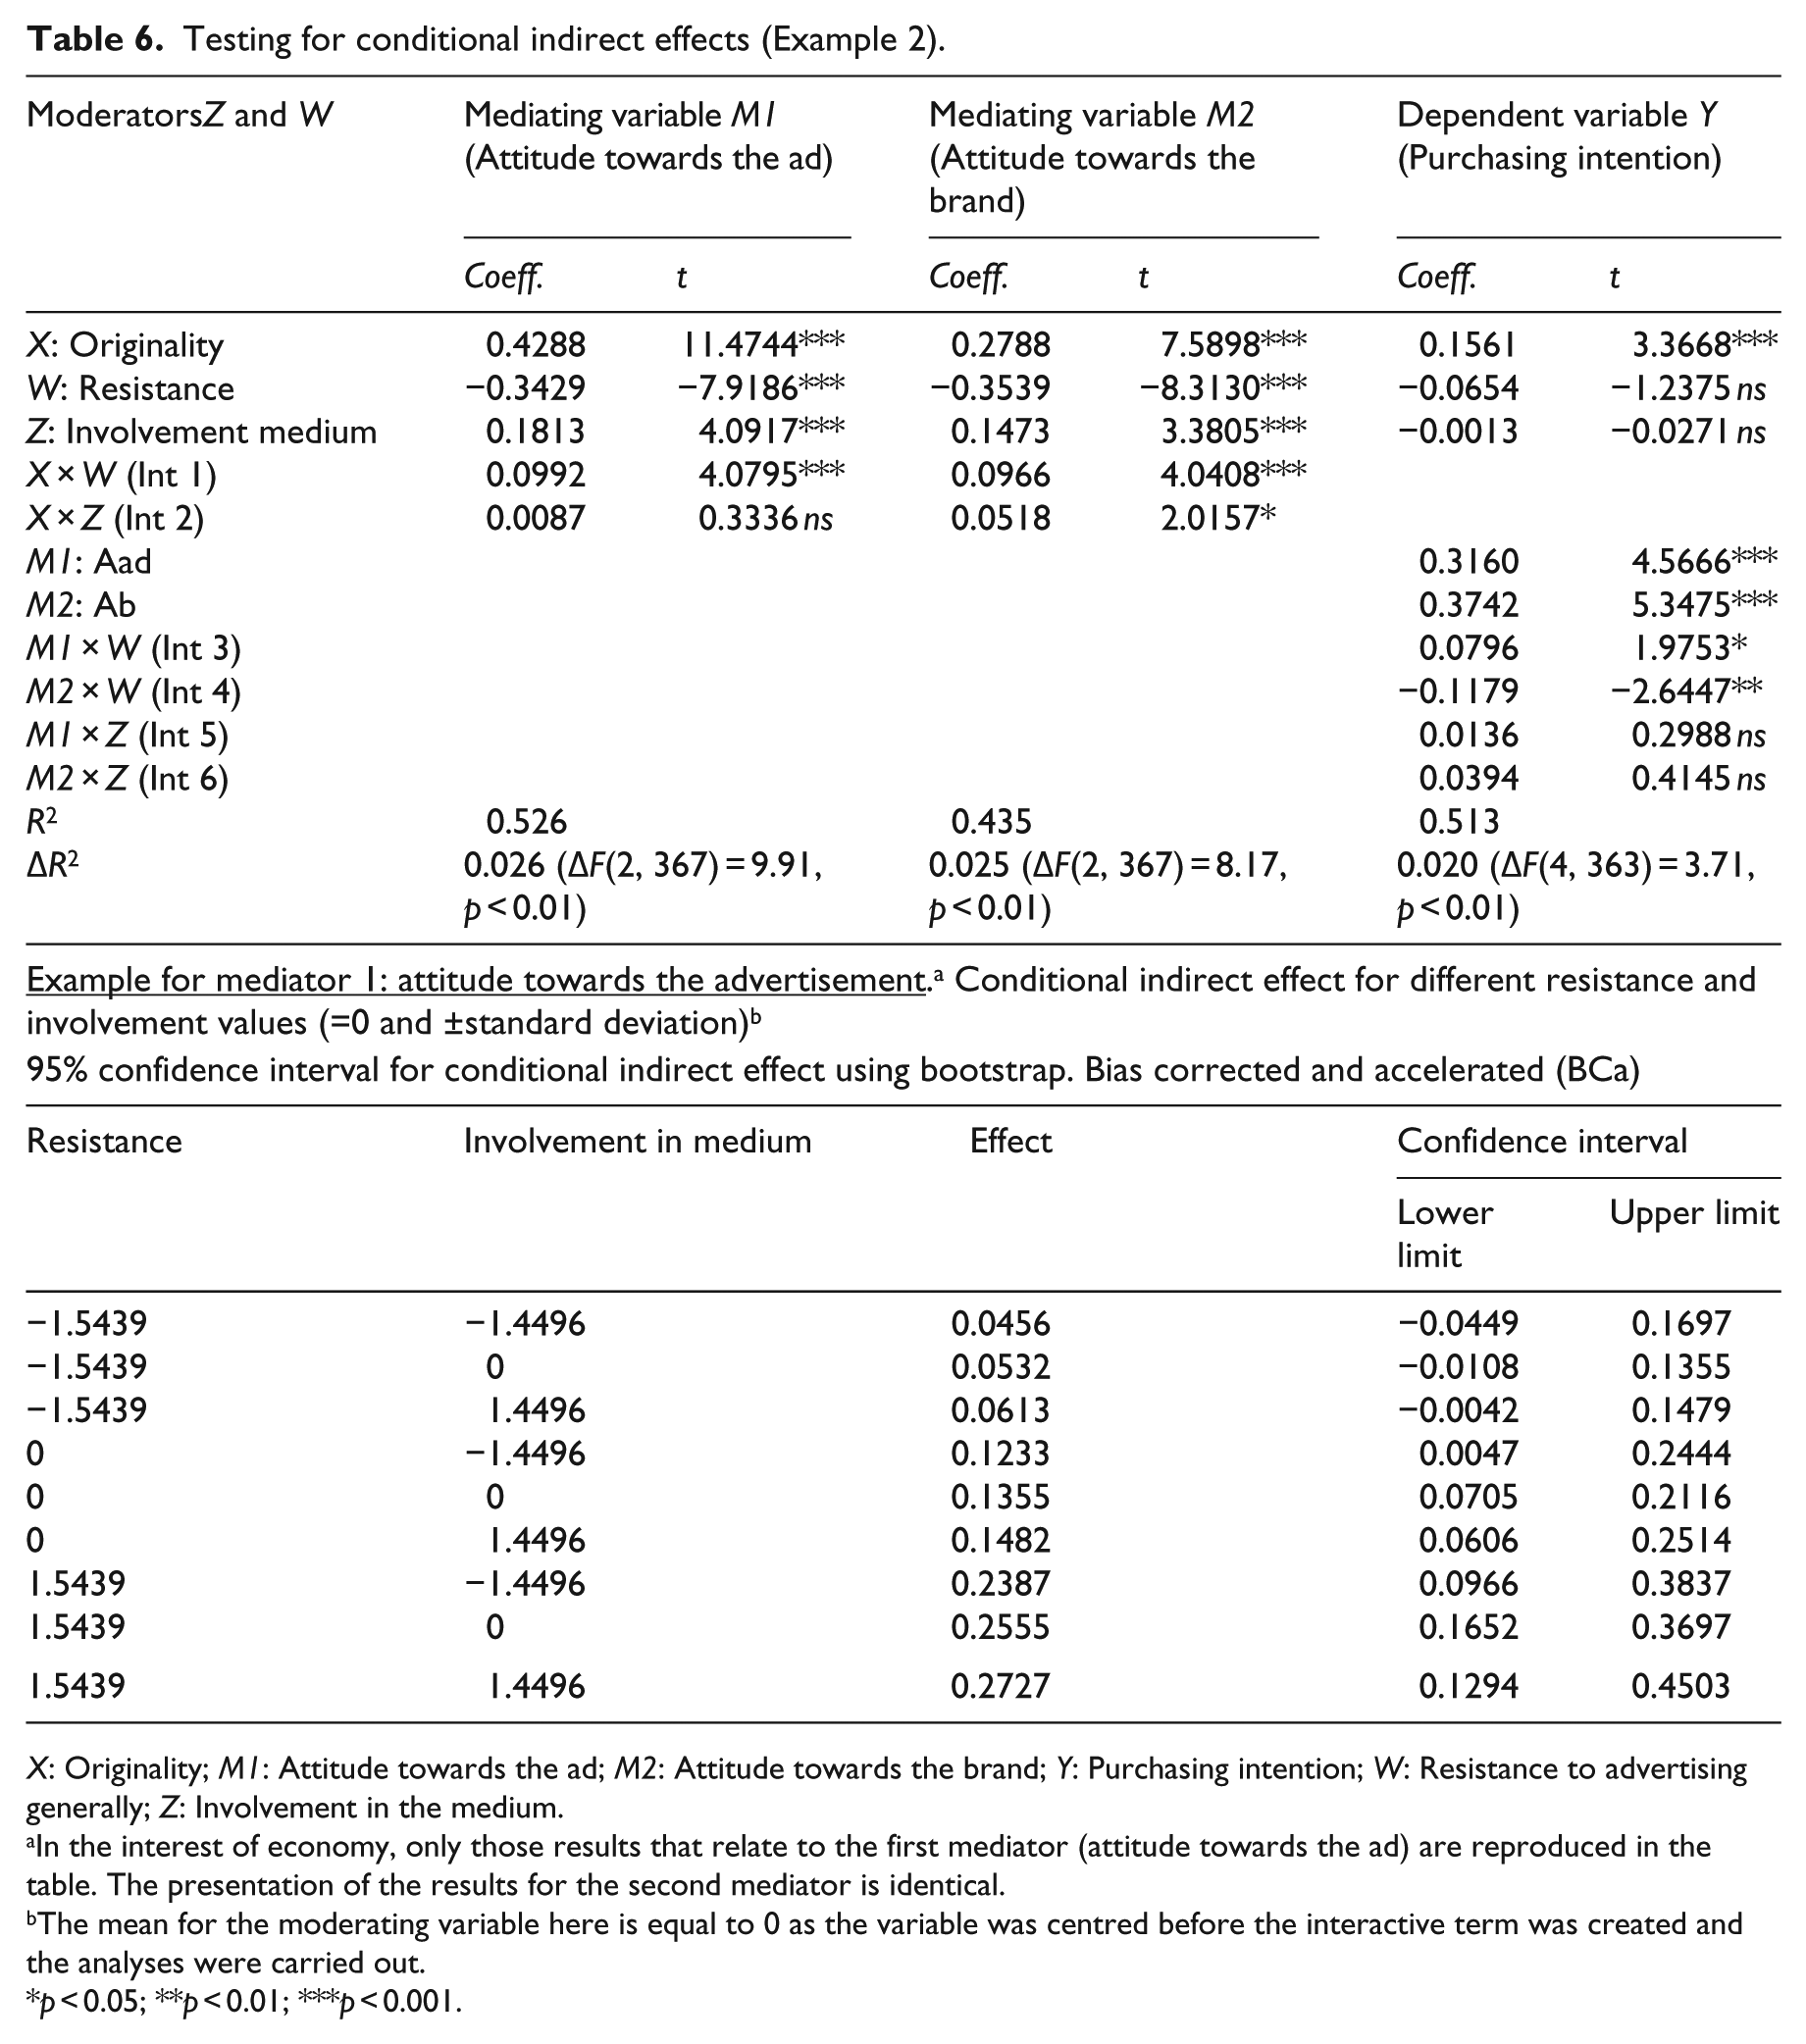
X: Originality; M1: Attitude towards the ad; M2: Attitude towards the brand; Y: Purchasing intention; W: Resistance to advertising generally; Z: Involvement in the medium.
In the interest of economy, only those results that relate to the first mediator (attitude towards the ad) are reproduced in the table. The presentation of the results for the second mediator is identical.
The mean for the moderating variable here is equal to 0 as the variable was centred before the interactive term was created and the analyses were carried out.
p < 0.05; **p < 0.01; ***p < 0.001.
The exact same logic is used to analyse the results of the conditional indirect effects via the second mediator (M2: Attitude towards the brand). This gives us the following:
When involvement in the medium is low combined with a low or high level of resistance (see the first and seventh lines of block 2), the indirect effect is not significant as the CI includes zero (CIlow resistance = [−0.0519; 0.1322] and CIhigh resistance = [−0.0134; 0.1355]).
In all other cases, the conditional indirect effects are significant as the 95% CIs exclude zero.
Interpreting the results
The moderated mediation hypothesis formulated above is based on the indirect effect of the advertisement’s perceived originality on purchasing intentions via attitude towards the advertisement and attitude towards the brand. We also postulated that mediation links are strengthened (or attenuated) when resistance to advertising and involvement in the medium are high (or low). These conditional indirect effects are partly verified.
Regarding mediation via attitude towards the advertisement, only resistance to advertising generally moderates the indirect effect via attitude towards the advertisement. This indirect effect is only significant when resistance is average or high, regardless of the level of involvement in the medium. This involvement does not therefore moderate the indirect effect. Regard-ing mediation via attitude towards the brand, resistance to advertising and involvement in the medium both play a moderating role. The indirect effect is significant in all cases, except where involvement in the medium is low and resistance is low or high.
Regarding the localisation of the moderating effects on the first segments (between the independent variable and the mediating variables), the observation of interaction effects shows that interactive term 1,
The localisation of the moderating effects on the second segments (between the mediating variables and the dependent variable) is done in the same way. Interactive term 3,
To summarise, when moderating effects alone are considered (and not conditional indirect effects), resistance to advertising moderates both the first and second halves of the model, irrespective of which mediator is taken into account (attitude towards the advertisement or towards the brand). However, the involvement in the medium only moderates the first half of the model between the originality of the advertisement and attitude towards the brand.
Graphic representation
In order to graph the conditional indirect effects, you must first identify the appropriate equation for the model treated in the Templates file. The coefficients must then be replaced by the values obtained in the results on moderated mediation. In the case of Model 75, there were two moderators (W and Z), which means using an equation with two unknowns. Hayes (2014) 15 recommends setting different values one by one for W followed by different values for Z. This gives us six different equations. The first three illustrate the link between Z and the indirect effect for three W values (low, average and high); the following three represent the effect of W for three Z values (low, average and high). It is important to note that unlike the plots in application 1, those produced here do not represent straight lines but rather curves. This is due to the fact that Model 15 (Example 1) deals with a linear effect between a moderator and an indirect effect, which is not the case in Model 75, which simultaneously uses two moderators. Furthermore, each plot indicates the indirect effect based only on the first mediator (attitude towards the advertisement), only on the second mediator (attitude towards the brand) or both mediators (Figures 7–12).
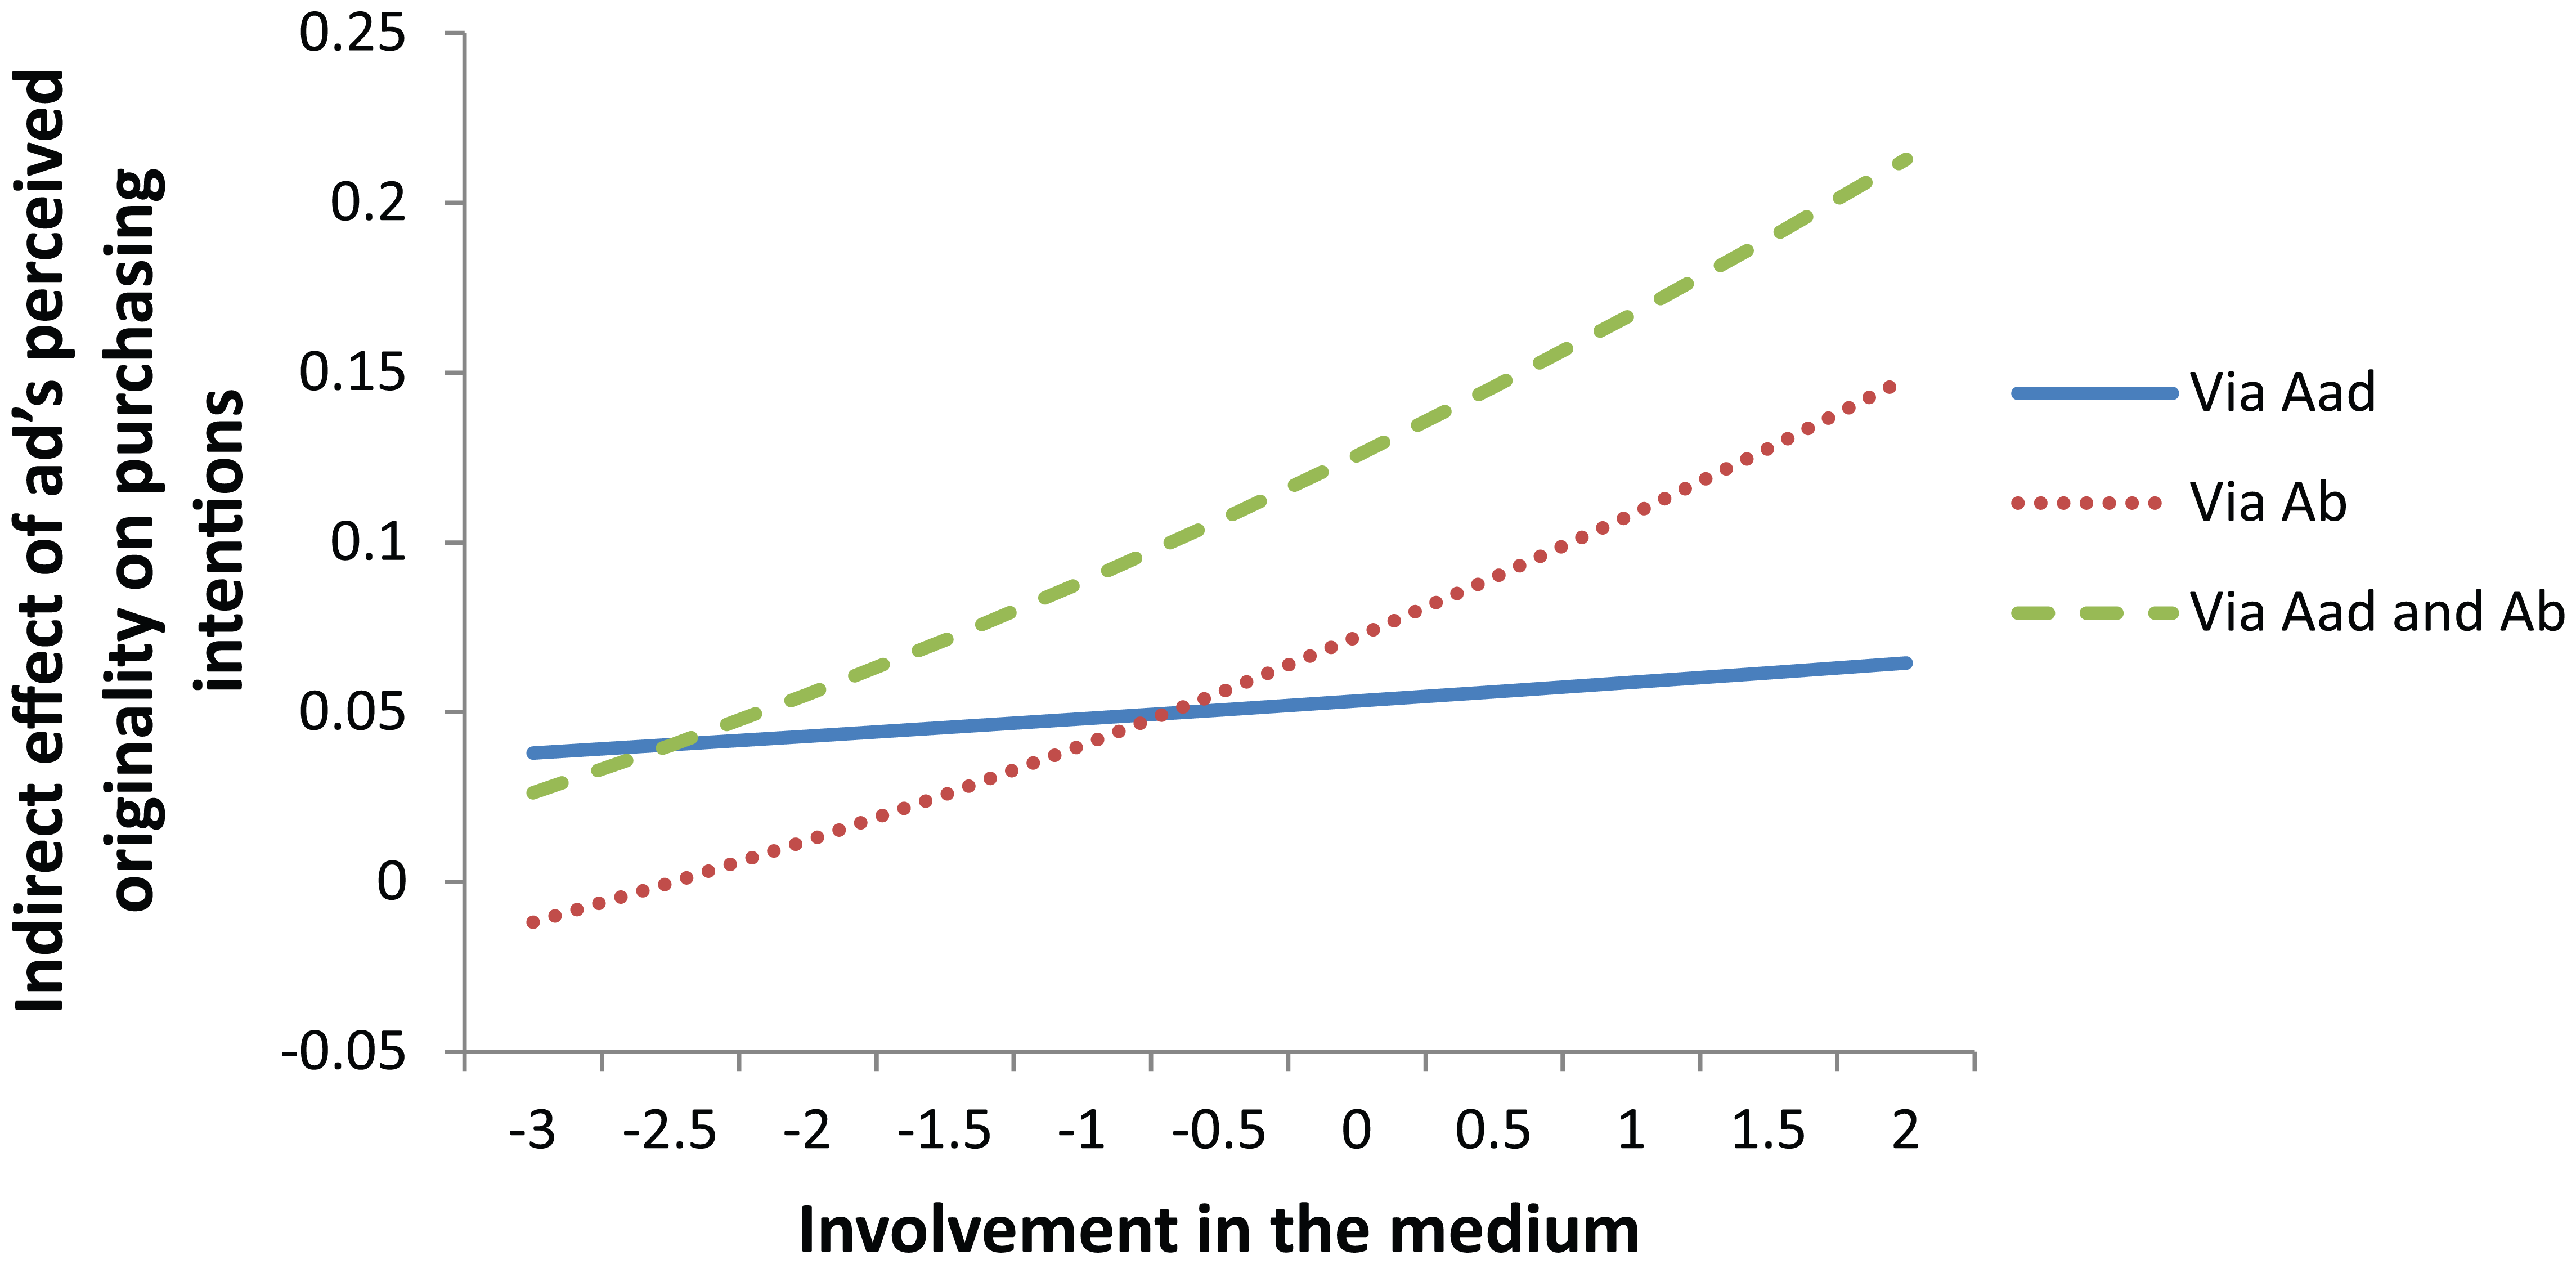
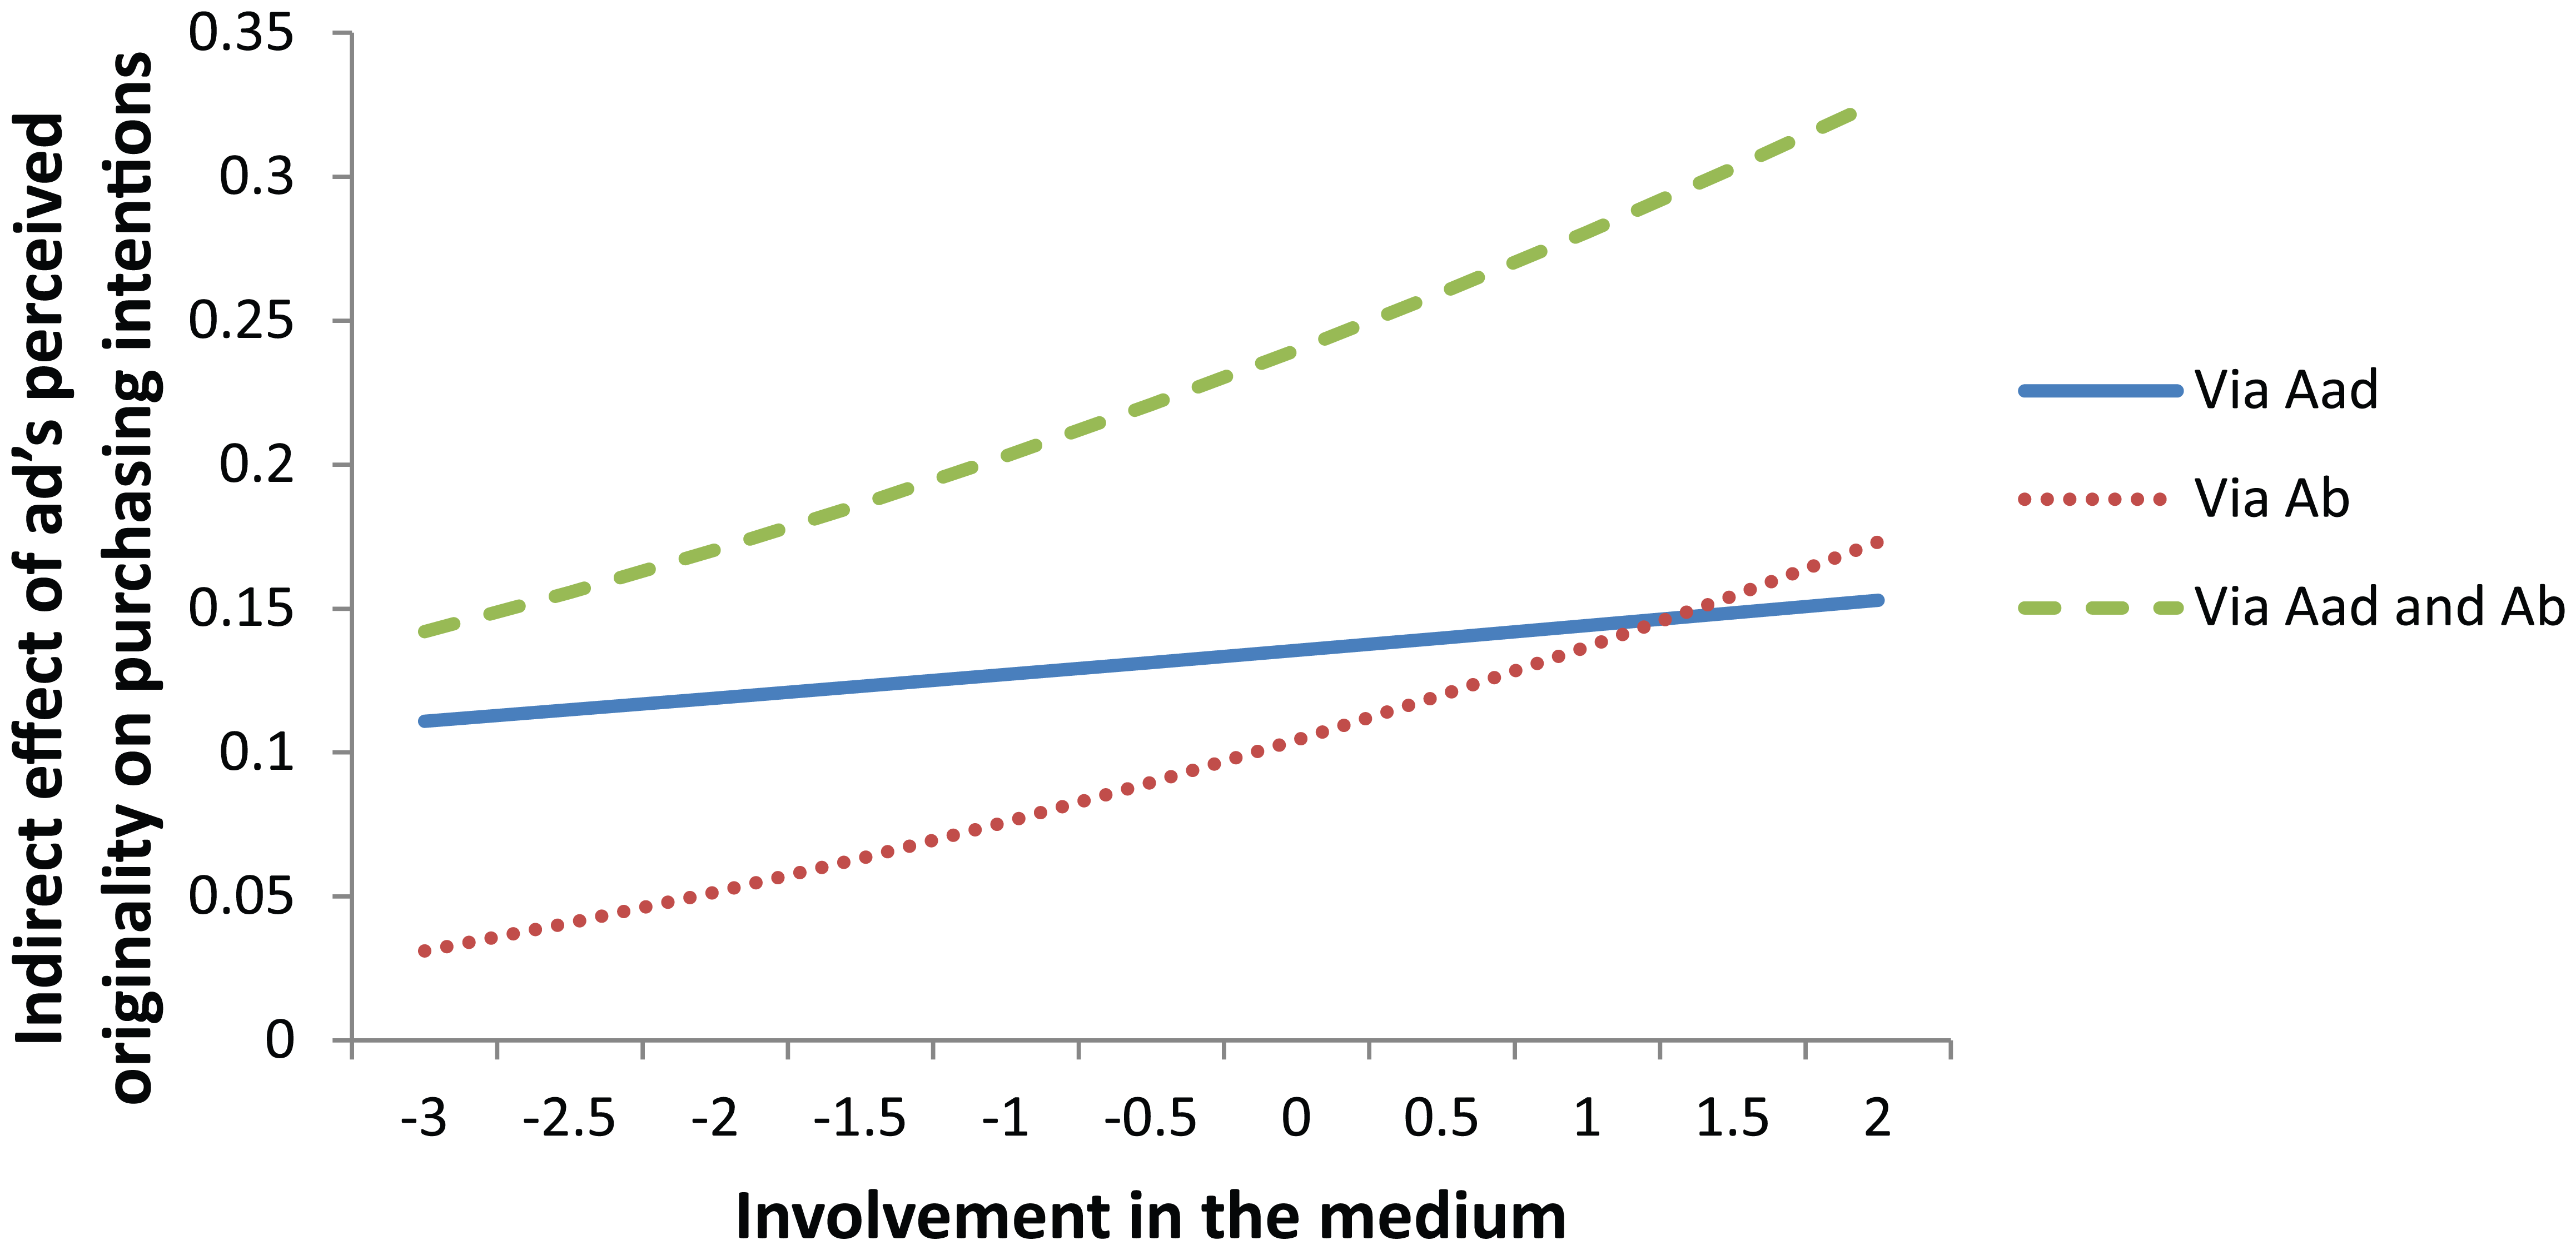
Graphic representation of moderating effects of involvement in the medium on the indirect link between perceived originality and purchasing intention (conditional indirect effect based on Z (involvement in medium)
Graphic representation of moderating effects of involvement in the medium on the link between perceived originality and purchasing intention (conditional indirect effect based on Z (involvement in medium) when W (resistance to advertising) is average).
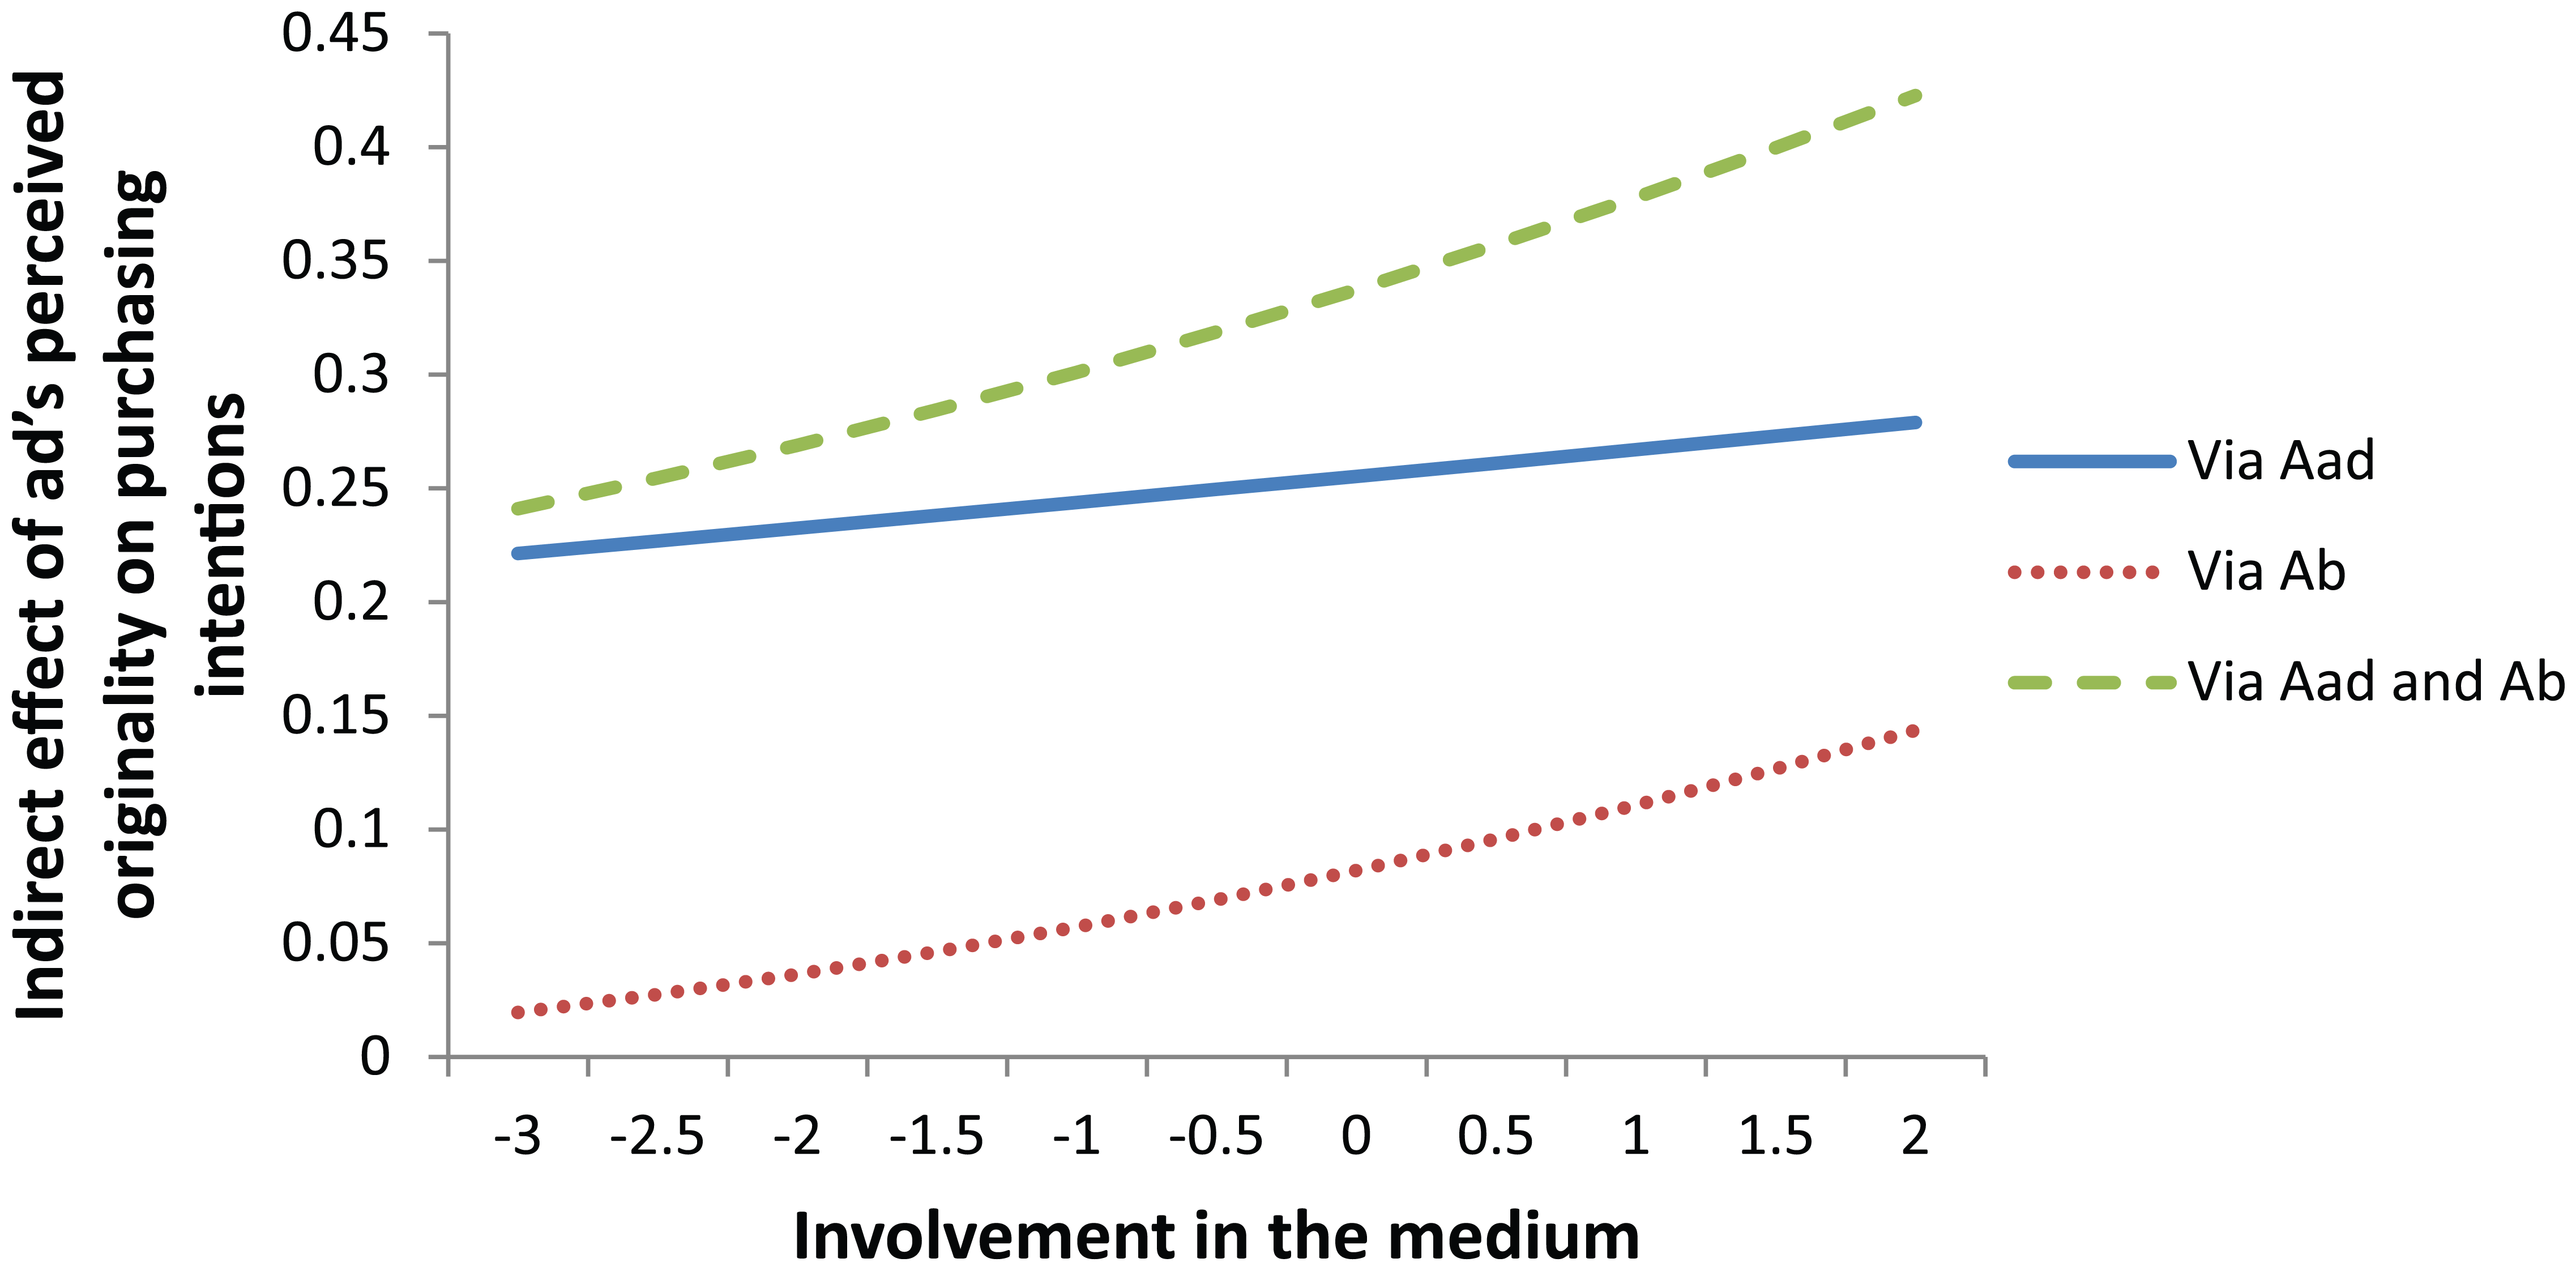
Graphic representation of moderating effects of involvement in the medium on the link between perceived originality and purchasing intention (conditional indirect effect based on Z (involvement in medium) when W (resistance to advertising) is high).
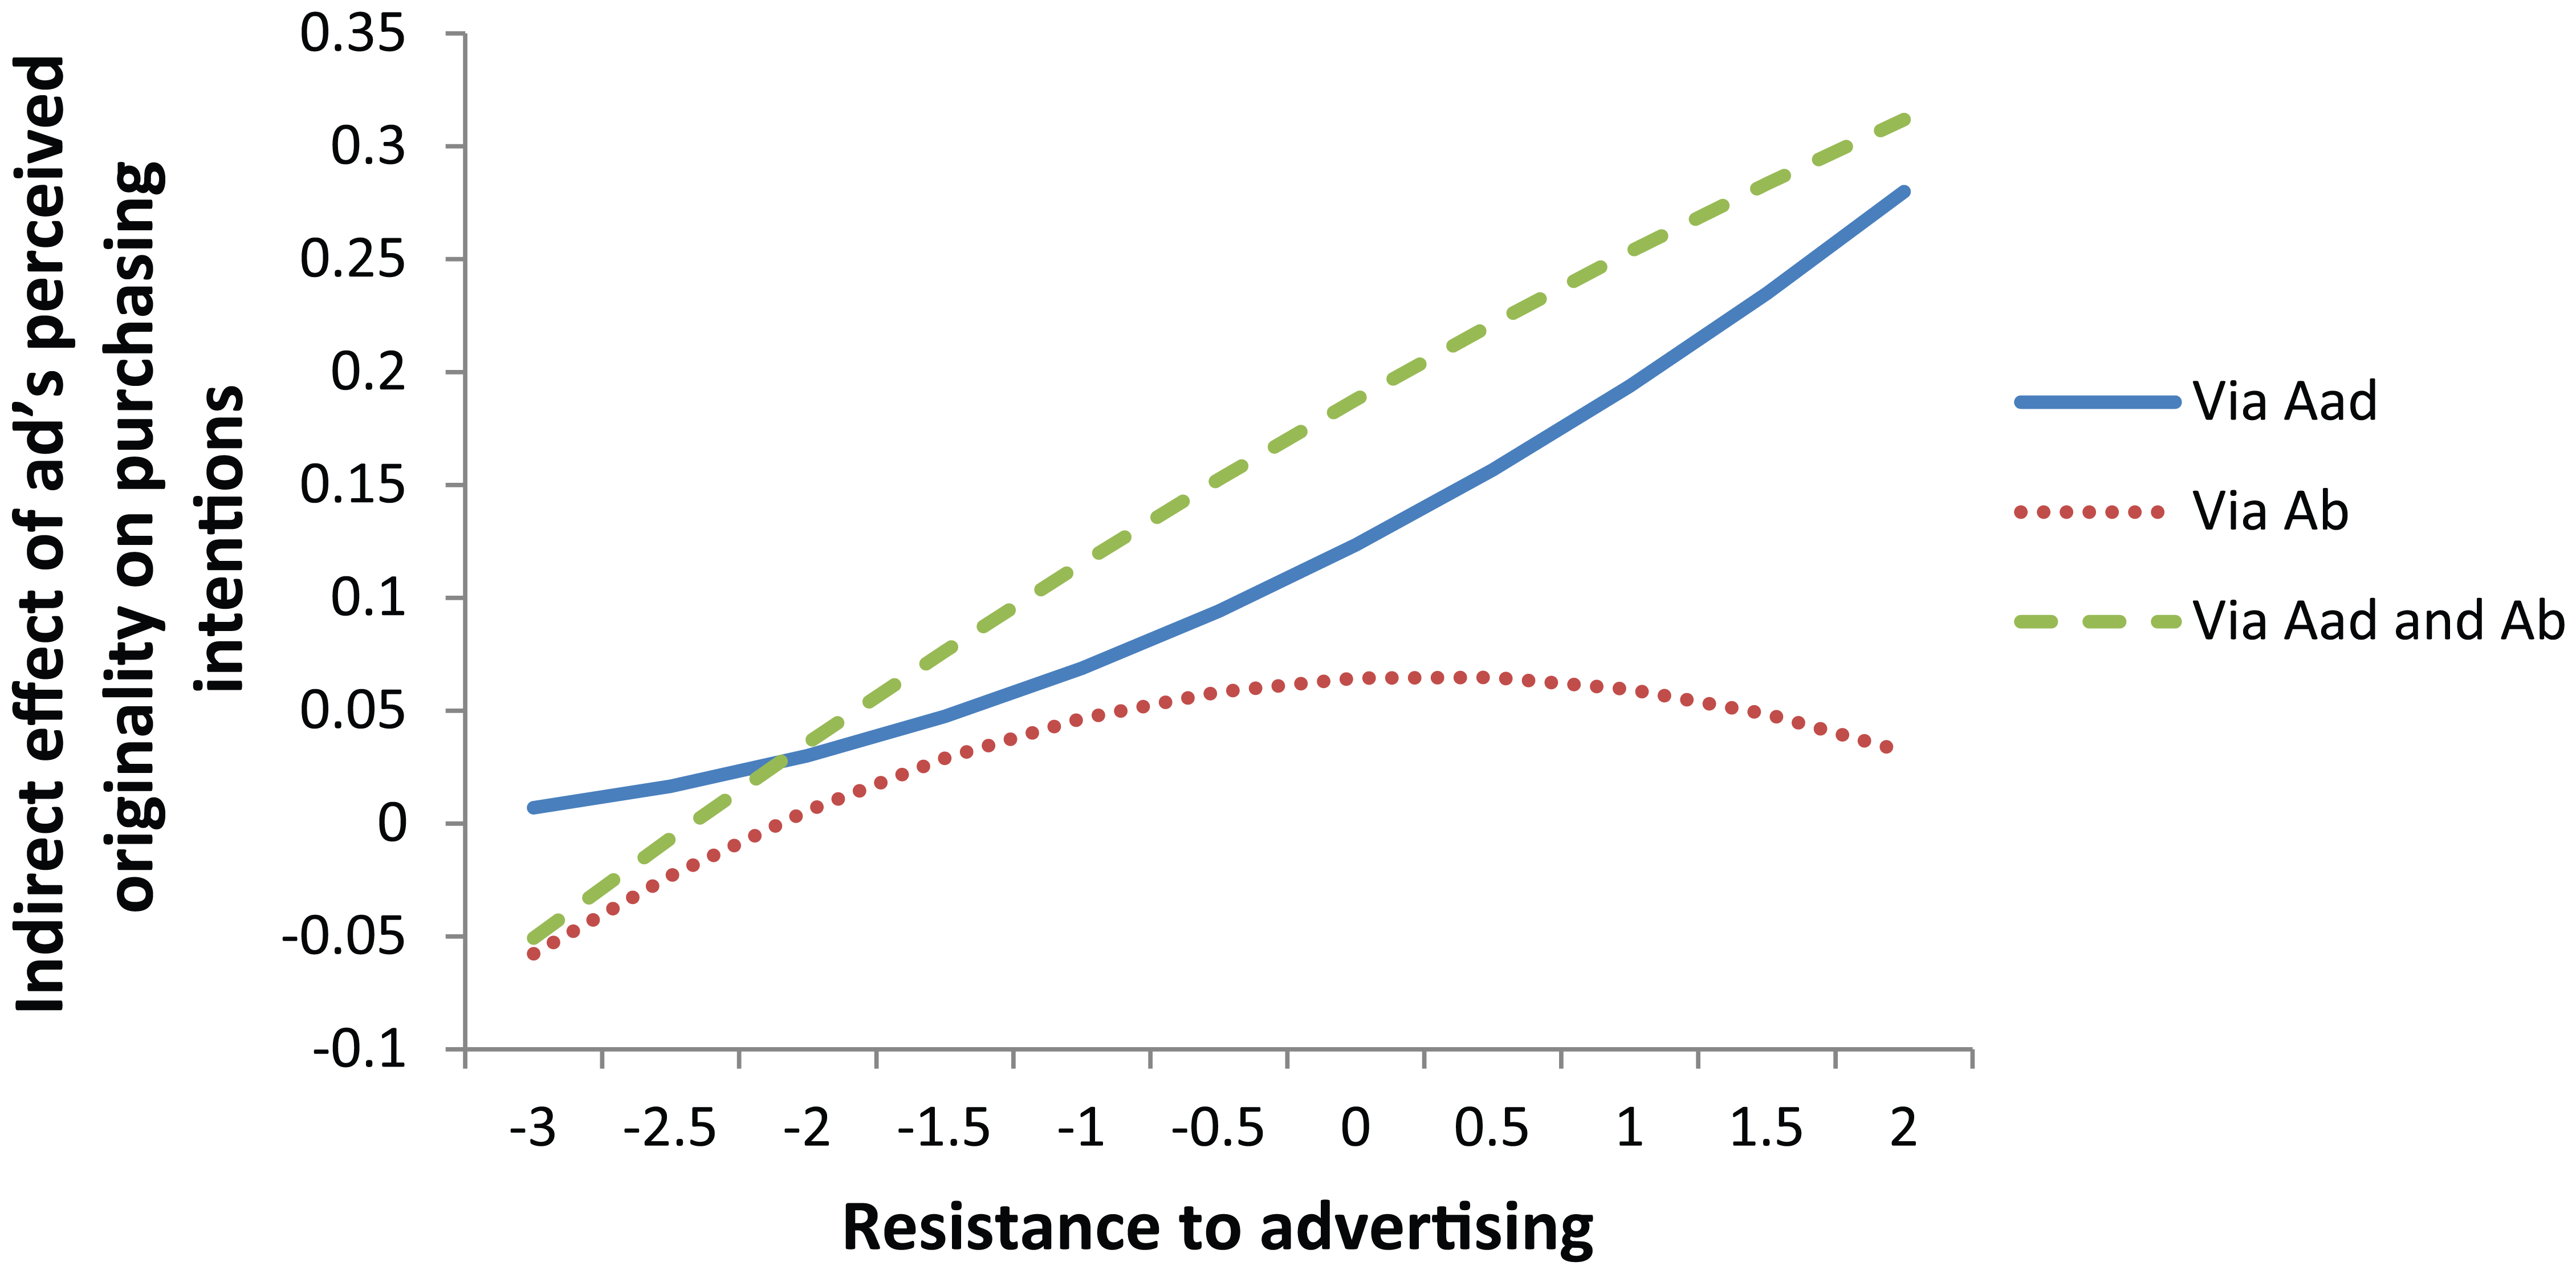
Graphic representation of moderating effects of resistance to advertising on the link between perceived originality and purchasing intention (conditional indirect effect based on W (resistance to advertising) when Z (involvement in medium) is low).
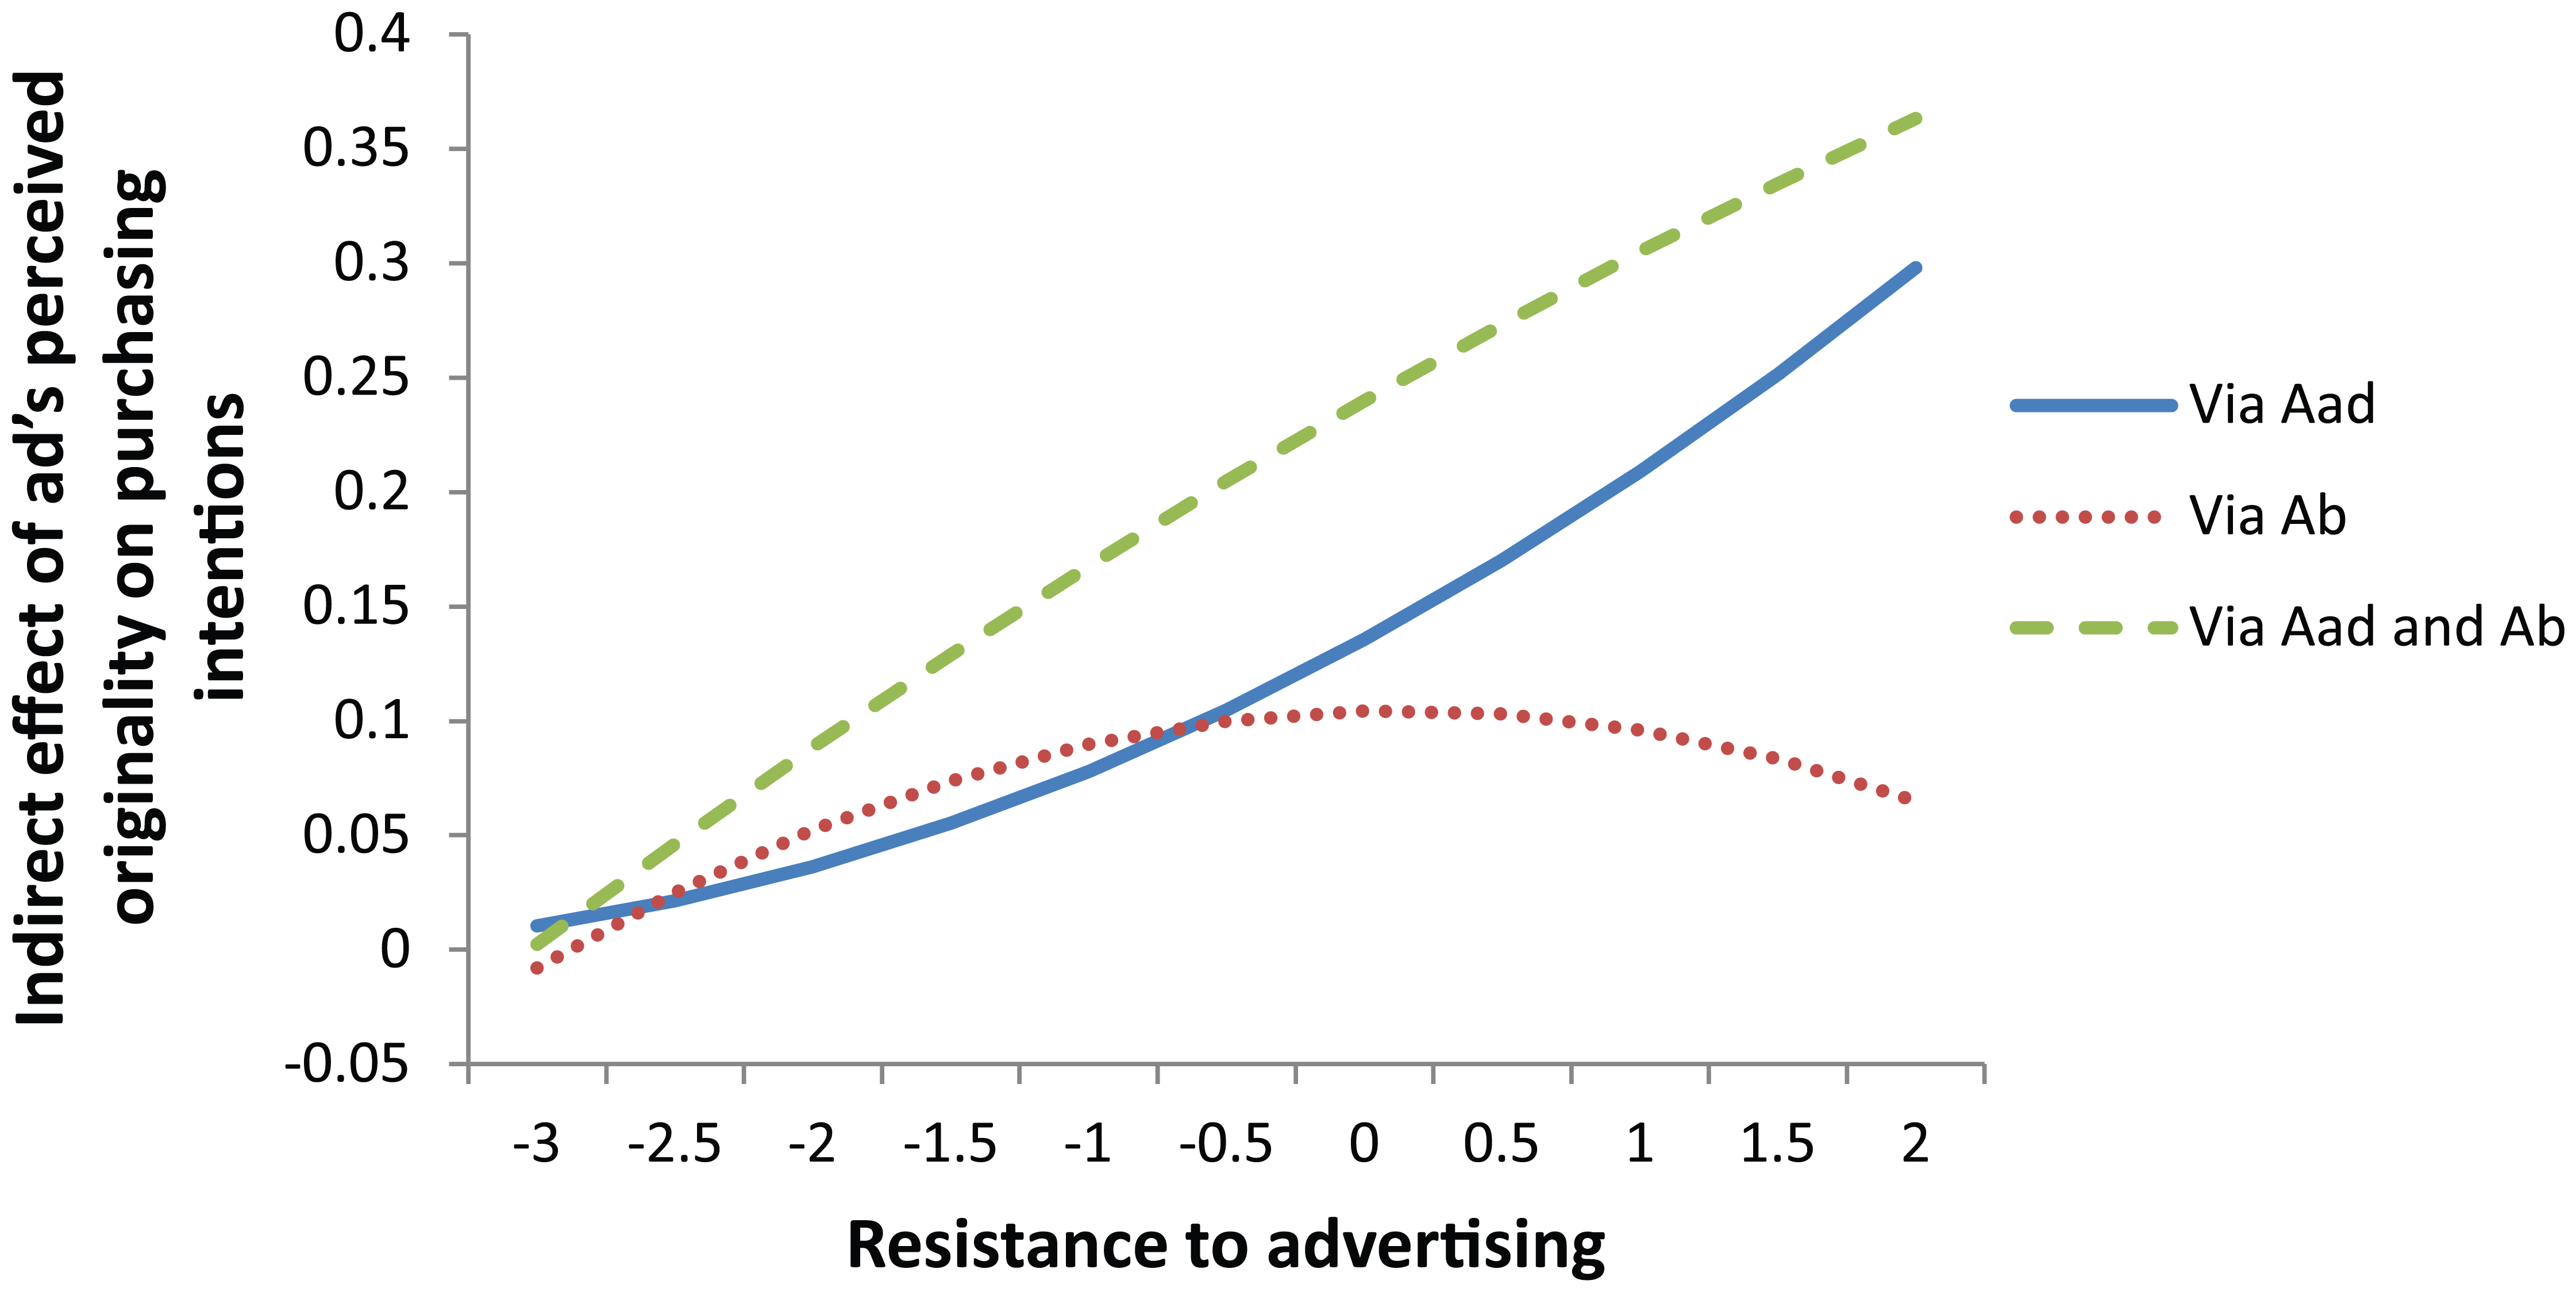
Graphic representation of moderating effects of resistance to advertising on the link between perceived originality and purchasing intention (conditional indirect effect based on W (resistance to advertising) when Z (involvement in medium) is average).
Graphic representation of moderating effects of resistance to advertising on the link between perceived originality and purchasing intention (conditional indirect effect based on W (resistance to advertising) when Z (involvement in medium) is high).
Conclusion and recommendations
The purpose of this article is to shed light on certain methodological aspects of testing for relationships of moderated mediation, otherwise known as conditional indirect effects. It provides an overview of current knowledge of this question and also develops several applications to the field of marketing, which as yet is relatively unfamiliar with these techniques. While tests for mediation and moderation are commonplace when conducted separately, very few marketing studies have employed methods to test for moderated mediation effects. Yet, models that include both mediating and moderating variables (and therefore moderated mediation effects) are increasingly frequent in marketing. The methods we have presented, developed by Edwards and Lambert (2007), Preacher et al. (2007) and Hayes (2013a, 2013b) and detailed in-depth herein, provide robust and precise results to the extent that they simultaneously include the different effects, providing an overall vision of the process studied. Moderated mediation therefore allows us to evaluate conditional indirect effects, which is not the case when mediation and moderation are tested independently of one another. It should also be pointed out that the implications of this over-arching approach are not only methodological but also theoretical in nature. If a researcher expects to find that an indirect link between two variables will be attenuated or amplified by another factor, he or she may decide to formulate a moderated mediation hypothesis, provided the theoretical basis is solid and the research design is adapted. Box 2 summarises recommendations for correctly analysing conditional indirect effects. While some of these apply to all marketing research, they are particularly important in the case of moderated mediation.
Main recommendations for analysing moderated mediation (conditional indirect effects).
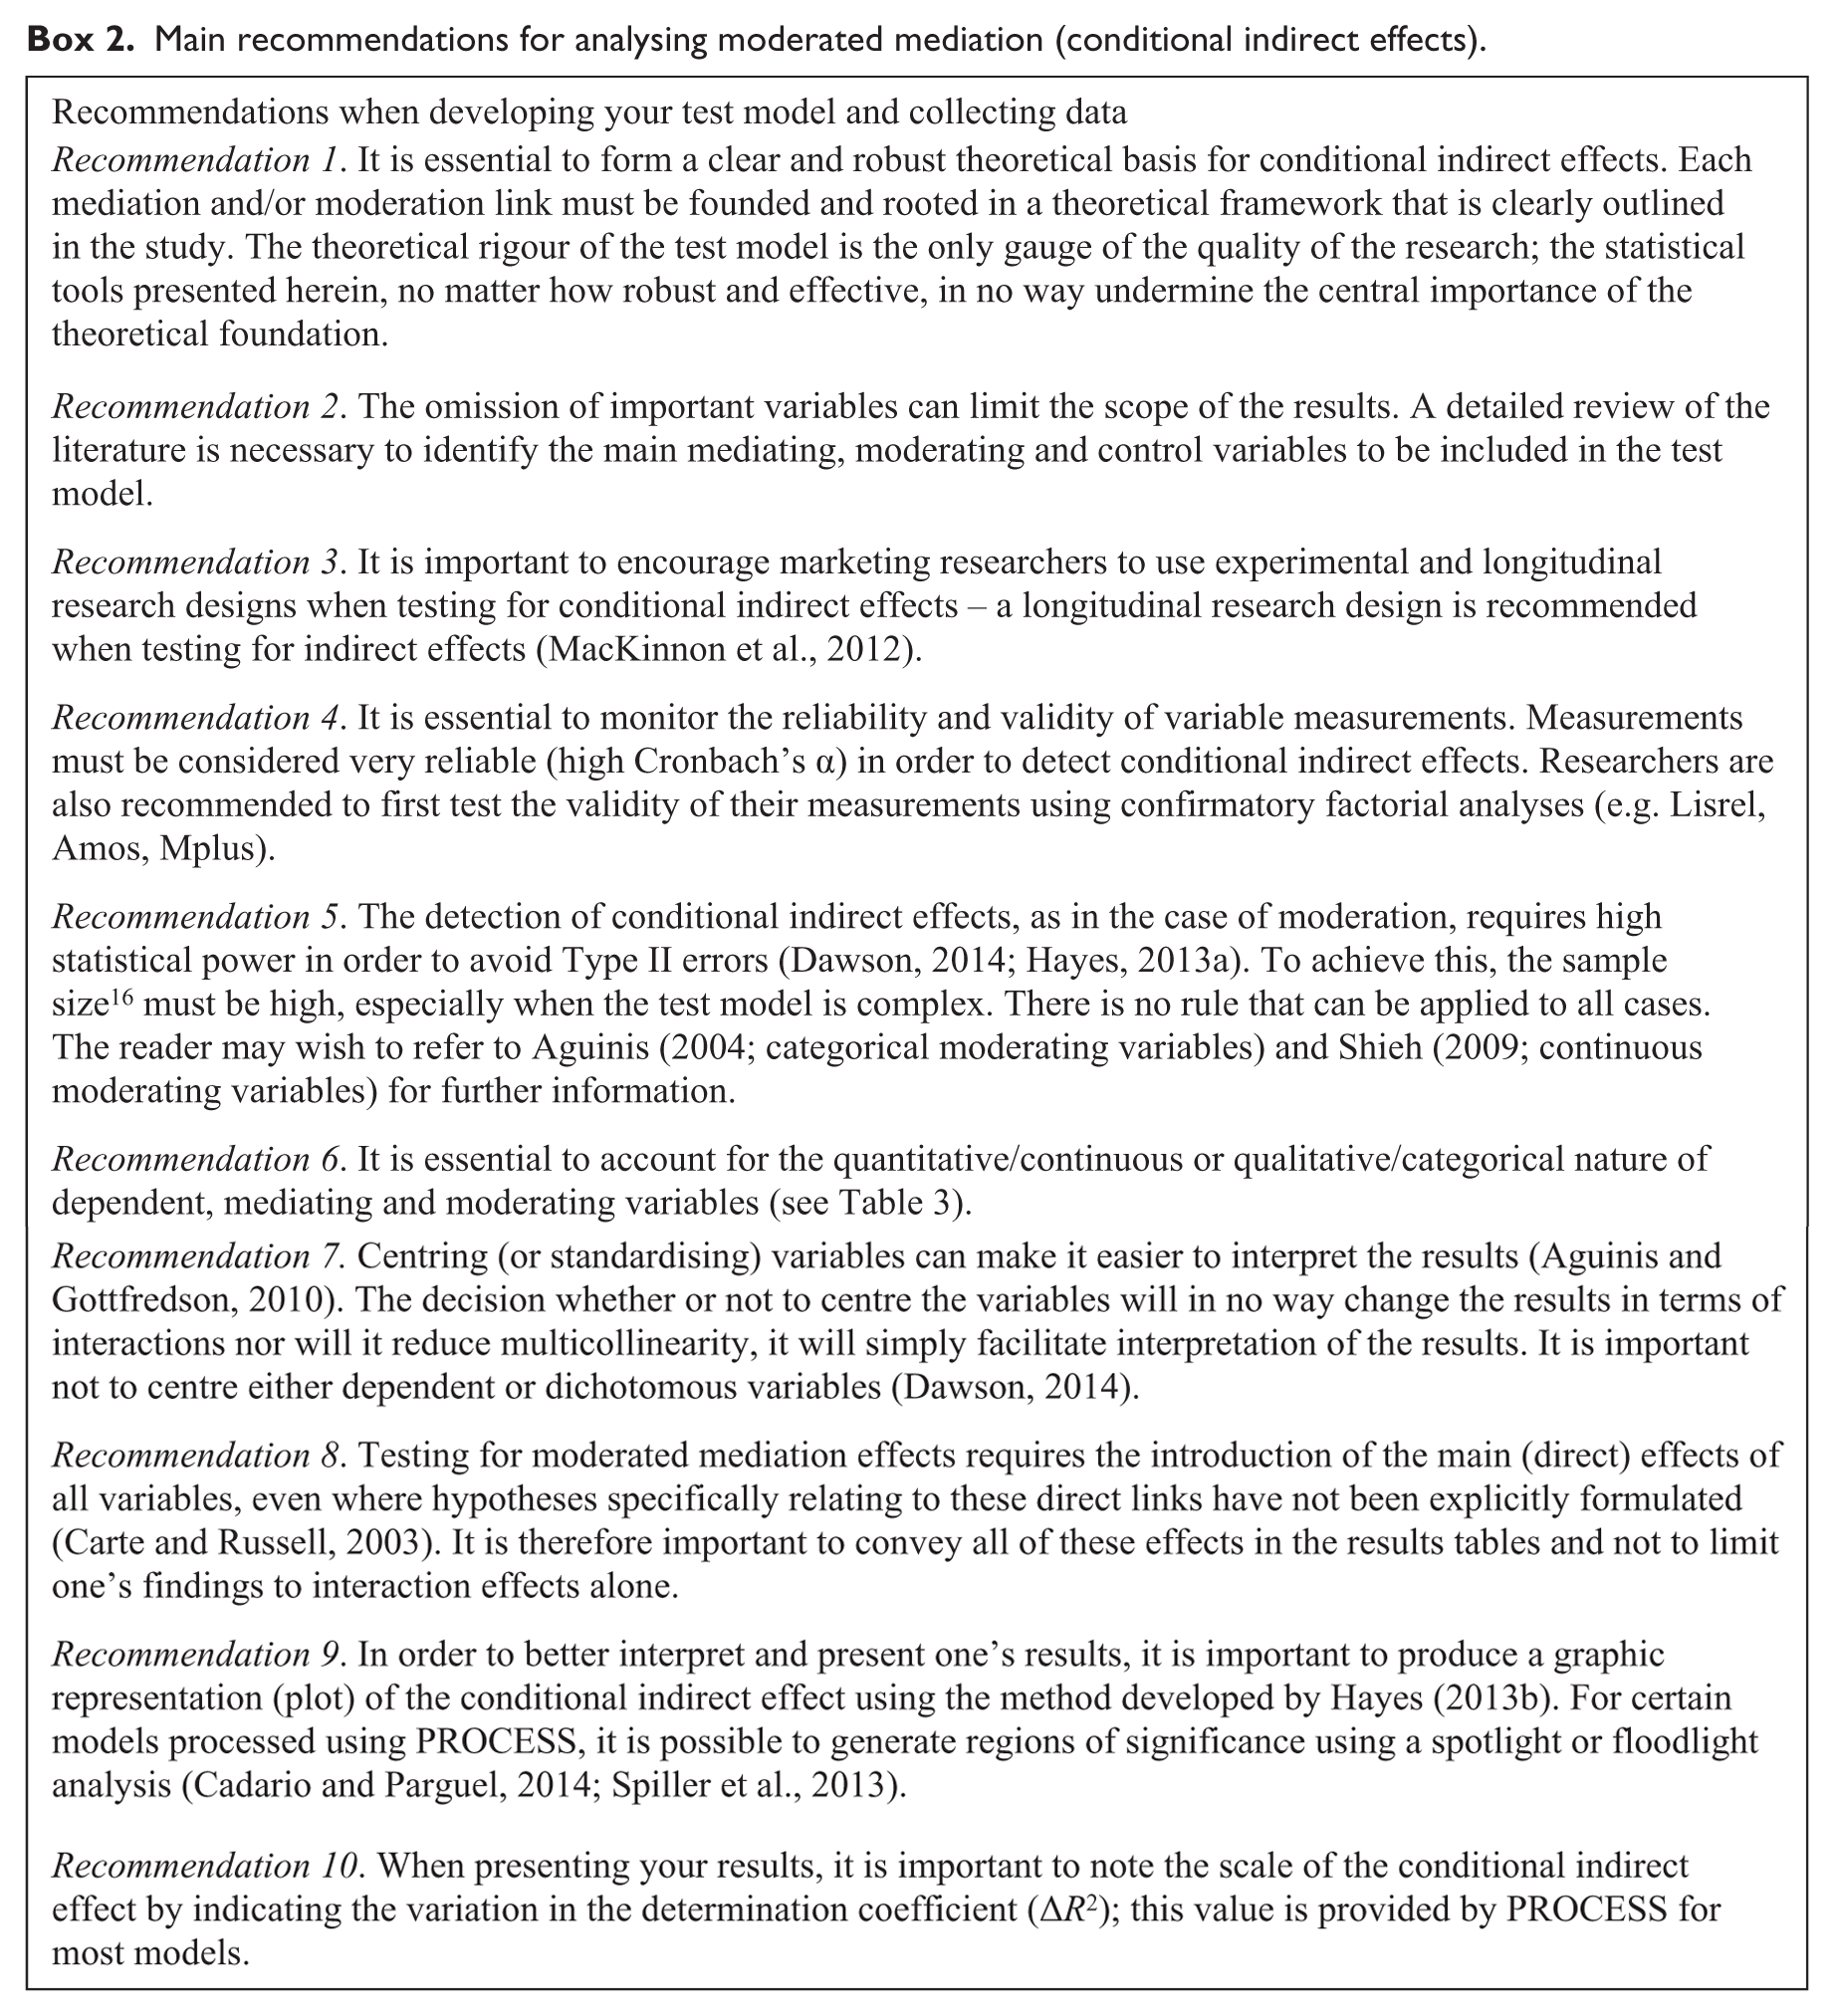
Major advances have been made in the analysis of moderated mediation effects over the last 10 years or so. The research approaches that marketing researchers are encouraged to pursue in this area mainly relate to (1) the use of so-called Bayesian methods when analysing conditional indirect effects (see Wang and Preacher, 2015) and (2) the development of multi-level analyses with mediation and moderation effects (Bauer et al., 2006). These advances offer marketing researchers new perspectives both in theoretical and methodological terms.
Footnotes
Appendix 1. Marketing research studies that have used one of the three moderated mediation methods. a
List updated in December 2014, covering the period 2007–2014 and including journals ranked 1 and 2 by the Centre national de la recherche scientifique (CNRS) in November 2014 (with the exception of Marketing Science, which has an embargo on its databases).
Some authors cite Hayes’ (2013a) method as originating in his 2012 working paper, which preceded the article cited herein.
Appendix 2. Procedure to download the PROCESS macro and dialogue box illustration ( Hayes,2013a,2013b )
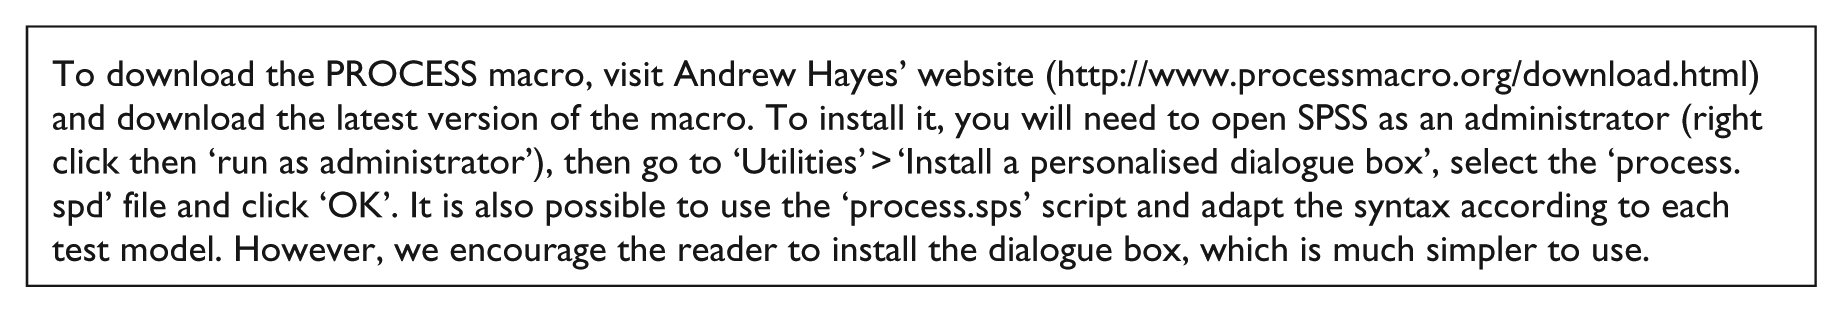
| To download the PROCESS macro, visit Andrew Hayes’ website (http://www.processmacro.org/download.html) and download the latest version of the macro. To install it, you will need to open SPSS as an administrator (right click then ‘run as administrator’), then go to ‘Utilities’ > ‘Install a personalised dialogue box’, select the ‘process.spd’ file and click ‘OK’. It is also possible to use the ‘process.sps’ script and adapt the syntax according to each test model. However, we encourage the reader to install the dialogue box, which is much simpler to use. |
Appendix 3. Example 1,Case 1: Results for conditional indirect effect with a continuous moderating variable using Hayes’ method ( 2013a,2013b )
Acknowledgements
All authors contributed equally to this work and are listed in alphabetical order.