
Abstract
Value remains a prominently studied concept in marketing with the personal shopping value (PSV) scale by Babin et al., being one of the most applied tools to assess the value in any form. While the concept of perceived value continues to evolve, questions still prevail. This research note implements a meta-analytical approach to provide further insights into the interplay between utilitarian and hedonic value. Results confirm a positive effect between utilitarian and hedonic value, questioning the common assumption that the dimensions are at opposing ends of a value spectrum. Meta-regression results explore potential boundary conditions in an effort to explain heterogeneity. Survey-type emerges as a moderator with larger relationships for online surveys than for surveys taken through non-electronic surveys. Furthermore, findings support positive connections between utilitarian value as well as hedonic value and customer satisfaction. The findings also suggest significant substantial heterogeneity helping to further the motivation to continue research into perceived value in an effort to further normative guidelines for managerial application.
Introduction
Although business and value are inseparable as one is the point of the other, historically, the academic business literature did not always value value in terms of focus as a core concept by which business activities are gaged. Toward the end of the 20th century, the marketing literature threw value into the spotlight by recognizing not only its importance but its complexity. An experiential view of value emerged that took the concept beyond a monetary index typically equated with price (Hirschman and Holbrook, 1982; Holbrook, 1986; Zeithaml, 1988). This special issue acknowledges the continuing effort to put value on center stage as a fundamental construct in understanding customer reactions to marketing activities.
Value remains a fundamental explanatory notion in marketing. Consequently, a multitude of conceptualizations, models, and measurement tools has been proposed throughout the construct’s advancement (Picot-Coupey et al., 2020; Sánchez-Fernández and Iniesta-Bonillo, 2007). Rivière and Mencarelli (2012) offer perhaps one of the best attempts at developing organic value theory within the marketing literature. Their work presents a classification of value definitions and value measures, while offering a review of the most commonly considered antecedents and consequences of perceived value. Furthermore, the authors provide tangible practical examples of how perceived value, when properly understood, can enhance strategic and tactical efforts. Additional efforts by Babin and James (2010) present a retrospective on perceived value drawing out its epistemic connections with service-dominant-logic. The reflection concludes that service and value are indeed inseparable in that value is the outcome of, and the point of, service. One logical consequence is that all actors engaged in exchange of service create value collectively. In a most typical instance, a firm puts forward a value proposition with potential to be realized through customer know-how and actions. Consequently, numerous authors acknowledge the co-created nature of value (Babin et al., 2019; Merle et al., 2008; Nicod and Llosa, 2018).
Thus, as is the nature of science, the concept of perceived value continues to evolve and we successively deepen our understanding of value over time. For example, contemporary models extend the constructs beyond traditional applications to new contexts including innovation research (Rivière, 2015). Although the concept of value has come a long way, questions still remain. This research note attempts to shed some light on a few of those questions by using a meta-analytic approach. More specifically, this note focuses on the interplay between utilitarian and hedonic value by synthesizing empirical findings reported in the top marketing journals. In addition, it explores the relationship between both value dimensions and satisfaction; one of the most commonly studied outcome variables in conjunction with value.
Research issues
Upon reflecting on the state of value in the marketing literature, Babin and James (2010) introduce nine value axioms aimed at clarifying the nature of perceived value. One axion positions consumption as the process that creates value from service. Thus, value does not lie in objects. Objects can be a resource, as part of the value proposition, through which value can be co-created; yet, activity is required for value extraction. Clearly, perceived value embodies an experiential view of consumption.
With the experiential view in mind, another axiom addresses the dimensionality of value. Unquestionably, value can be and has been theorized at different levels of abstraction and varying levels of complexity (Antéblian et al., 2014; Rivière and Mencarelli, 2012). For example, authors propose perceived value measures ranging from one to seven or more dimensions. However, in attempt to provide a useful compromise, Babin et al. (1994) offer the personal shopping value (PSV) scale. The authors propose the PSV as a parsimonious measure capturing value in two dimensions while acknowledging that a more complex approach might account for more dimensions. The parsimonious nature of the PSV likely plays a big role in its wide-spread adoption and the conceptual approach to perceived value underlying its development.
The PSV builds on the experiential consumption literature to present two dimensions of value (Holbrook, 1986). Utilitarian value captures the means-to-an-end aspect of value in that some act, such as downloading an app, allows some end to be accomplished (ordering food). Hedonic value captures gratification realized concomitant with experience. The emotions that go along with playing video games epitomize the realization of hedonic value. Picot-Coupey et al. (2020) validate the two-dimensional structure of hedonic and utilitarian value across various context further supporting the resilience of the conceptualization in contemporary shopping environments. As the authors note, even as consumer shopping behavior might evolve, the quest for utilitarian and hedonic value in experiences remain consistent.
Babin and James (2010) offers the following axiom consistent with the notion of simultaneous extraction of both dimensions: “Utilitarian and hedonic value are not mutually exclusive” (p. 476). The literature often speaks of hedonic value as the opposite of utilitarian value and adopts a terminology of utilitarian versus hedonic value (see for example, Kim and Kim, 2016). From this perspective, the coexistence of utilitarian and hedonic value is impossible. Authors sometimes describe utilitarian value in a negative light as something that distracts from hedonic value (Gill, 2008). A cursory search of the literature using Google Scholar reveals dozens of articles using terminology pitting utilitarian value versus hedonic value, or vice versa. Such a view stands in contrast to the axiom declaring the two as not mutually exclusive. Consequently, the best consumer experiences may involve substantial levels of both utilitarian and hedonic value. If, in contrast to the axiom, the two are mutually exclusive, we should observe a correlation of −1 between the two. Alternatively, consistent with axiom, the two dimensions should be distinct with no consideration of a strong negative correlation. Thus, we address the following research question:
RQ1: What is the direction and magnitude of the relationship between the two PSV dimensions: utilitarian and hedonic value?
Rivière and Mencarelli (2012) theoretically distinguish customer satisfaction from perceived value. One of the key distinctions lies in the role of expectations as a foundation for the satisfaction judgment. Clearly though, both satisfaction and value are prominently featured as marketing outcomes. Recent research attempts to address whether value or satisfaction is more important to marketing performance. One study compares the relative predictive power of satisfaction and perceived value in the retailing industry and provides evidence of stronger connection between perceived value and retail-firm financial performance compared to customer satisfaction (James et al., 2019). Another study (Babin et al., 2019), compares competing theories in both retail and services contexts that present explanatory evidence of the PSV dimensions stronger connection with a consumer’s achievement of closely held personal values than satisfaction. Both of these studies and additional prior research (e.g. Babin et al., 2007; Picot-Coupey et al., 2020), as well as the conceptual nature of the two, suggest a positive relationship between perceived value and customer satisfaction. Thus, we address the following research question:
RQ2: What is the relationship between each of the PSV dimensions and customer satisfaction?
Meta-analytic procedures
While the PSV is not the only measure that purports to assess perceived shopping value, the source for the scale has nearly 7,000 citations to date and is likely the most commonly employed value assessment tool. Therefore, this article focuses on the Babin et al. (1994) PSV scale applied within the top marketing journals. The search included Journal of Retailing (JR), Journal of Marketing (JM), Journal of Consumer Research (JCR), Journal of Marketing Research (JMR), Journal of the Academy of Marketing Science (JAMS), Journal of Business Research (JBR), Recherche et Applications en Marketing (RAM), European Journal of Marketing (EJM), and Psychology & Marketing (P&M). The first search proceeded by identifying articles that cited Babin et al.(1994). Next, search terms such as “hedonic (shopping) value,” “utilitarian (shopping) value,” “shopping value,” and “value” expanded the search parameters. Finally, a final search tried to identify any potentially missed articles by broadening the search term to “Babin.”
Sample
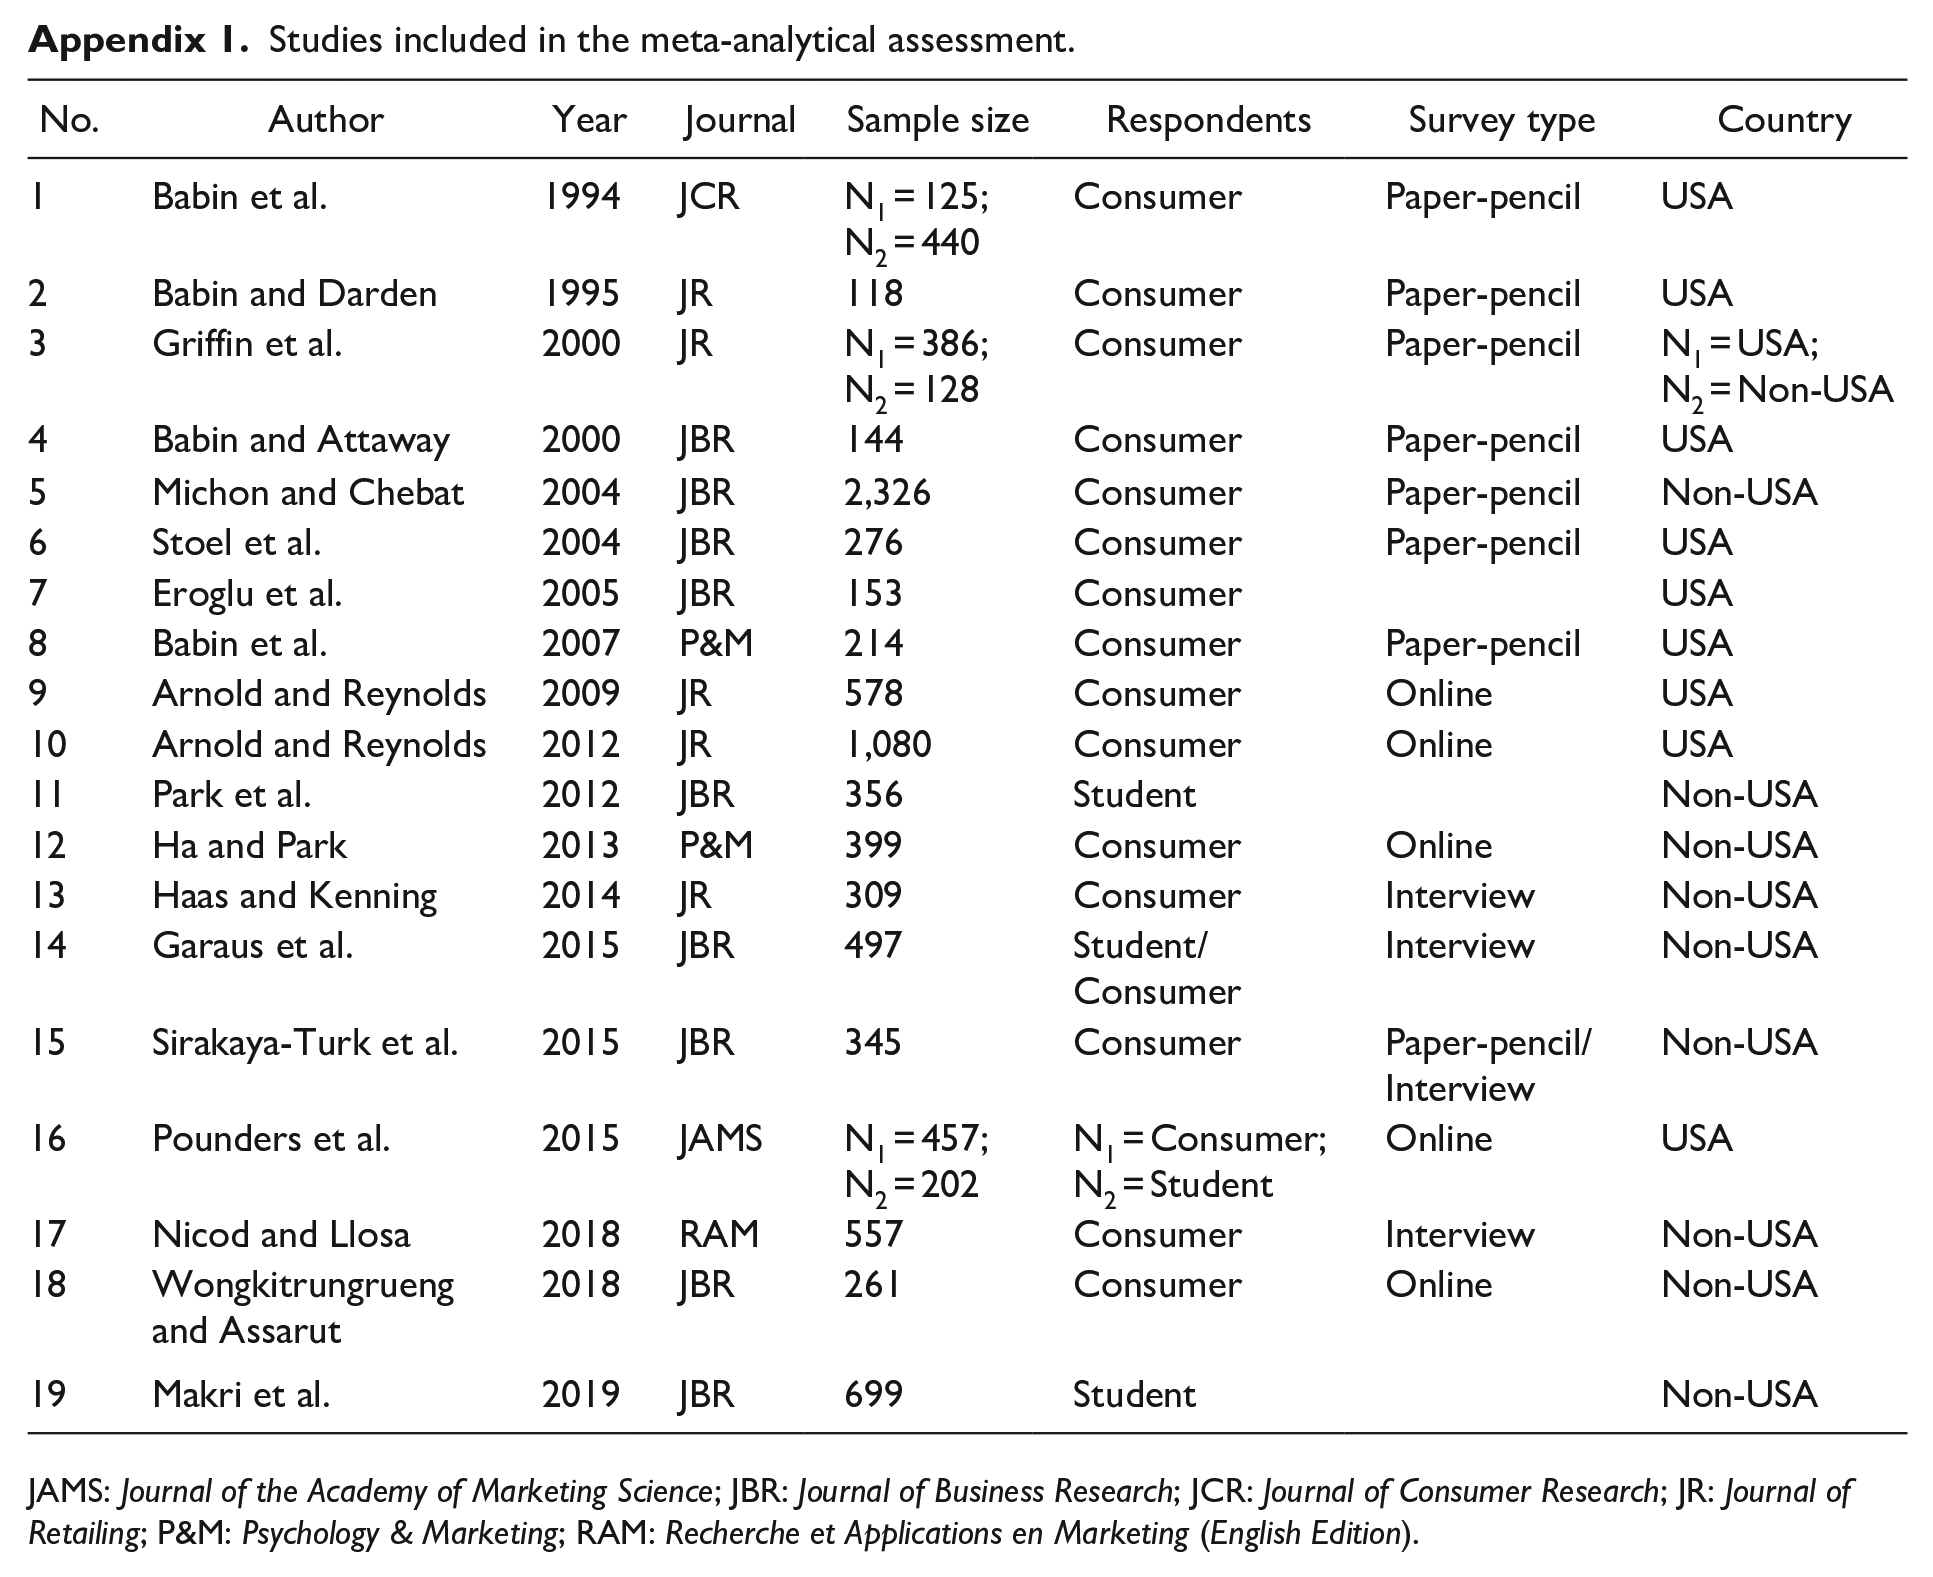
In all, the search identified 19 articles and 22 studies that match all of the inclusion criteria (see Appendix 1). To be included in the analysis, the studies must have employed the PSV scale’s dimensions either in full (15 items) or reduced form. As a result, qualitative reviews, theoretical reviews, and econometric model articles were excluded from the sample. In addition, the scope of the search was retailing and atmospheric research, thus eliminating banking, industrial, or other areas. With regard to quantitative requirements, studies had to report correlations among the relevant measures (other metrics that could be used as input such as mean differences and standard deviations, or the t-values associated with differences, etc.; all of which could be converted to a common metric) and an estimate of the scale reliability. Given that many of the studies employ structural equation modeling (SEM), reporting of error-disattenuated correlations facilitated the data collection. We did not rely on parameter estimates from multiple regression models because any interdependence among the predictors would create bias in the bivariate estimate of a relationship. Only if the independent variables are independent, which would be highly unlikely in research studying customer experiences, would the standardized regression coefficients be an accurate estimator of the bivariate relationships. Furthermore, composite scale score correlations were transformed by using reported reliability coefficients to disattenuate the relationships. Regrettably, many articles fail to report basic descriptive statistics like means and inter-factor correlations or do not clearly summarize data collection procedure. Consequently, as is common in meta-analysis (Grewal et al., 2018), the majority of studies identified in the literature search did not qualify to be included in the study. In addition, basic sample information sometimes had to be estimated based on available information such as survey type. We did not encounter a study that reported relationships between the constructs being studied in a manner that required conversion of other statistics into correlations. We employed a random-effects meta-analysis model to account for the fact that the true effect size likely varies across populations (Borenstein, 2019).
Meta-analytical results
UV-HV relationship
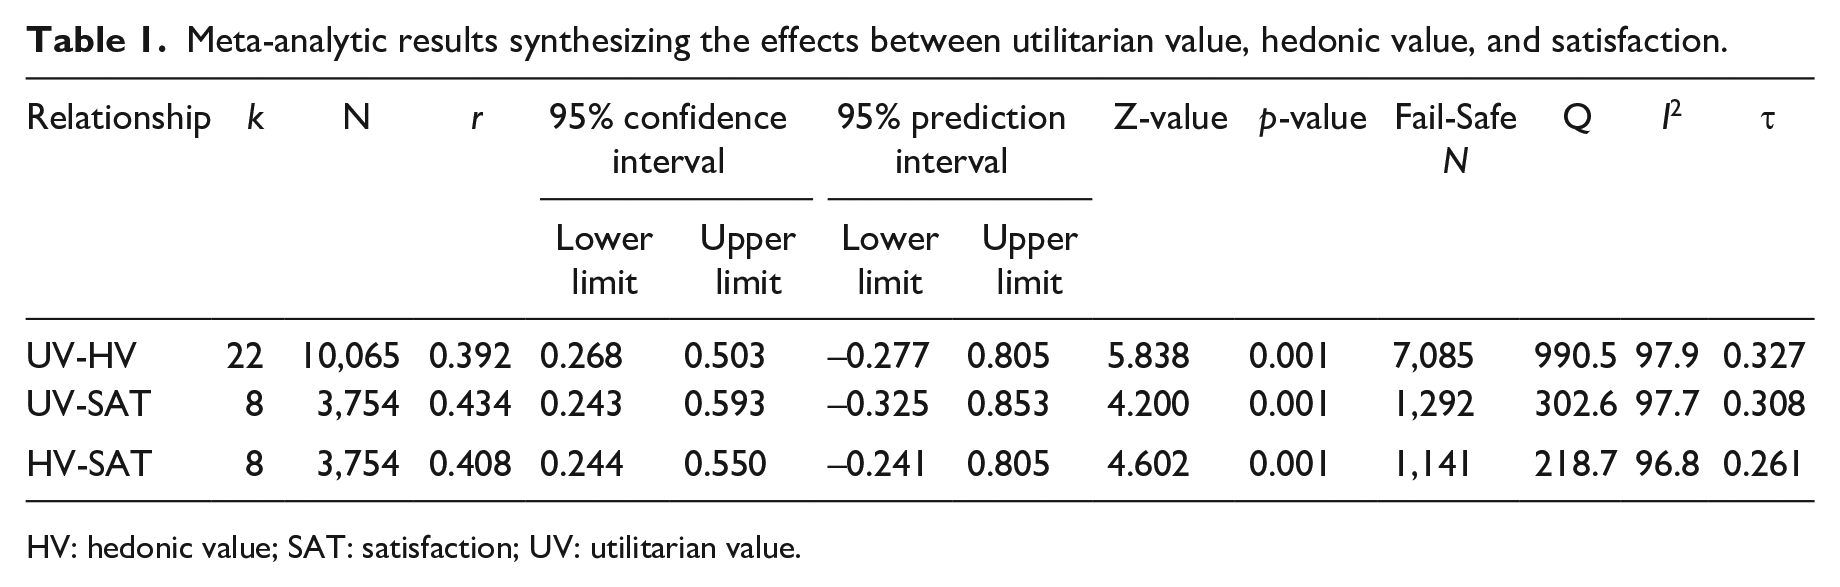
Meta-analysis was conducted across 22 studies reporting correlations between utilitarian and hedonic value. A total of 10,065 respondents provided data to those individual studies. Correlations are used as the effect size in the study given that is the only reported effect size metric in the individual studies. The quantitative synthesis suggests a meta-analytic weighted mean correlation of 0.392 with a 95% confidence interval (CI95) ranging from 0.268 to 0.503. An effect size of 0.4 would be considered a modest effect size (Borenstein, 2019). Furthermore, the effect is positive, which is clearly inconsistent with the usage of the terminology utilitarian versus hedonic value; an expression that implies that the two dimensions are opposite ends of a value spectrum.
In meta-analysis, the researcher should consider heterogeneity across studies as an equally important result compared to examining effect size. However, heterogeneity is not as well understood. I2, often reported as an indicator of heterogeneity, represents a proportion showing how much variation across studies is due to true heterogeneity (Higgins, 2008). Increasingly high I2 values represent increasing proportions of true to random heterogeneity. Given difficulties in applying I2 in a meaningful way, the prediction interval, not I2, is the most precise indicator of heterogeneity (Borenstein, 2019). The prediction interval depicts study variability in the metric of the effect size (correlations in this case) and unlike the confidence interval, it portrays the range of expected effect sizes in future applications. In this case, the 95% prediction interval (PI95) from −0.277 to 0.805 suggests considerable heterogeneity and poses the possibility of null or even zero effects (see Table 1). However, even the lower limit of the prediction interval fails to approach −1, the value that would indicate mutual exclusivity between utilitarian and hedonic value. Overall, neither the effect size nor the heterogeneity supports the idea of utilitarian and hedonic value as opposite ends of a value spectrum.
Meta-analytic results synthesizing the effects between utilitarian value, hedonic value, and satisfaction.
HV: hedonic value; SAT: satisfaction; UV: utilitarian value.
UV-satisfaction relationship
The search identified eight studies with a total N of 3,754 respondents reporting a correlation between utilitarian value and customer satisfaction. Once again, random-effects meta-analysis provides a synthesized effect size. As reported in Table 1, the weighted mean correlation is 0.434, again, representing a modest-size effect (CI95 = [0.243, 0.593]) and supporting a positive connection between utilitarian value and customer satisfaction. PI95 provides an assessment of heterogeneity and ranges from −0.325 to 0.853. Thus, although the effect in these studies is clearly positive, the prediction interval suggests that future researchers can expect a wide variation in the utilitarian value – satisfaction connection.
HV-satisfaction relationship
The same 8 studies involving 3,754 respondents described earlier also report a correlation between hedonic value and customer satisfaction. The synthesized hedonic value–satisfaction effect size over those studies is 0.408 (CI95 = [0.244,0.550]). Similar to the utilitarian value results, meta-analysis results suggest a modest positive effect size for the hedonic value – satisfaction relationship. In addition, PI95 ranges from −0.241 to 0.805, indicating substantial heterogeneity. The results are very similar for both the value dimensions leading to the conclusion that, on average, the two dimensions are equally important in predicting customer satisfaction. However, the wide prediction intervals suggest that the study contexts play a potentially large role in how closely related the dimensions are to customer satisfaction.
Potential moderators
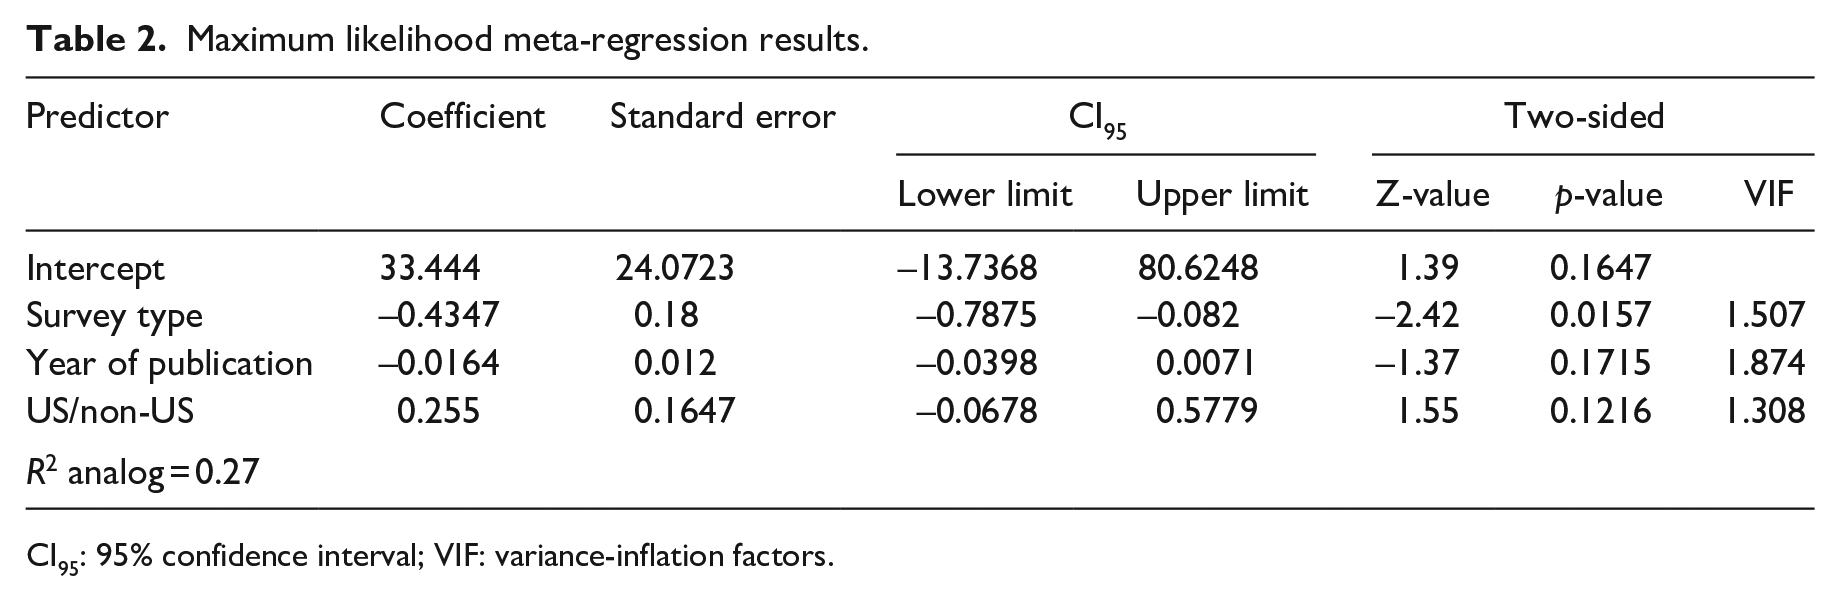
We explored potential variables that may account for the heterogeneity in the observed effect sizes. A meta-regression analysis was conducted predicting the UV-HV effect size with several study characteristics. A meta-regression with k of at least 10 is generally considered useful in assessing heterogeneity (Borenstein, 2019). A meta-regression model (k = 22) was estimated using three study characteristics as predictors. The nature of the target population was explored by a dummy variable classifying the sample as drawn from a US source (12 of 22 studies) or from a non-US source. Over time, the choice of survey methodology has shifted from paper-pencil approaches to online survey methodologies. DeSimone and Harms (2018) describe some of the challenges of online survey methodologies and the challenges to data quality. Online respondents show a tendency to speed through surveys providing an indicator of low-response quality (Smith et al., 2016). Thus, a dummy variable representing whether the survey was administered in a paper and pencil/interview (13 studies) or online format (9 studies) is included. Year of publication is also considered as a control variable.
Table 2 displays the results of the meta-regression. The model yields a Q of 7.38 with 3 degrees of freedom and an R2 of 0.27. The only predictor displaying a significant regression coefficient is survey type. The maximum likelihood regression coefficient (b) is −0.44 (p = 0.016) suggesting a lower correlation for paper and pencil surveys than for online surveys. Neither year of publication (b = −0.02) or the US/non-US variable (b = 0.26) are statistically significant. The significant effect of survey type can be illustrated by the subgroup analysis results in which the effect size for the online sample (r = 0.530) is substantially larger than in the paper and pencil sample (r = 0.282). All variance-inflation factors (VIF) are less than 2 allaying any concern of multicollinearity biasing the results.
Maximum likelihood meta-regression results.
CI95: 95% confidence interval; VIF: variance-inflation factors.
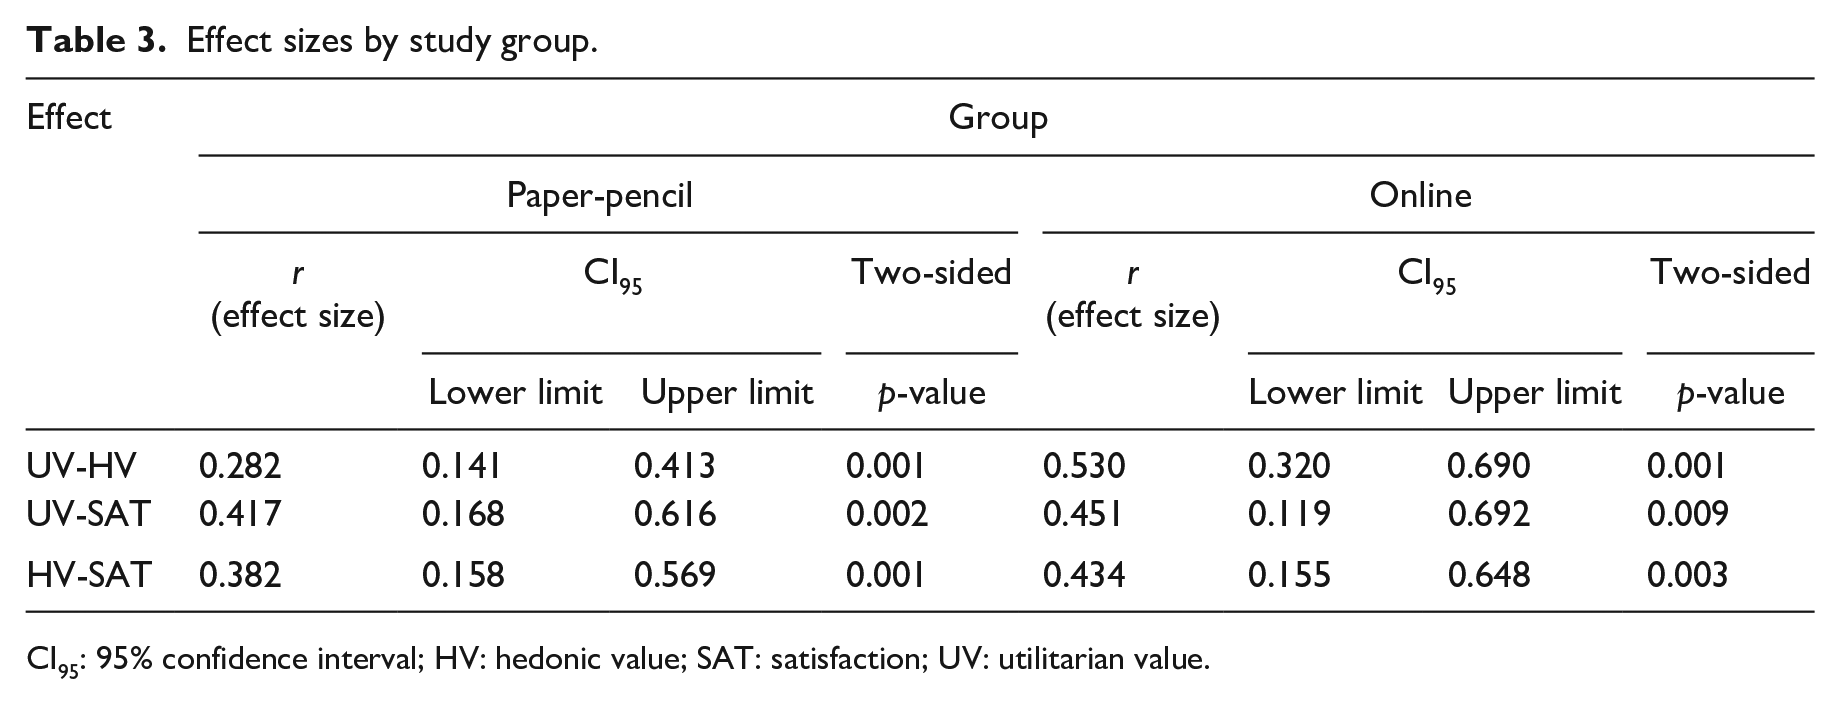
Unfortunately, k would be less than 10 for both the value dimensions’ relationships with customer satisfaction (SAT). However, the potential variance in the relationships is explored with a presentation of the group results by survey mode. Table 3 presents those results. In this case, the modest positive relationship persists whether the administration method is online or not. The effect sizes are slightly lower for paper-pencil, but the difference is less pronounced than for the utilitarian value – hedonic value relationship.
Effect sizes by study group.
CI95: 95% confidence interval; HV: hedonic value; SAT: satisfaction; UV: utilitarian value.
Discussion and conclusion
Value, as a concept relevant to marketing, has earned its place as a core explanatory concept in research and as a core principle underlying effective marketing practice. As such, the discipline needs concerted efforts to fully develop value theoretically with an eye toward normative application of value theory. This special issue is an important step toward fulfilling that need.
In that spirit, we offer this research note that tries to address the validity of value axioms concerning the often-implied mutual exclusivity of utilitarian and hedonic value. In addition, the research addresses the relative efficacy of utilitarian versus hedonic value. The synthesis of results over published work in top marketing journals leads to a clear conclusion that utilitarian and hedonic value are not mutually exclusive. The meta-analytic results suggest a resilient, positive, correlation of modest size between the two dimensions. Thus, rather than being mutually exclusive, the two-value dimensions tend to complement each other. The strongest consumer experiences thus are characterized by relatively high levels of both value dimensions. By extension, the strongest brands embody both utilitarian and hedonic value. The brands both perform and move. Although the question of whether one value dimension relates to performance more than one is important, we identified only eight studies presenting correlations between both value dimensions and customer satisfaction. Among those eight studies, a modestly sized, positive correlation exists between both value dimensions and satisfaction. Thus, utilitarian and hedonic value appear equally important.
Although the ability to study potential meta-moderators was limited by the small number of studies duplicating characteristics or relationships, one interesting moderator emerged. The relationship between utilitarian and hedonic value appears larger when the survey methodology involves online delivery versus a paper-based interview form. Given that most researchers administer the PSV items together, rather than spreading them through the survey, one possibility for this finding is low-response involvement and greater acquiescence in online surveys. The moderation of the value dimension relationships with customer satisfaction also displayed slightly lower relationships (although not statistically significant) in paper and pencil form. Clearly, other potential reasons for the difference in relationships exists. But, the topic of survey administration mode’s affect on value assessment is worthy of further research.
We make no pretense of a more comprehensive research synthesis that would involve a larger search of both published and not published research. The results presented here provide a peek into what a comprehensive synthesis may find. Nevertheless, these results are consistent with recent research that validates the resilience of both value dimensions across different shopping contexts (Picot-Coupey et al., 2020). Both studies support the continued importance of simultaneous consideration of hedonic and utilitarian value in consumption experiences, despite evolving consumer behaviors. However, as is often the case in searching the literature closely, the published work suffers from fractionization and poor reporting of basic research elements (i.e. descriptive statistics). Both are factors that devalue academic research (Ellson, 2009). Indeed, in the quest for novelty marketing knowledge lacks a cumulative body of knowledge on core principles like value necessary to reach scientific conclusions (Babin et al., 2016).
Thus, we call also on value researchers to focus attention on core research issues such as the relationships between perceived value and satisfaction, the relationships between perceived value and firm performance, the role of customer engagement in value creation, the nature of service and value, value perceptions over time, and the role of emotion and cognition in creating value perceptions. All of these issues are worthy not just of a single study, but many studies in many contexts. Having established such evidence, meta-analytic models may be able to explain away the large amounts of heterogeneity in effect sizes and build a more solid basis for managerial conclusions.
Footnotes
Appendix
Studies included in the meta-analytical assessment.
| No. | Author | Year | Journal | Sample size | Respondents | Survey type | Country |
|---|---|---|---|---|---|---|---|
| 1 | Babin et al. | 1994 | JCR | N1 = 125; N2 = 440 | Consumer | Paper-pencil | USA |
| 2 | Babin and Darden | 1995 | JR | 118 | Consumer | Paper-pencil | USA |
| 3 | Griffin et al. | 2000 | JR | N1 = 386; N2 = 128 | Consumer | Paper-pencil | N1 = USA; N2 = Non-USA |
| 4 | Babin and Attaway | 2000 | JBR | 144 | Consumer | Paper-pencil | USA |
| 5 | Michon and Chebat | 2004 | JBR | 2,326 | Consumer | Paper-pencil | Non-USA |
| 6 | Stoel et al. | 2004 | JBR | 276 | Consumer | Paper-pencil | USA |
| 7 | Eroglu et al. | 2005 | JBR | 153 | Consumer | USA | |
| 8 | Babin et al. | 2007 | P&M | 214 | Consumer | Paper-pencil | USA |
| 9 | Arnold and Reynolds | 2009 | JR | 578 | Consumer | Online | USA |
| 10 | Arnold and Reynolds | 2012 | JR | 1,080 | Consumer | Online | USA |
| 11 | Park et al. | 2012 | JBR | 356 | Student | Non-USA | |
| 12 | Ha and Park | 2013 | P&M | 399 | Consumer | Online | Non-USA |
| 13 | Haas and Kenning | 2014 | JR | 309 | Consumer | Interview | Non-USA |
| 14 | Garaus et al. | 2015 | JBR | 497 | Student/ Consumer | Interview | Non-USA |
| 15 | Sirakaya-Turk et al. | 2015 | JBR | 345 | Consumer | Paper-pencil/ Interview | Non-USA |
| 16 | Pounders et al. | 2015 | JAMS | N1 = 457; N2 = 202 | N1 = Consumer; |
Online | USA |
| 17 | Nicod and Llosa | 2018 | RAM | 557 | Consumer | Interview | Non-USA |
| 18 | Wongkitrungrueng and Assarut | 2018 | JBR | 261 | Consumer | Online | Non-USA |
| 19 | Makri et al. | 2019 | JBR | 699 | Student | Non-USA |
JAMS: Journal of the Academy of Marketing Science; JBR: Journal of Business Research; JCR: Journal of Consumer Research; JR: Journal of Retailing; P&M: Psychology & Marketing; RAM: Recherche et Applications en Marketing (English Edition).