
Abstract
Digital social analytics is a subset of Big Data methods that is used to understand the social environment in which people and organizations have to act. This paper presents an analysis of eight projects that are experimenting with the use of these methods for various purposes. It shows that two specific technological features influence the work with such methods in all the cases. The first concerns the need to distribute choices about the structure of data to third-party actors and the second concerns the need to balance machine intelligence and human intuition when automating the analysis. These features set specific conditions for knowledge production, and the paper identifies two opposite approaches for engaging with each of these conditions. These features and approaches are finally combined into a two-dimensional affordance space that illustrates how there is flexibility in the way project leaders interact with the features of the data environment. It thereby also shows how digital social analytics come to have different affordances for different projects.
Introduction
When Google used hyperlinks to determine the relevance of web pages at the end of the 1990s, they did not just redefine the practice of search (Brin and Page, 1998). Their success made a compelling case for the argument that digital traces could be used as empirical indications of social phenomena. The methodological idea of repurposing digital traces as social data has, since then, spread beyond the field of search. Inside Google it has inspired the Flu Trends project that has both been hailed as a prime example of the powers of Big Data (Anderson, 2008) and criticized as an example of Big Data hubris (Lazer et al., 2014). Outside Google it has led to visions of how digital traces and Big Data can optimize decisions in, for instance, consultancy firms (McKinsey Global Institute, 2011) and developmental organizations (World Economic Forum, 2012).
Google’s success has spawned an interest in a specific subset of methods that this paper will term digital social analytics (DSA). The methods falling under this heading are here defined as repurposing digital traces from the web in order to establish new empirical sensitivities toward social phenomena. The fact that social analysts across different organizational sectors find themselves confronted by an unprecedented proliferation of web-based data has simply motivated a shift toward the digital in the methods they use to understand the social environment in which they are working (Adkins and Lury, 2009; Gane, 2011; Savage and Burrows, 2009).
This uptake of DSA is of sociological interest because empirical tools and techniques shape our representations of the world—and our actions within it. This is evident when we look at the way statistical reasoning has had effects on urban planning (Scott, 1998), how rankings have changed university management (Espeland and Sauder, 2007), and how surveys (Glynn et al., 2004) and censuses (Ruppert, 2011) have been used to operationalize “the public” as an object of analysis. This paper assumes that similar stories will be told when it comes to the techniques associated with DSA. In the words of Latour (1990), such techniques will produce inscriptions that define “what it is to see, and what there is to see.” Or, as formulated by Boland and O’Leary (1991), because “inscribing and organizing are interdependent.”
This paper presents an inquiry into the emerging use of DSA on the basis of two empirical sources. One is interviews with eight project leaders working with this empirical method across different organizational contexts. The other is analysis of the documentation of their respective projects. The paper will proceed as follows. The “Technological affordances and distributed information infrastructures” section will introduce James Gibson’s (1986) concept of affordances and Geoffery Bowker’s concept of information infrastructures (2010) to formulate two research questions that will guide the paper. “Method and research design” will outline the methodological strategy for answering these questions on the basis of interviews and documents. “Identifying characteristic features of the digital data environment” will answer the first research question by pinpointing features of digital data that enable different modes of seeing than previous analog methods. “Variations in strategies for interacting with distribution and automatization” will answer the second research question by identifying variations in the way the project leaders devise solutions to produce social knowledge with the conditions set by the features. Finally, “DSA: A method in a relational affordance space” will combine the identified features and approaches into a relational “affordance space” that illustrates how DSA come to have different affordances for different projects.
Technological affordances and distributed information infrastructures
James Gibson’s theory of affordances concerns the way we see the world around us. It was formulated as an intervention into the mid-20th century debate about perception and Gibson refused the prevailing empiricist understanding of perception. Instead of understanding vision as the causal result of external stimulus that affects a passive brain through the sense organs, he conceptualized it as the result of a constant and active interaction between the perceiver and the environment. The concept of affordances is the core of this argument, and Gibson defined it as follows: The affordances of the environment is what it offers the animal […] The verb to afford is found in the dictionary but the noun affordance is not. I have made it up. I mean by it something that refers to both the environment and the animal in a way that no existing term does. (Gibson, 1986: 127)
The first sentence of this quote emphasizes that in order to understand vision one must understand the entities that surround a perceiving agent. Gibson conceptualized the environment as being full of objects, persons, and mediums that create specific types of information to be picked up. He saw the environment as having a set of features that enable certain perceptions and actions. Gibson therefore took the environment to provide a certain scope of resources for seeing the world. The first research question of the paper transfers this ontology of perception to DSA, when it asks the following: “Does the environment of digital traces have characteristic features that enable or circumvent specific modes of seeing across projects that are working with DSA for very different reasons?”
The answer to this question gets us some of the way toward understanding the affordances of DSA. However, if we are to remain faithful to Gibson’s theoretical framework, it cannot stand alone. It is evident from Gibson’s quote above that the work of pinpointing the enabling and constraining features of the environment only tells half the story. The second part of the quote emphasizes that affordances is a noun that refers to the perceiving agent as well as to the environment. It is not a verb that can be attached to entities in the environment. This relational approach is stressed even more clearly in the following: […] an affordance is neither an objective property nor a subjective property; or it is both if you like. An affordance cuts across the dichotomy of subjective-objective and helps us understand its inadequacy. It is equally a fact of the environment and a fact of behavior. (Gibson, 1986: 129)
The features of the environment only frame the possibility of agentic action in relation to an object (Hutchby, 2001). They set certain conditions for experience, but they do not determine it. The perceiving agent will always have a unique set of capabilities that makes him or her interact with these features in a specific way. As put by Braund (2008), experience is the result of reciprocal movements in a perceiver–environment system. Affordance is relative to the action capabilities of a particular perceiving actor at a particular situation. It is a distributed and relational phenomenon.
The second research question, therefore, leaves the focus on features for a focus on differences in the way they are interacted with by different project leaders. However, the specific wording of this question builds on Geoffrey Bowker’s writings on information infrastructures, which he defines as “pervasive enabling resources in network form” (Bowker et al., 2010). To Bowker, such networks are not just tubes and wires with certain technical features. Rather, they are distributed across a broad range of social and technical actors. In fact, Bowker argues that one of the core questions to ask of information infrastructures is whether they distribute central tasks (such as creating meta-data or ensuring trust) to social or technical actors: In building cyberinfrastructure, the key question is not whether a problem is a “social” problem or a “technical” one. That is putting it the wrong way around. The question is whether we choose, for any given problem, a primarily social or a technical solution, or some combination. It is the distribution of solutions that is of concern as the object of study and as a series of elements that support infrastructure in different ways at different moments.
This way of thinking is not foreign to Gibson’s thoughts about experience as the result of a constant interaction between the situated capabilities of a perceiver and the features of the environment. He was also interested in how solutions to seeing were distributed across different actors. It is this combination between the works of Gibson and Bowker that is the foundation for the following formulation of the second research question: “Do the different projects vary in the way they distribute solutions to social and technical actors when handling the features set by the digital data environment?”
The combined answers to these questions lay the foundation for conclusions about the affordances of DSA. More specifically, the last section of the paper charts a relational affordance space in which DSA projects move. This space serves as an analytic contribution to recent sociological discussions about the practical epistemologies of the digital (Bowker, 2014; Marres, 2012; Mayer-Schönberger and Cukier, 2013; Savage and Burrows, 2009). It provides a foundation from which to understand DSA projects and thereby also how knowledge about the social may—or may not—be changing with the uptake of this new methodology.
Method and research design
Overview of cases and empirical data.
aThe documents can be obtained by contacting the author, and their references are listed in the ‘
The interviewees were chosen on the basis of a most different case study design that is well suited to answer the first research question. By studying projects that use DSA for a variation of purposes, it becomes possible to detect features of the data environment that enable and constrain modes of seeing in similar ways across different projects (Flyvbjerg, 2004). The selection of interviewees was decided through a purposive sampling technique, where the guiding principle is to “think of the person or place or situation that has the largest potential for advancing your understanding and look there” (Palys, 2008). More specifically, the cases were chosen through a combination of criterion sampling, expert sampling, and maximum variation sampling. The criterion set for cases to be included in the study was that the project leader had to be experienced in using DSA in his or her organization. Besides that he or she had to be a deep enough expert to answer questions about features of the data environment that he or she was working within. Finally, the cases were chosen so as to ensure maximum variation in the kind of problems the project leaders worked with and the type of organizations they were located in.
The interviews were carried out between October 2011 and April 2012 in New York City, Boston and through Skype. They lasted between 45 min and 1 h and the semistructured interview guides were to a large extent based on the documents suggested by the interviewees. The transcribed interviews and the documents were coded and analyzed in NVivo through a two-step process. The first step was to code the empirical material for features of the data environment that appeared as enabling or constraining. The aim of this analytic step was to identify features that were visible across the otherwise different cases. The second step was to recode the chunks of data concerning the identified features with the aim of identifying the scope of variation in the solutions for working within the conditions set by these features. This analysis led to the development of continuums of analytic ideal types that distribute solutions to technical and social actors in opposite ways.
Identifying characteristic features of the digital data environment
The first step of the analysis resulted in the identification of two features of the data environment that influence the work with DSA across the cases. One is the distributed character of the data structures on the web and the other is the necessity of automatization when working with fast paced data sets. Each feature set specific conditions for the way data can be captured and processed and they will be discussed in turn.
Distributed character of data structures on the web
To structure data is here defined as the practice of segmenting it on the basis of a set of predefined specifications or classifications. Sociologists of knowledge have for a long time emphasized the importance of such structures in the organization of knowledge (Bowker and Star, 1999) and this importance is not diminished when it comes to DSA. However, it has been suggested that the digital data environment is full of unstructured data (Mayer-Schönberger and Cukier, 2013). For instance, it has been suggested that data coming from platforms such as Twitter lack structure in the sense that they are not products of clearly defined interactions (Shaw, 2013). Bowker (2014) and Lisa Gitelman (2013) have recently challenged this idea with the argument that no data is ever raw or unstructured.
This paper follows Bowker and Gitelman in interpreting all digital data as always-already structured. For instance, a tweet comes with a 140 character limit that influences mode of expression and it has specific metadata that shapes the way it can be analyzed. This does not mean that data in different DSA projects have the equal when it comes to structure. The analysis of the eight cases will show that the practice of structuring has distinct dynamics in different sources of data. However, DSA projects share a common fate when it comes to the structuring of data. All of them work in an environment where both data and its structure are repurposed from secondhand sources on the web. This distribution stands in contrast to methods such as surveys (Agresti and Finlay, 1997) and focus groups (Morgan, 1996) where the structure of the data can be more or less controlled or moderated from the initial formulation of questions to the final analysis.
We really try to understand how the infrastructure impacts the way that people are interacting and it is really something important for us and each time there is a new social media place that appears we try to understand how it moves the […] existing landscape, and what are the new rules of this space. (L1)
The distribution of data formats in the projects.
The infrastructure sets the rules for data production and Fouetillou gives an example of how important it is for his company to understand the moving infrastructures around, for instance, the practice of linking in the blogosphere. As it stands now, this infrastructure enables people to leave generic links at the blog level. However, as Fouetillou formulates it, it is “not good to say, I like this article but it doesn’t mean that I like this blog, you know” (L1). The important point is that the conditions for data production and structure are set by a third-party actor. Fouetillou is in a situation where he relies on the link but has no control over the conditions for leaving these data.
The same goes for all the project leaders that are using tweets as the basis for their projects. A methodological challenge mentioned by Ana Andjelic, for instance, is that “Twitter creates a lot of complexity in the way the re-tweeting system is set up” (D1). Similarly, Chris Pallaris argues that the structure of 140 characters leaves “no space to really give to provide a depth of feeling” (I1). Even Alan Porter, who works with a more structured database like Factiva, reports trouble when repurposing its categories to understand dynamics of technological innovation: “[Factiva is a] very nasty database […] the more we work with these subject categories, the more we have an ‘uh, oh’ feeling” (STI1).
These methodological quarrels indicate the existence of so-called blue team dynamics that must be dealt with when working with DSA. Such dynamics arise with secondhand data. They refer to situations where a data provider modifies a data infrastructure for reasons that are unrelated to a specific analytic project—but nonetheless come to influence it (Lazer et al., 2014). Such dynamics have recently troubled the poster child of DSA—Google Flu Trends. Google’s model overestimated flu outbreaks in 2012–13 and the reason might have been that changes in Google’s drop-down menu made it suggest flu-related search words to its users (Lazer et al., 2014). This example of blue team dynamics exemplifies that web-based data are always prestructured and regularly restructured.
But the troubles with prestructured data may not be confined to blue team dynamics. The anonymized military intelligence analyst, for instance, speculates that sources like Twitter and Google may deliberately be censoring and cleaning the data they make available through their APIs. When speaking about the results from Google’s custom search engine, he, for instance, expresses the “feeling that The New York Times is paying to be there” (R1). Similarly, he argues that the invisibility of Wikileaks on Twitter ignites the “feeling that it was simply censored by Twitter” (R1).
Such deliberate attempts at gaining information are known as red team dynamics (Lazer et al., 2014) and there is often no way to know whether such dynamics are at play in web-based data. This means that the lack of control of data structures is supplemented with a great deal of black boxing when it comes to the sources for doing DSA. These features of the data environment are of immense importance to the epistemological characteristics of DSA because they set conditions for the modes of seeing the methods enables. Andlejic also explicates the fact that DSA requires the analyst to rely on a distributed set of tools, when she reflects on the practice of working with web-based data as a digital strategist: There is a script in every tool that sets out how you are going to use it […] I think about it when I do not have Internet access how I think differently […] My writing process is assemblaged of […] different sources, tools and different others. (D1)
The necessity of automatization
The second feature of the digital data environment that is mentioned across the cases concerns the need to rely on some degree of automatization in the processing of data. Automatization is here taken to be the choice of using computational technology to allow a process to take place in a spontaneous manner that does not require input from a human analyst. By being spontaneous, automatization is supportive of the kind of real-time analysis that is often referred to as one of the unique qualities of DSA (Mayer-Schönberger and Cukier, 2013).
The possibility of working with real-time data is also something that is mentioned as a unique advantage of DSA across the cases. This temporal characteristic of digital data is especially pertinent in the UN’s attempt at using tweets to provide early warnings of food-related crises in developing countries. In fact, project leader Robert Kirkpatrick points to the possibility of real-time awareness as the main advantage of DSA when compared to the method of household surveys: We define real time as basically information that is a current enough reflection of reality to be used to respond in ways to alter the outcome […] In a world of constant change, adaptation requires real time information […] The entire landscape is dynamic in ways that can be either harmful or helpful. We need to adapt to our programming as we go to that moving target. (UN1)
Kirkpatrick grounds the difference between survey analysis and DSA in their abilities to handle fast-paced data. This temporal focus leads to a focus on automatization because no human being can process large amounts of data at the same speed as a computer. Without a certain degree of automatization, it would not be possible to create representations of the social that “adapt to the moving target.” In short, the shared interest in fast data translates into a shared interest in some degree of automatization and algorithmic data processing across the cases. Just as scientific visualizations are conditioned upon their subjects becoming mathematized (Lynch and Woolgar, 1990), it can be argued that the pace of digital data requires DSA to be somewhat automatized.
However, all of the project leaders translate this condition into a need for finding a balance between the strengths of machines and humans. Despite having different ways of approaching this balance, they seem to agree with Guilhem Fouetillou when he states that “it is really difficult to have good results with purely automated approaches” (L1). They are all on par with Bowker when he argues that it is the decision whether to think of an information problem having a technical or social solution that is the decisive infrastructural choice. We have already seen Ana Andjelic hinting at this with her description of her own thinking as an assemblage of different social and technical sources. The following quote illustrates that she connects this feature of DSA to a need for striking a balance between the technical and the human: “If you think about the assemblage of technical and human you cannot reduce the humans to one dimension and the technical to another dimension. Its like design – its how you connect them” (D1). John Kelly expresses a similar point when he argues that “you try to leverage what humans and computers do. I don’t think of them as extracting different features” (MA1). In fact, all of the interviewees implicitly refuse an otherwise popular idea—namely that automated pattern recognition represents “the end of theory” (Anderson, 2008). In their practical work with web-based data, they all experience the need for human classification at some point in the process. As we will see below, they disagree on the right balance, but they all subscribe to a classic argument in the sociology of knowledge, namely, that data visualizations are constructed by combinations of automated machines and people using concepts and styles of practice (Burri and Dumit, 2007).
Distribution and automatization as features that enable and constrain
This leads us to a positive answer to the first research question. The data environment that DSA operates within does indeed have characteristic features that create possibilities and constraints across the cases.
First, it contains data that are structured by a distributed set of actors and thereafter repurposed by the analysts. This feature enables the analyst to liberate him or herself from one specific logic of data production and include a broader set of voices in the depictions of the social. On the other hand, this feature also comes with important constraints in relation to transparency and control over data.
Second, the environment of digital data contains data that comes at a pace that requires an integration of automated algorithms into the information infrastructure. This feature enables a real-time sensitivity that is widely appropriated across the cases. However, it also circumvents a mode of seeing where human intuition can be relied upon to interpret the complete set of data. Much data in DSA will never be encountered by a human being before it shapes the depiction of the social. This creates a problem of how to balance technical and human aspects of the infrastructure.
It is the combination of these features which makes DSA a unique method of social analysis that will create a different mode of seeing than popular methods such as field ethnography and survey statistics. Whereas ethnography works in a data environment that contains messy and distributed data, it does not need to delegate part of its analytic work to automated algorithms. To the contrary, whereas survey statistics are dependent on a mathematization of their data subjects, they are deductive in the sense that they control the structures of the data when the survey is formulated. It is the combination of the two features that makes the data environment around DSA distinct. However, the description of these features is not enough to understand the affordances of DSA. Both Gibson and Bowker emphasize the need to look at the capabilities of the perceiving agent and the way they interact with these features. This is the topic of the second research question, to which we will now turn.
Variations in strategies for interacting with distribution and automatization
This section will describe variations in the way the features are dealt with across the cases. The interviews and documents will be used to construct two ideal-type approaches for interacting with these features. These ideal types represent ends of a continuum that projects of DSA can move between. By ideal type it is meant that the approaches are not tied to a single case but rather synthesized from related ways of thinking about how to engage with the conditions set by the features across the cases. Each project may slide back and forth on the continuums depending on the context the project finds itself within.
Approaches for engaging with distributed data
Figure 1 depicts a continuum with two opposite approaches for engaging with the distribution of data structures. One ideal type is conceptualized structured channeling. It represents a suggestion to give high priority to deriving structure from communication channels that are deemed valid and reliable. The identification of a relevant channel to repurpose data from is a core methodological act and what counts as a relevant channel naturally varies from project to project. However, the approach of structured channeling prioritizes channels that have specialized competencies in organizing data from specific groups that communicate about specific issues through specific genres.
Illustration of the feature of data distribution (red box) and the continuum between two ideal-type approaches (blue boxes) to engage with this feature when working with “digital social analytics.”
A case that exemplifies this way of engaging with distributed data structures is Alan Porter’s choice of working with the database Web of Science (WOS) when depicting the transdisciplinary scope of research projects. This depiction is part of a project that evaluates whether the U.S. National Science Foundation succeeds in funding research that crosses disciplinary and organizational boundaries, and it is shown in Figure 2. Porter is partly motivating the choice of relying on the data structures in WOS through a reference to its editorial judgment and robustness: Our methods depend on the WOS Subject Categories. [The use of subject categories] as the unit of classification means that an article’s journal, not its content, determines its categorization. Assignment of journals to SCs is based on a combination of citation patterns and editorial judgment at the Institute for Scientific Information (ISI) – it is not unambiguous [but] quite robust. (STI3)
Visualization depicting the interdisciplinary reach of scientific disciplines in order to evaluate whether the U.S. National Science Foundation is succeeding in funding research that crosses disciplinary boundaries.
The WOS subject categories are robust because they are structured by scientifically competent people who segment scientific papers into data chunks such as author affiliations, citation scores, publication dates, and journal types. Each of these classifications is discrete enough to be distinguished from each other by a computer and they are recognizable in the context in which the project is going to have an impact (STI3; STI4). The choice of relying on WOS categories ensures that the process of data structuring is distributed to a channel that has a recognized institutionalized expertise in the relevant scientific fields. If a paper is classified as belonging to a specific category in WOS it is because an editor with professional judgment has placed it there. This does not ensure that the structures are perfect, but they are argued to be sufficiently stable, well defined, and transparent to risk the loss of control involved in distributing decisions about them to a third-party actor (STI3; STI4).
Structured channeling is a solution to the challenges of secondhand data that are visible across many of the cases. Another project led by Alan Porter, for instance, uses the data structures in Thompson Reuters Derwent World Patent Index as the basis for depicting innovation pathways around emerging technologies (STI2). Similarly, a UN project done by Robert Kirkpatrick’s lab uses the structure of press releases in Dow Jones’ business tool, Factiva, as the basis for mapping the influence of different food security issues (UN4). The rationale behind enrolling such recognized databases is nicely summarized by the anonymized military intelligence analyst who states that if one wants to know what, for instance, the medical profession think about a specific issue one must first look for “whatever channel there is where medics discuss these things” (R1). This quote indicates that medics are the best sources of information about the medical profession and that an important methodological job is to locate specialized channels where medics communicate. A central assumption behind the approach of “structured channeling” is accordingly that the analysts working with DSA should prioritize structured data from channels with an institutionalized expertise and a clear and transparent process for segmenting data.
The analytic ideal type at the opposite end of the continuum in Figure 2 is conceptualized as adaptive tracking. It differs from structured channeling because it is not looking to identify specific channels as providing the most relevant data structures. It is rather a solution to the challenges of distribution that takes the demise of authoritative channels as one of the key benefits of web-based data. John Kelly exemplifies this when discussing the blog-links used by Morningside Analytics to identify political clusters: A corporation, a newspaper, the federal government, a celebrity, your grandmother, the Sierra Club, and the pizza place on the corner can all have a blog, or even just a regular old website. And they can link to each other if they choose. This unification of channel for communication across all levels of social scale is critical, because the previous segregation has been so foundational to social life in the widest sense […] Internet communications technologies are eliminating the channel-segregation that previously reinforced the independence (or mutual deafness) of classes of actors […]. (MA2)
Links on a blog are here argued to break the need to rely on channel-specific data structures such as the ones obtained from institutionalized channels like WOS. Whereas classifications like journal types and data structures like citations are ordered by field professionals, this is not the case with digital traces like the link, the like, and the retweet. Blogs, Facebook, and Twitter are not designed for communication between people with predefined expertise that communicate in specialized genres. As put by Ana Andlejic, they are rather interfaces that “function more as a media platform than as a publisher with editorial control” (D2). The lack of such control is here posited as a positive trait of digital data. If we return to the project of depicting transdisciplinarity, it would, accordingly, be a priority for proponents of adaptive tracking to build depictions without having to rely on data structures from within the discipline of science. Using platforms rather than channels would ensure that a research idea would not necessarily have to come in the form of a paper made by an identifiable author and its relevance would not have to be judged on the basis of institutionally validated formats such as a citation.
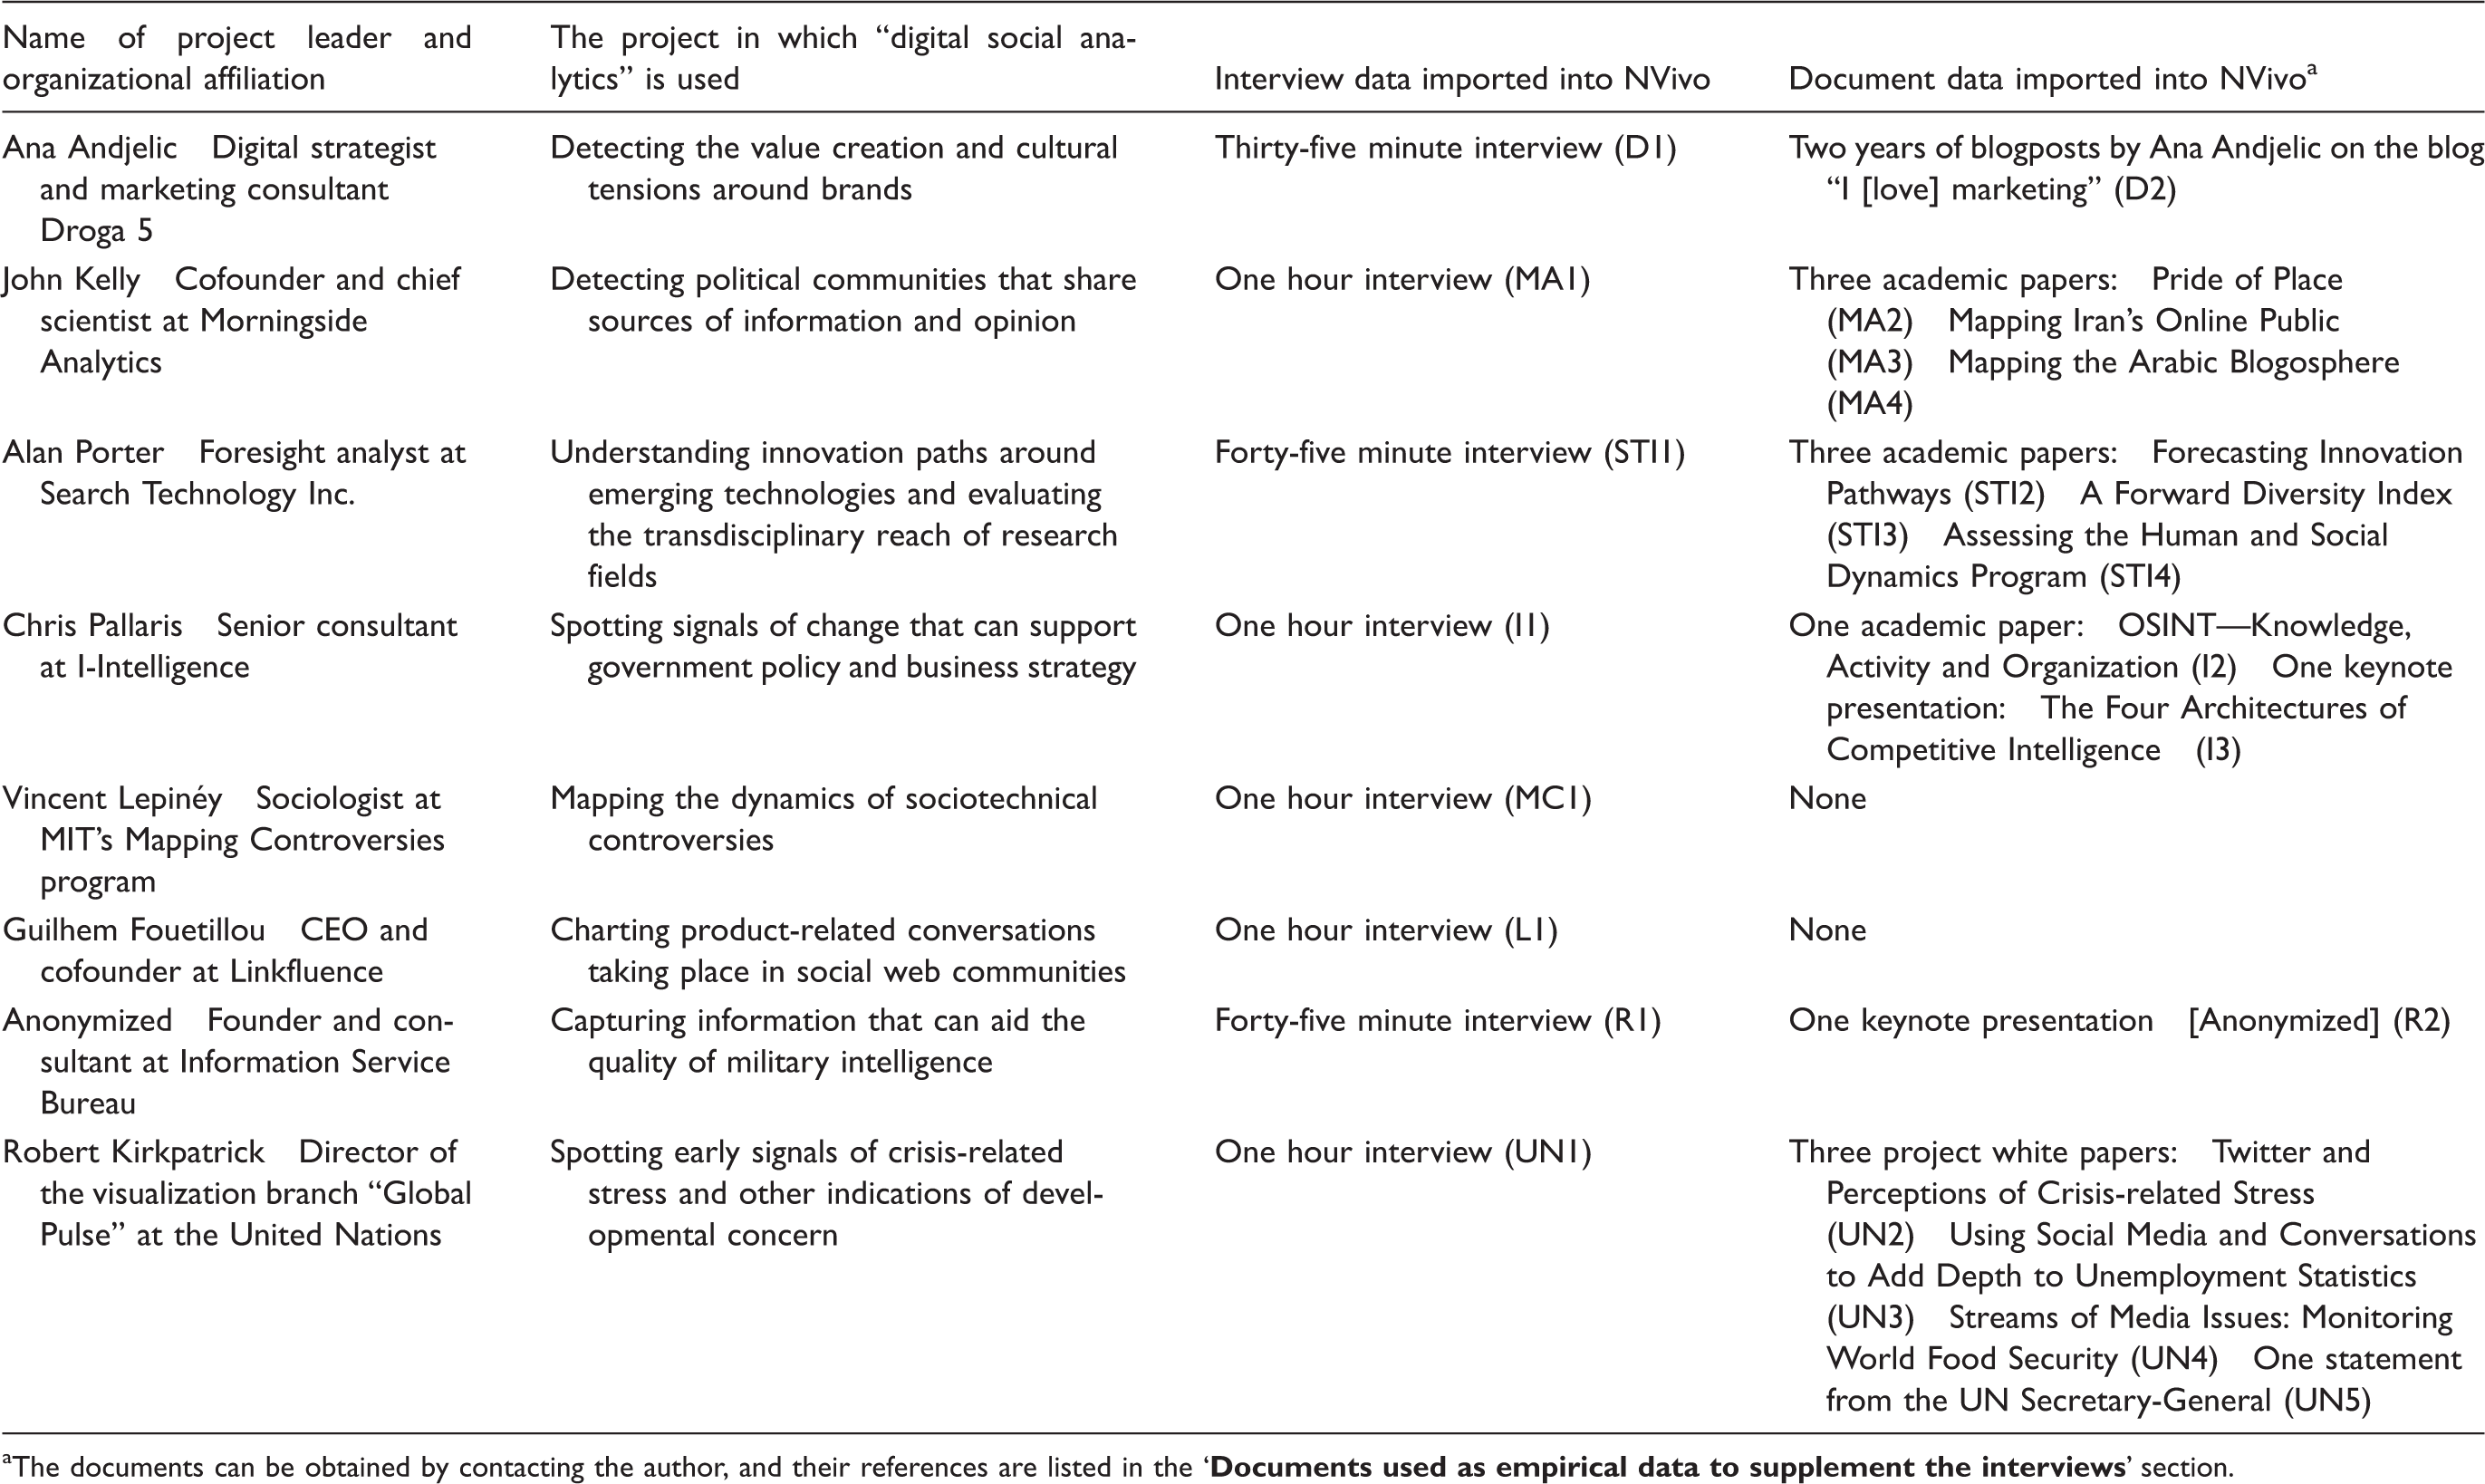
Robert Kirkpartick’s emphasis on the need for the UN to adapt methods to hit moving targets is also connected to this way of thinking (UN1) – the reason being that institutionalized channels are not very agile data sources. One of Kirkpatrick’s projects is the construction of the crisis monitor depicted in Figure 3. This monitor is built to give early warnings of food-related crises in Indonesia and the USA on the basis of tweets, which is a type of data that has quite specific characteristics. It has a maximum of 140 characters, it can be left on mobile phones, and it is captured through Twitter’s application programme interface (API) where it is accompanied by a set of metadata in JSON language. This combination means that it provides a quicker and a more heterogeneous set of data than institutionalized channels such as the survey team in the UN.
Visualization depicting meaning structures around the topic of food in order to detect negative emotions and early signals of crisis. Source: UN Global Pulse (Dec, 2011).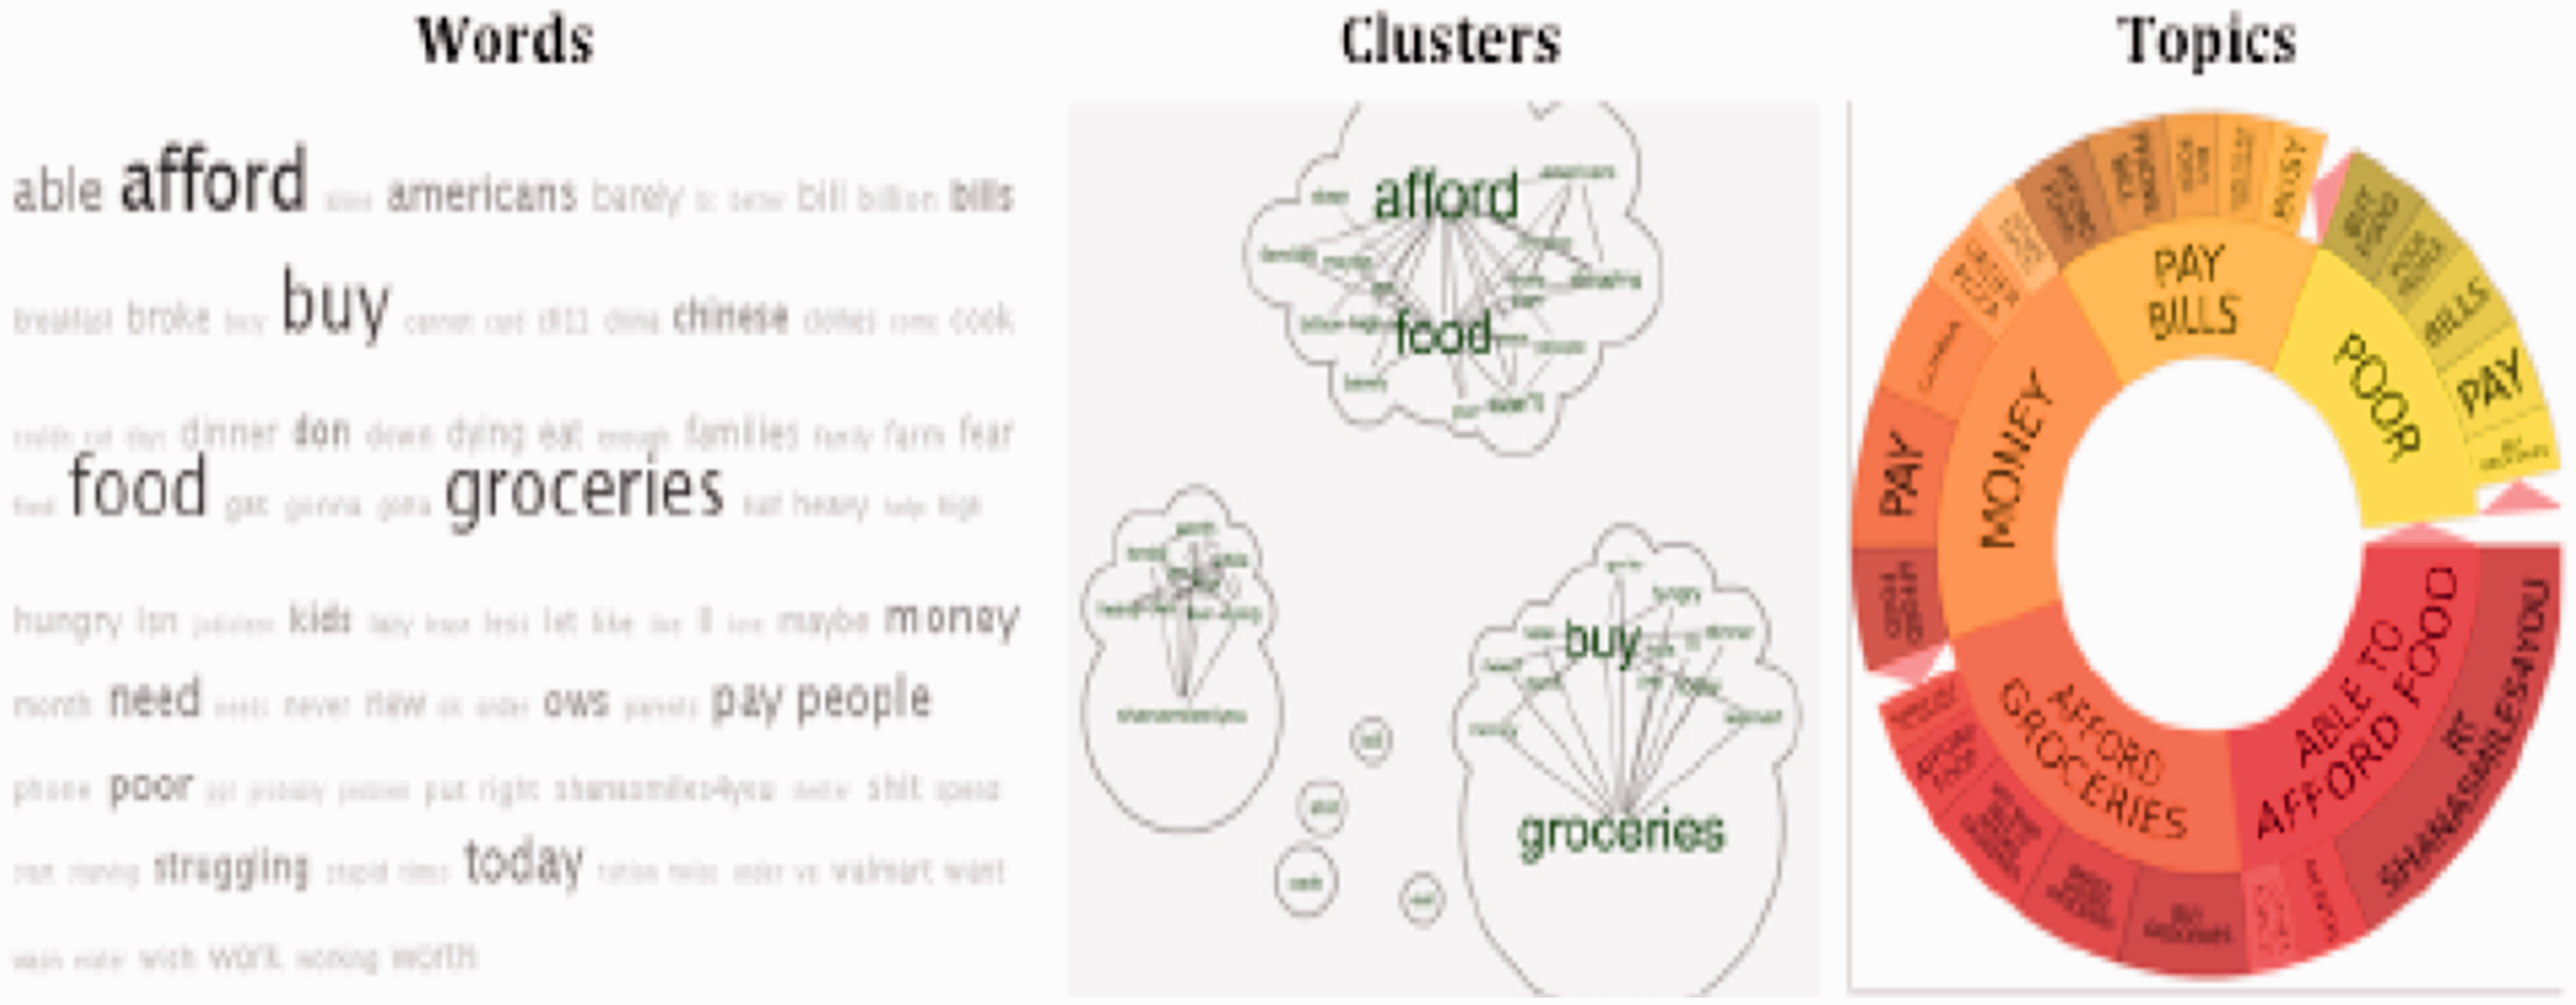
The monitor contains three visualizations. To the left we see the words most frequently tweeted, in the middle we see the semiautomated networks that indicate how these words cooccur with predefined key words, and to the right we see a “topic wheel” that uses automated color codes to indicate the severeness of specific issues (UN2). These visual elements exemplify Kirkpatrick’s ambition to ground DSA in real-time data. He prioritizes data that are structured in such a way that they can be used in everyday communication. This pace is ensured by lowering requirements on the stability, reliability, and validity of data. For instance, tweets may change its number of characters and the API may change the metadata it makes available. Despite these shortcomings, Twitter is still the favored data source in Kirkpatrick’s crisis monitor as well as in projects led by Ana Andjelic, Chris Pallaris, and Guilhem Fouetillou. This choice reflects the idea that DSA must be based on a data foundation that is as changing and unreliable as the platforms that people use. Or, as put by Ana Andlejic when discussing noise in data: “Complexity in the environment of tools should be aligned with complexity in human behavior. You do not need to simplify” (D1).
The approaches of structured channeling and adaptive tracking represent opposite ways of engaging with the feature of distribution. As two ends of an analytic continuum they pinpoint a central trade-off that concerns the need to balance an interest in transparent, structured, and trustworthy data with an interest in data structures that are adaptive and agile. With the words of Bowker, this trade-off also implies a decision on how an infrastructural solution is distributed between social and technical elements. In the approach of structured channeling, the solution is to a large extent distributed to a professional that ensures the transparency and topical relevance of the data. To the contrary, in adaptive tracking the solution is more broadly distributed. The data structures that shape the analysis are provided by a platform on which both a crowd of humans and technical gatekeepers play a role.
Approaches for engaging with automatization
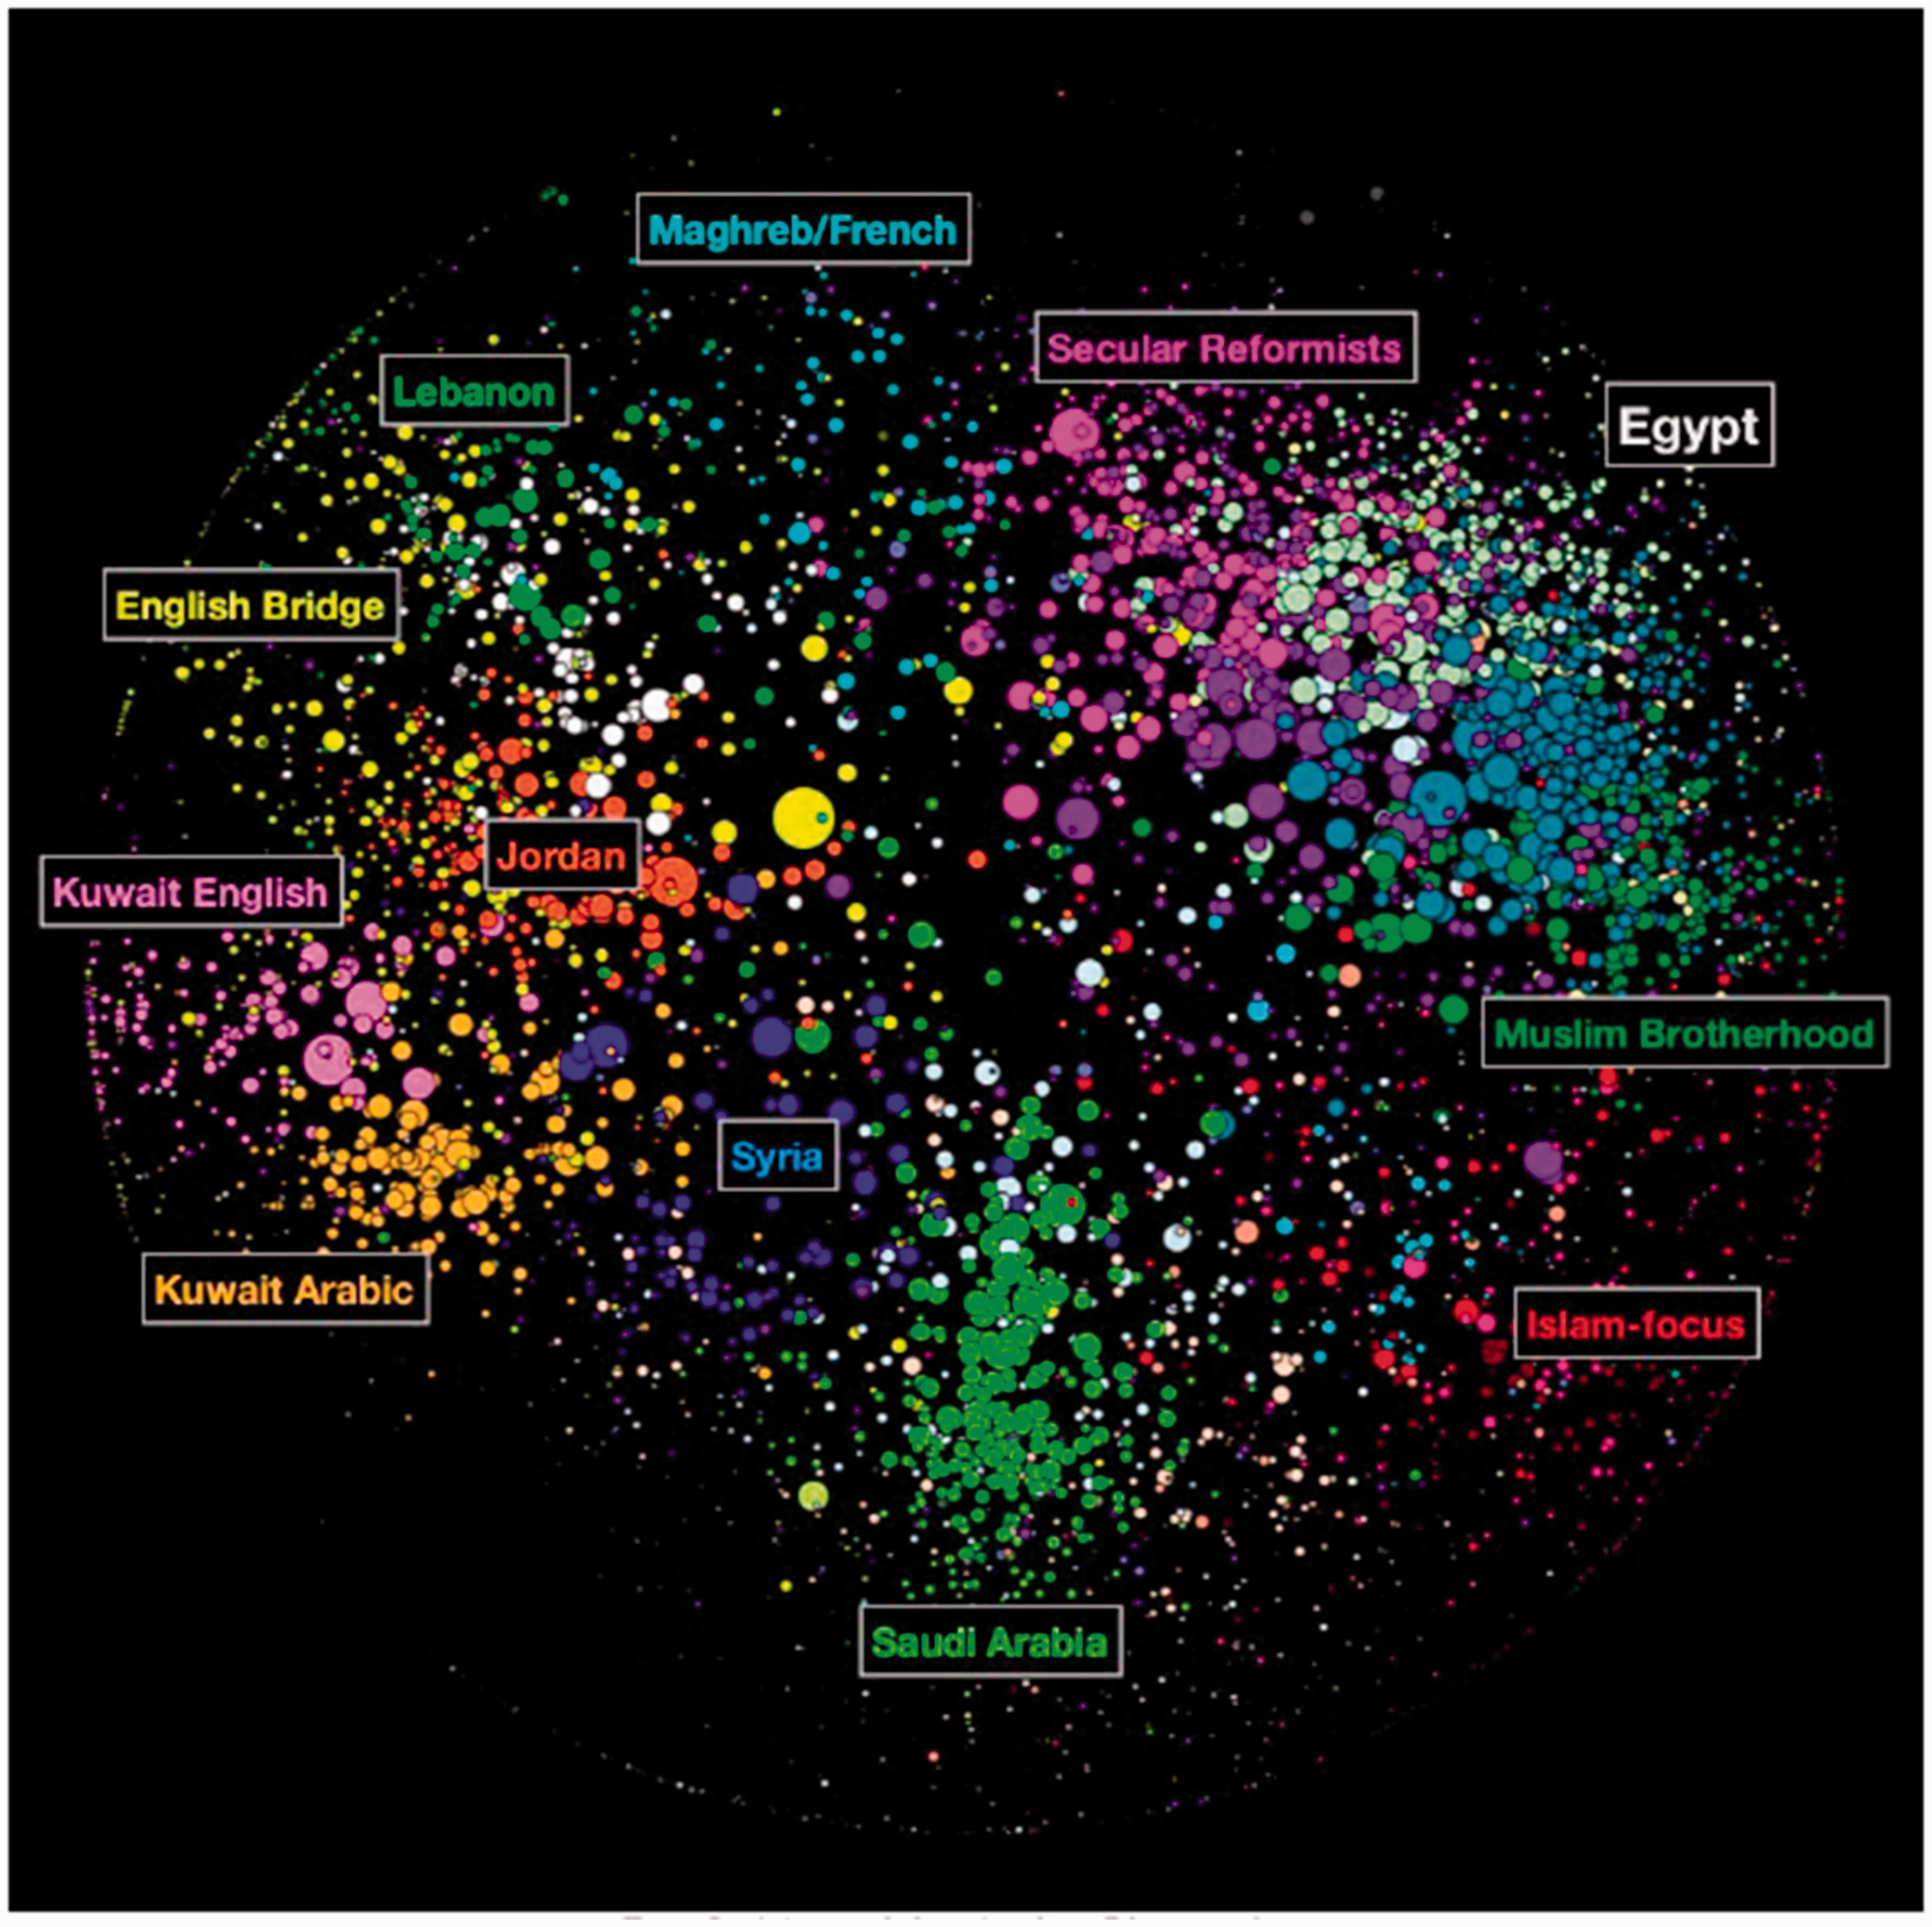
Figure 4 depicts a continuum with two opposite approaches for handling the need to balance the role of humans and machines when automating data analysis. One ideal type is conceptualized as following because it suggests to leverage the power of algorithms to recognize surprising patterns in data without being distracted by cultural preconceptions. Despite being “blind” in their processing of data, the approach rests on the assumption that algorithms can guide analysts to innovative analytic concepts and categorizations. This way of thinking, for instance, underpins John Kelly’s project of visualizing political clusters in the blogosphere. Figure 5 shows an example of his work with so-called attention clusters in the Arabic blogosphere. The nodes represent blogs, their size is based on in-links, their position is based on nearness to their neighbors, and their color is based on their history of links to other sources.
Illustration of the condition of automatization (red box) and the continuum between two ideal-type approaches (blue boxes) to handle this condition in the process of technical commensuration. Visualization depicting “attention clusters” in the Arabic blogosphere in order to understand the influence of blogs on political discourse.
Kelly explicates the following approach when he explains how his way of visualizing political communities is different from his competitors: Some people would go in and color the nodes on the basis of some pre-existing typology. They got the categories that they think are relevant in their minds and they go in and they assign everything to a category. I sort of wanted the data to tell me what kind of categories that were in it. I did not want to go in with presuppostitions […]. (MA1)
This is why Kelly colors the nodes on the basis of computer-detected similarities in link history rather than preestablished distinctions between, for instance, liberal and conservative bloggers. For instance, the yellow nodes represent a group of bloggers that are connected for other reasons than linguistics, nationality, or political observation. The choice of following the way the algorithm colors on the basis of a long history of linking is what enables this subset of the blogosphere to be visible. This mode of seeing political communities is enabling different interpretations of the political discussions about the Middle East than a map based on expert categories. Automatization is used to avoid the drawbacks involved in relying too heavily on a priori human intuition. This is a kind of use that is also promoted by Guilhem Fouetillou in his mapping of products (L1). Similarly, Ana Andjelic supports this inductive form of analysis because it enables analysts to see “[…] something that [they] have previously missed” (D2).
The analytic ideal type at the opposite end of the continuum is conceptualized as training because it builds on the idea that “it is imperative that the analyst ‘train the algorithm’ (UN2). It is an alternative to following because it suggests guiding the automated algorithm to reflect categories that are recognizable in the context in which they are going to have an impact. The tag clouds in the monitor in Figure 4 reflect this approach. They are built by training algorithms to detect predefined emotional cues around predefined crisis categories such as “food.” Tweets that fitted the intuition of the analysts about what belongs to these cues and categories were used to train the algorithms. The goal was to ensure that the visualization was “aligned with project objectives” (UN2). The approach of training is, in that sense, a way of emphasizing the importance of having a human decision that points the “[…] processing capacity at particular problems” (I1).
The approaches of following and training represent two opposite ways of engaging with the need for automatization. They pinpoint a central trade-off between the need for DSA to reflect distinctions that resonate with the world and the need to challenge dominating distinctions on the basis of emergent categories. Both approaches are conditioned upon the need to enroll algorithms in the organization of information but the way they preprogram these algorithms is quite different. The approach of training uses expert guidance to program software on the basis of predefined semantic classifications that are relevant for the social dynamics analyzed. This is different in the approach of following where the preprogrammed elements are grounded in theories about the mathematical properties of the social world.
The continuum between following and training is also providing insights into variations in the way infrastructural solutions can be distributed between technical and social elements in DSA projects. For instance, training semantic software to look for the occurrence of specific words that an expert has suggested is prioritizing a social solution. To the contrary, following the algorithm and letting it guide you to words that occur next to each other is prioritizing a technical solution. All of the cases slide somewhere between the extremes of the continuum in Figure 4. A good example is Alan Porter’s depiction of transdisciplinarity in Figure 3, which is a hybrid between an initial expert categorization in WOS and an algorithm running an inductive analysis to identify the clusters (STI3; STI4). This mode of coloring exemplifies the need for striking a balance between machine intelligence and human categorization. A balance that Bowker (2014) has recently argued to be central in the context of Big Data.
DSA: A method in a relational affordance space
The analysis so far has shown that the data environment surrounding DSA has specific features that set certain conditions for the production of social insights. It has also shown that these conditions are engaged within different ways across the projects. Following Gibson, we can say that the affordances of DSA are shaped by reciprocal movements in this perceiver–environment system. Put differently, each project working with DSA will find itself in a situation where the features of the environment and the capabilities of the project leader need to be aligned. In line with Bowker, the analysis has shown how this alignment will be an outcome of a negation about the degree to which solutions should be distributed to technical or social actors. The solution to this negotiation will ultimately place DSA projects at a certain position in the two-dimensional space in Figure 6, which integrates the continuums in Figures 1 and 4.
Two-dimensional space within which projects of “digital social analytics” can locate themselves.
Figure 6 can be interpreted as depicting a flexible affordance space within which any DSA project can align the features of the environment with the capabilities of the analyst. Following Gibson, it can be argued that these capabilities will ultimately be shaped by the situation and context in which a given project is carried out. The position of a project on the affordance space is therefore influenced by the situation the project leader finds him or herself within. This point becomes clear when looking at the reasons for positioning UN’s Twitter-based crisis monitor in top center in the affordance space above.
First, the project is located in the top of the coordinate system because it prioritizes the adaptiveness of digital data over their transparency. However, it is important this prioritization of an agile infrastructure fits the strategic mission of the Secretary-General, who launched the Global Pulse Lab by stating that the world is increasingly “volatile and interconnected [because] the impacts of [a] crisis [are] flowing across borders at unprecedented velocity” (UN5). This argument entails that tools like surveys and census data are too slow to detect signals of emerging crises in due time to react upon them. An example of such a signal is a mother who takes her kid out of school. Within the UN this is considered to be an “early signal” of economic problems and one argument for experimenting with DSA is that this mother will communicate about her choice through a traceable media device a long time before a traditional survey can capture it (UN1). It is such possibilities that make the Secretary-General conclude that “traditional 20th century tools for tracking […] development simply cannot keep up” (UN5).
When the features of the digital data environment and the capabilities of an analyst in a specific context influence each other we have what Gibson would refer to as a reciprocal movement in the perceiver–environment system. In the case of Global Pulse, this movement makes a specific DSA solution possible. For instance, it is feasible for Kirkpatrick to distribute the solution to the challenges of distribution toward the Twitter infrastructure. The organizational discourse around the Global Pulse is favorable for prioritizing speed over transparency and control. However, the project is at the same time positioned in the middle of the horizontal axis because there is a need to ensure that the final visualizations are recognizable across different branches of the UN. Bureaucratic organizations need data that are recognizable across organizational silos and this is hard to ensure if one is distributing the solution of classification challenges to an automated algorithm. Training ensures recognizability! Or, as Robert Kirkpatrick puts it: “[…] It is not just about getting the data; it is also […] about the organizational capacity to facture a snapshot of these types of information in the context of their on-going policy development planning” (UN1).
These movements in the perceiver–environment system determine the kind of affordances DSA has for Kirkpatrick. This also indicates why the affordances of DSA should not be understood as an attribute of digital technologies. Affordances is not a verb—it is a noun. It is a relational entity emerging in an interplay between environmental features and capabilities for seeing that are tied to a specific problem in a specific context. Similar conclusions can be drawn from a look into the two other projects positioned in Figure 6. Alan Porter’s visualization of the transdisciplinarity of scientific disciplined is produced as an input to an official governmental funding program. In order to fulfill such a role, it needs to be perceived as valid across different stakeholders. The pace of the visualizations is less important. This leads to a specific alignment between features and capabilities when it comes to handling the distributed character of digital data. The solution is distributed to professional social actors because transparency in the data is of higher priority than speed. Finally, John Kelly’s project on the structures of political communities was funded by research money and was carried out in a private consultancy company. This context gives Kelly the capability to experiment with technical solutions to the challenges of both distribution and automatization. All these ways of settling movements in the perceiver–environment system will lead to distinct affordances and thereby also of different social implications of the use of DSA in response to particular problems.
Conclusion
With a departure in Gibson’s concept of affordances and Bowker’s concept of information infrastructures, this paper has analyzed eight projects that are using DSA to depict and understand a diverse set of social dynamics. Through interviews and document analyses, the paper initially identified two features of the digital data environment that set specific conditions for knowledge production across the projects. One was the need to distribute the work of structuring data to third-party actors and the other was the need to find a proper level of trust in automated techniques when dealing with fast paced data.
The second part of the analysis identified ideal-type approaches for engaging with these features across the cases. First, it was shown that the distribution of data can be handled either by prioritizing structured channeling of institutionalized data from transparent sources or by prioritizing adaptive tracking of data formats from platforms that integrate many actors and that are agile enough to change the rules for data generation when the world changes. Second, it was shown that the need for automatization can be handled in two ways. The first is to prioritize an inductive empirical strategy where one is following algorithmic pattern detection. The second is to prioritize a training of the algorithm that make it return categories that resonate with already existing beliefs.
These ideal-type approaches were finally combined into a two-dimensional space where DSA projects can be positioned according to the way they interact with the features of the data environment. It was suggested to think of this space as a flexible affordance space because the affordances of DSA can only be understood through a theoretical focus on the interplay between features of the digital data environment and the analyst’s capabilities for working with specific modes of seeing in the situation and context he or she works within. This interplay can, with the words of Gibson, be seen as movements in the perceiver–environment system and it was argued that the affordances of DSA will be determined by the way the different sociotechnical actors in such movements can be aligned in a specific situation.
Documents used as empirical data to supplement the interviews
Andjelic A (2010–2012) I [love] Marketing, Blog. Available at: http://anaandjelic.typepad.com/ (accessed 27 February 2012).
Etling B, Kelly J, Faris R, et al. (2009) Mapping the Arabic blogosphere: Politics, culture, and dissent. Harvard University, USA: Berkman Center Research Publication. Available at: http://cyber.law.harvard.edu/publications/2009/Mapping_the_Arabic_Blogosphere (accessed 13 November 2011).
Global Pulse (2011) Streams of media issues—Monitoring world food security. Available at: http://www.unglobalpulse.org/projects/news-awareness-and-emergent-information-monitoring-system-food-security (accessed 11 January 2012).
Global Pulse (2011) Twitter and perceptions of crisis related stress. Available at: http://www.unglobalpulse.org/projects/twitter-and-perceptions-crisis-related-stress (accessed 11 January 2012).
Global Pulse (2011) Using social media and online conversations to add depth to unemployment statistics. Available at: http://www.unglobalpulse.org/projects/can-social-media-mining-add-depth-unemployment-statistics (accessed 11 January 2012).
Kelly J (2008) Pride of place: Mainstream media and the networked public sphere. Harvard University, USA: Berkman Center Research Publication. Available at: http://cyber.law.harvard.edu/sites/cyber.law.harvard.edu/files/Pride%20of%20Place_MR.pdf (accessed 13 November 2011).
Kelly J and Bruce E (2008) Mapping Iran’s online public: Politics and culture in the Persian blogosphere. Berkman Center Research Publication. Available at: http://cyber.law.harvard.edu/publications/2008/Mapping_Irans_Online_Public/ (accessed 13 November 2011).
Ki-Moon B (2011) Secretary-General’s remarks at General Assembly Briefing on the Global Pulse Initiative. Available at: http://www.un.org/sg/statements/?nid=5668 (accessed 11 January 2012).
Pallaris C (2009) OSINT as knowledge, activity and organization—Trends, challenges and recommendations. Available at: http://www.eurosint.eu/system/files/docs/osint-knowledge-activity-organization.pdf (accessed 27 February 2012).
Pallaris C (2012) The four architectures of competitive intelligence. In: Presentation at 360 Degree Indian CI conference, 27 February 2012. Zurich: Swiss Federal Institute of Technology, 1--16.
Porter A and Garner J (2011) Assessing the human and social dynamics program exceptional cross-disciplinarity. In: Paper presented at Atlanta Conference on Science and Innovation Policy, Atlanta, 1--9
Porter A and Stephen C (2011) A forward diversity index. Scientometrics 90: 407–427.
Porter A., et al. (forthcoming) Forecasting innovation pathways: The case of nano-enhanced solar cells. In: Technological forecasting and social change. Elsevier.
Footnotes
Declaration of conflicting interest
The author declares that there is no conflict of interest.
Funding
This research received no specific grant from any funding agency in the public, commercial, or not-for-profit sectors.