
Abstract
Objective
This study aims to develop a deep learning model utilizing both surface and esophageal electrocardiogram (ECG) data to accurately differentiate types of paroxysmal supraventricular tachycardia (PSVT), including slow-fast atrioventricular nodal re-entrant tachycardia (S-F AVNRT), and orthodromic atrioventricular reentrant tachycardia with left-sided (AVRT-L) and right-sided (AVRT-R) accessory pathways.
Methods
We analyzed 921 ECG cases from 775 patients from four hospitals between 2014 and 2022, segmented into 6261 ten-second ECG segments. A Residual Network (ResNet)-based model was developed. For comparison, Random Forest (RF) and eXtreme Gradient Boosting (XGBoost) classifiers were also constructed using handcrafted time-domain and frequency-domain features. It was thoroughly evaluated using a comprehensive set of metrics. These metrics included accuracy (ACC), the area under the receiver operating characteristic curve (AUC); sensitivity (SEN), specificity (SPE), positive predictive value (PPV), negative predictive value (NPV), and F1-Score.
Results
The diagnostic efficacy of ECG lead configurations was robust. Among surface-only leads, the three-lead combination II+V1+aVF achieved the highest AUC (0.989). The single-lead aVF demonstrated remarkable efficiency (AUC 0.961), approaching the performance of the full 12-lead ECG (0.974). The bipolar esophageal lead (EB) alone achieved an AUC of 0.989, comparable to II+V1+aVF (AUC 0.989). The combination aVF+EB yielded the highest overall AUC of 0.996. ResNet significantly outperformed RF and XGBoost across all lead configurations (P < 0.001).
Conclusion
This model effectively distinguishes between PSVT types, surpassing traditional diagnostics in accuracy and reliability. Future research should focus on model optimization and dataset expansion to enhance diagnostic capabilities and interpretability.
Keywords
Introduction
Slow-fast atrioventricular nodal re-entrant tachycardia (S-F AVNRT) and orthodromic atrioventricular reentrant tachycardia (O-AVRT) are common paroxysmal supraventricular tachycardia (PSVT) types.1,2 Surface electrocardiogram (ECG) is a simple tool that provides critical information in guiding catheter radiofrequency ablation planning and other strategic procedures. 3
Besides surface ECG, transesophageal cardiac electrophysiological study (TE-EPS) is crucial for managing PSVT as a noninvasive tool.4–6 The esophageal electrode uses the close anatomical proximity between the esophagus and the left atrium to facilitate indirect atrial pacing, similar to coronary sinus pacing in intracardiac EPS. In TE-EPS, it clearly shows atrial waves and helps us to find the relationship between P waves and QRS complexes, aiding in identifying PSVT types and mechanisms.
For concealed accessory pathway-mediated O-AVRT, preliminary localization can be achieved by observing the retrograde P′ waves in surface ECG or comparing RP′ intervals in esophageal leads with those in the V1 lead via esophageal ECG. However, current diagnostics still rely on manual analysis of both ECG types, requiring repeated measurements and sinus rhythm comparisons. This process requires extensive physician expertise and can yield inconsistent outcomes due to judgment variations. Ensuring consistency and accuracy will be cost ineffective.
Recent advances in artificial intelligence (AI), especially deep learning, have developed algorithms for cardiac arrhythmias, which are now applied in classifying PSVT.7–9 However, there are still gaps in differentiating morphologically similar tachycardia ECG signals of O-AVRT involving left-sided and right-sided accessory pathways. Moreover, there is a scarcity of research combining esophageal ECG signals with AI for PSVT classification.
Thus, we aim to develop an efficient deep learning model based on surface and esophageal ECG for the identification and classification of PSVT ECG, specifically targeting S-F AVNRT, AVRT-L, and AVRT-R.
Method
Patient sources
ECG data were retrospectively collected from patients undergoing TE-EPS for PSVT, spanning June 2014 to November 2022, across four hospitals [The First Affiliated Hospital of Guangxi Medical University (FAHGXMU), the First Affiliated Hospital of Guilin Medical niversity (AHGLMU), Liuzhou Worker’s Hospital (LZWH), and Nanxishan Hospital of Guangxi Zhuang Autonomous Region (NXSHGZAR)], in Guangxi Zhuang Autonomous Region, China. All methods were carried out in accordance with the relevant directives and regulations and the Declaration of Helsinki. This study was approved by the Ethics Committee of the four hospitals mentioned above (Approval numbers: FAHGXMU 2024-K274-01; AHGLMU 2024IITLL-32; LZWH KY2024554; NXSHGZAR NXSYY-2024-157-3).
Inclusion/exclusion criteria
Inclusion criteria
1. Successful induction of PSVT during TE-EPS. 2. Sinus rhythm ECGs with QRS duration < 120 ms. 3. ECG features during PSVT showing narrow QRS complexes (< 120 ms), short RP′ interval (RP′ < P'R interval), ventricular rate > 120 bpm, and atrioventricular conduction ratio of 1:1. 4. Types of PSVT included S-F AVNRT, AVRT-L, and AVRT-R. 5. ECG recordings lasting ≥ 10 seconds during PSVT and sinus rhythm.
ECG data from O-AVRT mediated by either manifest or concealed accessory pathways were included, involving manifest accessory pathways included only those during tachycardia, excluding sinus rhythm ECGs.
Exclusion criteria
1. During tachycardia or sinus rhythm, ECGs with the presence of complete left or right bundle branch block, as well as other conditions leading to abnormally wide QRS complexes. 2. ECGs diagnosed as atrial arrhythmias (e.g., atrial tachycardia, atrial Flutter, and atrial fibrillation) by EPS or experts’ opinion. 3. ECGs with poor signal quality (e.g., excessive noise, missing leads) that prevented reliable interpretation.
Data collection and labeling
Original 13-lead (surface 12-lead and EB lead) ECG signals were collected during PSVT and sinus rhythm episodes, lasting 10 seconds to 10 minutes. Signals over 10 seconds were only sourced from the First Affiliated Hospital of Guangxi Medical University. Data were captured by the DF-5A Cardiac Electric Stimulator (Suzhou Dongfang Electronic Instrument Factory, Suzhou, China) at 500 Hz sampling frequency, 0.05-100 Hz frequency response, 25 mm/s sampling speed, and 10 mm/mv amplitude.
For PSVT ECGs without EPS results, analysis was conducted by seasoned professionals with over 10 years of experience in intracardiac and esophageal electrophysiology. Disagreements were resolved by a third expert. Data from these patients were utilized for the training set only.
ECG signals were classified into four categories: Sinus Rhythm (N), S-F AVNRT (AVNRT), O-AVRT involving the left accessory pathway (AVRT-L), and O-AVRT involving the right accessory pathway (AVRT-R).
Deep learning model construction
Data preprocessing
ECG signals exceeding 10 seconds were divided into 10-second segments without overlap, based on alignment with standard clinical ECG recordings and the need to create independent samples while preserving tachycardia continuity. Data from different leads were merged to form input files. The dataset was split at the patient level into training and test sets, ensuring that all segments from the same patient were assigned exclusively to either set, with no patient overlap (inter-patient scheme), as confirmed by automated verification (Supplementary_PatientSplitVerification). This patient-level split resulted in an approximate 8:2 ratio between the numbers of segments in the training and test sets. Splitting was performed before segmenting long recordings to prevent data leakage.
Model construction
The experimental setup operated on a Windows 10 system, utilizing Python 3.11.9 and the PyTorch framework. The deep learning model employed the ResNet algorithm, 10 effective in feature extraction and classification, demonstrating high accuracy and stability in ECG signal tasks.11,12
The ResNet model used 1-dimensional convolution, consisted of 17 trainable layers (16 convolutional layers and 1 fully connected layer), and processed preprocessed ECG data from synchronous single or multiple leads. Each 10-second ECG segment contained 5000 data points due to a sampling frequency of 500 Hz. Thus, for model input, the data were organized as arrays of shape (5000, number of leads) — for example, (5000, 1) for single-lead inputs and (5000, 13) for 13-lead inputs.
The model was trained with a batch size of 60 for up to 200 epochs. A validation set (2% of the training data) was used for hyperparameter tuning and early stopping to prevent overfitting. Early stopping with a patience of 11 epochs was applied based on validation loss, and the model with the lowest validation loss was selected as the final model. Additionally, the learning rate was reduced by a factor of 0.1 when the validation loss plateaued for 10 consecutive epochs, with a minimum learning rate of 0.00002. The test set was used only once for final evaluation, ensuring unbiased performance estimates. Dropout rate was set to 0.2, and the random seed was fixed at 0 to ensure reproducibility. To preserve the natural clinical distribution of PSVT subtypes, no data augmentation or class balancing techniques (e.g., oversampling, class weighting) were applied. The architecture consisted of an initial Conv1D layer (kernel size = 16) with batch normalization and ReLU activation, followed by five residual blocks. Each residual block contained two main-branch convolutional layers (kernel size = 16), with an additional 1×1 Conv1D projection in the shortcut branch. Batch normalization and ReLU activation were applied within each residual block. Dropout (rate = 0.2) was applied after each batch normalization and ReLU activation, both within and after each residual block, to prevent overfitting. All convolutional layer weights were initialized using He normal initialization. The output was then flattened and passed through a fully connected dense layer for classification. The model was optimized using Adam with a learning rate of 0.002 and cross-entropy loss. The overall structure is illustrated in Figure 1. The ResNet deep learning model developed in our study.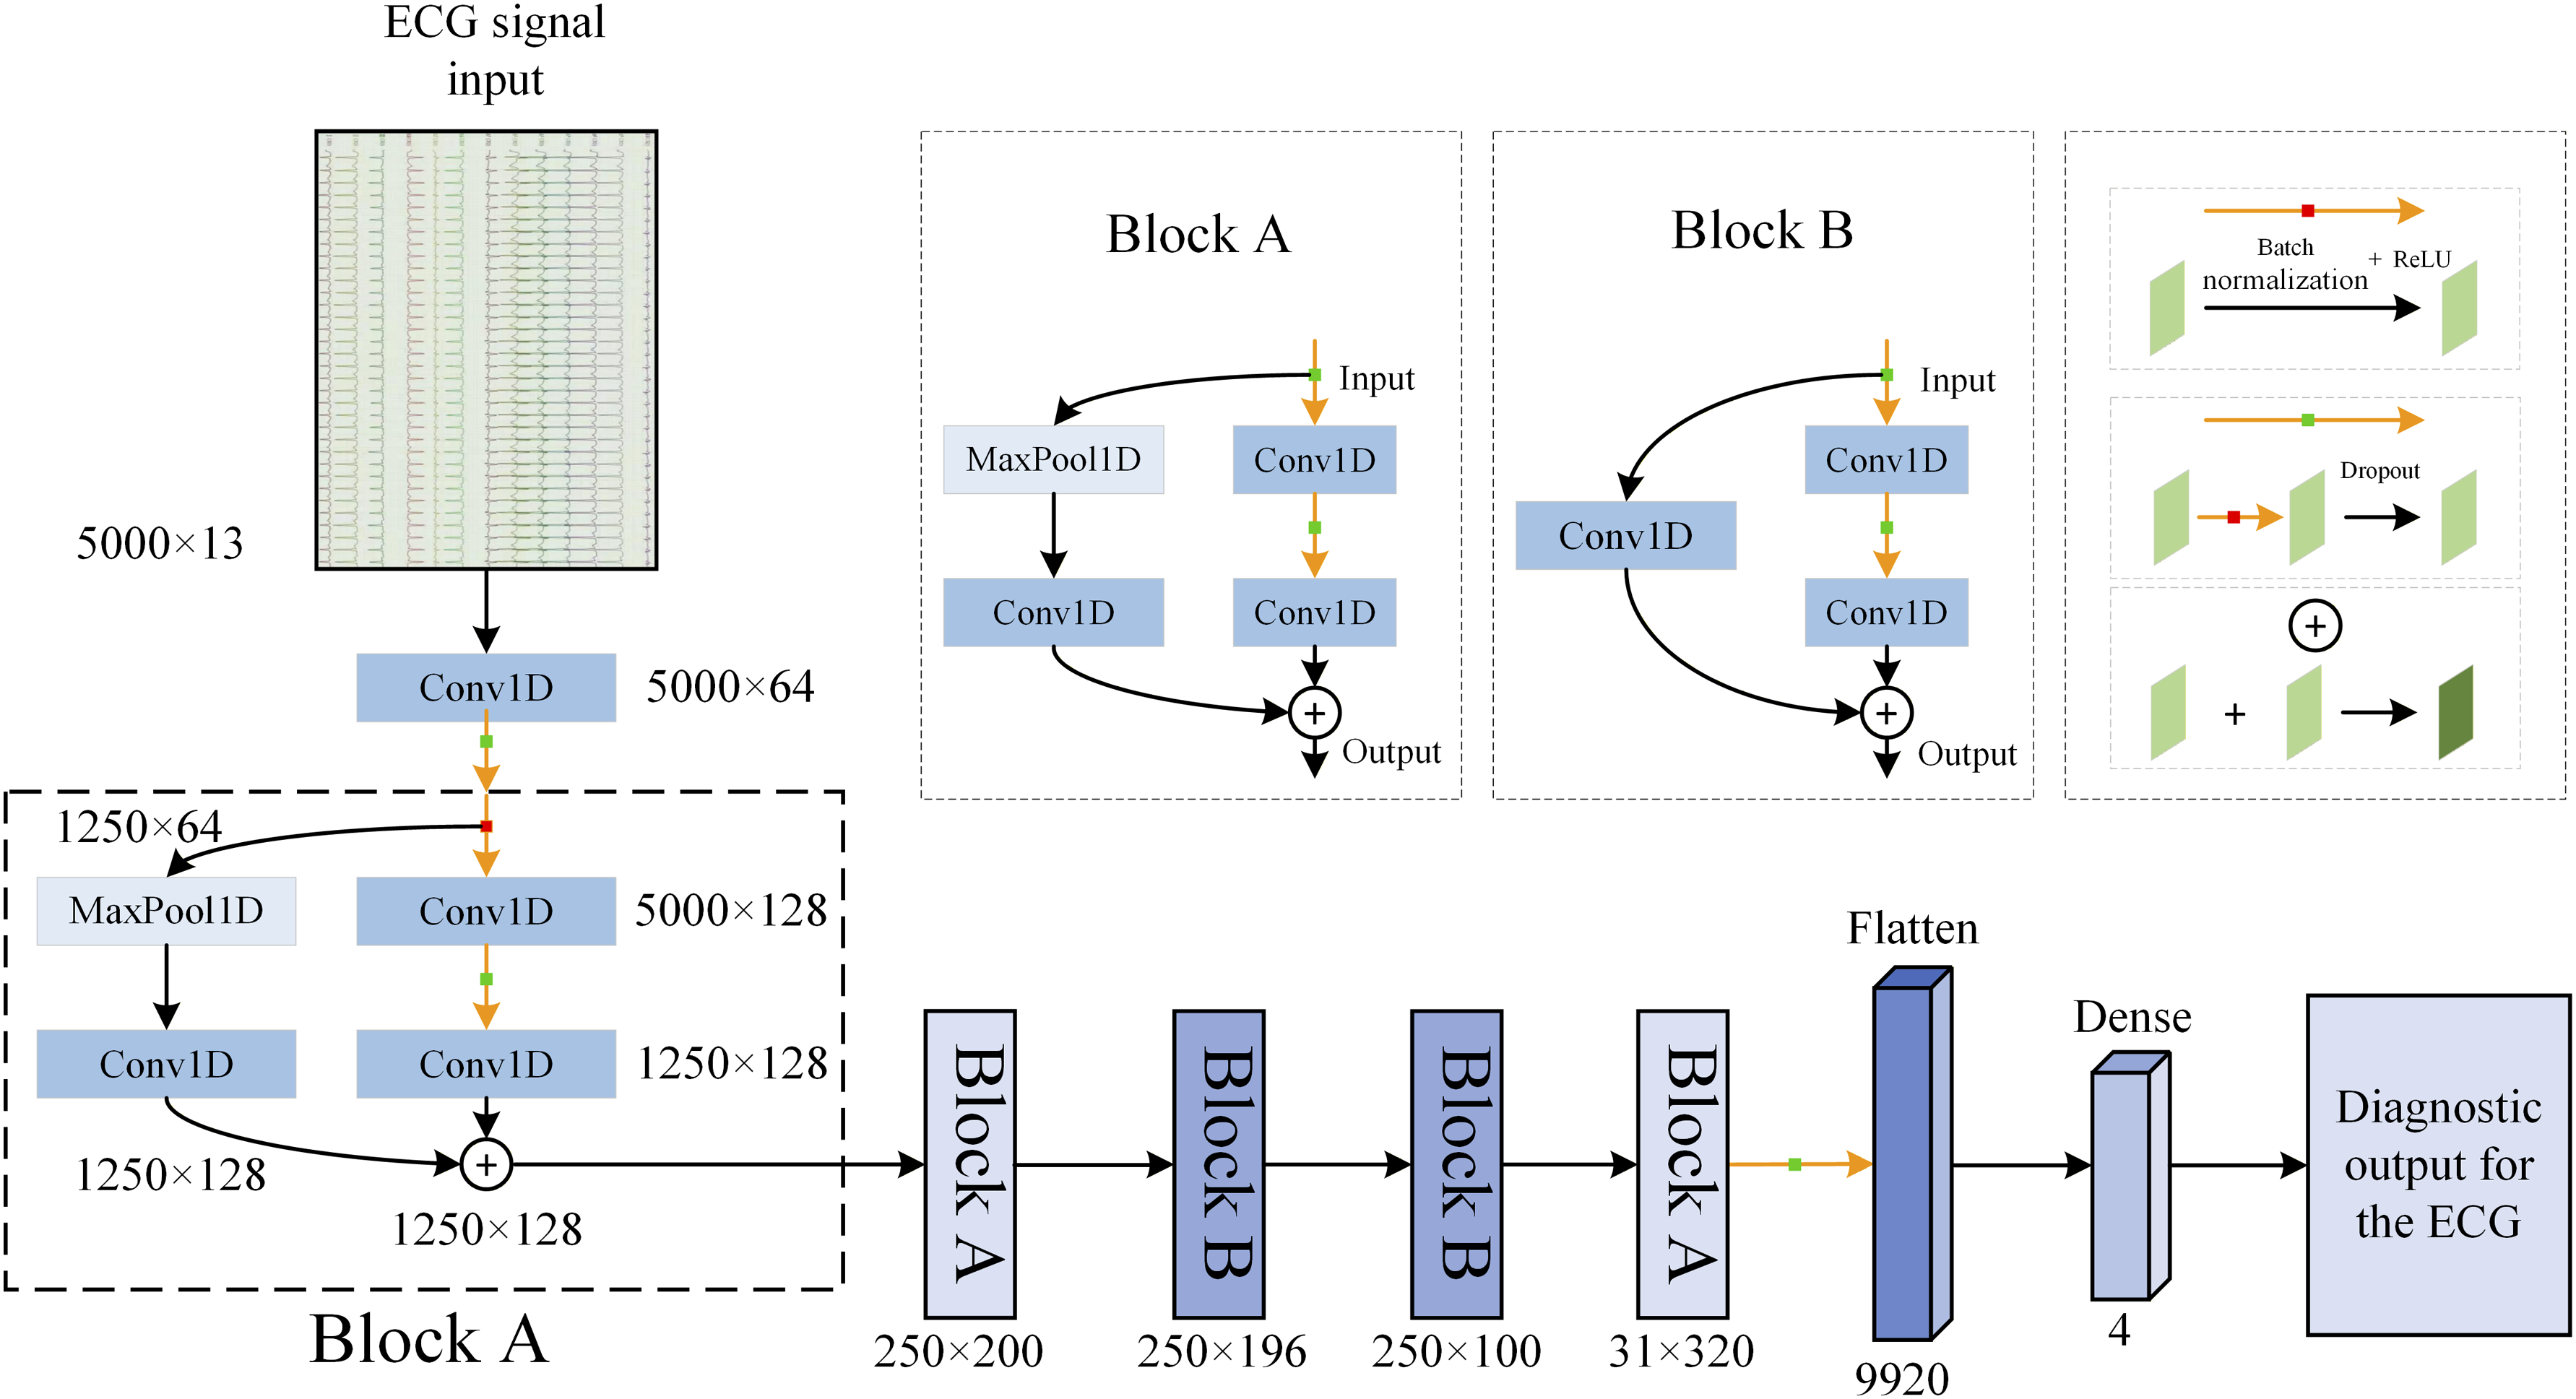
To benchmark our deep learning approach against traditional methods, we implemented RF and XGBoost classifiers on a subset of lead configurations identified as diagnostically promising in the ResNet analysis and clinically relevant. For each 10-second ECG segment, time-domain and frequency-domain features were extracted from all 13 leads.
Lead selection for input data
Based on previous reports and our practical experience,7–9 we choose the input ECG data from the following surface and EB lead combinations for ResNet training: II+V1, II+V1+EB, aVF, aVF+EB, II+V1+aVF, II+V1+aVF+EB, EB-only, 12 surface leads, and 12 surface leads+EB. Surface and EB lead ECG for patients with AVNRT, AVRT-R, and AVRT-L are shown in Figure 2. The surface and esophageal ECGs in patients with AVNRT, AVRT-L, and AVRT-R
Evaluation metrics
For all models (ResNet, Random Forest, and XGBoost), performance was evaluated using accuracy (ACC) and by plotting receiver operating characteristic (ROC) curves, with the area under the curve (AUC) calculated. Metrics such as sensitivity (SEN), specificity (SPE), positive predictive value (PPV), negative predictive value (NPV), and F1-score were also calculated to evaluate the model’s performance in the classification tasks. For multiclass classification, the reported single AUC values were calculated using the micro-averaged method via ‘
Statistical analysis
To compare the performance across different ECG lead configurations, we applied a bootstrap resampling method with 2000 iterations to statistically analyze differences in ACC and AUC. The Benjamini-Hochberg correction was used to adjust the resulting P-values for multiple comparisons. Differences with adjusted P-values < 0.05 were considered statistically significant. Additionally, for AUC, 95% confidence intervals were obtained by bootstrap resampling with 2000 iterations. For ACC, SEN, SPE, PPV, NPV, and F1-score, 95% CIs were calculated using the Wilson score method for binomial proportions.
Result
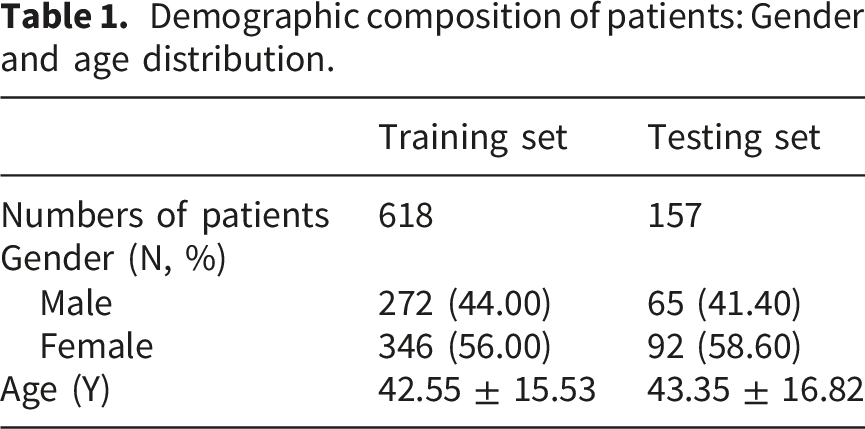
We retrospectively reviewed ECG data from a total of 1,020 cases involving 877 patients from the four mentioned hospitals. Data included both PSVT and sinus rhythm ECG signals. A total of 102 patients were excluded due to non-compliance with inclusion criteria: 33 for noise and missing leads, 51 for PSVT episodes under 10 seconds, 6 diagnosed with atypical atrioventricular nodal re-entrant tachycardia, and 12 diagnosed with atrial tachycardia via EPS. Ultimately, the analysis encompassed ECG data from 775 patients across 921 cases. Of these, 737 cases were confirmed by EPS, and the remaining 184 cases without intracardiac EPS were diagnosed by expert adjudication based on surface ECG and TE-EPS findings (detailed distribution in Supplemental Table 1). The dataset included 360 cases of N ECG, 329 cases of AVNRT ECG, and 232 cases of O-AVRT ECG. Within the O-AVRT ECG group, there were 169 cases of AVRT-L and 63 cases of AVRT-R. These patients generated a total of 2285 N segments, 2282 AVNRT segments, and 1694 AVRT segments (including 1048 AVRT-L segments and 646 AVRT-R segments, as depicted in Figure 3 and Table 1. The dataset shows class imbalance (e.g., AVRT-R accounts for only 6.8% of cases and 10.3% of segments). Detailed data on the training and testing sets are presented in Supplemental Tables 2 and 3, respectively. Diagram of study electrocardiogram (ECG) datasets PSVT = paroxysmal supraventricular tachycardia, N = sinus rhythm, AVNRT = slow-fast atrioventricular nodal re-entrant tachycardia, AVRT-L = orthodromic atrioventricular re-entrant tachycardia with left-sided accessory pathways, AVRT-R = orthodromic atrioventricular re-entrant tachycardia with right-sided accessory pathways. Demographic composition of patients: Gender and age distribution.
Model performance evaluation
ResNet performance
The ResNet model’s efficacy was evaluated using ECG signals derived from the aforementioned leads. The analytical results, illustrated in Figure 4 and detailed in Table 2, reveal several critical insights: ROC curve analysis of the ResNet model for diagnosing paroxysmal supraventricular tachycardia using various ECG lead inputs N = sinus rhythm, AVNRT = slow-fast atrioventricular nodal re-entrant tachycardia, AVRT-L = orthodromic atrioventricular re-entrant tachycardia with left-sided accessory pathways, AVRT-R = orthodromic atrioventricular re-entrant tachycardia with right-sided accessory pathways. (a) Leads II and V1 as inputs; (b) Leads II, V1+EB as inputs; (c) Lead aVF as input; (d) Leads aVF+EB as inputs; (e) Leads II, V1, and aVF as inputs; (f) Leads II, V1, aVF+EB as inputs; (g) The 12 surface leads as input; (h) The 12-lead surface ECG +EB inputs; (i) The EB lead as input. Classification accuracy and AUC values for various ECG lead configurations. EB = Bipolar Esophageal lead, ACC = accuracy, AUC = area under the curve, CI = Confidence interval. *P < 0.05 when compared to EB lead configuration. CI for accuracy: Wilson score method; CI for AUC: percentile bootstrap (2000 resamples).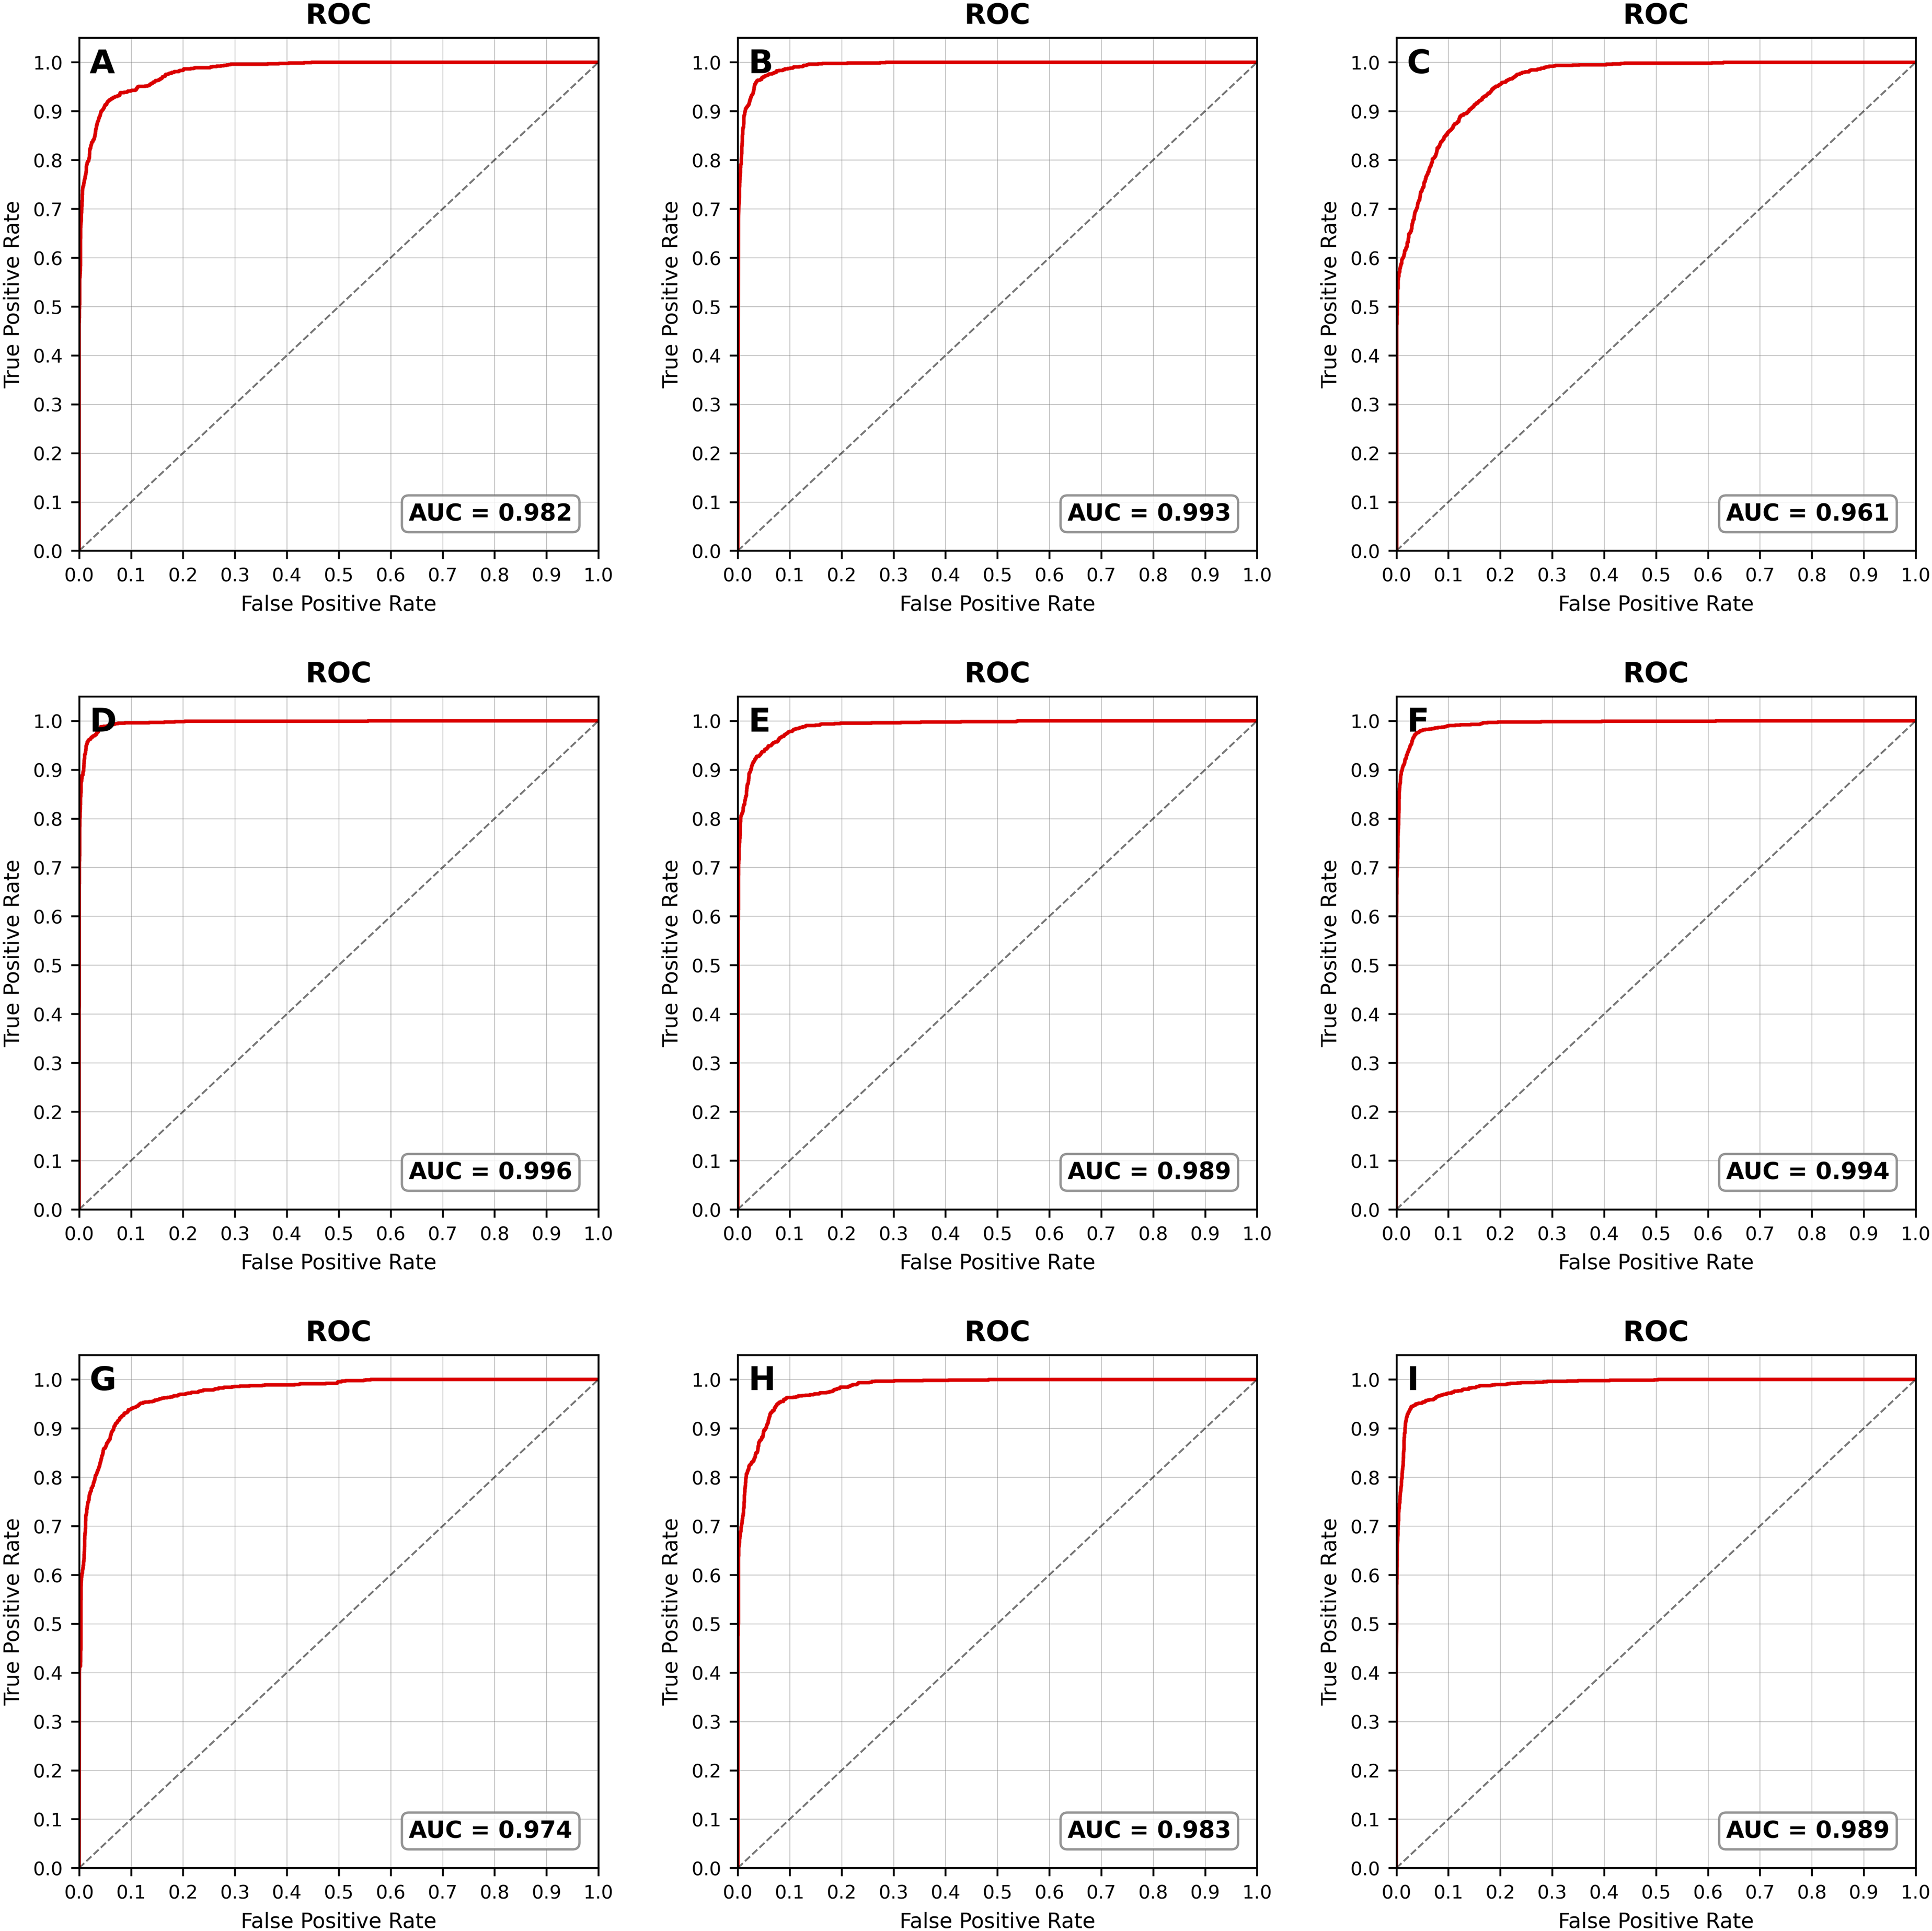

Performance of surface lead combinations
Among surface-only leads, the three-lead combination II+V1+aVF achieved the highest ACC (91.23%) and AUC (0.989), significantly outperforming all other surface-only configurations (P < 0.05 for all comparisons). The two-lead combination II+V1 followed with an ACC of 88.52% and AUC of 0.982. Its ACC was not significantly different from that of the 12-lead setup (85.81%, P > 0.05), while its AUC was significantly higher than that of the 12-lead ECG (0.974, P < 0.05).
The aVF lead alone demonstrated remarkable efficiency, with an AUC of 0.961. It exhibited high SPE and NPV for AVNRT, AVRT-L, and AVRT-R (> 0.80).
Enhancements with EB lead integration
Combining surface leads with the EB lead as inputs generally enhanced both ACC and AUC values across multiple combinations. For ACC, significant improvements were observed for II+V1 and aVF (P < 0.05), whereas the increases for II+V1+aVF and 12-lead did not reach statistical significance (P > 0.05). Regarding the AUC values, all comparisons indicated statistical differences (P < 0.05).
Performance of EB-containing lead configurations
The esophageal lead (EB) alone achieved an ACC of 92.98% (95% CI 91.47–94.34%) and an AUC of 0.989 (95% CI 0.986–0.992). Both ACC and AUC were significantly higher than those of all surface-only leads except for the II+V1+aVF combination (P > 0.05).
The combination aVF+EB achieved the highest overall performance (ACC 95.37%, AUC 0.996, 95% CI 0.995–0.998). Its AUC was significantly higher than all other configurations (P < 0.05), except II+V1+aVF+EB (P > 0.05). Its ACC was significantly higher than all other configurations (P < 0.05), except II+V1+aVF+EB configuration (P > 0.05).
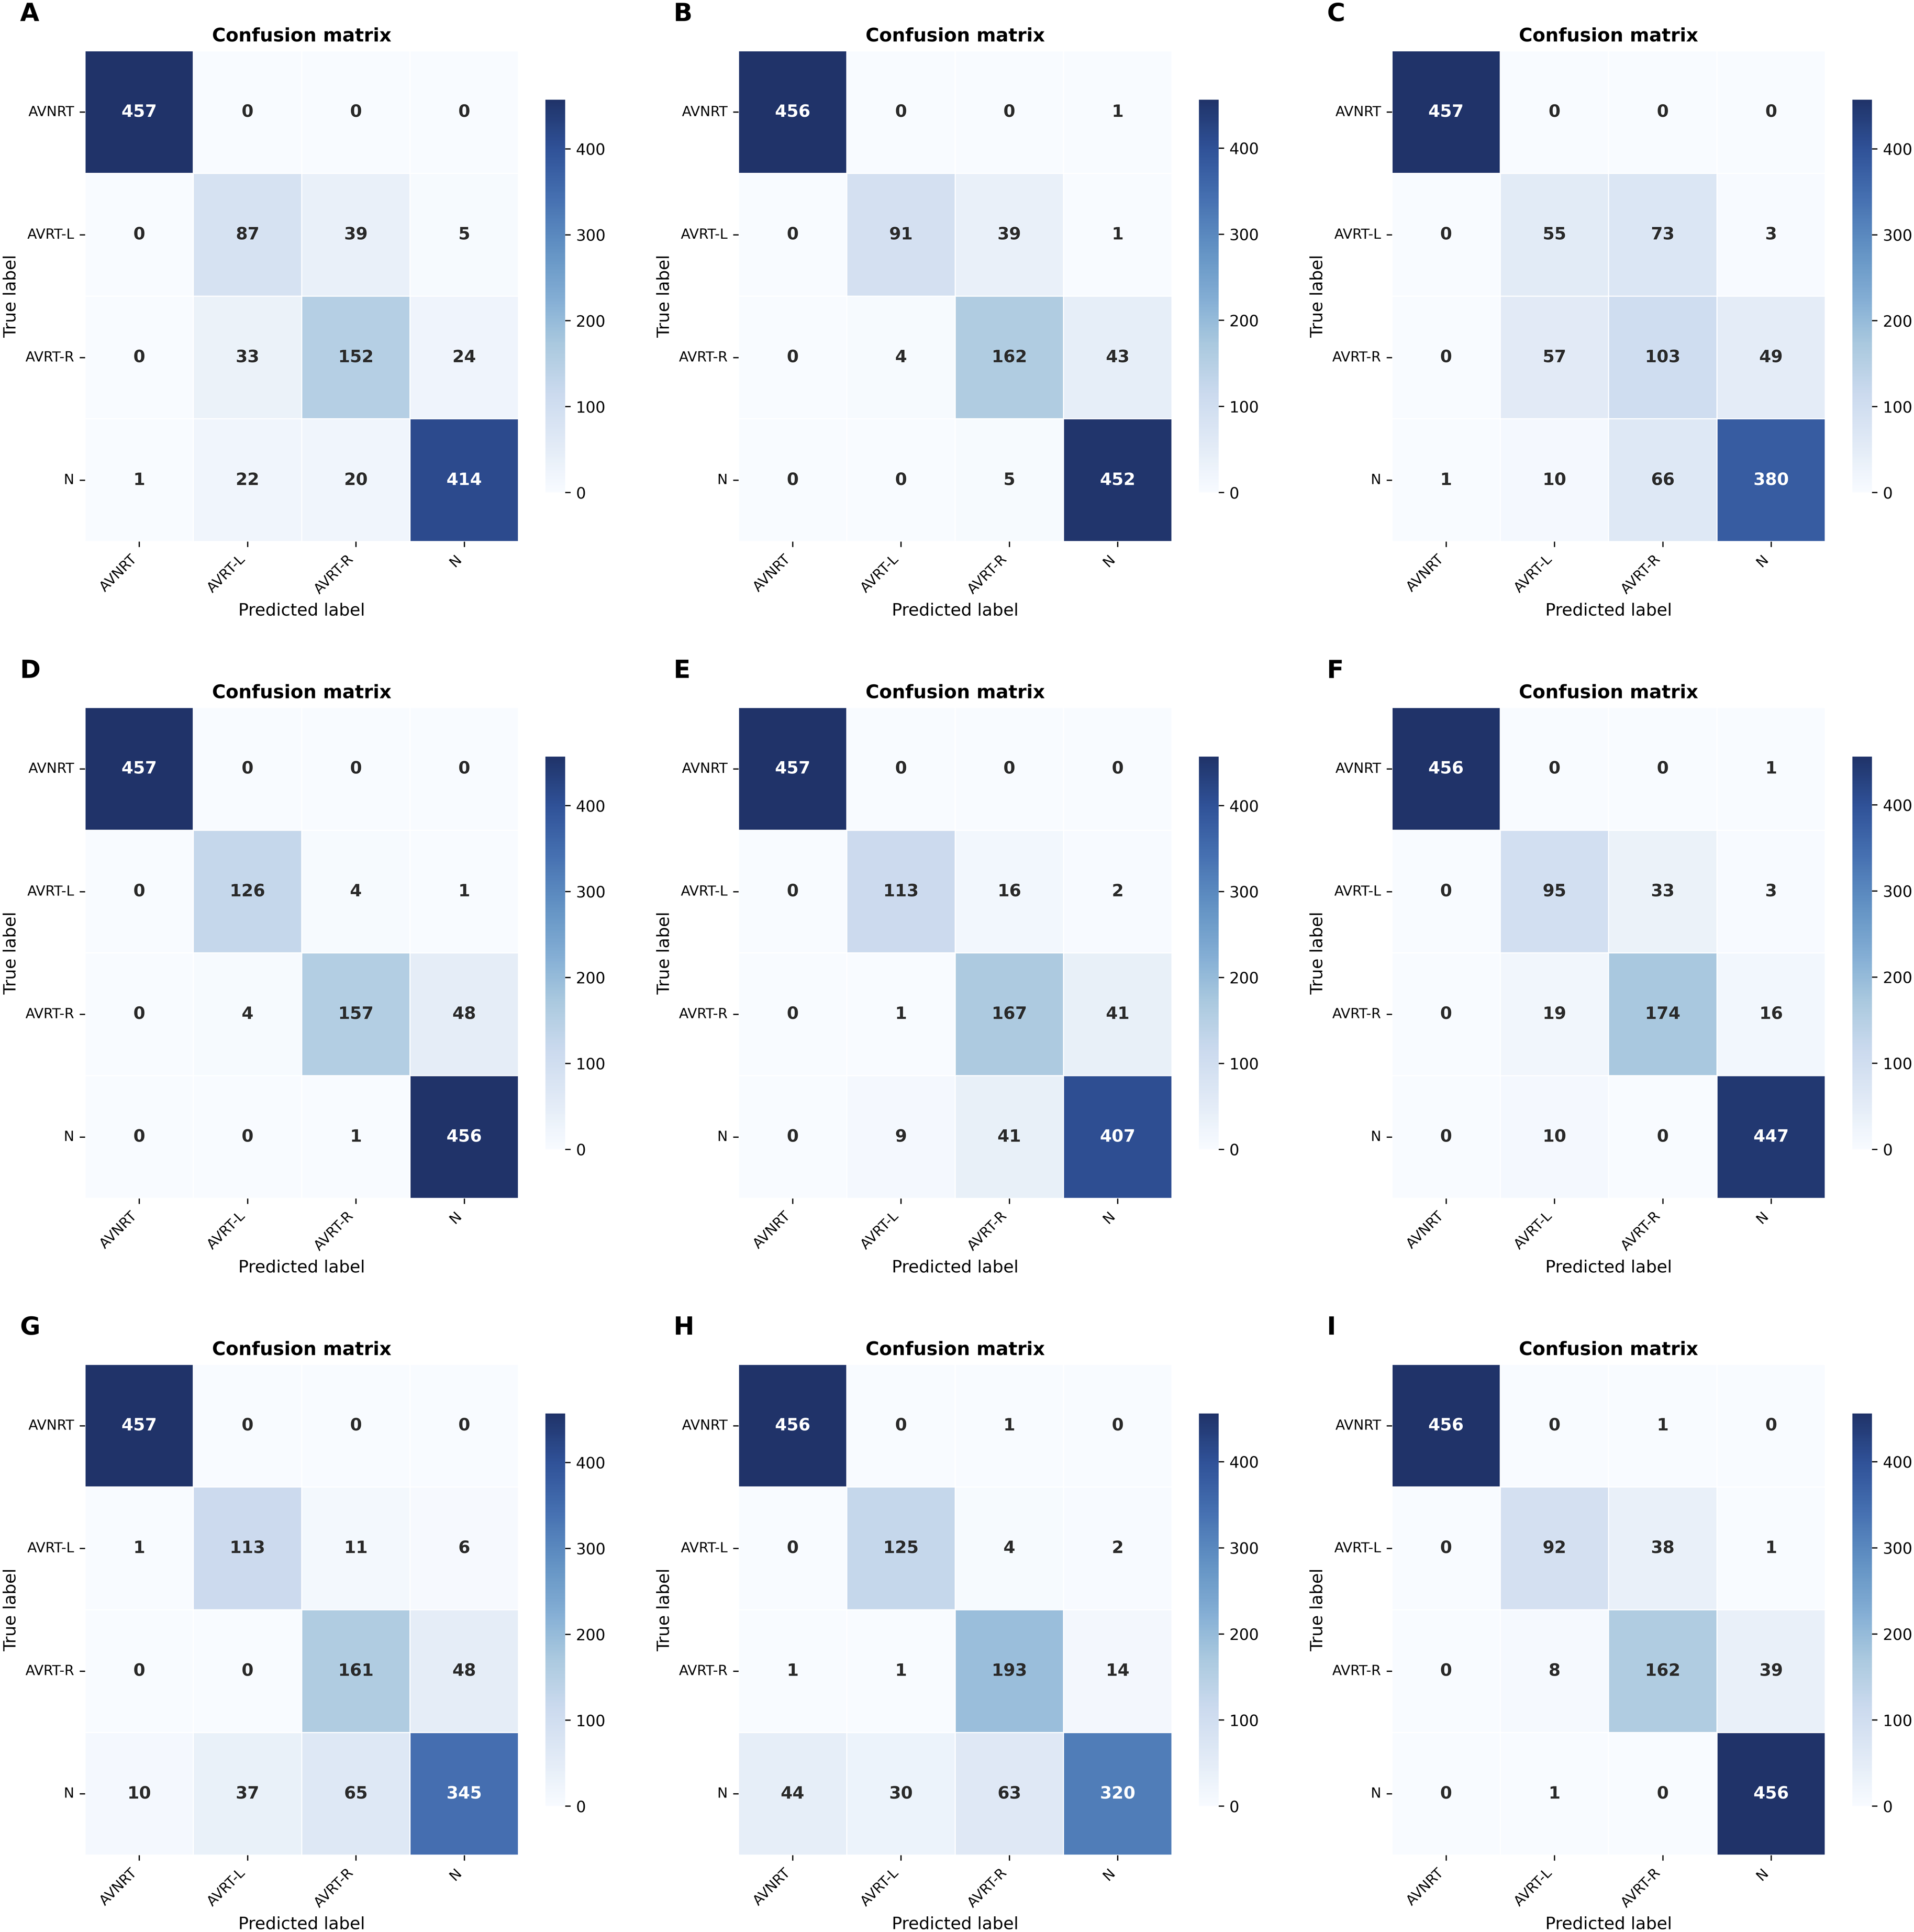
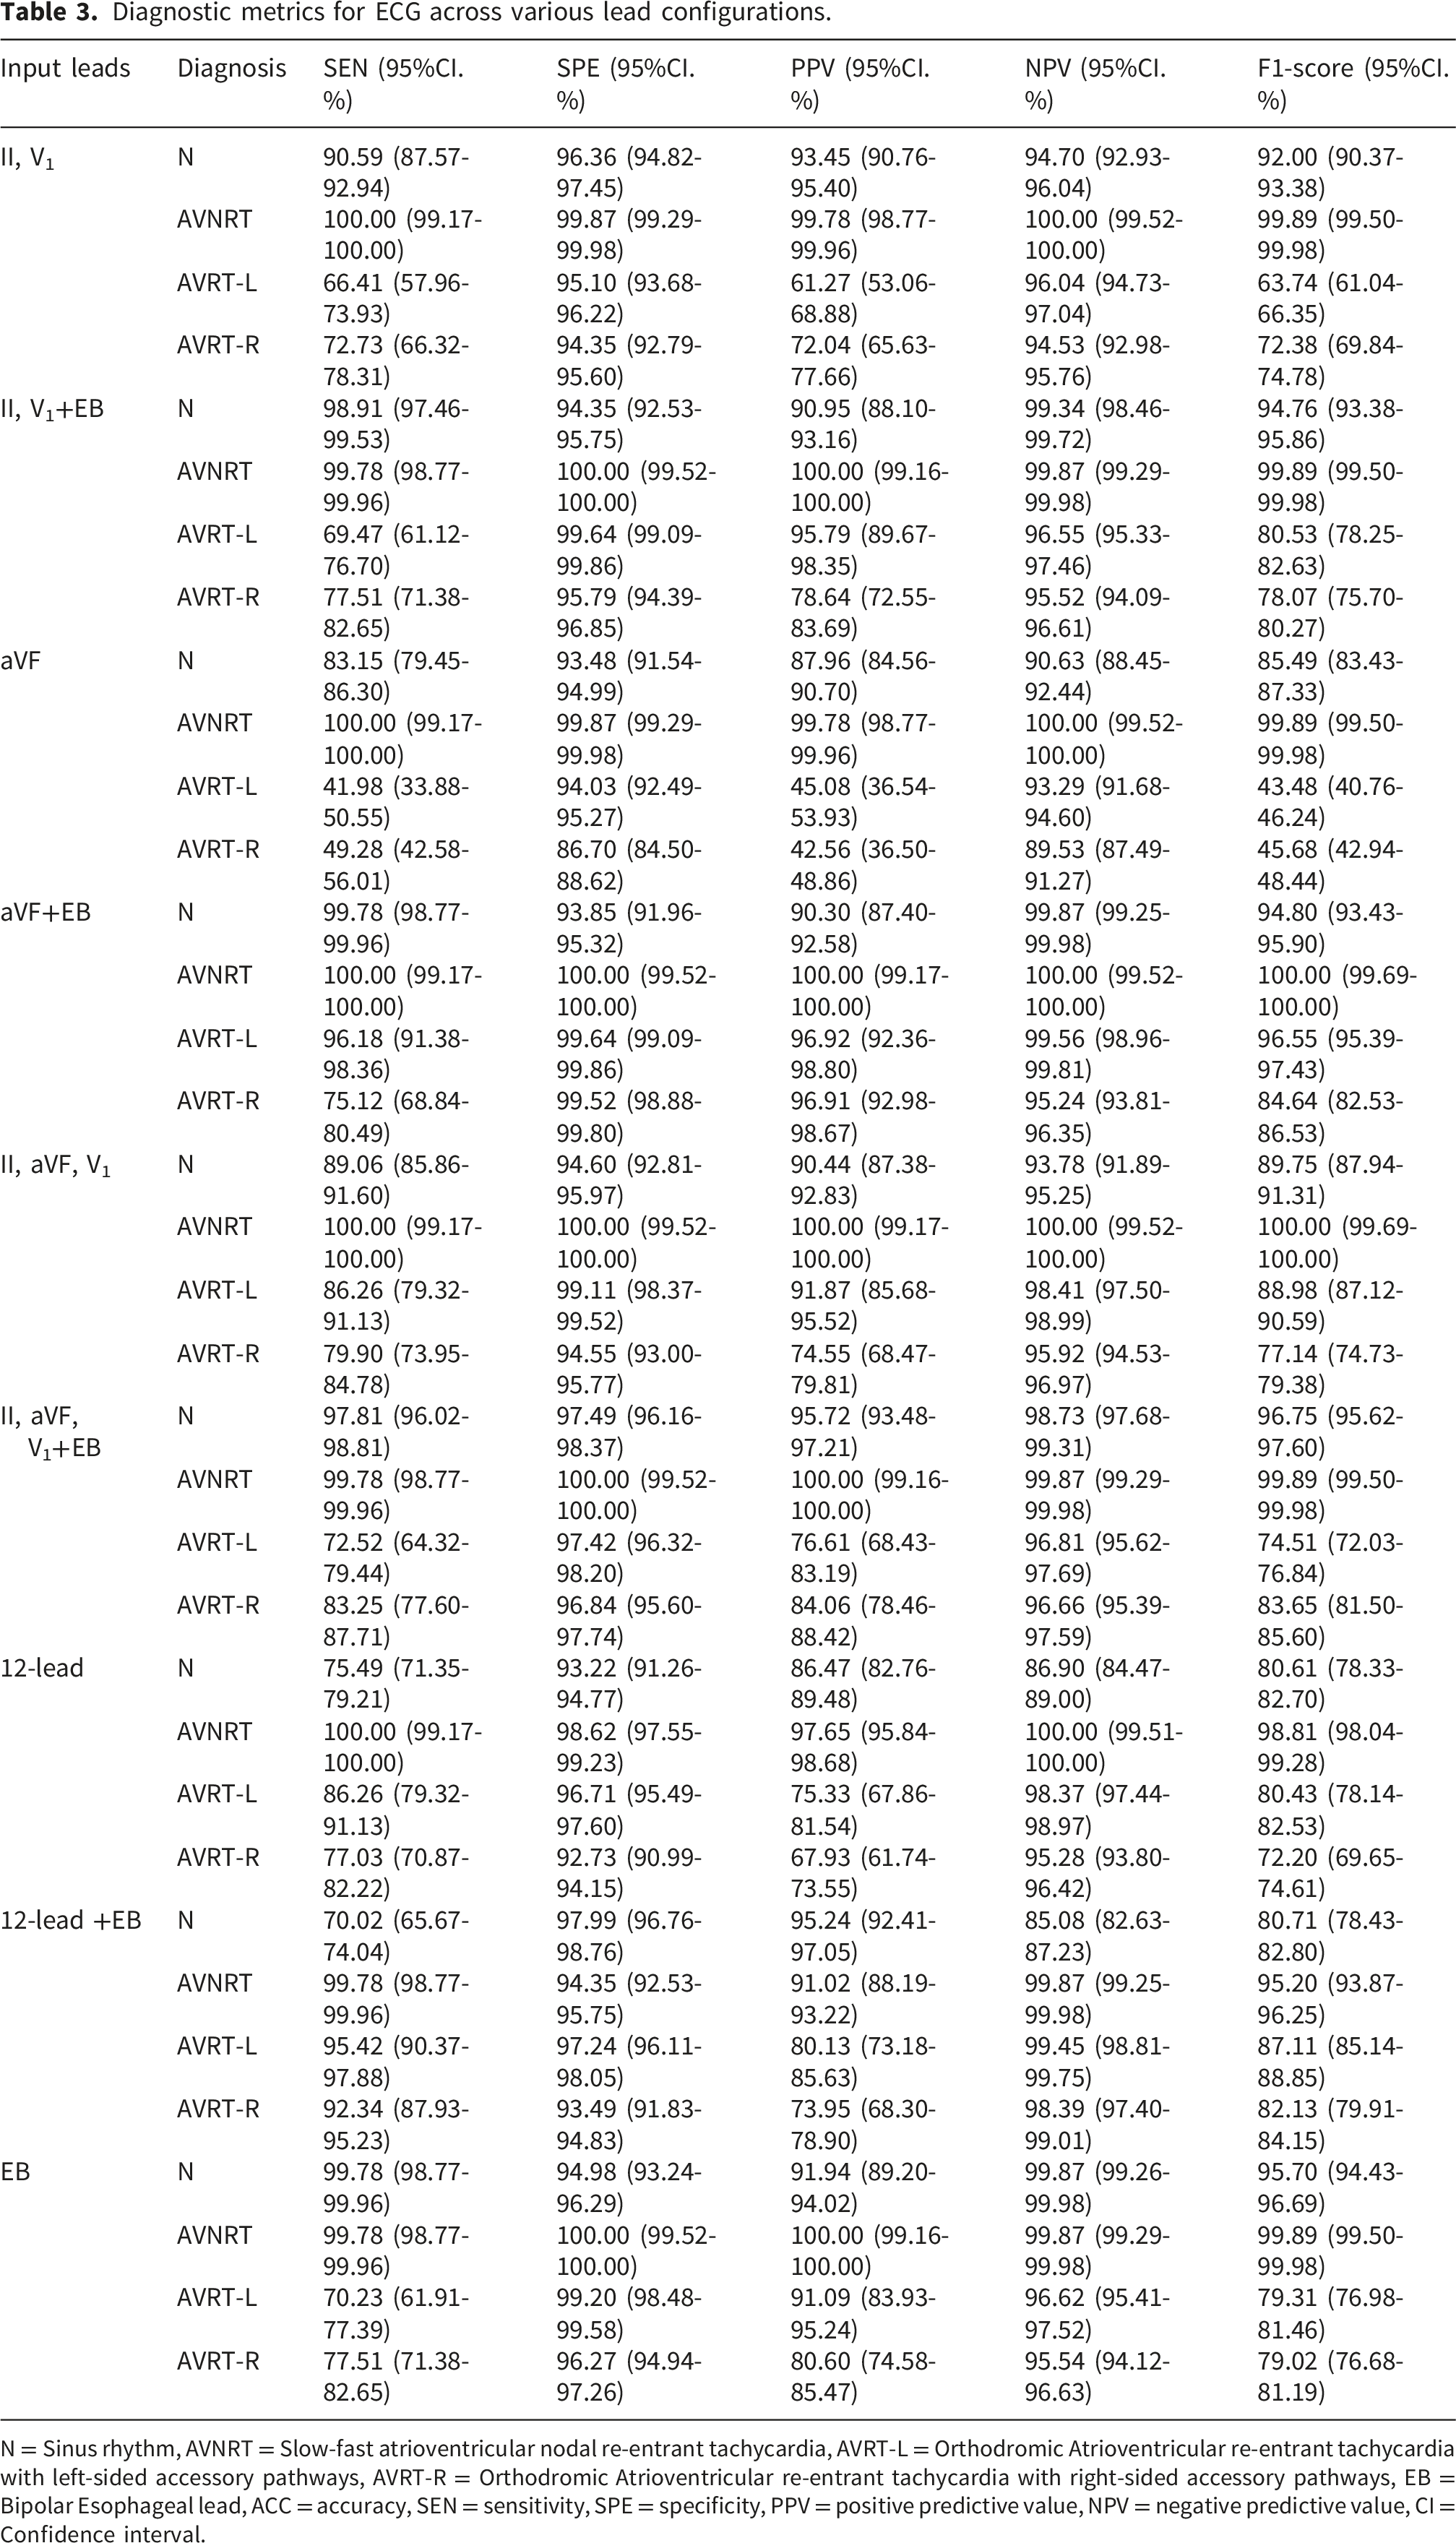
Figure 5 presents the confusion matrices for the 1. 2. 3. Confusion matrix analysis of diagnostic performance of the models using aforementioned leads as inputs N = Sinus rhythm, AVNRT = Slow-fast atrioventricular nodal re-entrant tachycardia, AVRT-L = orthodromic atrioventricular re-entrant tachycardia with left-sided accessory pathways, AVRT-R = orthodromic atrioventricular re-entrant tachycardia with right-sided accessory pathways, (a) Leads II and V1 as inputs; (b) Leads II, V1+EB as inputs; (c) Lead aVF as input; (d) Leads aVF+EB as inputs; (e) Leads II, V1, and aVF as inputs; (f) Leads II, V1, aVF+EB as inputs; (g) The 12 surface leads as input; (h) The 12-lead surface ECG +EB inputs; (i) The EB lead as input. Diagnostic metrics for ECG across various lead configurations. N = Sinus rhythm, AVNRT = Slow-fast atrioventricular nodal re-entrant tachycardia, AVRT-L = Orthodromic Atrioventricular re-entrant tachycardia with left-sided accessory pathways, AVRT-R = Orthodromic Atrioventricular re-entrant tachycardia with right-sided accessory pathways, EB = Bipolar Esophageal lead, ACC = accuracy, SEN = sensitivity, SPE = specificity, PPV = positive predictive value, NPV = negative predictive value, CI = Confidence interval.
Comparison with classical machine learning models
We evaluated RF and XGBoost on the same four representative lead configurations identified in the ResNet analysis: EB alone, aVF+EB, 12-lead, and 13-lead. Detailed descriptions of feature extraction, hyperparameter optimization, and final model parameters are provided in Supplemental Tables 4-6. As summarized in Supplemental Table 7, ResNet significantly outperformed both RF and XGBoost across all configurations in terms of overall ACC and AUC (all P < 0.001). Detailed per-class diagnostic metrics for RF and XGBoost are provided in Supplemental Tables 8 and 9, respectively, further confirming the overall superiority of ResNet, and its advantages for the challenging AVRT-L and AVRT-R subtypes, particularly in terms of SEN.
Discussion
Current manual methods for AVRT-L/R differentiation by surface ECGs primarily based on the direction of retrograde P′ waves. 13 Esophageal lead in conjunction with V1 lead can improve the localization and diagnosis of accessory pathways. For patients with suspected O-AVRT, a left-sided pathway is indicated by an inverted P′ wave in lead I, an upright P' wave in V1, and an earlier P′ wave in the esophageal lead. Conversely, in AVRT-R the characteristics are opposite. However, diagnosis is challenged by ambiguous P' waves and similar RP' intervals in surface/EB leads. Identifying S-F AVNRT and O-AVRT is further complicated by complex electrical activity and signal overlap, such as obscuring distinct ECG features like pseudo s' and pseudo r' waves, thus highlighting the need for advanced ECG algorithm.
In this study, we innovatively utilized an array of surface ECG leads and esophageal leads as input data for a ResNet model, to automatically diagnose signals from three types of PSVT. The results indicated robust performance, as evidenced by AUC values exceeding 0.90, confirming high accuracy in PSVT diagnosis. Therefore, the model is designed as a real-time assistive tool during TE-EPS to aid electrophysiologists in PSVT subtype differentiation. By automating the manual interpretation of induced arrhythmias, it has the potential to improve diagnostic accuracy, reduce inter-observer variability, and shorten the learning curve for less experienced physicians.
Most ECG classification studies by deep learning concentrated on utilizing single or specific lead combinations.8,9 Our study introduces a novel approach using diverse lead combinations to enhance diagnostic efficacy by exploiting information complementarity. Previous studies applied 12-lead ECG signals for deep learning classification, including the differentiation of PSVT, achieving considerable performance. In our study, the three-lead combination II+V1+aVF achieved the highest surface-only performance (AUC 0.989). The 12-lead setup also performed well (AUC 0.974). Our models displayed balanced diagnostic metrics—SEN, SPE, and F1-Score—across tachycardia types, indicating their ability to capture multi-directional electrical activity, thereby providing a more comprehensive reflection of the overall cardiac conditions.
Furthermore, the diagnostic capabilities of the aVF lead deserve special attention among surface lead combinations. With a single lead, aVF achieved an AUC of 0.961, closely approaching the performance of the full 12-lead ECG (0.974). Notably, high SPE and NPV for AVNRT, AVRT-L, and AVRT-R (> 0.80), indicating its proficiency in identifying distinctive ECG features critical for differentiating between these PSVT. As discussed above, the inferior leads (II, aVF) identify pseudo s' waves in S-F AVNRT, while the V1 lead captures pseudo r' waves and, for O-AVRT, the upright P' wave is a marker of AVRT-L.14–16 Integrating these classic electrocardiographic signs, this three-lead combination achieved perfect metrics for AVNRT, with all diagnostic metrics reaching 100%. This synergy may explain why this configuration excels in detecting AVNRT. In contrast, the aVF lead alone showed moderate performance for the challenging AVRT-L and AVRT-R subtypes (Table 3). Traditionally, aVF lead has been applied to discern anterior/posterior pathways, but its effectiveness in distinguishing left/right accessory pathways requires further study. Future studies should, therefore, delve into the potential of aVF in accurately localizing these pathways, building upon these promising findings.
In this study, integrating surface leads with esophageal ECG significantly enhanced diagnostic efficacy, corroborating clinical practice. The aVF+EB and EB-only models achieved excellent diagnostic performance (ACC: 95.37%,
Adding EB to the full 12-lead ECG resulted in a modest AUC improvement (0.974 vs. 0.983, P < 0.05) but no significant change in ACC (85.81% vs. 87.24%). This limited gain contrasts sharply with the aVF+EB combination, which achieved comparable AUC to the four-lead combination II+V1+aVF+EB (P > 0.05) using only two leads. These findings illustrate that once the essential leads (e.g., EB and aVF) are included, adding more leads introduces redundant information without improving diagnostic performance. Therefore, EB alone or with a single surface lead provides the most efficient diagnostic information, avoiding the redundancy inherent in multi-lead configurations.
In summary, EB-only data streamlines the diagnostic process and increases diagnostic efficiency, offering new insights into PSVT’s differential diagnosis via transesophageal ECG, although its sensitivity for AVRT-L and AVRT-R remains an area for improvement (Figure 5(i)). Together with the aVF+EB findings, these results further support the clinical utility of combining a single surface lead with esophageal ECG, consistent with the conclusion that the most efficient diagnostic information comes from a minimal set of leads.
This finding can be attributed to the inherent strengths of deep learning. Deep learning is particularly suited to the present task of PSVT subtype differentiation because it can learn complex, non-linear patterns directly from raw signals without imposing strong distributional assumptions. Our ResNet model consistently outperformed RF and XGBoost across the four representative lead configurations, with marked improvements in SEN for the challenging AVRT-L and AVRT-R subtypes. These results provide empirical evidence that deep learning effectively captures the subtle temporal features essential for differentiating these arrhythmias, further justifying its application in this domain.
Despite their lower overall performance, the patterns observed in traditional models aligned with these findings. Among traditional models, XGBoost achieved the highest performance and was selected for feature importance analysis (Supplemental Figure 1). Although XGBoost relies on handcrafted features while ResNet learns directly from raw signals, their patterns showed strong consistency. In XGBoost, ‘
We acknowledge that the inclusion of expert-adjudicated cases may introduce label noise. However, these cases were used only for training, and the test set consisted solely of EPS-confirmed cases, ensuring unbiased evaluation. Another limitation is the imbalanced data distribution across centers—with longer recordings predominantly from one center (FAHGXMU)—which precluded formal site-held-out validation. Future external validation through multi-center studies with balanced data collection is needed to assess generalizability. A prospective clinician-vs-AI comparison study is also needed to further validate clinical utility.
To optimize our model training, we propose the following strategies: Firstly, data augmentation with Generative Adversarial Networks (GANs) could be implemented to enrich our dataset and address imbalances among various ECG signal types,17,18 with the aim of boosting diagnostic accuracy. Secondly, we will enhance model interpretability through methods such as SHAP (SHapley Additive exPlanations), 19 enabling a deeper understanding of decision-making processes and identification of critical predictive factors, thereby increasing transparency and reliability.
Conclusion
Our study developed a deep learning algorithm that utilizes both surface and esophageal ECG data to accurately differentiate between various PSVT types, including S-F AVNRT, AVRT-L, and AVRT-R. This algorithm demonstrated high diagnostic accuracy and presents significant potential for integration into clinical ECG-assisted diagnostic procedures. Furthermore, compared to surface ECG signals, models based on esophageal ECG data showed superior diagnostic efficacy in automatically identifying PSVT, establishing themselves as efficient and precise tools for adjunctive diagnosis.
Supplemental material
Supplemental material - A deep learning model based on combining surface and esophageal ECG data for diagnosis of paroxysmal supraventricular tachycardia
Supplemental material for A deep learning model based on combining surface and esophageal ECG data for diagnosis of paroxysmal supraventricular tachycardia by Shuo Li, Bin Fu, Hui Chi, Liuping He, Lian Zeng, Anran Zhu, Yanqun Hou, Hongbin Pan, Tao He, Guoqiang Zhong in DIGITAL HEALTH
Footnotes
Acknowledgments
The authors sincerely appreciate Dr. Kui Wu (Department of Cardiology, The First People’s Hospital of Qinzhou) for her critical review and constructive suggestions on the manuscript. We also extend our gratitude to all participants for their involvement in the study.
Ethical considerations
This study was conducted in accordance with the Declaration of Helsinki and relevant guidelines. Ethical approval was obtained for the retrospective analysis of fully anonymized ECG data from all four participating hospitals: The First Affiliated Hospital of Guangxi Medical University (Approval No. 2024-K274-01), the Affiliated Hospital of Guilin Medical University (Approval No. 2024IITLL-32), Liuzhou Worker’s Hospital (Approval No. KY2024554), and Nanxishan Hospital of Guangxi Zhuang Autonomous Region (Approval No. NXSYY-2024-157-3). The Institutional Review Board of The First Affiliated Hospital of Guangxi Medical University acted as the central ethics committee. All four committees granted a waiver of informed consent due to the retrospective design and the use of de-identified data.
Author contributions
Funding
The authors received no financial support for the research, authorship, and/or publication of this article.
Declaration of conflicting interests
The authors declared no potential conflicts of interest with respect to the research, authorship, and/or publication of this article.
Data Availability Statement
The code and de-identified data supporting the findings of this study are available from the corresponding author upon reasonable request.
Study protocol
Supplemental material
Supplemental material for this article is available online.
References
Supplementary Material
Please find the following supplemental material available below.
For Open Access articles published under a Creative Commons License, all supplemental material carries the same license as the article it is associated with.
For non-Open Access articles published, all supplemental material carries a non-exclusive license, and permission requests for re-use of supplemental material or any part of supplemental material shall be sent directly to the copyright owner as specified in the copyright notice associated with the article.