
Abstract
Background
Hospitalized individuals with human immunodeficiency virus (HIV) remain at high risk of in-hospital mortality despite advances in combination antiretroviral therapy. Accurate and interpretable prediction tools are needed to support timely risk stratification and clinical decision-making.
Methods
We conducted a retrospective cohort study of 2015 adults with HIV admitted to the AIDS ward of a tertiary hospital in southeastern China between 2010 and 2021. Clinical and laboratory data at admission were used to develop machine learning models predicting in-hospital mortality. Eleven algorithms were compared using area under the receiver operating characteristic curve (AUC), precision-recall curve, and decision curve analysis. Model interpretability was achieved using Shapley Additive exPlanations (SHAP). To enhance usability, we reduced predictors through SHAP-guided selection and deployed the final model as an interactive web application.
Results
Among 2015 patients, 293 (14.54%) died during hospitalization. The Light Gradient Boosting Machine model demonstrated the best performance (AUC = 0.9008). A simplified model incorporating five admission variables, cancer antigen 125, direct bilirubin, white blood cell count, C-reactive protein, and age, achieved comparable accuracy (AUC = 0.9008). SHAP analysis provided transparent explanations at both the population and individual levels. The final model was implemented as a user-friendly online tool for individualized risk estimation.
Conclusions
We developed and validated an interpretable machine learning model that accurately predicts in-hospital mortality among patients with HIV using five readily available clinical features. This approach enhances transparency, supports clinical decision-making, and may improve early identification of high-risk patients.
Introduction
Acquired immunodeficiency syndrome (AIDS) represents a constellation of clinical syndromes that occur in the advanced stage of human immunodeficiency virus (HIV) infection and is characterized by severe impairment of immune function. HIV infection and its associated complications continue to constitute a major global public health challenge. According to the latest report released by the Joint United Nations Programme on HIV/AIDS (UNAIDS) in 2025, 1 approximately 44.1 million (37.6—53.4 million) people have died from AIDS-related illnesses since the start of the epidemic through the end of 2024, with an estimated 630000 (490000—820000) deaths in 2024. Although the widespread implementation of combination antiretroviral therapy (cART) has substantially improved survival among people with HIV (PWH), their overall life expectancy remains lower than that of the general population, and mortality risk remains elevated.2,3
While most prior studies have focused on long-term mortality, in-hospital mortality represents a distinct and acute clinical scenario.4,5 Hospitalized PWH frequently present with advanced opportunistic infections, organ dysfunction, or severe systemic inflammation, requiring rapid clinical decision-making within a limited time window. Therefore, early identification of hospitalized individuals with HIV who are at high risk of death is crucial for timely intervention, optimization of treatment strategies, and improvement of clinical outcomes.
Common inpatient severity scores, including the Acute Physiology and Chronic Health Evaluation II (APACHE II) and the Sequential Organ Failure Assessment (SOFA),6,7 were developed for heterogeneous ICU populations and do not account for HIV-specific factors. Their applicability to hospitalized PWH remains uncertain, highlighting the need for a tailored prediction model.
Previous studies have identified prognostic indicators in PWH, including hemoglobin levels, 8 viral load, 9 and CD4+ T cell counts. 10 These studies have predominantly employed conventional statistical approaches, such as Cox proportional hazards models and logistic regression, which are well established and effective for hypothesis-driven analyses involving a limited or moderately sized set of variables. However, with the increasing volume and complexity of clinical data, these approaches may face challenges in simultaneously modeling high-dimensional variables and complex interactions. In this context, machine learning (ML) methods offer a complementary strategy, as they are capable of identifying novel prognostic factors, capturing complex nonlinear relationships, and potentially improving overall predictive performance. 11 Nevertheless, many ML models are criticized for their limited transparency, a phenomenon commonly referred to as the “black-box” issue. 12 Specifically, although such models may achieve high predictive accuracy, their internal decision-making processes are often not readily interpretable, making it difficult for clinicians to understand how individual variables contribute to a given prediction or whether the model’s reasoning aligns with established clinical knowledge. This lack of interpretability may reduce clinicians’ trust and hinder the translation of ML models into clinical practice. To address this challenge, Shapley additive explanations (SHAP) provide a robust framework to quantify and visualize the contribution of individual predictors, thereby enhancing model interpretability at both the population and individual levels.13,14
With China’s HIV epidemic shifting in demographics and transmission routes, there is an urgent need for population-specific tools to predict clinical outcomes. Rising incidence in southeastern coastal provinces like Zhejiang underscores the importance of locally tailored prediction models. Compared with other regions, this area differs in terms of healthcare resource availability, referral pathways, and hospitalization patterns, as well as population mobility and social structure. This study, therefore, aimed to develop and validate an interpretable ML model to predict in-hospital mortality among PWH. By integrating SHAP for transparency and a user-friendly web application, we sought to create a practical, clinical decision-support tool to facilitate individualized risk stratification.
Methods
Study population and data collection
This study included adults (≥18 years) with HIV who were admitted for the first time to the AIDS ward of the First Affiliated Hospital of Zhejiang University School of Medicine (Hangzhou, China) between January 2010 and December 2021. Clinical and laboratory data at admission were extracted from the hospital’s electronic medical record system. Survival status was recorded for all participants and censored at hospital discharge. The patient selection process is summarized in Figure 1. Study flow chart. A total of 2,015 hospitalized people with HIV (PWH) aged ≥18 years admitted to the AIDS ward between 2010 and 2021 were included. The original cohort consisted of 1722 survivors and 293 non-survivors. To address class imbalance, the Synthetic Minority Over-sampling Technique (SMOTE) was applied to the training dataset, resulting in a balanced dataset with equal numbers of survival and death cases (n = 3444). The dataset was randomly split into a training cohort (85%, n = 2927) and an internal validation cohort (15%, n = 517). Multiple machine learning models were trained, and the best-performing model was selected based on validation performance. Abbreviation: PWH, People with HIV; AIDS, Acquired Immune Deficiency Syndrome; SMOTE, Synthetic Minority Over-sampling Technique.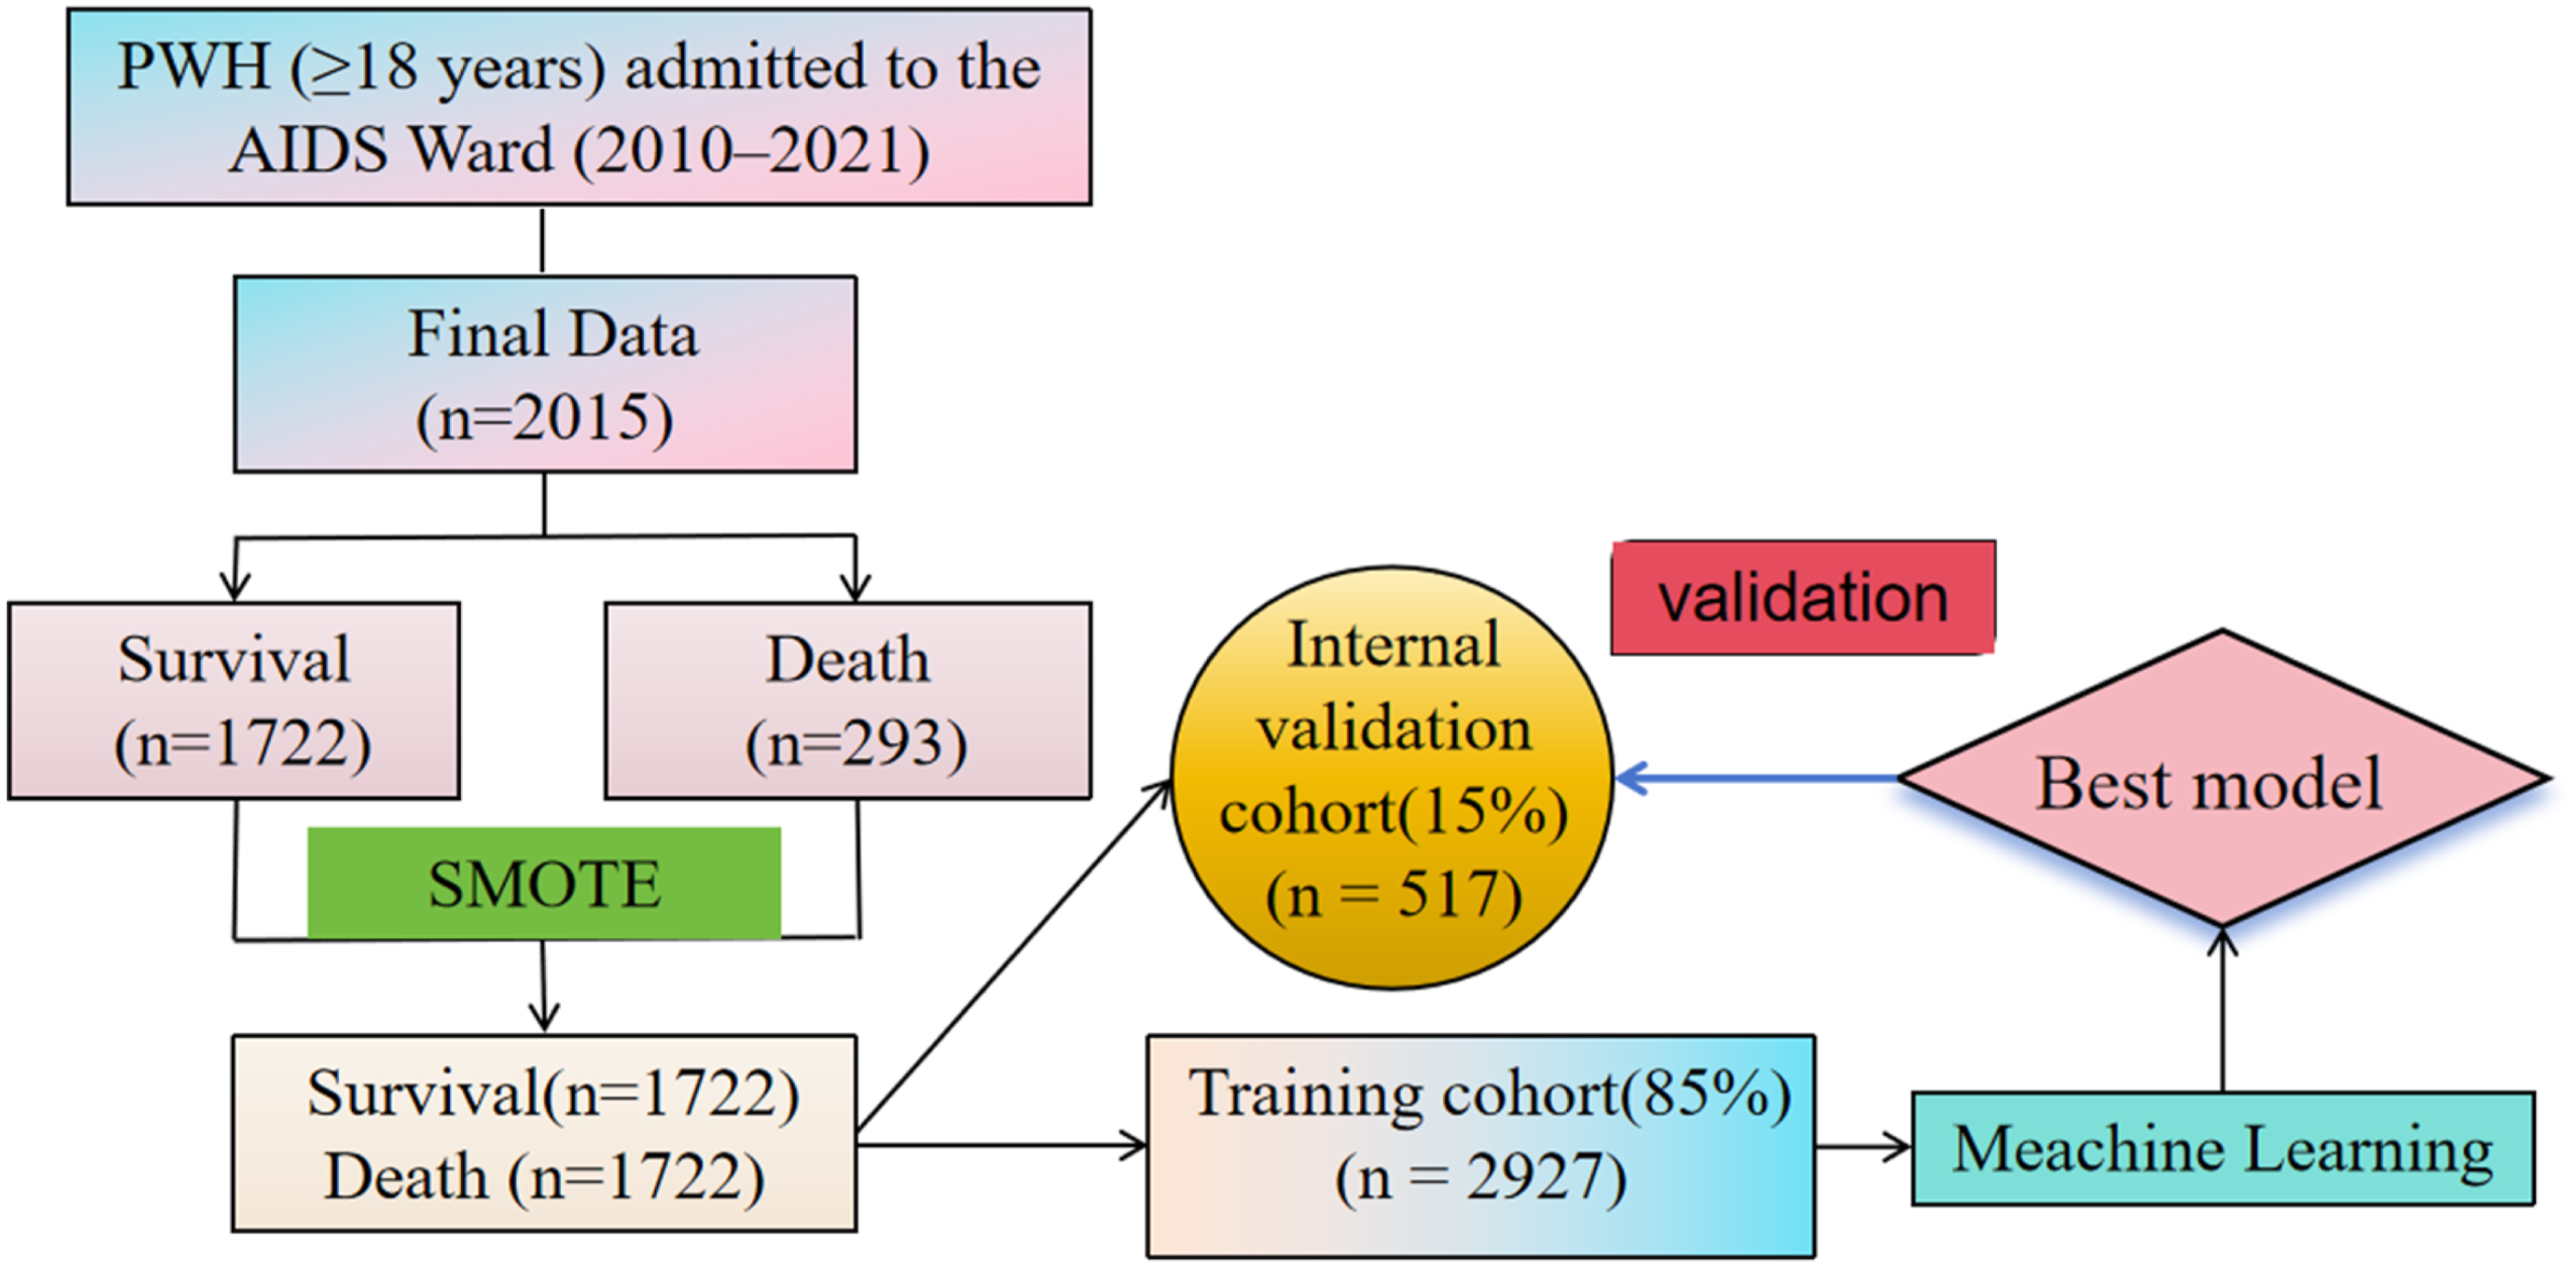
Predictive variables
The structured dataset included 50 variables, which were as follows: general information (sex, age, height, weight), personal history (smoking history and alcohol consumption history), medical and treatment history (hypertension, diabetes, hepatitis B, hepatitis C, and pre-admission cART status), laboratory results (white blood cell (WBC) count, red blood cell (RBC) count, hemoglobin, platelet count, CD4+ T cell count, CD8+ T cell count, CD4/CD8 ratio, albumin, aspartate aminotransferase (AST), alanine aminotransferase (ALT), creatinine, sodium, D-dimer, total protein, alkaline phosphatase, total bilirubin, direct bilirubin, γ-glutamyltransferase (γ-GT), potassium, calcium, chloride, alpha-fetoprotein (AFP), carcinoembryonic antigen (CEA), cancer antigen 125 (CA125), CA199, ferritin, C-reactive protein (CRP), lactate dehydrogenase (LDH), estimated glomerular filtration rate (eGFR), triglycerides, total cholesterol, high-density lipoprotein, low-density lipoprotein, very low-density lipoprotein, total T4, total T3, free T3, free T4, thyroid-stimulating hormone). All laboratory indicators were based on the first results obtained within 24 hours after hospital admission. The study outcome was in-hospital all-cause mortality, with patients categorized into survival and death groups.
Data preprocessing
To reduce potential bias caused by missing data, the missing proportions of each feature were first assessed, and features with missing values > 25% were deleted. For features with missing value ≤ 25%, multiple imputation was performed using the Predictive Mean Matching (PMM) method from the ‘mice’ package (version 3.16.0). The imputation was performed under the assumption that data were missing at random, and all candidate predictors as well as the outcome variable were included in the imputation model. Multiple imputed datasets were generated and combined to improve the stability and reliability of the estimates.
Due to potential multicollinearity among candidate predictors, Spearman correlation analysis was conducted before model development. When the correlation coefficient between two features exceeded 0.6, one variable was removed to reduce redundancy, taking into account its association with the outcome and overall interpretability. Finally, 37 features were selected for the development of the prediction model (Supplementary Figure 1). They were CA125, CRP, platelet count, age, free T3, eGFR, WBC count, smoking history, γ-GT, LDH, direct bilirubin, CA199, height, CD4+ T cell count, AFP, serum sodium, history of hypertension, CD8+ T cell count, total T4, ferritin, high-density lipoprotein, D-dimer, very low-density lipoprotein, weight, serum creatinine, hemoglobin, CEA, hepatitis B, free T4, hepatitis C, serum potassium, AST, low-density lipoprotein, thyroid-stimulating hormone, sex, alcohol consumption history, and diabetes.
To address class imbalance, the Synthetic Minority Over-sampling Technique (SMOTE) was used during model development to generate synthetic minority-class samples and improve class representation. SMOTE creates new minority-class examples based on the k-nearest neighbors of existing observations, rather than simply duplicating samples. The resulting dataset was then used for model training and internal validation. To reduce the risk of overly optimistic estimates, stratified cross-validation and an independent hold-out test set were used to assess model stability and predictive performance.
Model development and evaluation
The up-sampled dataset was randomly divided into a training set (85%, n = 2927) and an internal validation set (15%, n = 517). The training set was used to develop the ML model, while the internal validation set was utilized to assess the model’s predictive performance after oversampling. Eleven machine learning algorithms were implemented: artificial neural network (ANN), adaptive boosting (AdaBoost), decision tree (DT), gradient boosting machine (GBM), extremely randomized trees (ET), k-nearest neighbors (KNN), light gradient boosting machine (LightGBM), logistic regression (LR), random forest (RF), support vector machine (SVM), and extreme gradient boosting (XGBoost). These ML algorithms were employed to predict the in-hospital mortality risk of HIV patients. Performance was assessed using area under the receiver operating characteristic curve (AUC-ROC), sensitivity, specificity, positive predictive value (PPV), negative predictive value (NPV), accuracy, and F1 score. Cross-validation was used to evaluate sample adequacy and model stability. During model training, we employed grid search combined with 5-fold cross-validation for hyperparameter tuning, where the training data were split into five subsets, and in each iteration one subset was used as the validation set while the remaining subsets were used for training, with the process repeated five times. The hyperparameter search space was restricted to the number of estimators (n_estimators:{100, 200} and the learning rate (learning_rate: {0.01, 0.1}). A parameter grid was constructed to evaluate all combinations of these hyperparameters, and for each configuration, 5-fold cross-validation was performed with model performance assessed using ROC-AUC. The optimal hyperparameter configuration was selected based on the average ROC-AUC score across the cross-validation folds, after which the model was trained using the selected parameters on the training data and evaluated on an independent test set.
To evaluate the reliability of the predicted probabilities, we assessed model calibration using calibration curves and the Brier score.
Sample size calculation
The minimum required sample size for this study was estimated based on established statistical principles for developing prediction models. To avoid model overfitting, it is recommended that each candidate predictor be supported by at least 10 outcome events (i.e., death event), corresponding to an events per variable (EPV) ratio of ≥ 10. With a total of 37 candidate predictors included in this study, a minimum of 370 (37×10) death events was required.
However, the observed number of events in the present cohort (n = 293) was slightly below this threshold. It is important to note that the EPV ≥10 rule is a heuristic rather than a strict requirement, and recent methodological studies have suggested that acceptable model performance may still be achieved with lower EPV when appropriate strategies are applied.
In this study, we mitigated the risk of overfitting through feature reduction, cross-validation, and model calibration assessment. Notably, the final model included only five predictors, resulting in a substantially higher effective EPV.
Model interpretability, feature selection, and clinical implementation
Model interpretability was assessed using SHAP, which quantifies the contribution of each variable to individual and overall predictions.13,14 SHAP values were used for both global feature ranking and local explanations. Feature reduction was guided by SHAP, sequentially narrowing from 37 to five variables while maintaining predictive performance. The DeLong non-parametric test was used to compare differences in AUC values between models. The final LightGBM model was deployed as an interactive web application using the Streamlit framework (https://hiv-mortality-predictor.streamlit.app/). Clinicians input values for the five predictors, and the system returns individualized mortality probabilities along with SHAP-based visual explanations.
Statistical analysis
Analyses were performed using Python (version 3.8.9) and R (version 4.4.0). Continuous variables with a normal distribution were expressed as mean ± standard deviation, and group comparisons were performed using Welch’s two-sample t-test. Categorical data were expressed as frequencies and percentages, with group comparisons conducted using the chi-square test or Fisher’s exact test. We used the mice package (version 3.16.0) in R (version 4.4.0), employing Predictive Mean Matching (PMM) as the imputation engine. Predictive performance was evaluated using the AUC. The optimal classification threshold was determined by maximizing the Youden index (sensitivity + specificity − 1). A P < 0.05 was considered statistically significant. All R procedures were performed in RStudio (version 2024.12.0).
This study was conducted and reported in accordance with the TRIPOD-AI statement. The completed TRIPOD-AI checklist is provided in the Supplementary Materials.
Results
Patient characteristics
Comparison of demographics and clinical characteristics between the survival group and the death group.

Abbreviations: WBC, white blood cell; RBC, red blood cell; AST, aspartate aminotransferase; ALT, alanine aminotransferase; Cr, creatinine; Na, sodium; ALP, alkaline phosphatase; γ-GT, γ-glutamyltransferase; K, potassium; Ca, calcium; Cl, chloride; AFP, alpha-fetoprotein; CEA, carcinoembryonic antigen; CA125, cancer antigen 125; CA199, cancer antigen 199; CRP, C-reactive protein; LDH, lactate dehydrogenase; eGFR, estimated glomerular filtration rate; TT4, total T4; TT3, total T3; TSH, thyroid-stimulating hormone; FT4, free T4; FT3, free T3; cART, combination antiretroviral therapy.
Model construction and evaluation
Using the oversampled and balanced dataset, we developed 11 ML models to predict in-hospital mortality among PWH. Internal validation demonstrated that several models, including RF, LightGBM, ET, XGBoost, and GBM, achieved AUC-ROC values greater than 0.90 (Supplementary Table 2). Figure 2(a) and Supplementary Figure 2 A–K present the ROC curves for each model along with SHAP summary plots of the 20 most important features. When the feature set was reduced to the five highest-ranking predictors, only the RF and LightGBM models maintained AUC values above 0.90 (RF: 0.9006, LightGBM: 0.9008). Further reduction to four features resulted in a marked decline in AUC values for both models, falling below 0.90. Figure 2(c) and Supplementary Table 3 summarize the performance metrics of the LightGBM models with varying feature sets, including sensitivity, specificity, PPV, NPV, accuracy, and F1 score, calculated at the optimal cutoff determined by the Youden index. Performance of ML models in predicting in-hospital mortality. (a) ROC curves for all ML models. (b) AUC values for all ML models with different numbers of features in internal validation. (c) AUC, sensitivity, specificity, and F1 scores for LightGBM models with different numbers of features. Abbreviations: AdaBoost, adaptive boosting; ANN, artificial neutral network; AUC-ROC, area under the receiver-operating-characteristic curve; DT, decision tree; ET, extra tree; GBM, gradient boosting machine; KNN, K-nearest neighbor; LightGBM, light gradient boosting machine; LR, logistic regression; ML, machine learning; NPV, negative predictive value; PPV, positive predictive value; RF, random forest; SVM, support vector machine, XGBoost: eXtreme gradient boosting.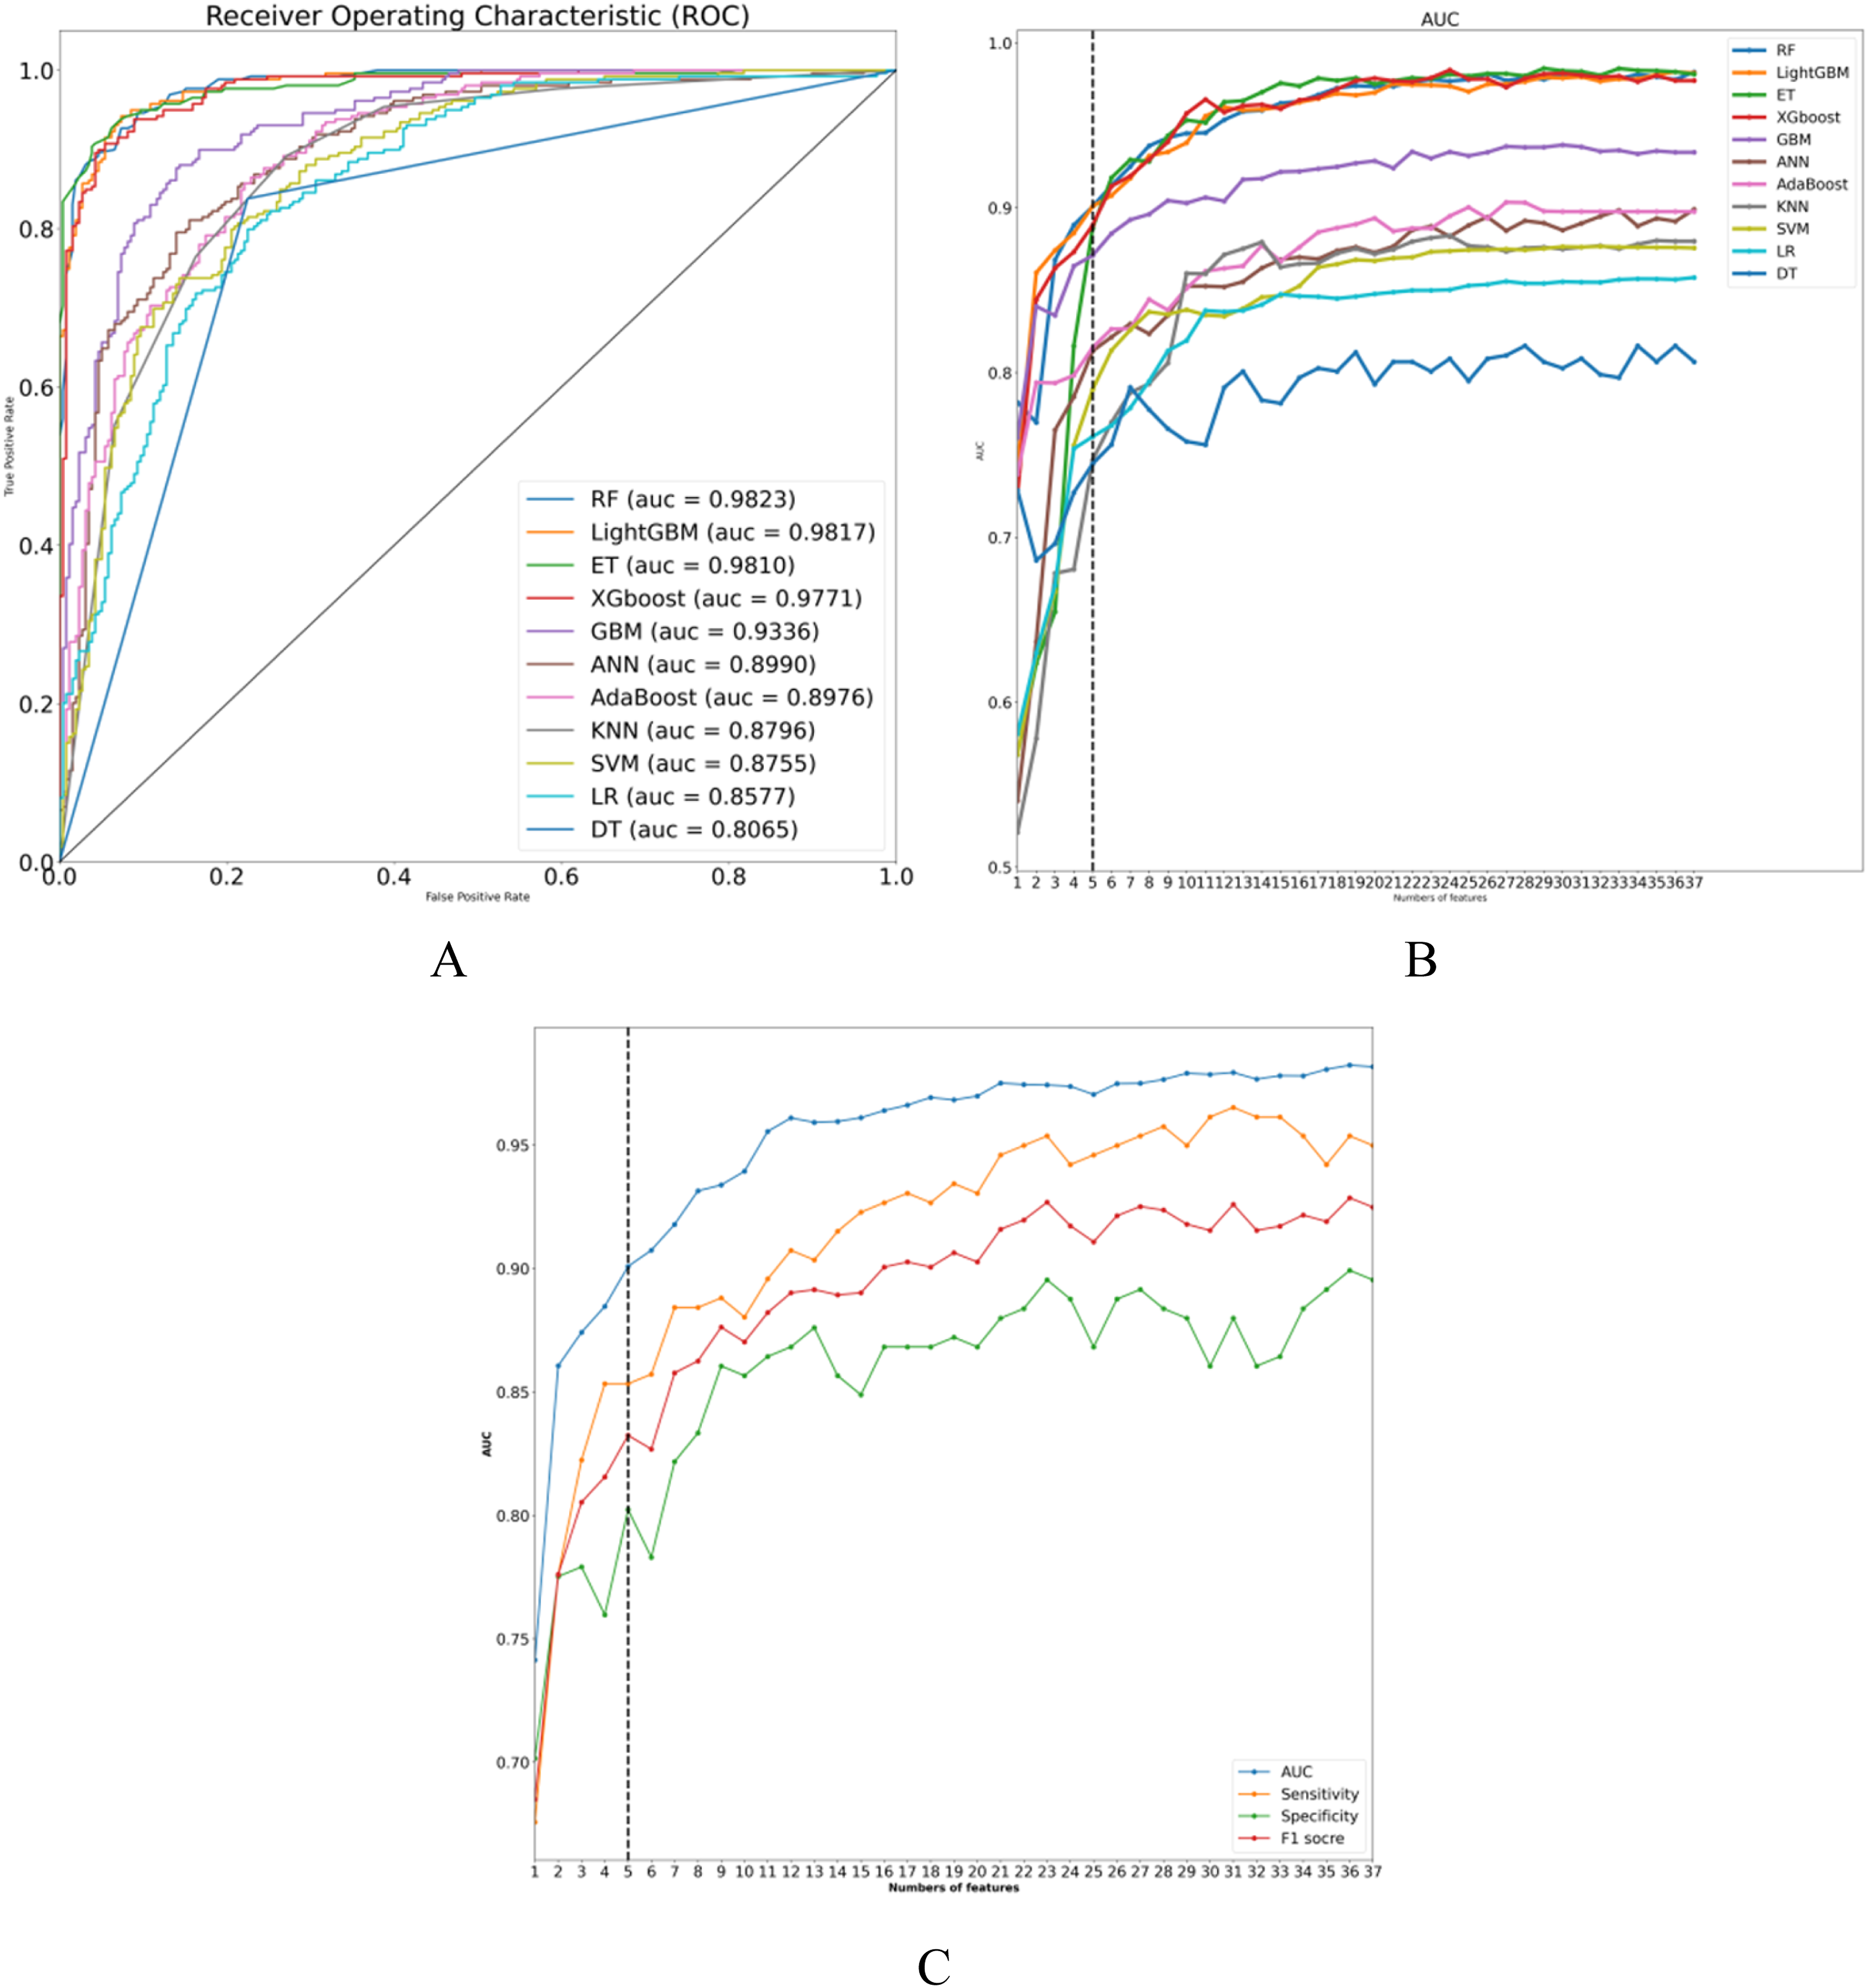
Optimal model determination
During the feature reduction process, the LightGBM model consistently demonstrated superior predictive ability. As shown in Figure 2(b) and Supplementary Figure 3, reducing the feature set from five to four variables significantly decreased the AUC (from 0.9008 to 0.8846; difference = 0.0162, p = 0.0081), confirming the five-feature model as optimal. Decision curve analysis (DCA) revealed that the net benefit of the five-feature model was equivalent to that of the complete model (Supplementary Figure 4B). Compared with the full 37-variable model (AUPRC = 0.9854, 95% CI: 0.9755-0.9924), the precision-recall curve (PRC) of the five-feature model (AUPRC = 0.8963, 95% CI: 0.8569-0.9314) closely paralleled that of the full model, demonstrating comparable discriminative performance (Supplementary Figure 4C–F).
Accordingly, the final LightGBM model incorporated five predictors: CA125, direct bilirubin, WBC count, CRP, and age.
The LightGBM five-feature model achieved an AUC of 0.9008 [95% confidence intervals (CI): 0.8721-0.9259], with sensitivity of 0.8533 (95% CI: 0.8100-0.8955), specificity of 0.8023 (95% CI: 0.7528-0.8489), PPV of 0.8125 (95% CI: 0.7645-0.8603), NPV of 0.8449 (95% CI: 0.7991-0.8906), accuracy of 0.8279 (95% CI: 0.7950-0.8627), and an F1 score of 0.8324 (95% CI: 0.7984-0.8683) (Supplementary Figure 5). To further assess model stability, 5-fold and 10-fold cross-validation were performed. As shown in Supplementary Figures 6A and 6B, the mean AUC values were 0.898 ± 0.015 and 0.905 ± 0.019, respectively, supporting the robustness of the final model.
The calibration curve demonstrated good agreement between predicted and observed mortality risks. The raw LightGBM model closely followed the ideal diagonal line, indicating satisfactory calibration. Mild deviation was observed in the intermediate probability range (0.4–0.6), which was slightly adjusted after isotonic and sigmoid recalibration. The Brier scores were comparable across the raw and calibrated models, suggesting that the original model already exhibited stable probabilistic performance (Supplementary Figure 7).
SHAP-based explanation and analysis of the LightGBM model
To enhance clinical interpretability, SHAP analysis was applied to the final LightGBM model. Global explanations were generated through SHAP summary plots (Figure 3(a) and (b)), which illustrate the average effect of each variable on predictions. Figure 3(c) shows the relationship between actual values of the five predictors and their SHAP values. SHAP values greater than zero indicated increased predicted risk of death. Patients with CA125 > 24 U/mL, CRP > 9 mg/L, direct bilirubin > 16 μmol/L, or WBC count > 6.5 × 10⁹/L had higher predicted mortality risk, as did patients aged 35–65 years. Global model explanations using SHAP. (a) SHAP feature importance bar plot. (b) SHAP scatter summary plot. Higher SHAP values indicate a greater probability of death. Each patient’s SHAP value corresponds to a single data point on each feature row. The color of the points represents the actual value of the feature, with red indicating higher values and blue indicating lower values. Data points are vertically stacked to illustrate distribution density. (c) SHAP dependence plots. Each plot shows the effect of a single feature on model output, with each point representing a patient. For example, when age is ≥35 and <65 years, the model’s prediction shifts toward the “death” category. SHAP values are displayed on the Y-axis, and actual feature values on the X-axis. SHAP values greater than 0 indicate a stronger contribution toward predicting death.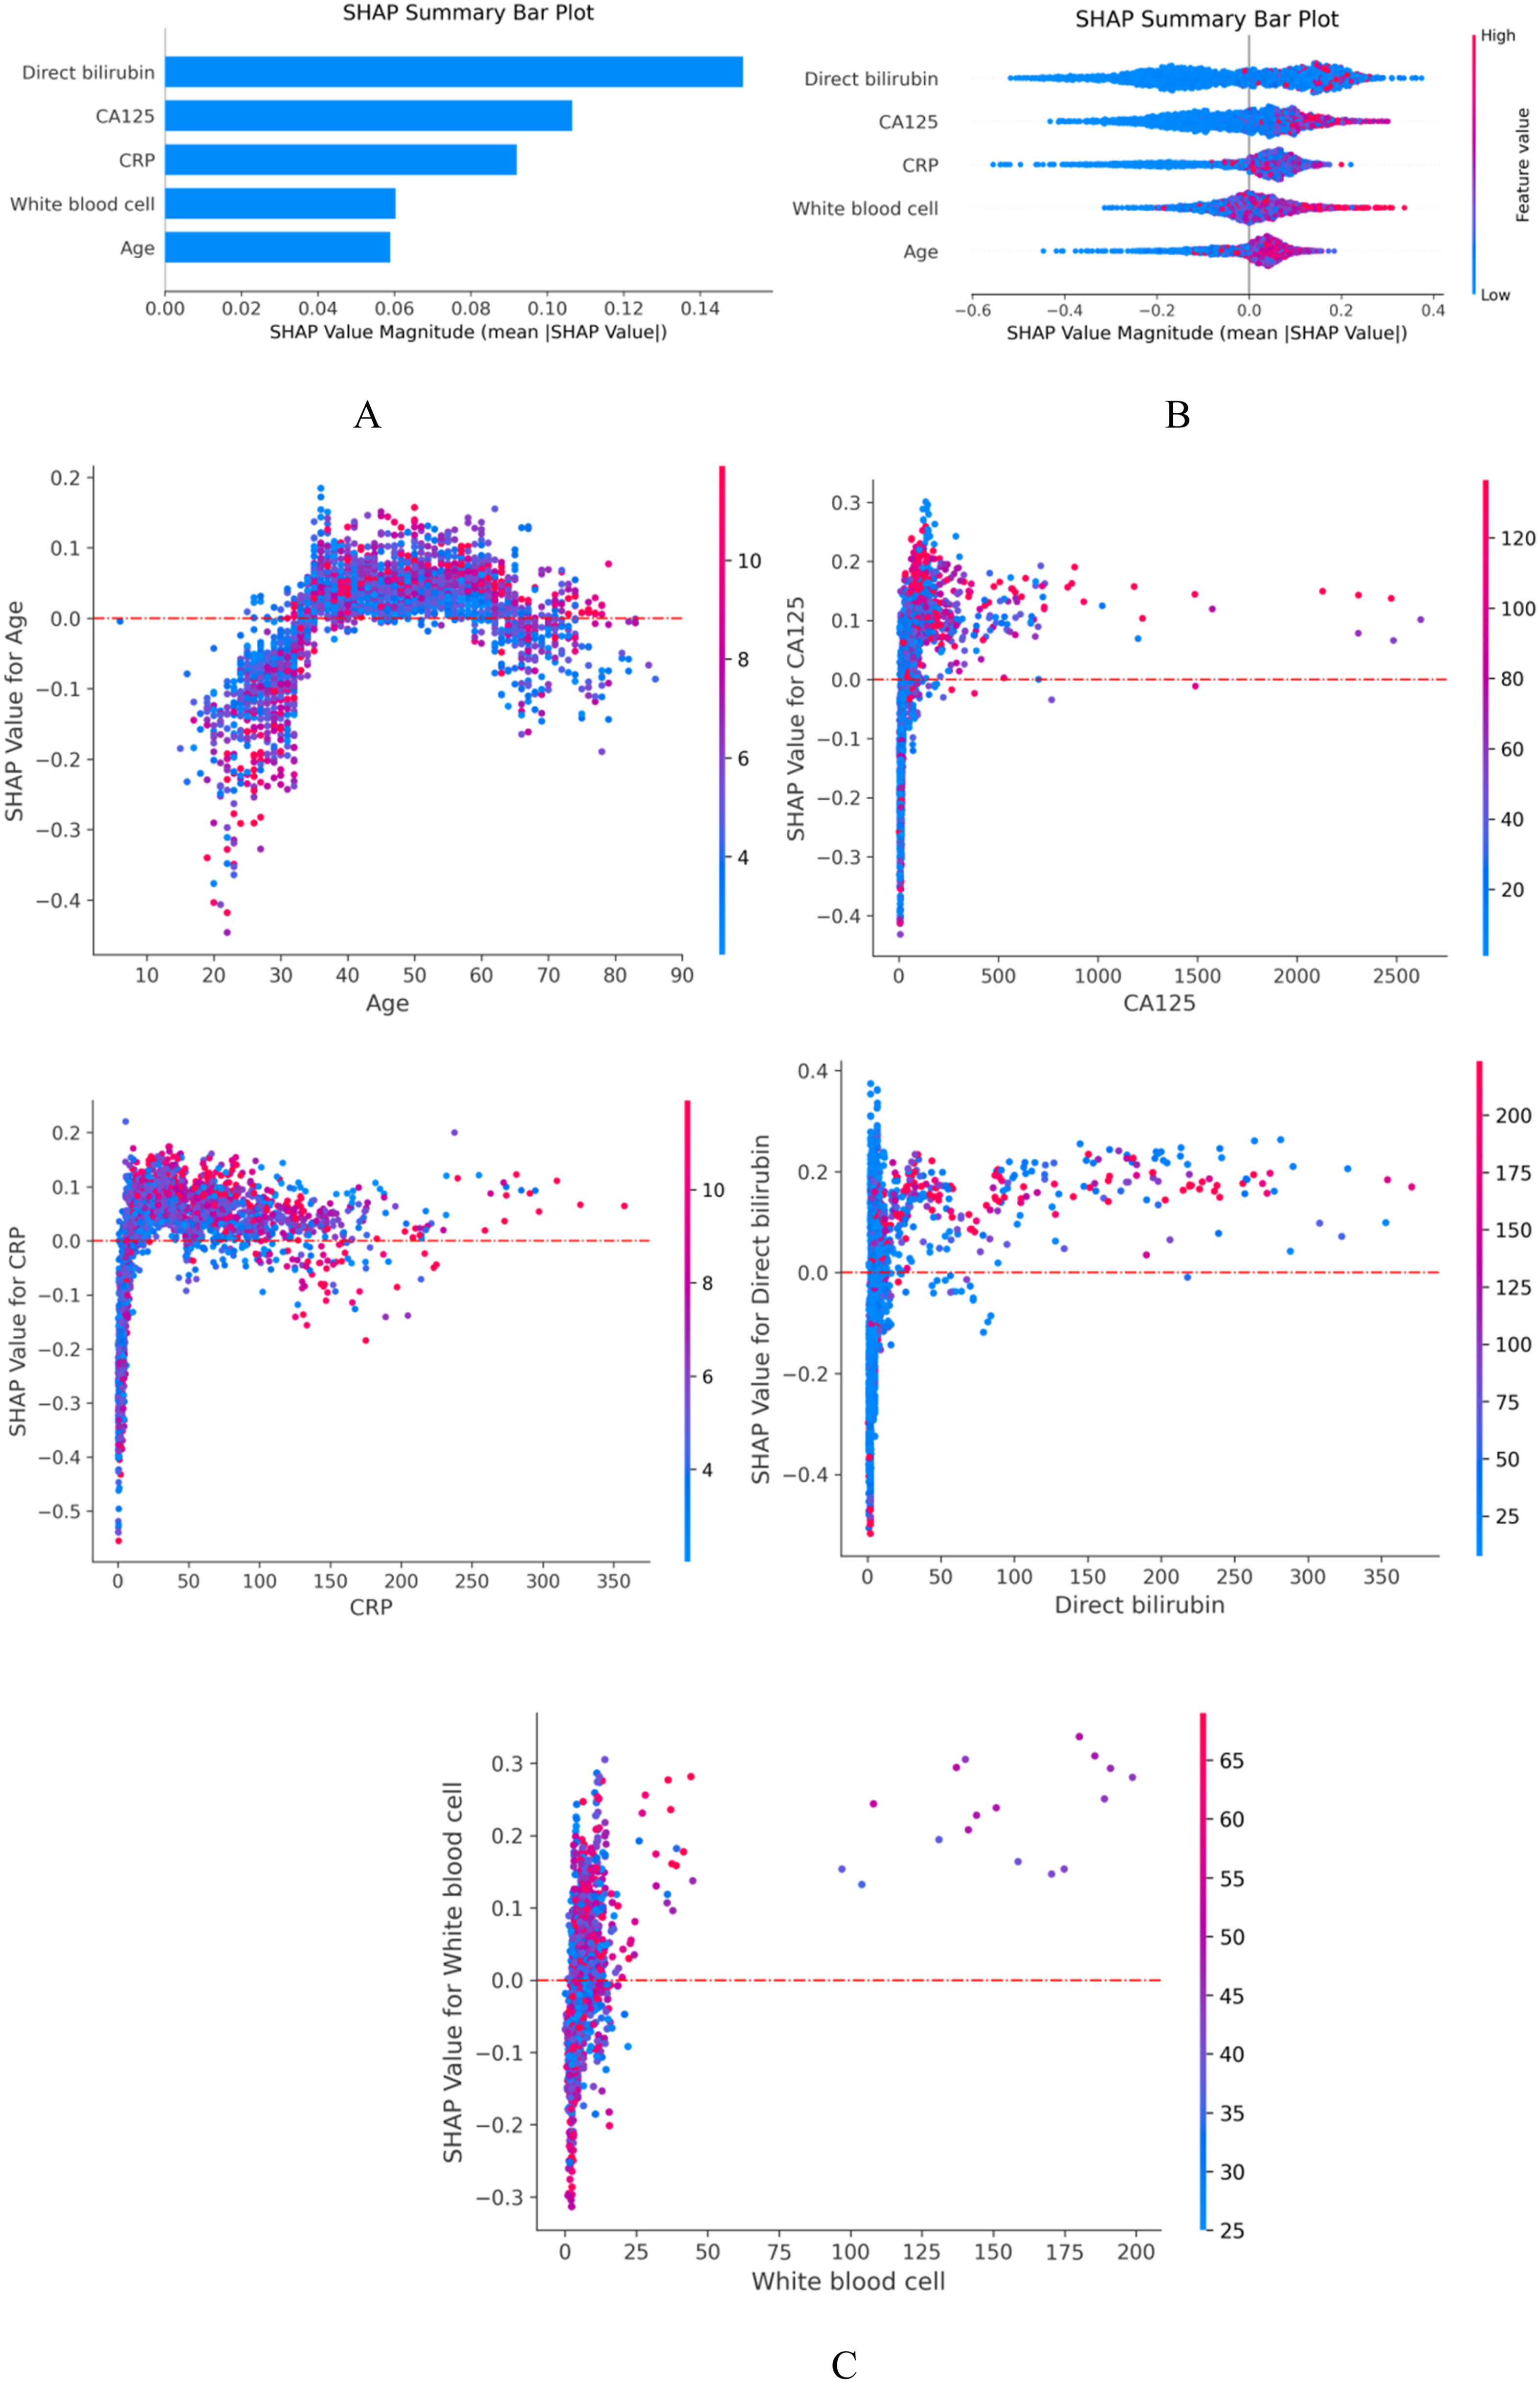
Local explanations provided individualized prediction rationales. Figure 4(a)–(c) illustrate the case of a surviving patient, whose predicted probability of death was 12.2%. In this case, CA125, direct bilirubin, and WBC count values shifted the prediction toward survival, whereas CRP and age exerted less influence. Figure 4(d)–(f) illustrate the case of a patient who died, with a predicted probability of death of 97.3%. Figure 4(g) presents a visualization of SHAP explanations across the internal validation cohort, where greater red intensity indicated higher likelihood of death prediction. Local model explanation using SHAP. (a)–(f) Waterfall plots demonstrate the contribution of individual features to patient-specific risk predictions. (a–c) Low-risk patient with a predicted survival probability of 87.8%. (d)–(f) High-risk patient with a predicted death probability of 97.3%. (a), (d) Waterfall plots; (b), (e) force plots; (c), (f) standardized feature contributions (normalized to mean 0 and unit variance). (g) Force plot for the internal validation set. Each patient is displayed on the X-axis, with feature contributions shown on the Y-axis. Greater red areas indicate higher predicted probability of death.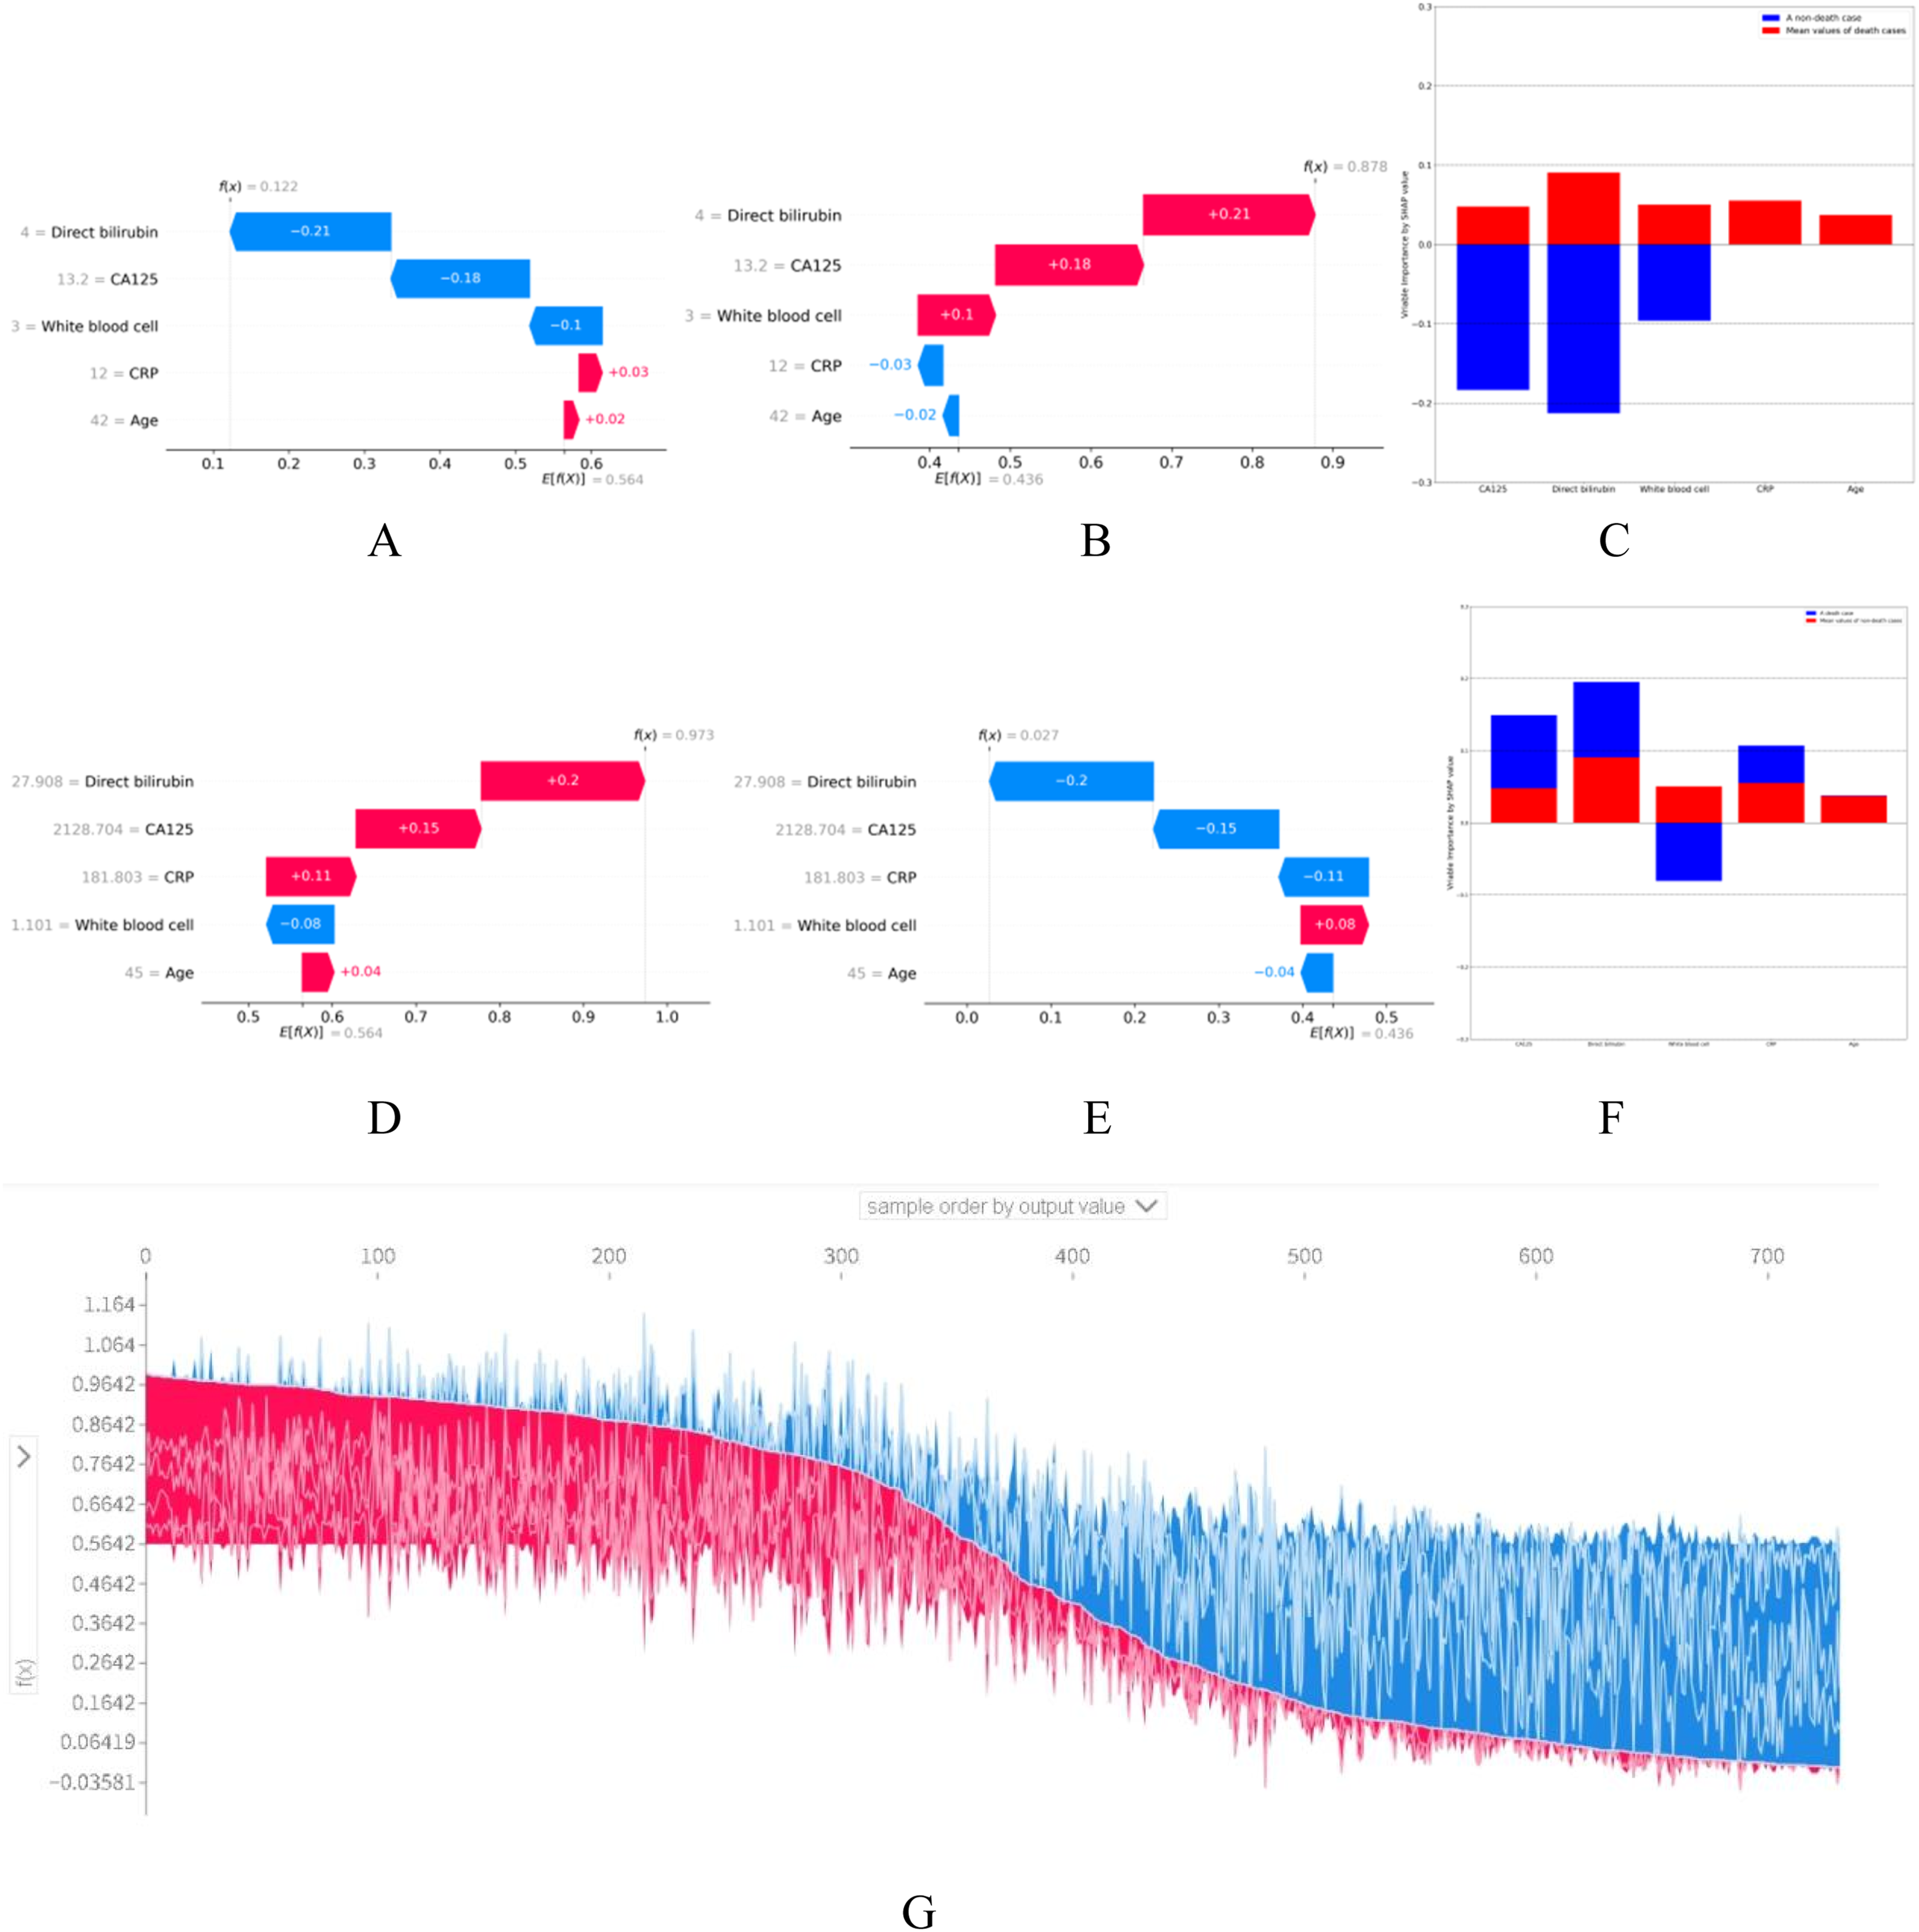
Clinical application
The final LightGBM model was deployed as an interactive web application using the Streamlit framework (Figure 5). The application allows clinicians to enter the values of the five predictors, after which the system calculates the patient’s individualized probability of in-hospital mortality. For example, when entering the following patient information on the webpage—CA125: 10.1U/mL; direct bilirubin: 2.9 μmol/L; white blood cell: 15×10E9/L; CRP: 6.00 mg/L; and age: 56 years—the model estimates a mortality risk of 41% (https://hiv-mortality-predictor.streamlit.app/). The web-based calculator enhances the accessibility and usability of the predictive model, allowing clinicians to input patient-specific data and obtain individualized risk estimates. A force-directed graph illustrates the direction and magnitude of each variable’s contribution to the prediction, with blue indicating survival-promoting features and red indicating death-promoting features. The final prediction model was implemented in the web application. For example, when entering the following patient information on the webpage—CA125: 10.1U/mL; direct bilirubin: 2.9 μmol/L; white blood cell: 15×10E9/L; CRP: 6.00 mg/L; and age: 56 years—the model estimates a mortality risk of 41%.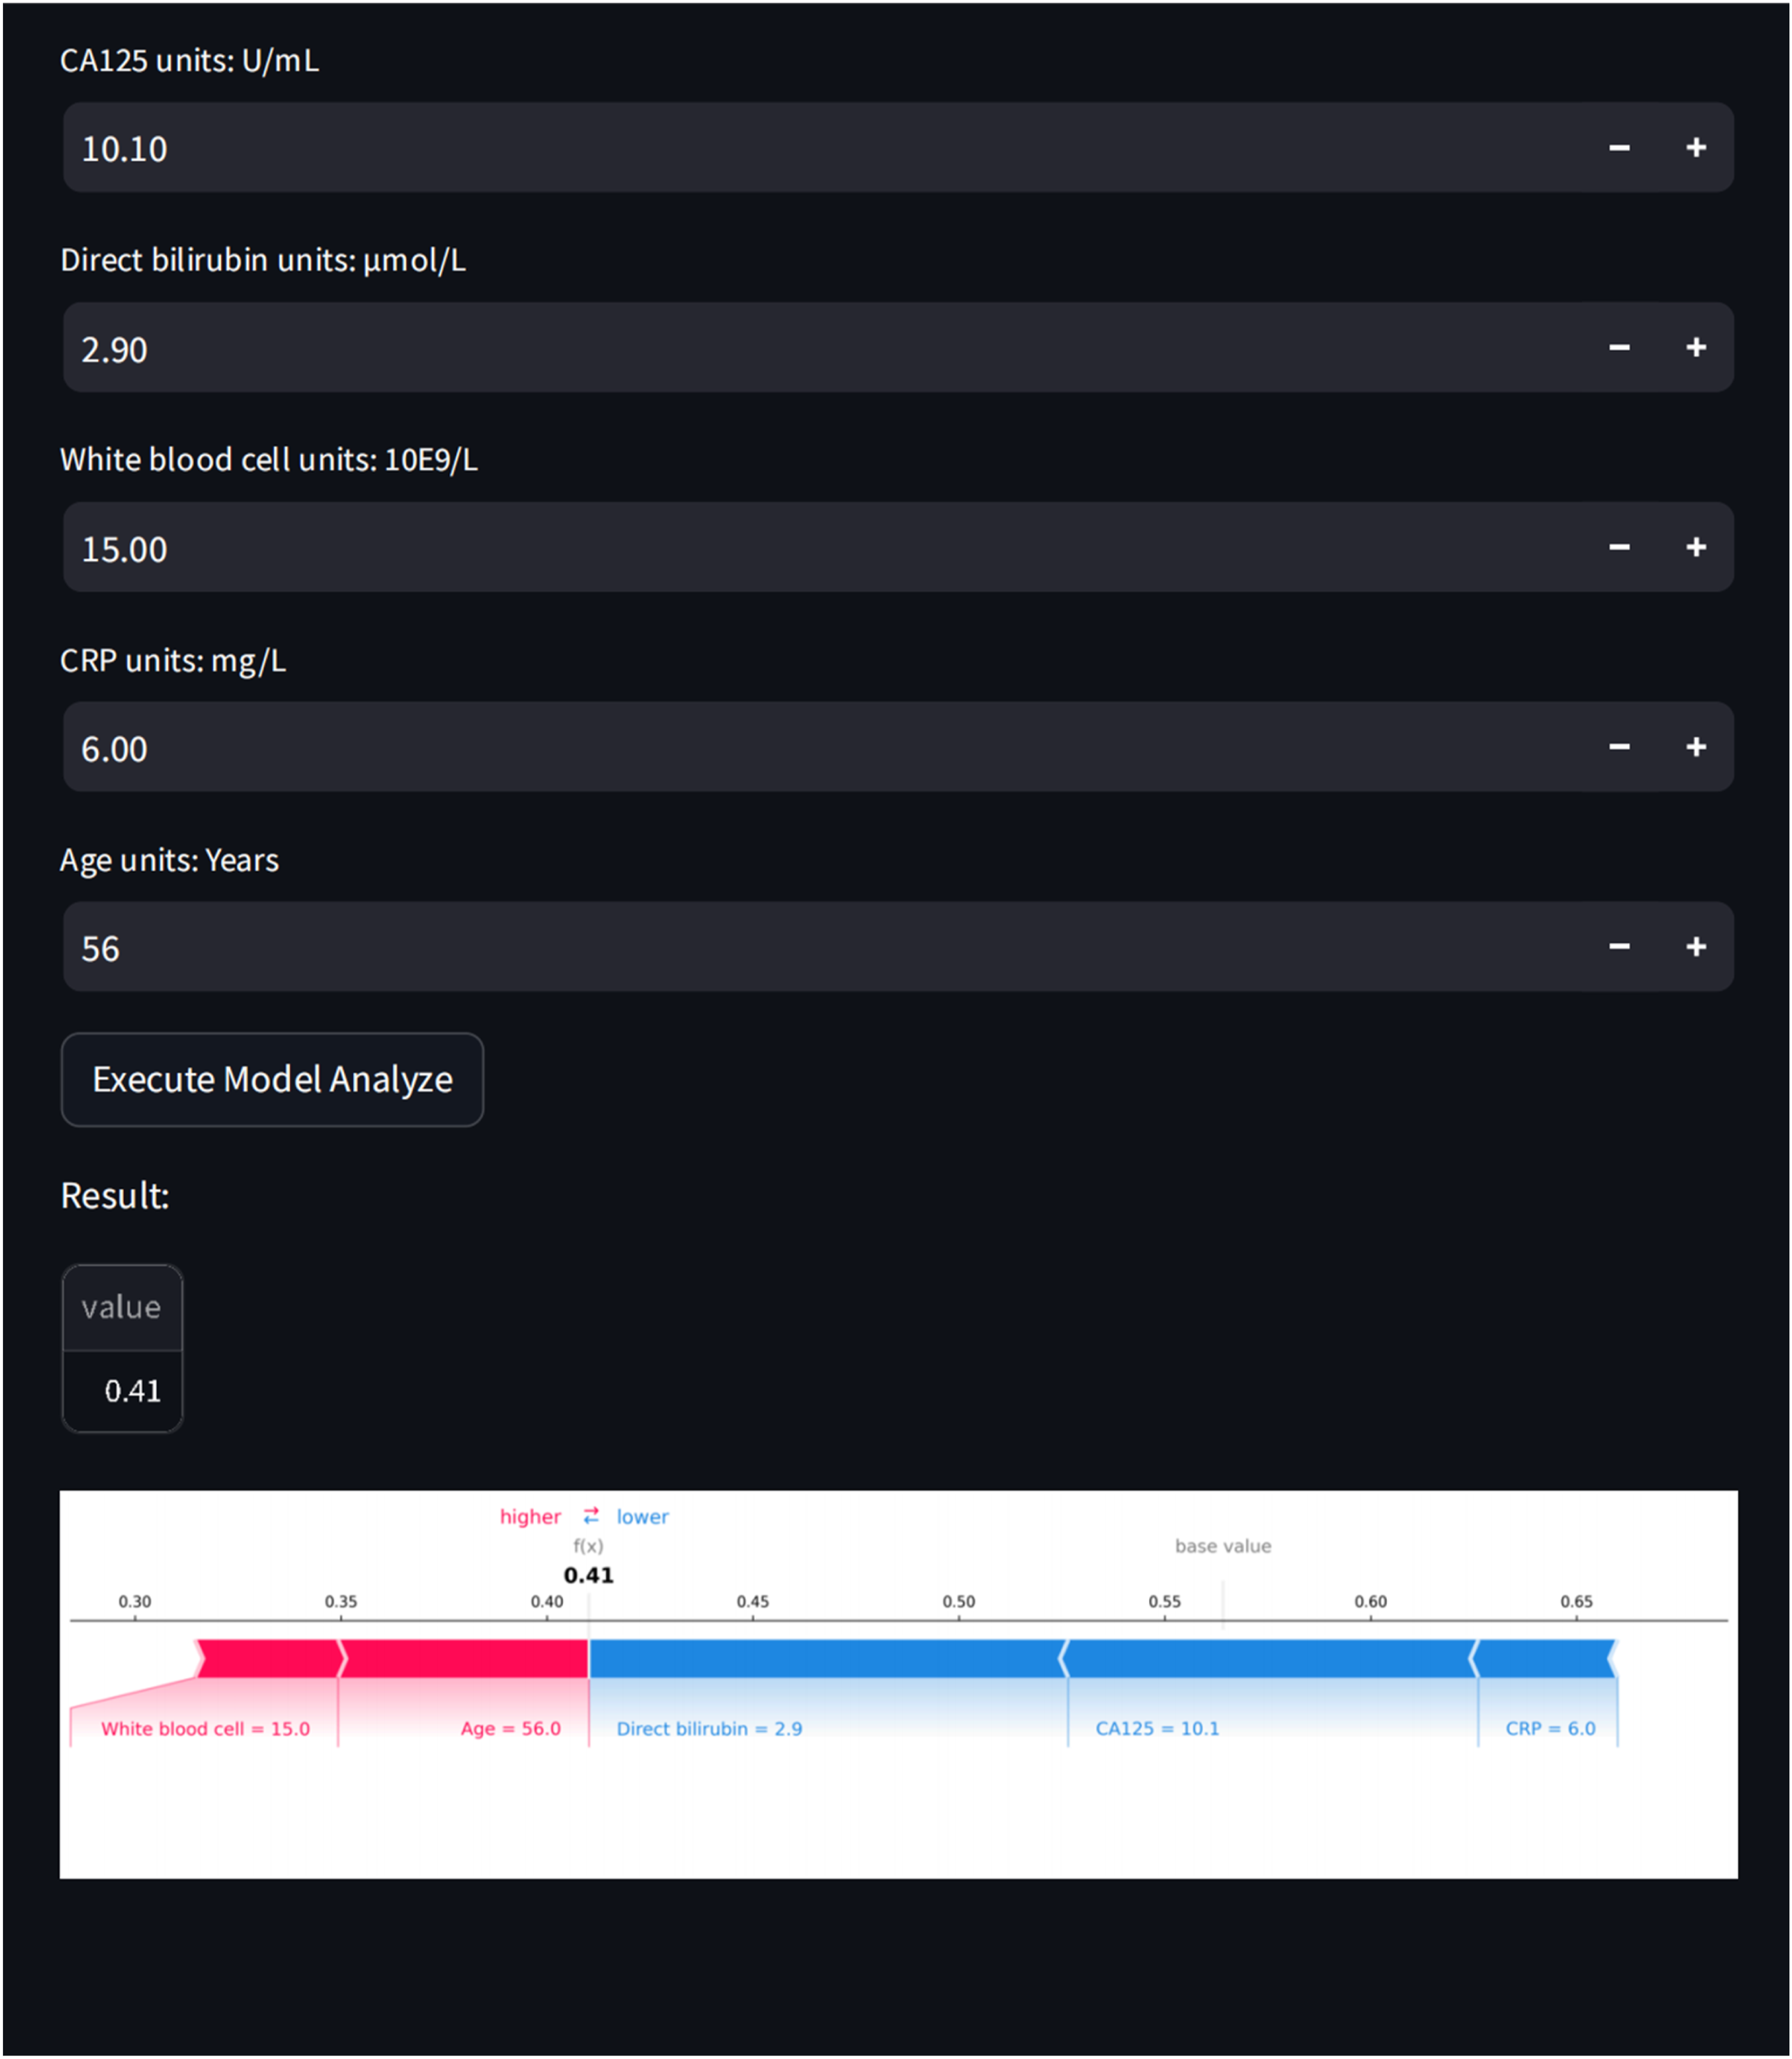
Discussion
To our knowledge, this study is the first to develop an interpretable ML model for predicting in-hospital mortality among hospitalized PWH in southeastern coastal China using large-scale electronic medical record (EMR) data. 14 Previous studies have primarily been conducted in Western populations.15–17 In contrast, our model was developed using EMR data from the First Affiliated Hospital of Zhejiang University School of Medicine, representing routine inpatient clinical care in China. This population-specific dataset captures local clinical profiles and healthcare practices, thereby improving the model’s relevance and potential clinical applicability for Chinese hospitalized PWH.
We systematically compared 11 mainstream ML algorithms and identified LightGBM as the optimal model. To address the “black box” problem inherent in ML, we applied SHAP, which provides both global and individual-level explanations of model outputs.12,13,18 This approach enabled quantification of each predictor’s contribution, allowing clinicians to understand the reasoning behind predictions and increasing confidence in clinical use. 19 By addressing the gap in interpretability of ML models, our approach achieves both high predictive performance and transparency, thereby enhancing its acceptability and potential for clinical decision support.
Previous attempts to predict mortality risk in PWH using ML have often lacked interpretability, limiting clinical translation.20,21 The “black-box” nature of such models remains a barrier to adoption. 22 In contrast, our SHAP-based approach provided transparent explanations, demonstrating not only the average contribution of predictors across the cohort but also individualized reasoning for each patient. 23 This capacity for personalized interpretation may facilitate tailored treatment strategies and enhance clinical decision-making.
In terms of predictive performance, our model achieved an AUC of 0.9008, outperforming prior reports. For example, a meta-analysis of 401389 PWH across 24 studies reported an average C-index of 0.83 for existing ML models. 2 Another study predicting one-year mortality in HIV-infected infants found the highest AUC was only 0.73 using RF. 17 In contrast, our model demonstrated superior accuracy in the Chinese hospitalized adult population, underscoring its potential value. While most prior studies emphasized AUC, few evaluated AUPRC, which is particularly informative for imbalanced datasets such as mortality prediction.24,25 Our model demonstrated excellent performance in both AUC and AUPRC (0.8896), confirming its reliability in identifying high-risk patients.
Another strength of this study was model simplification. By selecting only five variables, CA125, direct bilirubin, WBC count, CRP, and age, we constructed a parsimonious model that retained strong predictive performance. Statistically, the full 37-variable model demonstrated a higher AUC than the five-variable model, and this difference reached statistical significance (DeLong test, p < 0.001). However, the absolute improvement in discrimination was modest and was achieved at the cost of substantially increased model complexity (Supplementary Figure 4A). This reduction enhances usability, aligns with current trends toward simpler prediction models, 26 and retains biological plausibility. Elevated direct bilirubin suggests liver dysfunction, 27 while abnormal WBC and elevated CRP reflect infection or systemic inflammation associated with organ failure. 28 Age-related immune decline and comorbidities further contribute to risk.29,30 Elevated CA125 may indicate malignancy or severe opportunistic infections, such as tuberculosis, which are common in immunocompromised patients.31,32 From a practical perspective, the five-variable model represents a more favorable balance between predictive accuracy and usability. Reducing the number of input variables decreases data collection burden, improves robustness, and enhances interpretability, which are critical factors for real-world implementation. Importantly, all five selected variables are routinely measured or readily available in most inpatient settings with basic laboratory capacity. Even in relatively resource-limited facilities, complete blood counts and basic biochemical tests are commonly performed, supporting the feasibility of applying this model across different healthcare settings. The clinical relevance of these features strengthens model interpretability and credibility. Finally, we translated the model into an interactive web-tool using the Streamlit framework, enabling clinicians to input five routinely available admission variables and obtain individualized mortality risk predictions. The tool provides SHAP-based visual explanations, offering intuitive insights into how each predictor contributes to risk estimation. Because all input variables are readily available from EMR systems, this deployment highlights the model’s potential for future integration into hospital information systems, where automated data extraction and real-time risk alerts could support early clinical decision-making and resource allocation.
A few limitations should be noted. Our study was based on a retrospective single-center cohort using electronic medical record data. While such a design is appropriate for initial prediction model development and reflects real-world clinical practice, the single-center setting may limit the generalizability of our findings. Differences in patient demographics, healthcare resource availability, disease spectrum, and treatment practices across regions may affect model performance. Therefore, external validation in multicenter and geographically diverse populations is necessary before widespread clinical application. Additionally, the model relied only on admission variables; incorporation of dynamic data collected during hospitalization may further improve predictive performance. The study population consisted exclusively of adults aged ≥18 years, and thus the model’s applicability to younger individuals remains uncertain. Time-varying treatment-related factors during hospitalization, such as specific treatment regimens and adherence, were also not captured and may have influenced outcomes. Furthermore, although SMOTE was used to address class imbalance and model performance was assessed by cross-validation and an independent test set, oversampling-based strategies may still introduce some optimism in performance estimation. Likewise, correlation-based feature reduction was performed before model development to reduce multicollinearity rather than to optimize model performance, but a small risk of information leakage cannot be entirely excluded. Future studies should focus on multicenter external validation, incorporation of longitudinal and treatment-related variables, and the use of fully nested resampling and feature selection procedures to further strengthen methodological rigor.
Conclusion
This study developed and validated an interpretable ML model that accurately predicts in-hospital mortality among PWH in China. By simplifying predictors to five routinely available variables and deploying a user-friendly web tool, the model enhances transparency, usability, and clinical applicability. Future research should focus on external validation across multiple centers and incorporation of dynamic data to support continuous risk assessment and guide individualized interventions and resource allocation for PWH.
Supplemental material
Supplemental material - Interpretable machine learning prediction of in-hospital mortality in people with HIV: A cohort study in southeastern China
Supplemental material for Interpretable machine learning prediction of in-hospital mortality in people with HIV: A cohort study in southeastern China by Ye Xiong and Biao Zhu in Digital Health.
Footnotes
Ethical considerations
The study was approved by the Ethics Committee of the First Affiliated Hospital of Zhejiang University School of Medicine (No. IIT20230188B) and conducted in accordance with the Declaration of Helsinki.
Consent to participate
Because this was a retrospective analysis, informed consent was waived.
Author contributions
All authors contributed to the study conception and design. YX, BZ analyzed and interpreted the data, and YX drafted the manuscript. All authors contributed to editing and revision of the manuscript, and have approved its final version.
Funding
The authors disclosed receipt of the following financial support for the research, authorship, and/or publication of this article: This study was supported by grants from the National Key R&D Program of China (Nos. 2022YFC2305202, 2021YFC2301900-2021YFC2301901).
Declaration of conflicting interests
The authors declared no potential conflicts of interest with respect to the research, authorship, and/or publication of this article.
Data Availability Statement
The data provided in this study can be obtained from the corresponding author upon reasonable request.
Guarantor
Biao Zhu.
Supplemental material
Supplemental material for this article is available online.
References
Supplementary Material
Please find the following supplemental material available below.
For Open Access articles published under a Creative Commons License, all supplemental material carries the same license as the article it is associated with.
For non-Open Access articles published, all supplemental material carries a non-exclusive license, and permission requests for re-use of supplemental material or any part of supplemental material shall be sent directly to the copyright owner as specified in the copyright notice associated with the article.