






Abstract
Objective
Social risk factors are key determinants of migraine occurrence and progression. This study assessed the association between the social risk profile (SRP) and the prevalence of self-reported severe headache or migraine and all-cause mortality in US adults, and developed machine learning prediction models to explore feature contributions to internal risk stratification.
Methods
Using data from the National Health and Nutrition Examination Survey (NHANES) 1999–2004, weighted multivariate logistic regression evaluated the SRP–migraine association, and a weighted Cox proportional hazards model assessed the influence of SRP on all-cause mortality among migraine patients. The Boruta and Lasso algorithms selected predictive features for nine machine learning classifiers to predict migraine risk and four survival models to assess mortality risk. SMOTE was applied within cross-validation folds to address class imbalance. SHAP values were utilized to identify the most critical features.
Results
Among 11,861 participants, 2,355 self-reported severe headache or migraine; 2,351 were included in the mortality analysis after excluding 4 individuals with missing survival status. Over a median follow-up of 206 months (IQR: 187–224), 471 deaths occurred. Higher SRP scores were associated with lower migraine prevalence (OR = 0.44, 95% CI: 0.34–0.57) and lower all-cause mortality (HR = 0.31, 95% CI: 0.19–0.50). XGBoost achieved the best performance for migraine prediction (AUC = 0.732, 95% CI: 0.712–0.753), while Random Survival Forest performed best for mortality prediction (AUC = 0.882). SHAP analysis identified age, SRP, and cotinine as key predictors. Decision curve and calibration analyses demonstrated acceptable internal performance, supported by ten-fold cross-validation.
Conclusion
SRP is an independent predictor of migraine risk and long-term survival. The machine learning analysis provides exploratory insights into feature importance for risk stratification within the development sample, while the regression-based association estimates support the epidemiological significance of social determinants in migraine.
Contributions to the literature
● This study introduces a new comprehensive Social Risk Profile that combines eight key social factors to better understand their combined effect on health. ● We show that this social risk profile is strongly linked to a higher risk of death in people with self-reported severe headache or migraine. ● We used explainable machine learning to explore feature contributions to internal risk stratification, informing future validated tools. ● Our findings highlight the need for doctors and public health leaders to look beyond medical treatment and address the social circumstances of self-reported severe headache or migraine patients.
Introduction
Manifesting as recurrent attacks lasting 4–72 hours, migraine is a primary headache disorder subdivided into aura and non-aura subtypes, the former affecting roughly 30% of patients.1,2 According to a 2024 World Health Organization report, headache disorders are universally under-diagnosed and under-treated worldwide. 3 Currently, over one billion people are affected by migraine globally, resulting in a significant socioeconomic burden. The 2019 Global Burden of Disease study designated migraine as the second leading cause of disability worldwide and the primary cause for women under 50.4,5 The period from 1990 to 2021 witnessed a 58.15% growth in migraine prevalence, with cases increasing from 730 million to 1.16 billion, alongside a 42.06% rise in incidence. 6 Migraine is not uncommon in adults, as documented by US figures with annual prevalence ranging from 6%–10% in men to 18%–21% in women.7,8
Migraine patients show more frequent healthcare use and higher direct medical spending than age-, sex-, and comorbidity-matched controls. 9 Financial hardship is prevalent within this population. 7 Statistics show that migraine-related visits exceed 4.3 million annually; in 2018, approximately 40% of US adult migraine patients were unemployed, and nearly an equal proportion lived at or near the poverty line. In this group, about 20% was uninsured, and roughly one-third had attained at most a high school education. 7 Evidence indicates an inverse relationship exists between migraine prevalence and household income levels. 10 Migraine is significantly correlated with food insecurity, affecting 23.9% of the food-insecure population—a proportion that notably exceeds the 13.6% found in food-secure groups. Research suggests that food insecurity may trigger or exacerbate migraine through mechanisms such as missed meals, psychological stress, depression, and sleep disturbances. Conversely, migraine, by impairing work ability and household activities (e.g., shopping, cooking), may further exacerbate food insecurity, establishing a bidirectional relationship.10–12 These social risk factors are often intertwined. The social risk profile (SRP) score is a composite metric encompassing eight critical areas: employment, income, food security, education, healthcare access, insurance status, housing stability, and marital status. It measures the aggregated impact of multiple social adversities on an individual. 13
Currently, research on the relationship between the multidimensional SRP and migraine prevalence and mortality remains relatively limited. Given that SRP levels may have a stratified association with migraine risk, differentiated management strategies are warranted. Hence, this study combines cross-sectional methods to assess the SRP-migraine link with prospective data to determine the effect of SRP severity on all-cause mortality among those diagnosed with migraine.
Methods
Study population
This research sourced its data from the National Health and Nutrition Examination Survey (NHANES) for the 1999-2004 period, covering three consecutive survey cycles. NHANES features a stratified, multistage probability sampling strategy designed to represent the non-institutionalized US civilian population. For the cross-sectional analysis of migraine risk, we excluded individuals with incomplete self-reported severe headache or migraine status information, missing SRP data, and those under 18 years of age, ultimately including 11,861 participants. For the subsequent cohort study on all-cause mortality, among the 2,355 individuals with self-reported severe headache or migraine, those with missing survival status information (n = 4) were further excluded, resulting in the inclusion of 2,351 subjects (Figure S1). The study adhered to the unified NHANES ethical protocols. All enrolled participants provided written informed consent, and the entire study protocol received approval from the NCHS Ethics Review Board.
Ascertainment of migraine
Migraine cases were identified based on self-reported information within NHANES. Specifically, participants were classified as having migraine if they provided a positive response to the question: ‘Have you had severe headaches or migraines in the past 3 months?’ It is important to note that NHANES does not collect physician-confirmed diagnoses based on International Classification of Headache Disorders, 3rd edition (ICHD-3) criteria; therefore, our case definition relies on self-report rather than clinical evaluation. This operational definition is consistent with prior NHANES-based migraine studies. 14
Quantification of the SRP
The SRP was derived from a pre-existing research framework and is consistent with the five key social determinants of health domains outlined in Healthy People 2030: Economic Stability, Education Access and Quality, Health Care Access and Quality, Neighborhood and Built Environment, and Social and Community Context.13,15,16 The SRP score incorporated eight components: employment status, household income (using PIR cutoff 3.0), food security (from survey responses), educational attainment, healthcare access, insurance coverage, housing stability, and marital status, each operationalized per established criteria. 13
Employment, high PIR, food security, higher education, private insurance, homeownership, healthcare access, and married status were collectively considered protective SRP indicators. Each individual received a composite SRP score (range: 0-8) based on their number of favorable indicators. Higher scores indicate greater social resources and lower cumulative social risk. The overall SRP score was classified into four levels—low (0-2), lower-middle (3-4), upper-middle (5-6), and high (7-8)—according to the point ranges. 16
Mortality assessment
The study defined all-cause mortality as its endpoint, with mortality information acquired from the National Death Index death certificates. This dataset, current through December 31, 2019, was provided by the National Center for Health Statistics.
Collection of other covariates
The collected covariates included the following categories. Demographic characteristics included age, sex, and race. Behavioral factors included alcohol use history and tobacco exposure level assessed via serum cotinine concentration. Health status and disease history included body mass index (BMI), self-reported cardiovascular disease (CVD), hypertension, hyperlipidemia, and diabetes (DM), as well as history of using antihypertensive, lipid-lowering, and glucose-lowering medications. Laboratory measures included serum uric acid (UA), creatinine (Scr), lymphocyte count, and neutrophil count.
Statistical analysis
Continuous variables are reported as means with 95% CIs, and categorical variables as frequencies (n) with weighted percentages (%). To maintain the national representativeness of the sample, analyses incorporated sampling weights according to NHANES guidelines, accounting for the complex cluster and stratification design. Accordingly, sample weights were reformulated to be appropriate for the amalgamated dataset, which comprised three survey cycles with differing annual weight sets.
The SRP was handled both as a continuous measure and a categorical variable in the analysis. For categorical analysis, it was divided into four levels to avoid data-driven bias, with the lowest category (0–2 points) serving as the reference group. Missing data were handled using Multiple Imputation by Chained Equations (MICE), generating m = 5 imputed datasets. The overall proportion of missing data was low (most variables <5%). We built three progressively adjusted models to evaluate SRP-self-reported severe headache or migraine associations: crude (SRP only); Model 1 (demographics-adjusted); Model 2 (adding race/alcohol/BMI); and Model 3 (fully controlled for all covariates including health status and laboratory values).
Additionally, for each individual component of the SRP, odds ratios (OR) for self-reported severe headache or migraine risk and hazard ratios (HR) for mortality risk were calculated to assess their independent contributions. Kaplan-Meier curves were plotted to compare survival probabilities of self-reported severe headache or migraine patients in different SRP groups. The association between SRP and self-reported severe headache or migraine was examined by logistic regression; the impact of SRP on mortality in self-reported severe headache or migraine patients was determined via Cox proportional hazards modeling.
Task 1: Migraine risk prediction. The objective was to classify participants as having self-reported severe headache or migraine (label = 1) or not (label = 0), based on self-reported severe headache or migraine in the prior three months. A total of 11,861 participants were included, with 2,355 in the migraine group and 9,506 in the control group (no self-reported severe headache or migraine). The dataset was divided 70% for training (n = 8,302) and 30% for testing (n = 3,559) using stratified random sampling. The baseline features of the training set and test set are shown in Tables S1 and S2. Feature selection was performed using the Boruta algorithm. 17 Nine classifiers—XGBoost, CatBoost, Decision Tree, Multilayer Perceptron (MLP), Support Vector Machine (SVM), Gradient Boosting Decision Tree (GBDT), Adaptive Boosting (AdaBoost), LightGBM, and Random Forest (RF)—were employed. SMOTE was applied exclusively to the training set after this split; the testing set was left completely untouched to ensure unbiased evaluation. For the 10-fold cross-validation performed on the training data, SMOTE was applied independently within each fold—that is, only the training portion of each fold was resampled, while the validation portion retained its original class distribution. This pipeline-based approach ensured that synthetic minority-class samples generated by SMOTE did not leak into the validation or testing sets. The SRP score and its eight components were included as predictive features alongside demographic, clinical, and laboratory variables. Continuous predictors were not standardized, as tree-based models are insensitive to feature scaling; categorical variables were label-encoded. Hyperparameters were set to library defaults (XGBoost: n_estimators = 200; max_depth = 6); systematic optimization was not performed, as the primary focus was SHAP-based interpretability. Model performance was measured by accuracy, F1-score, recall, specificity, and the Area Under the ROC Curve (AUC). Model calibration and clinical value were assessed via calibration curves and Decision Curve Analysis (DCA), respectively. Feature contributions to the model predictions were interpreted via the SHAP approach. 18 We have completed the TRIPOD-AI checklist and uploaded it as supplementary file as requested.
Task 2: All-cause mortality prediction among migraine patients. The objective was to predict the time-to-death outcome among 2,351 self-reported severe headache or migraine patients with a median follow-up of 206 months, handling both death events and censored observations (including survival beyond the follow-up period and loss to follow-up) using survival analysis techniques. The dataset was divided 70% for training (n = 1,645) and 30% for testing (n = 706) using stratified random sampling. The baseline features of the training set and test set are shown in Tables S3 and S4. Feature selection was conducted using Lasso regression, which performs feature compression and dimensionality reduction via L1 regularization. Four machine learning algorithms—Accelerated Failure Time (AFT) model, SVM, Random Survival Forest (RSF), and GBDT—were used to construct survival prediction models. Model performance was assessed at the median follow-up time point (206 months). For each patient, the survival model predicted the probability of death at 206 months. Patients were classified as death events (observed death within the follow-up period) or non-events (survival beyond 206 months or censoring prior to 206 months) at this time point. Standard binary classification metrics were then applied: the predicted death probabilities at 206 months were used to construct the ROC curve and compute the AUC; sensitivity, specificity, and accuracy were calculated using the default 0.5 probability threshold. DeLong’s test was applied to the paired ROC curves at the 206-month time point to compare AUC differences between models. Model stability was further assessed via 10-fold cross-validation, and SHAP analysis was used to clarify variable effects on predictions.
Predictor and outcome data were collected simultaneously in the cross-sectional survey; therefore, blinding of outcome assessors to predictor data was not applicable.
All tests were two-tailed with an alpha level of 0.05 set for determining statistical significance. All statistical analyses were carried out with R (version 4.5.1), Python (version 3.9.12), and DecisionLinnc (version 1.0). 19
Results
Characteristics of the study population
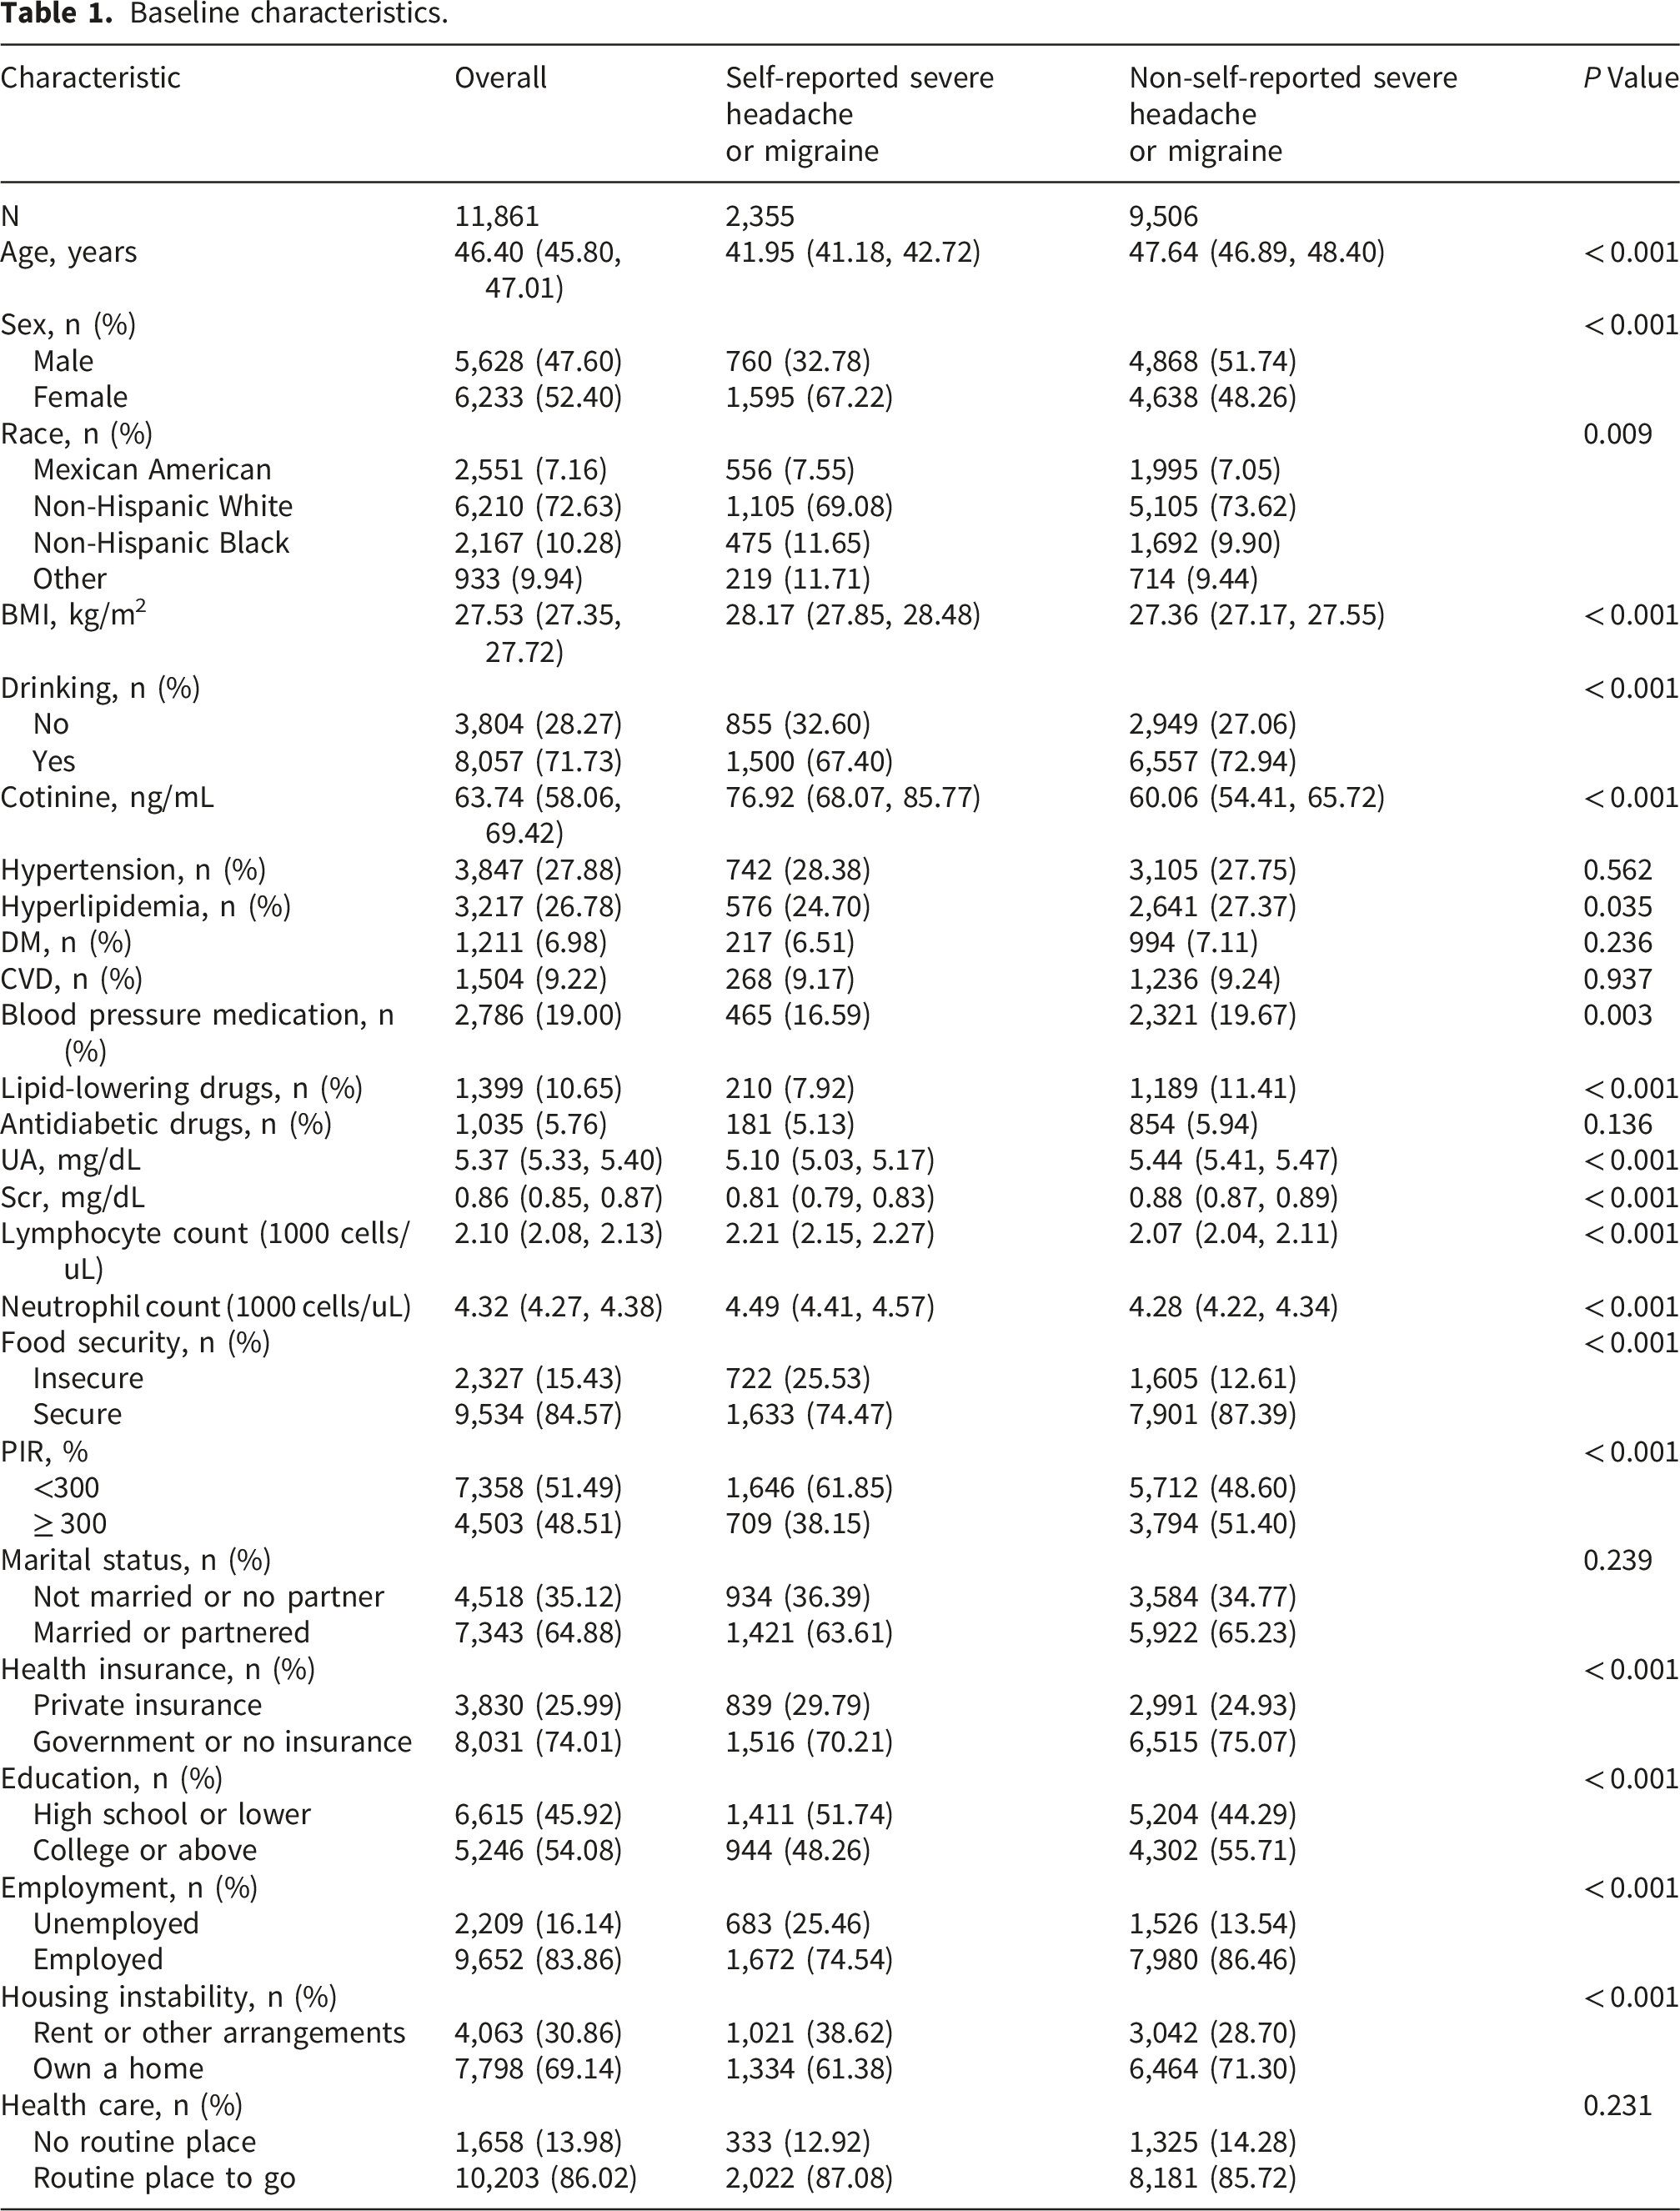
Baseline characteristics.
Association between SRP and self-reported severe headache or migraine risk
Association between SRP and self-reported severe headache or migraine prevalence.
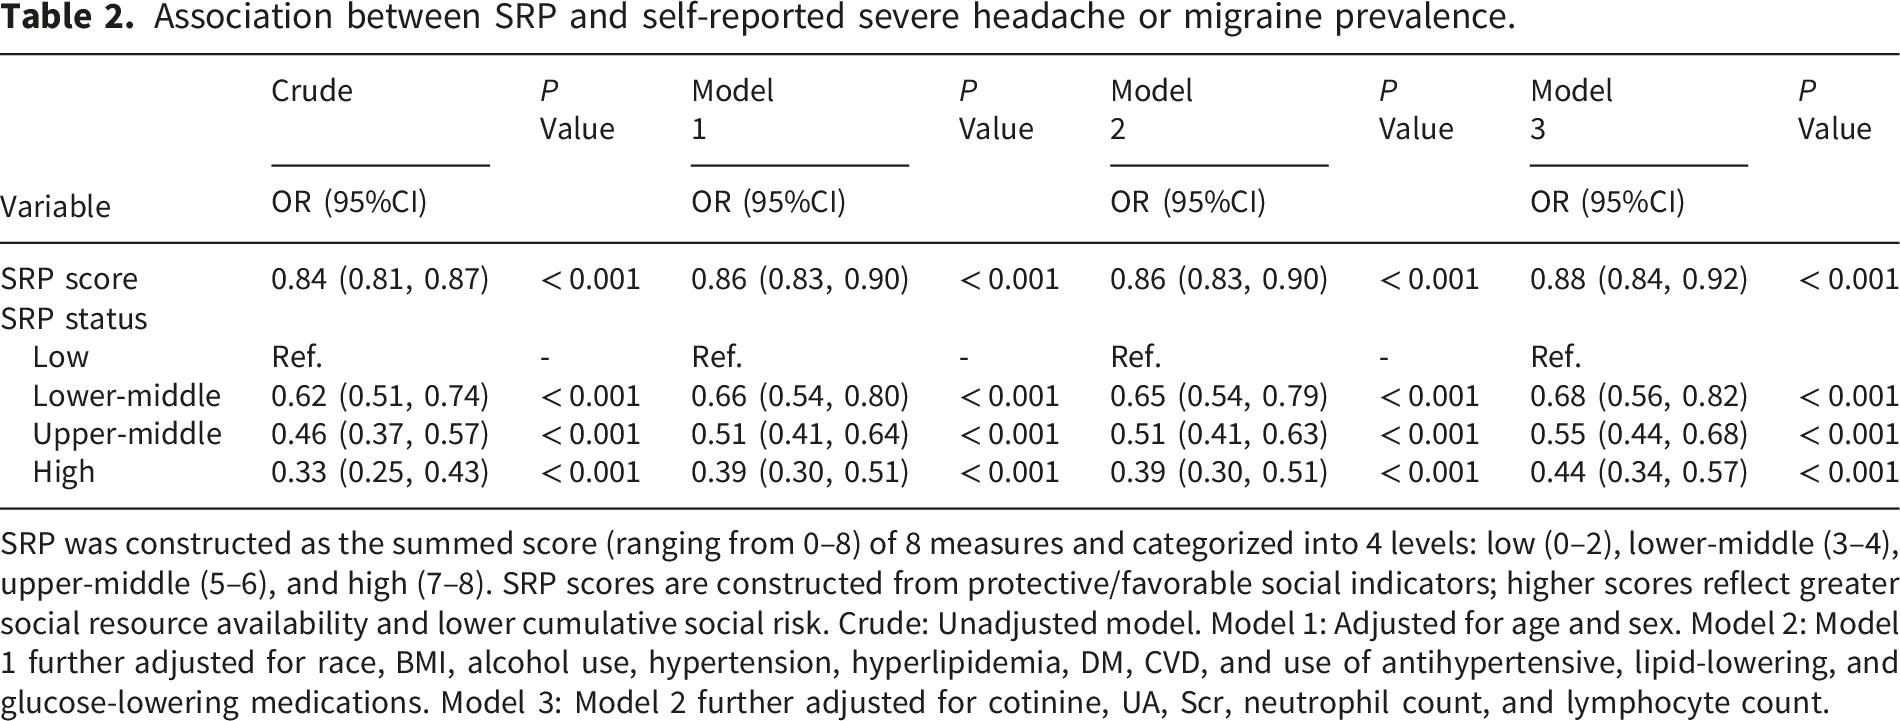
SRP was constructed as the summed score (ranging from 0–8) of 8 measures and categorized into 4 levels: low (0–2), lower-middle (3–4), upper-middle (5–6), and high (7–8). SRP scores are constructed from protective/favorable social indicators; higher scores reflect greater social resource availability and lower cumulative social risk. Crude: Unadjusted model. Model 1: Adjusted for age and sex. Model 2: Model 1 further adjusted for race, BMI, alcohol use, hypertension, hyperlipidemia, DM, CVD, and use of antihypertensive, lipid-lowering, and glucose-lowering medications. Model 3: Model 2 further adjusted for cotinine, UA, Scr, neutrophil count, and lymphocyte count.
Table S5 presents correlational analyses of the eight SRP components with self-reported severe headache or migraine risk. In the multivariable-adjusted models, the following factors demonstrated significant inverse associations with self-reported severe headache or migraine risk: food security, stable housing conditions, employment status, private health insurance coverage, higher education level, and a household poverty-income ratio ≥ 300%. Table S6 presents stratified analyses, indicating significant interaction effects (P < 0.05) within subgroups defined by sex, race, hypertension, and CVD. In contrast, interaction effects did not reach statistical significance in subgroups stratified by age, BMI, or DM status.
Baseline characteristics of self-reported severe headache or migraine patients
Table S7 depicts baseline attributes of the self-reported severe headache or migraine cohort (n=2,351) across SRP strata. The high SRP (having more social resources) group differed from the low SRP (having fewer social resources) group by older mean age and higher proportion of Non-Hispanic White individuals. Regarding comorbidities, the High SRP group exhibited a higher prevalence of hyperlipidemia but lower prevalences of DM and CVD (P < 0.05). Serum cotinine levels, neutrophil counts, and lymphocyte counts were significantly lower in the high SRP (having more social resources) group (P < 0.05). A steep inverse relationship emerged between SRP levels and mortality, falling from 19.11% to 8.69% across the SRP spectrum (P < 0.001). Sex, BMI, alcohol use, hypertension, and UA showed no significant variation across SRP groups.
Association between SRP and mortality in self-reported severe headache or migraine patients
During the median 206-month follow-up (IQR: 187-224), 471 deaths occurred. Kaplan-Meier survival stratification by SRP levels in Figure 1 shows the high SRP group maintained optimal survival probability. Kaplan-Meier curves.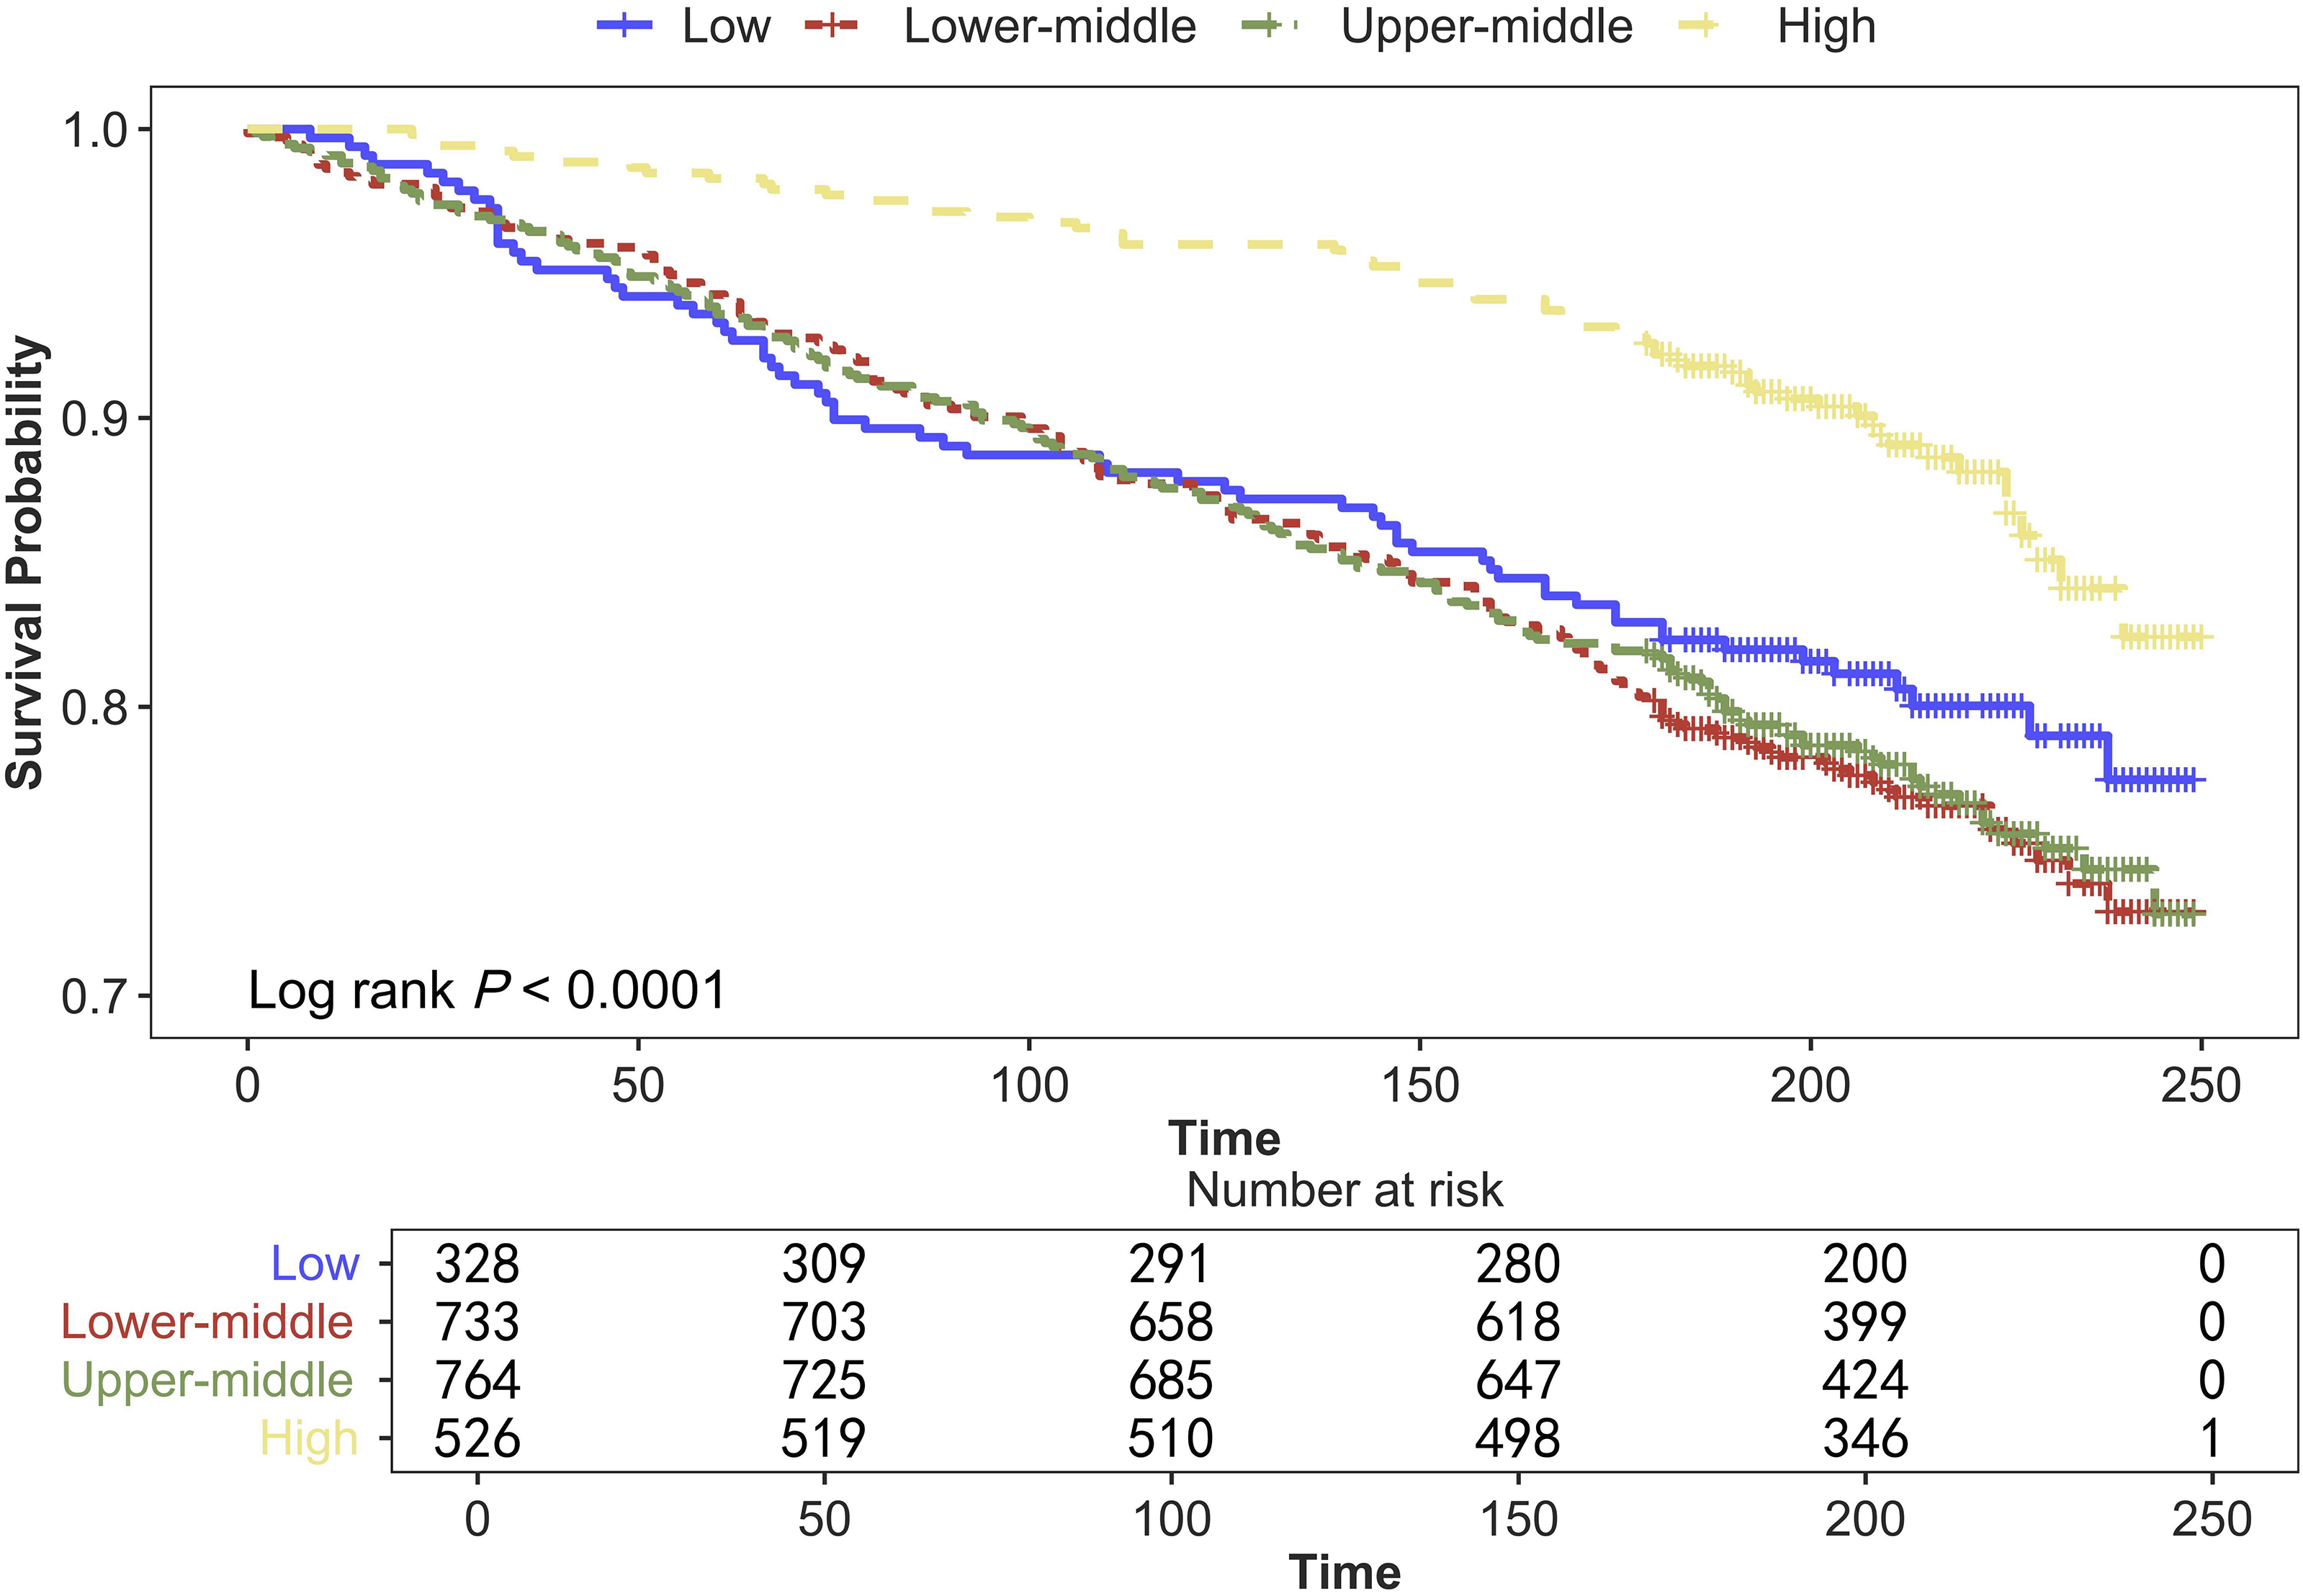
Association between SRP and mortality in self-reported severe headache or migraine patients.
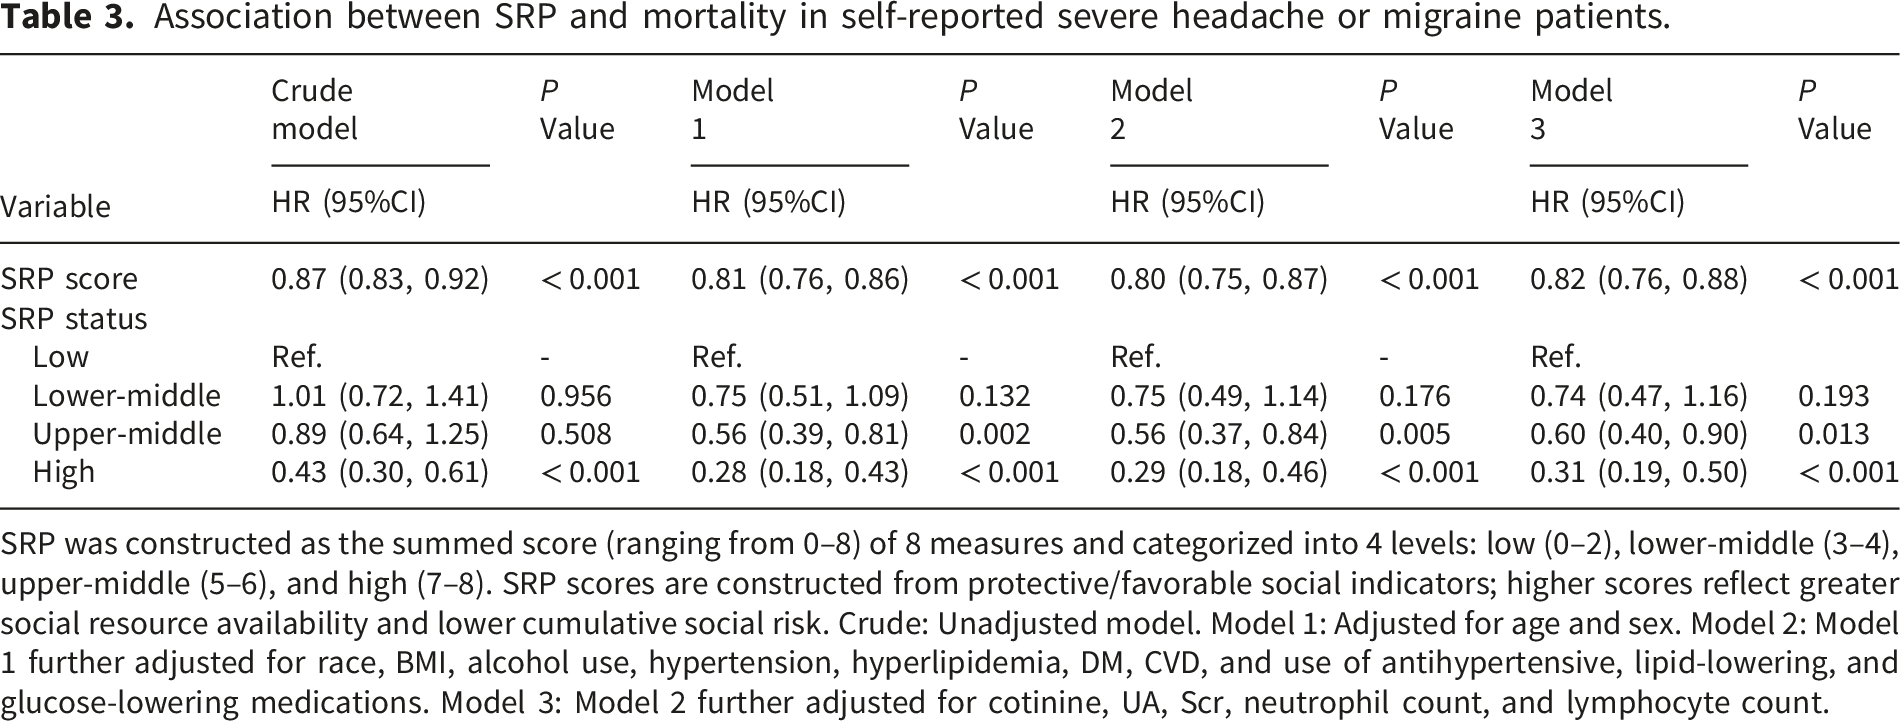
SRP was constructed as the summed score (ranging from 0–8) of 8 measures and categorized into 4 levels: low (0–2), lower-middle (3–4), upper-middle (5–6), and high (7–8). SRP scores are constructed from protective/favorable social indicators; higher scores reflect greater social resource availability and lower cumulative social risk. Crude: Unadjusted model. Model 1: Adjusted for age and sex. Model 2: Model 1 further adjusted for race, BMI, alcohol use, hypertension, hyperlipidemia, DM, CVD, and use of antihypertensive, lipid-lowering, and glucose-lowering medications. Model 3: Model 2 further adjusted for cotinine, UA, Scr, neutrophil count, and lymphocyte count.
Component-wise analysis revealed seven SRP factors with significant mortality protection: food security, housing stability, employment, private insurance, higher education, marriage, and PIR ≥300% (fully adjusted model; Table S8). Subgroup and interaction analyses were conducted for age, sex, race, BMI, hypertension, DM, and CVD (Table S9). The results indicated no significant interaction effects across all subgroups (P for interaction > 0.05).
Feature selection for the prediction models
This study initially applied the Boruta feature selection algorithm to identify predictor variables significantly associated with self-reported severe headache or migraine. The analysis indicated that all input variables were identified as having predictive value and were therefore retained (Figure 2). Feature selection for self-reported severe headache or migraine prediction using the Boruta algorithm.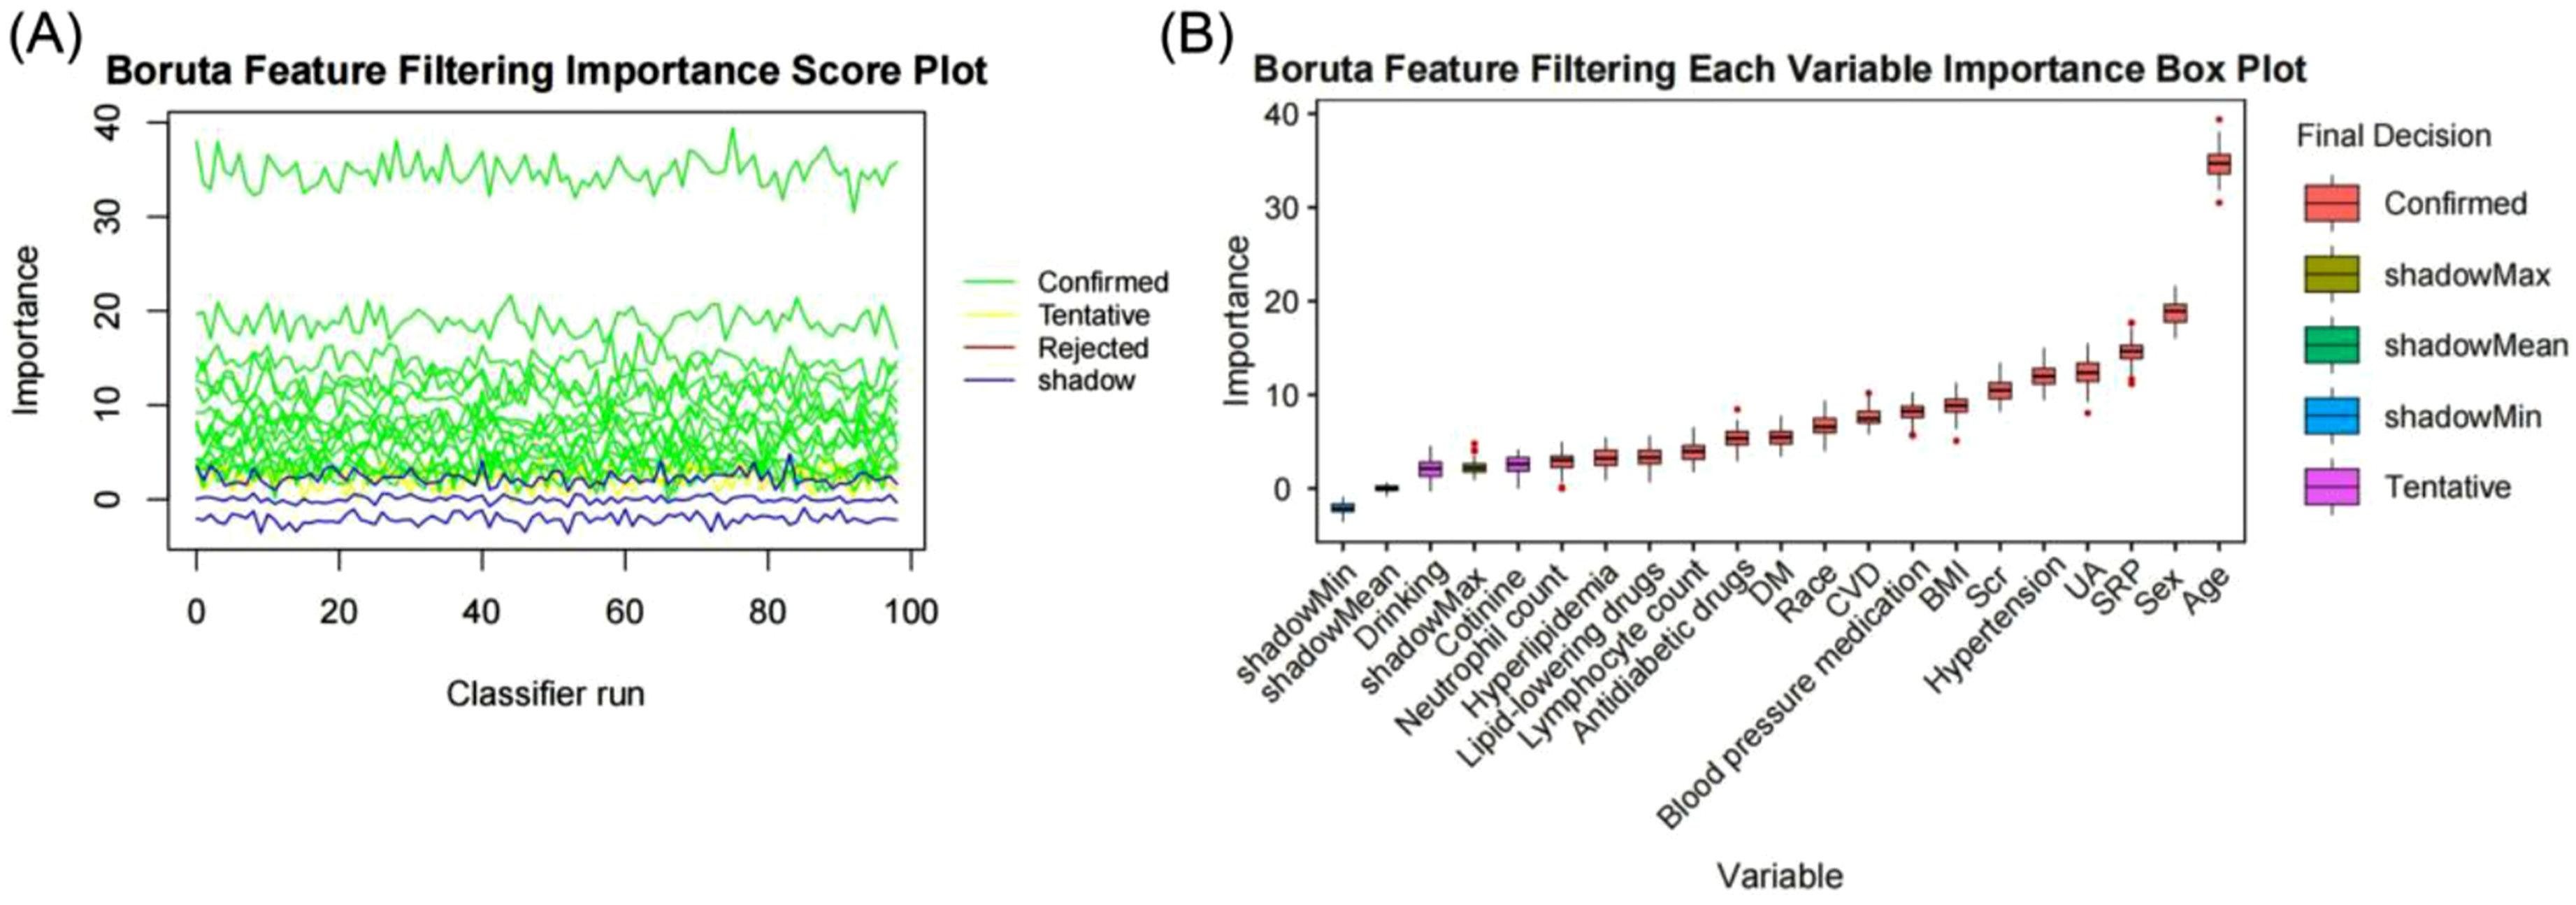
Lasso survival regression was applied to select features for predicting all-cause mortality in self-reported severe headache or migraine patients. Final model selection did not retain BMI, race, alcohol use, hypertension, hyperlipidemia, related medications, or lymphocyte/neutrophil counts as predictors (Figure S2).
Model performance comparison
We constructed a range of machine learning models to examine SRP’s predictive accuracy for both self-reported severe headache or migraine risk and mortality outcomes. For self-reported severe headache or migraine prediction, a comparative analysis of nine algorithms (Table S10) revealed that the XGBoost model demonstrated the most outstanding performance. This model not only achieved the highest AUC (AUC = 0.732, 95%CI: 0.712–0.753, Figure 3(a)), but its calibration curve also indicated acceptable calibration in the internal test set (Figure 3(b)). All models showed clinical utility throughout various threshold probabilities in DCA, particularly the XGBoost model which achieved modest net benefit in the internal evaluation (Figure 3(c)). Validation through 10-fold cross-validation confirmed the model’s internal consistency and stable internal performance (Figure 3(d)). To assess the impact of SMOTE oversampling, we performed a sensitivity analysis by retraining all nine classifiers on the original imbalanced training set without SMOTE (Figure S3). The test AUC of XGBoost dropped to around 0.708 from 0.732 with SMOTE, indicating that SMOTE helps alleviate the adverse effects of class imbalance on model performance. Performance comparison of the nine machine learning models. (a) ROC curves. (b) Calibration curves for each model. (c) Comparison of model net benefit. (d) 10-fold cross-validation results.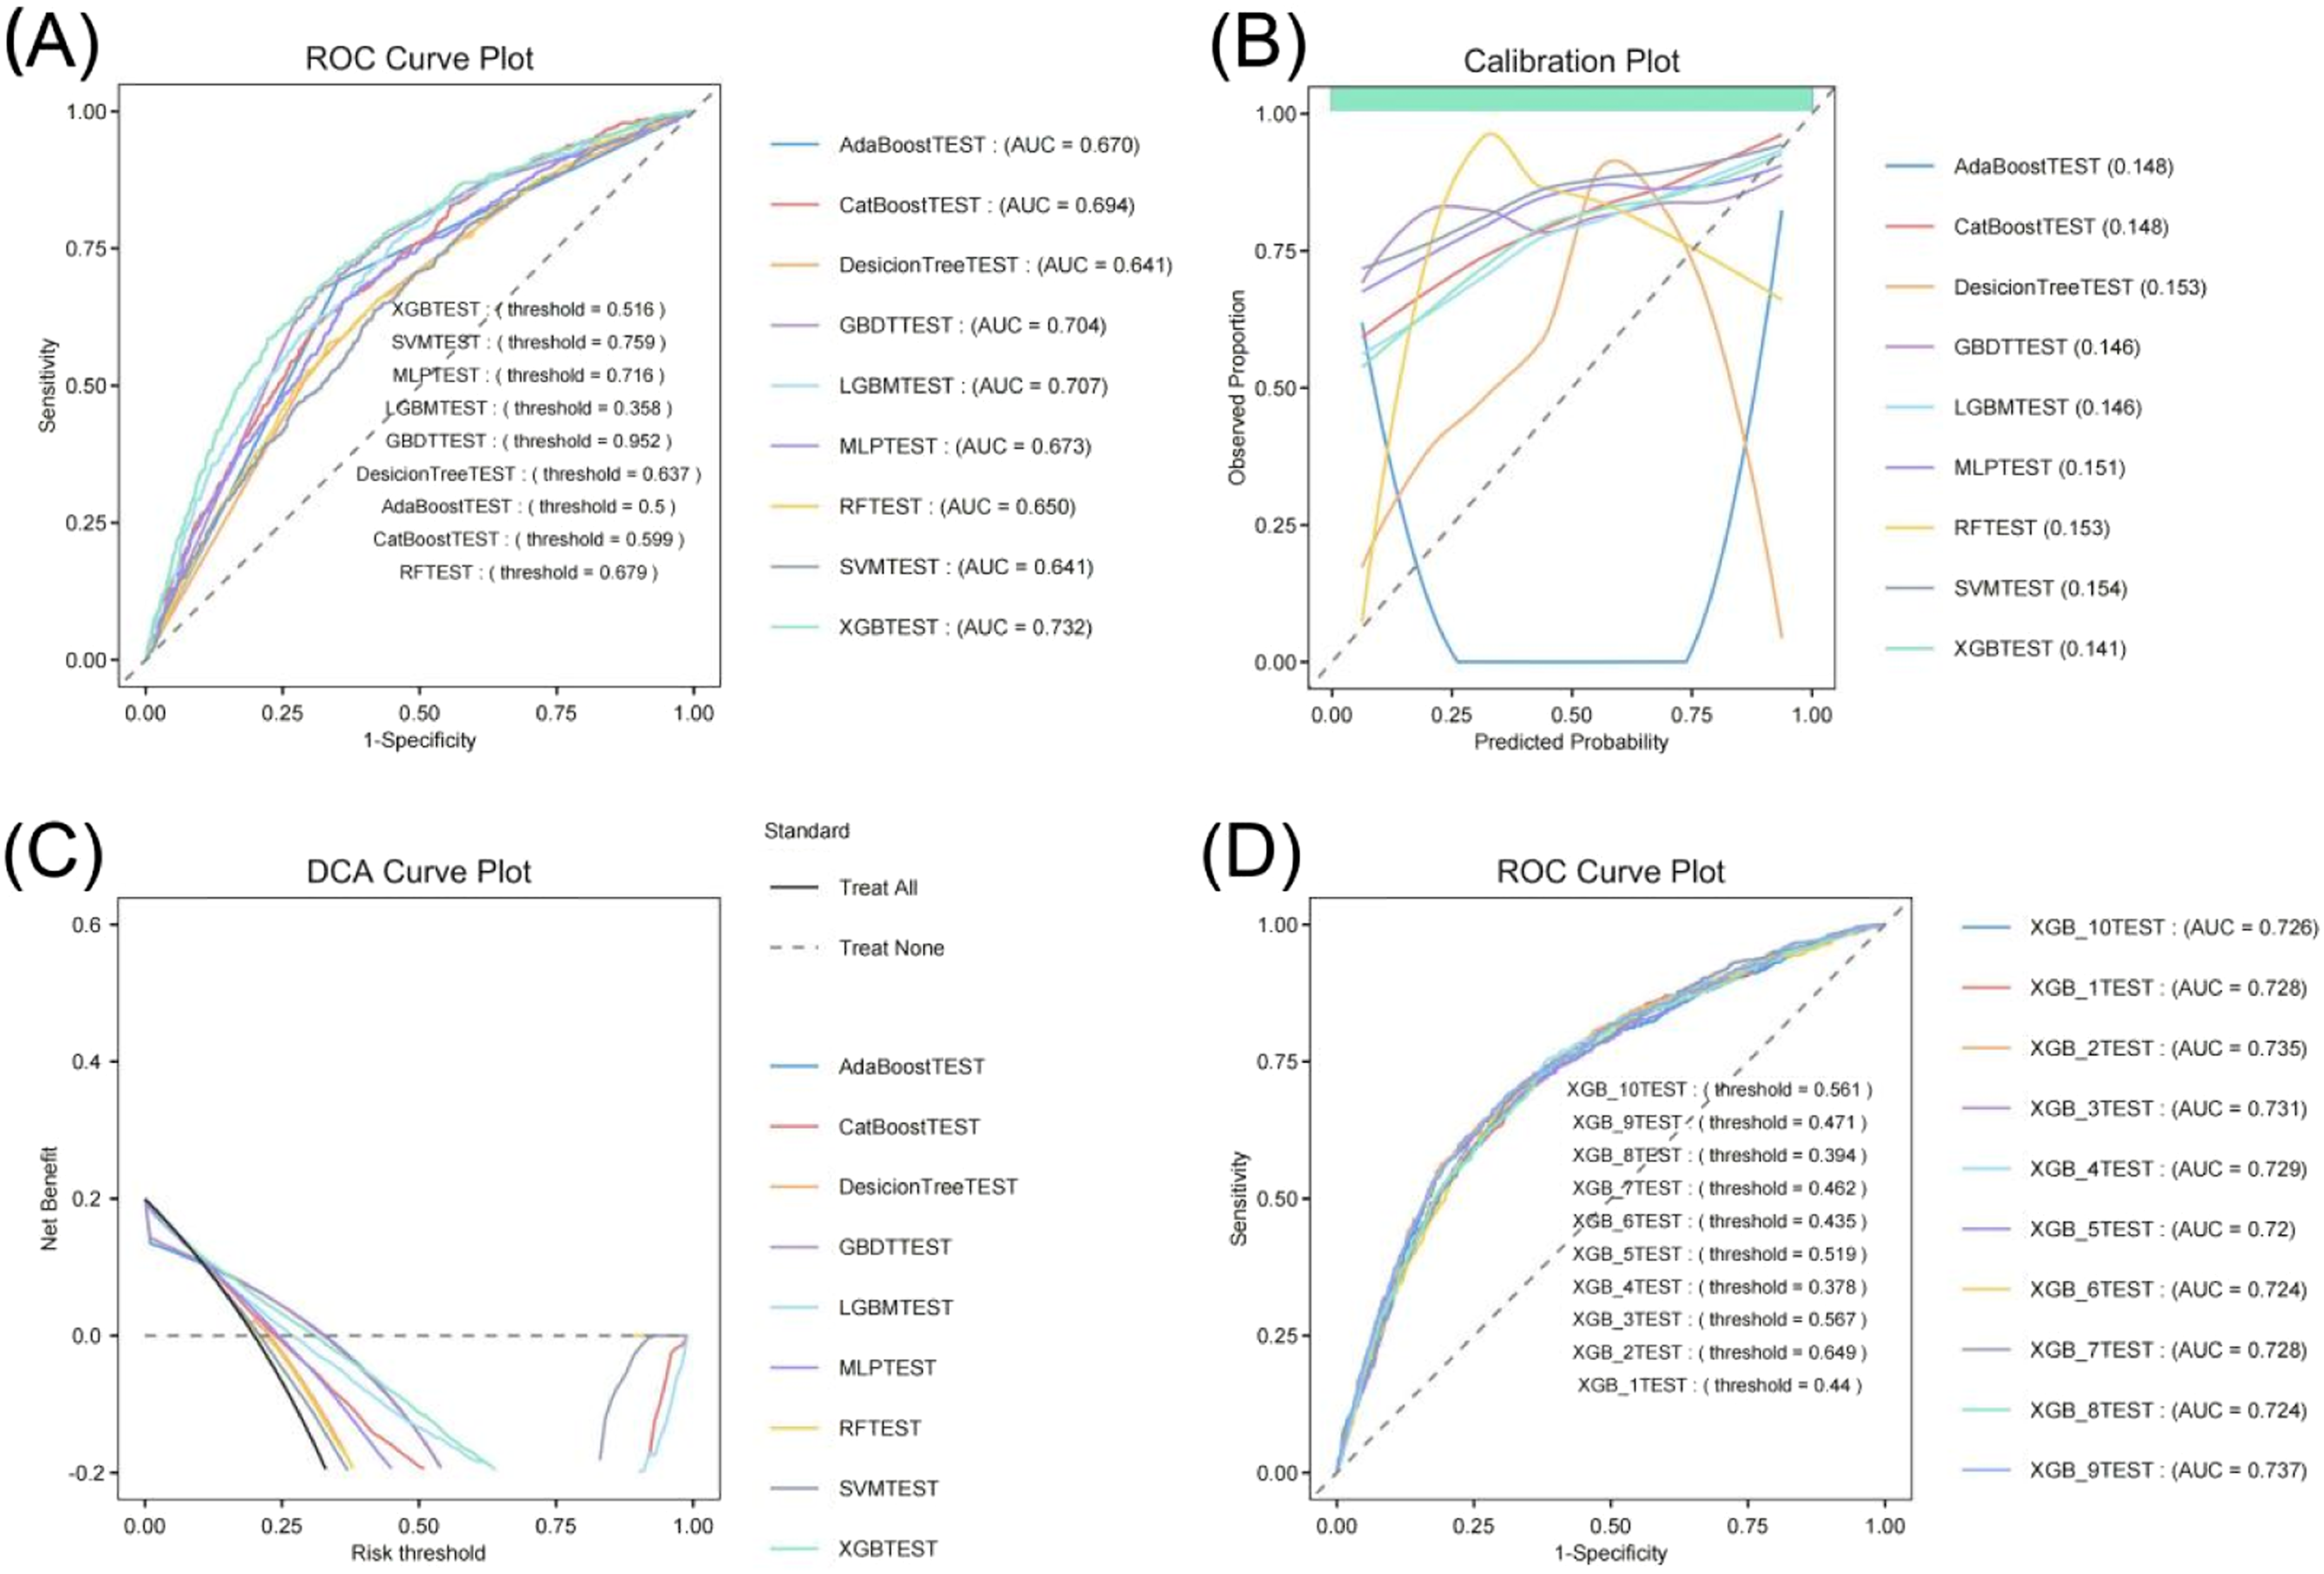
Comparative analysis of four survival models identified RSF as optimal for mortality prediction (AUC = 0.882) (Table S11, Fig. S4A). Model evaluation confirmed RSF’s robust predictive stability per the calibration curve (Figure S4B) and its optimal clinical net benefit via DCA (Fig. S4C). Both cross-validation and Delong’s test supported the RSF model’s robustness and superior predictive performance compared to alternative approaches (Figure S4D, Table S12).
Interpretation of optimal machine learning models using SHAP
The SHAP method was applied to interpret the prediction mechanisms of the optimal machine learning models, helping to reveal the contribution of each feature variable to the predictions. In the XGBoost model for self-reported severe headache or migraine prediction, the feature importance ranking (Figure 4(a)) and beeswarm plot (Figure 4(b)) identified age, Scr, SRP, cotinine level, lymphocyte count, and UA as the six most important variables influencing the prediction outcome. The SHAP dependence plot (Figure 4(c)) further illustrated the relationship between SRP and the model output: a decrease in the SRP value was associated with an increase in the SHAP value, indicating that a worse social risk profile is associated with a higher predicted probability of self-reported severe headache or migraine occurrence. SHAP analysis of the XGBoost model for self-reported severe headache or migraine prediction. (a) SHAP feature importance plot; (b) SHAP beeswarm plot; (c) SHAP dependence scatter plot.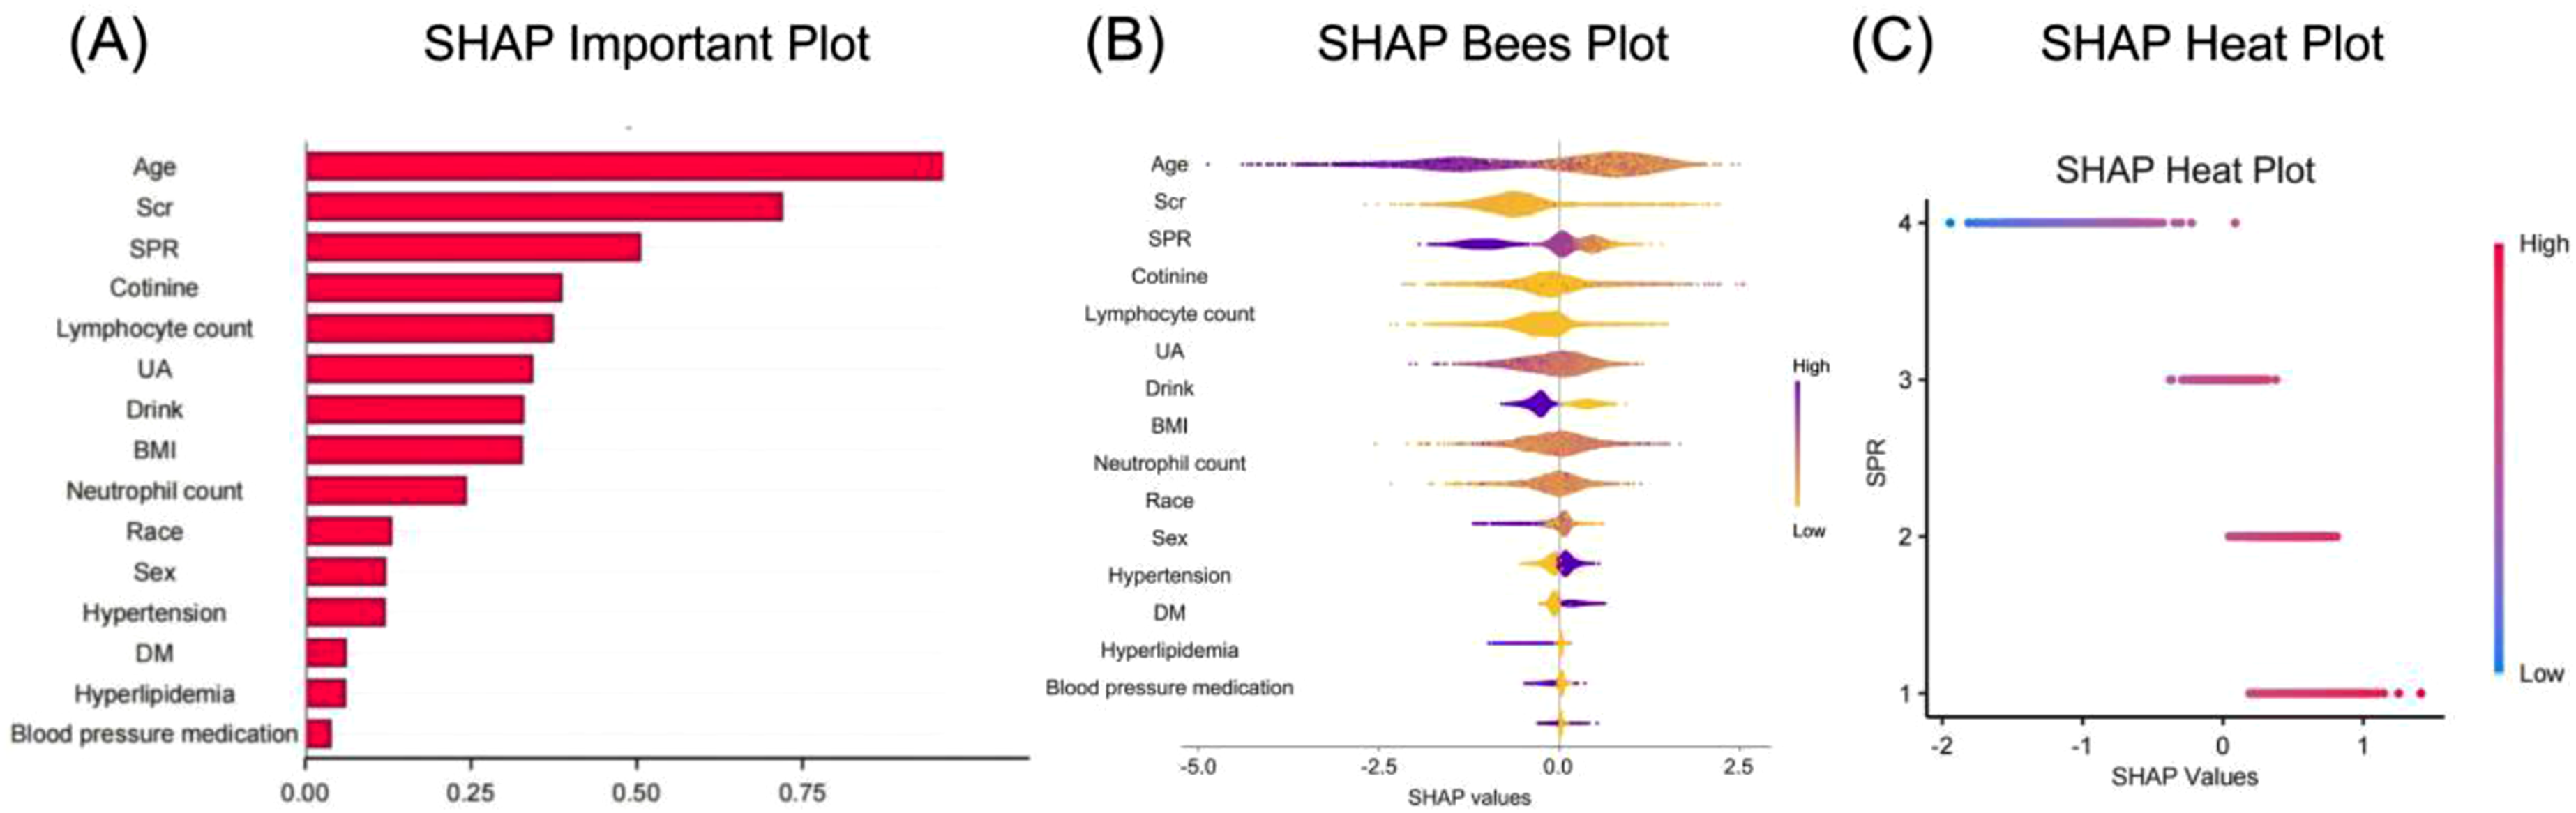
In the RSF model for all-cause mortality prediction, SHAP analysis identified age, CVD, cotinine, Scr, DM, and SRP as the six key predictive features (Fig. S5A, S5B). Similarly, the SHAP dependence plot (Fig. S5C) showed that a decrease in SRP was associated with an increase in the SHAP value, suggesting that individuals with a poorer social risk profile had a significantly higher predicted mortality risk.
Discussion
This comprehensive analysis revealed an inverse association between SRP and both self-reported severe headache or migraine prevalence and all-cause mortality. Having 7-8 favorable SRP indicators corresponded to approximately 56% lower self-reported severe headache or migraine risk and a striking 69% mortality risk reduction compared to the 0-2 indicator group. Interaction analyses demonstrated that these associations remained consistent across subgroups defined by various demographic and clinical characteristics. The evidence strongly suggests SRP’s vital role in self-reported severe headache or migraine management and all-cause mortality risk assessment. The predictive models constructed using algorithms such as XGBoost, RF, and SVM, along with their ROC curve analyses, further confirm the practical value of SRP in predicting self-reported severe headache or migraine risk and associated mortality.
Positioned as the world’s second leading disability source, migraine contributes 5.6% to the global disease burden. 20 The age distribution of this disorder is distinct, peaking in mid-life (40-50 years) before gradually declining. 21 Our data are consistent with this pattern, showing a significantly higher self-reported severe headache or migraine prevalence among individuals under 60 years compared to older adults (25.6% vs. 10.7%). The significant role of socioeconomic factors in migraine epidemiology has been recognized since 1992. 21 A well-established connection exists between low socioeconomic status (SES) and both poor health outcomes and heightened mortality risk.22–25 SES influences migraine management outcomes by affecting factors such as healthcare access and treatment adherence, and obesity may exacerbate this situation. Studies have shown that even after adjusting for multiple confounders, low SES (composite score of education, income, and occupation) remains an independent risk factor for headache disorders. Furthermore, individuals with both low SES and obesity constitute a “double-high-risk group,” whereas their counterparts with medium-high SES and obesity do not show a similarly elevated risk. 26 This suggests that SES may modulate the association between obesity and headache through mechanisms like resource access (e.g., healthcare opportunities, health literacy) and living environment (e.g., access to healthy food). Higher SRP predicted reduced self-reported severe headache or migraine risk independent of obesity status in subgroup analyses. SRP’s protective effect against mortality was exclusively observed in obese individuals (BMI ≥30 kg/m2). This finding suggests that future headache prevention and control strategies should prioritize populations with low SES, especially those with concurrent obesity, requiring integrated interventions combining weight management and health education to mitigate the dual socio-biological risk.
Current assessment of social risks in migraine research predominantly relies on single SES indicators 27 or disparate social factors.28–30 To establish a more comprehensive evaluation framework, Li et al. recently proposed the SRP as a composite indicator encompassing multidimensional social risks. 13 Even with subsidized access, higher SES patients remained more likely to receive CGRP monoclonal antibodies, indicating socioeconomic barriers in migraine treatment utilization. 31 The Canadian Longitudinal Study on Aging further confirmed that low SES, rural residence, and limited healthcare resources are core drivers of health disparities in migraine among middle-aged and older adults. 27 Research involving employees in the Malaysian banking sector revealed that individuals with headache disorders not only endure significant work and economic losses but also experience guilt regarding sickness absences, creating a vicious cycle. 32 Through an integrated SRP metric, we identified independent associations between declining social risk scores and both heightened self-reported severe headache or migraine risk and impaired clinical outcomes. By applying nine machine learning algorithms to predict disease risk and four algorithms to assess mortality risk, the models demonstrated stable internal performance. The model is intended for use by healthcare professionals with access to standard demographic, clinical, and social determinant data; no specialized expertise in machine learning is required for operational use.
Analysis in this study revealed that most SRP component indicators were significantly associated with self-reported severe headache or migraine risk and mortality. Particularly prominent factors included food insecurity, unemployment, rented housing, lack of private insurance, low educational attainment, and a low PIR. Marital status showed significant association with mortality, with unmarried individuals facing increased risk. These outcomes are consistent with prior evidence linking poor living environments and nutritional barriers to heightened headache risk.10,30,33 A nationwide Italian survey demonstrated a significant positive correlation between insufficient income and migraine risk. 28 US data demonstrates a two-fold higher migraine rate in uninsured versus privately insured individuals, and 1.5-times lower evidence-based treatment access in publicly insured groups. 29 Inadequate treatment for migraine remains a concern in several low- and middle-income country settings, 34 although the extent of this treatment gap varies considerably across regions and healthcare systems. Untreated episodic migraine carries progression risk to chronicity with significantly increased psychiatric co-morbidities and complication rates.35–37 Notably, healthcare professionals often overlook the impact of structural social factors on treatment outcomes, attributing factors like missed follow-ups and medication non-adherence to patient attitude rather than underlying issues such as poverty and transportation barriers. 38
The pathogenesis of migraine involves complex interactions between genetic predisposition, neurological dysfunction, and environmental triggers. Recent investigations show central nervous system functional changes increase trigeminovascular reactivity, prompting inflammatory mediator release and meningeal neuroinflammation - a key pathological process in migraine development. 39 Multiple mechanisms—including neurotransmitter imbalance, inflammatory activation, metabolic dysregulation and oxidative stress—jointly underlie pain signal generation and maintenance. External stimuli such as stressful events, hormonal fluctuations, or environmental changes can modulate these physiological processes, thereby acting as precipitating factors for clinical migraine attacks. 39 Obesity is significantly linked to both migraine progression and disease severity escalation. 40 The two conditions engage in a bidirectional vicious cycle through multiple biological pathways: the chronic inflammatory state associated with obesity releases pro-inflammatory cytokines that can enhance the excitability of the trigeminovascular system and lower pain thresholds. Simultaneously, shared dysregulation in neurotransmitter systems and feeding regulation mechanisms exacerbates pain perception while promoting energy metabolism imbalance and weight gain, establishing a “pain-metabolism” comorbidity cycle. Furthermore, dysregulated adipokine secretion, autonomic nervous system dysfunction, and shared psychobehavioral factors intertwine to collectively construct a pathological network where obesity and migraine mutually exacerbate each other. 41
Compared to previous studies constrained to single social variables, this research employs a multidimensional SRP framework to comprehensively assess an individual’s overall status across socioeconomic resources, living conditions, and healthcare accessibility. Our analysis demonstrates that SRP, as a composite indicator, more fully captures the cumulative impact of social factors on both self-reported severe headache or migraine risk and all-cause mortality risk. In clinical practice, integrating SRP assessment into routine screening for migraine patients holds significant importance for identifying high-risk individuals lacking social resources. Risk stratification based on SRP levels can guide the precise allocation of medical resources and inform the development of differentiated intervention strategies tailored to patients’ varying social needs.
Our findings must be interpreted in light of several study limitations. First, migraine diagnosis in this study relied on participant self-report of “severe headache or migraine” in the prior three months rather than physician-confirmed diagnosis according to ICHD-3 criteria. This may result in the inclusion of individuals with severe non-migrainous headaches and the exclusion of migraine cases not captured by this single survey question, potentially introducing misclassification bias. However, this self-report approach is standard practice in large-scale population-based surveys such as NHANES, and any misclassification is likely nondifferential with respect to SRP status, which would bias effect estimates toward the null. Second, the SRP’s scope remains limited by excluding social support and environmental factors, and its measurements only partially align with Healthy People 2030’s theoretical foundations. Third, causal interpretation is limited by the observational study design. Fourth, SRP was measured only at baseline and treated as a time-fixed covariate; participants’ social circumstances may have changed during the 206-month follow-up. Thus, our estimates reflect the association between baseline SRP and subsequent all-cause mortality—a broad endpoint capturing deaths from any cause—rather than the effect of dynamic SRP trajectories or migraine-specific prognosis. Fifth, the NHANES 1999–2004 cycles were selected because they represent the only consecutive survey periods containing the complete migraine assessment module; after 2004, NHANES discontinued the collection of comparable migraine-related data, precluding the use of more recent cycles. While this dataset offers the advantage of extended mortality follow-up, its temporal distance from the present may affect the generalizability of findings to contemporary populations. Sixth, following the PROBAST+AI framework, we acknowledge the following risk of bias considerations: the risk of bias is low for participant selection (nationally representative NHANES sampling) and predictor measurement (standardized protocols); the primary risk of bias lies in outcome ascertainment, as self-reported severe headache or migraine is not equivalent to an ICHD-3 clinical diagnosis. In the analysis domain, hyperparameters were not systematically optimized, and the machine learning models were trained without incorporating complex NHANES survey design features (sampling weights, strata, PSUs), reflecting the current technical limitations of standard ML libraries. Finally, and most critically, this study lacks external validation in an independent dataset. The reported AUC (0.732) reflects only internal validation within NHANES 1999–2004; while CV-test concordance (0.728 vs. 0.732) indicates internal stability, it does not establish generalizability to other populations, time periods, healthcare settings, or clinically confirmed migraine cohorts. The machine learning results should therefore be interpreted as exploratory feature importance analyses rather than validated clinical prediction tools.
Conclusion
The study demonstrates that lower baseline SRP scores were associated with higher self-reported severe headache or migraine burden and higher all-cause mortality risk.
The exploratory analysis suggests that SRP may serve as a useful indicator for risk stratification, though its predictive utility requires confirmation through external validation. Clinical integration of SRP assessment warrants further investigation to enhance personalized treatment planning.
Supplemental material
Supplemental material - The association between social risk profile and self-reported severe headache or migraine with all-cause mortality risk: A machine learning-based prediction model and interpretability analysis
Supplemental material for The association between social risk profile and self-reported severe headache or migraine with all-cause mortality risk: A machine learning-based prediction model and interpretability analysis by Mengjie Zhao, Jing Cao, Zirong Li, Fang Lu, and Qiuyan Li in Digital Health.
Footnotes

Ethical considerations
The NHANES investigation obtained ethical clearance from the NCHS/CDC Institutional Review Board (Protocol #98-12).
Consent to participate
Written informed consent was collected from all individuals before their survey participation.
Consent for publication
NHANES data are publicly available and de-identified; no additional permissions are required for secondary analysis.
Author contributions
MZ: Writing – original draft, Software, Project administration. JC: Resources, Data curation, Investigation. ZL: Supervision, Methodology, Formal analysis, Visualization. FL: Writing – review & editing, Methodology, Validation. QL: Writing – review & editing, Conceptualization.
Funding
This study was supported by the Major Research Project of the Scientific and Technological Innovation Program of the China Academy of Chinese Medical Sciences (Grant No. CI2026A04710).
Declaration of conflicting interests
The authors declared the following potential conflicts of interest with respect to the research, authorship, and/or publication of this article: The authors confirm the absence of any competing interests.
Data Availability Statement
Research data are available from the corresponding author upon reasonable request.
Use of AI tools
No artificial intelligence tools were used in the development, analysis, or writing of this manuscript.
Guarantor
QL.
Supplemental material
Supplemental material for this article is available online.
References
Supplementary Material
Please find the following supplemental material available below.
For Open Access articles published under a Creative Commons License, all supplemental material carries the same license as the article it is associated with.
For non-Open Access articles published, all supplemental material carries a non-exclusive license, and permission requests for re-use of supplemental material or any part of supplemental material shall be sent directly to the copyright owner as specified in the copyright notice associated with the article.
