






Abstract
Background
Early risk stratification for critically ill cancer patients remains challenging, and conventional severity scores are frequently miscalibrated. We developed and externally validated an interpretable first-day (0-24 h) risk-reassessment model for ICU mortality during the index ICU stay.
Methods
We performed a retrospective dual-cohort study using MIMIC-IV for derivation/internal validation (n=9,532; training n=6,673, internal test n=2,859) and eICU-CRD for external validation (n=7,821) among adult cancer patients with an index ICU stay >=24 h. Candidate predictors were restricted to the first 0-24 h after ICU admission. LASSO selected sparse features, nine algorithms were benchmarked, and the final model was chosen by integrated assessment of discrimination, calibration, and decision-curve net benefit. Performance was evaluated using ROC-AUC, PR-AUC, sensitivity, PPV, F2, Brier score, ECE, calibration plots, and decision-curve analysis over p_t=0.01-0.50. TreeSHAP provided global, cohort-level, feature-level, and directional interpretation.
Results
ICU mortality rates were 9.45% in MIMIC and 7.39% in eICU. XGBoost was retained as the locked model. In the internal test set, XGBoost achieved ROC-AUC 0.864 (95% CI 0.844-0.885), PR-AUC 0.428, sensitivity 0.807, PPV 0.249, and F2 0.558. In eICU, performance remained stable (ROC-AUC 0.848, 95% CI 0.832-0.864; PR-AUC 0.367; sensitivity 0.794; PPV 0.192; F2 0.487). Calibration remained clinically acceptable, and decision-curve analysis showed positive net benefit across plausible thresholds. SHAP highlighted treatment-intensity indicators and acute physiologic stressors, including vasopressors, sedation, mechanical ventilation, HR_max, SpO2_min, BUN_max, potassium_max, and RR_max, without implying causal effects.
Conclusions
This LASSO-XGBoost-SHAP framework supports first-day reassessment after completion of the 24-h predictor window, subsequent monitoring prioritization, resource allocation, and goal-concordant decision-making in oncology ICUs. It should not be interpreted as an admission-time triage model.
Keywords
Introduction
The global burden of malignant tumors continues to increase. Driven by population aging, broader coverage of screening and early detection, and the expansion of systemic therapies—including immunotherapy and targeted agents—the absolute number and frequency of critically ill cancer patients admitted to intensive care units (ICUs) have risen steadily. 1 This population exhibits marked heterogeneity, with substantial variation in short- to intermediate-term outcomes, underscoring the pivotal role of risk stratification during the first 0–24 hours of ICU admission.2,3 Compared with the general ICU population, cancer patients often present with reduced organ reserve and treatment-related immunosuppression, accompanied by higher susceptibility to opportunistic infections and therapy-related toxicities, which contributes to heterogeneous early ICU trajectories.4–6 The coexistence of these factors results in highly variable and rapidly fluctuating clinical phenotypes, making outcomes difficult to capture with a single biomarker or one-time measurement. 2 Multicenter studies and systematic reviews consistently report persistently high mortality among critically ill cancer patients during both ICU and overall hospital stays.2,7 Furthermore, outcomes differ significantly across regions and tumor subtypes—most notably in hematologic malignancies—highlighting the influence of disease spectrum and healthcare resource availability on prognosis.8,9 Despite improvements in short-term outcomes in recent years, post-discharge intermediate survival (e.g., at 120 days or 1 year) remains unsatisfactory.9,10 This pattern—“overall improvement with substantial individual uncertainty”—emphasizes the need for precise early risk stratification during the initial 0–24 h of ICU stay. Earlier and more accurate identification of risk has the potential to directly influence decisions regarding treatment intensity, allocation of equipment and beds, resuscitation and limitation-of-care strategies, and goal-concordant communication with families. 11
In critical care, risk assessment has traditionally relied on generic severity scoring systems—such as the APACHE series, SAPS II/III, and SOFA—to quantify early illness severity, estimate in-hospital mortality, and provide risk adjustment in cohort studies and quality benchmarking.12–15 While these tools have proven valuable at the population level, their direct application to cancer ICU patients often results in two major mismatches. First, cancer-specific pathophysiology and treatment exposures—such as immune-related adverse events from immunotherapy, chemotherapy-induced myelosuppression, and the subtle impact of tumor burden and metastatic sites on organ function—are not adequately encoded, leading to insufficient risk correlation. 5 Second, models developed on historical cohorts with linear or additive structures frequently become misaligned with contemporary populations, manifesting as calibration drift and elevated standardized mortality ratios (SMRs) in external cohorts, thereby systematically underestimating true risk.2,7,16 In practice, acceptable discrimination may coexist with unstable calibration and inconsistent decision-analytic net benefit, limiting threshold-based bedside use.16,17 Without robust calibration and threshold-based evidence, conventional scores provide limited support for high-stakes decisions such as whether to escalate interventions, initiate limitation-of-care pathways, or reassess treatment intensity. 18
The rise of machine learning (ML) in critical care stems from its ability to capture high-dimensional, nonlinear, and interactive effects within a unified modeling framework. ML can integrate demographic characteristics, extreme values of vital signs and laboratory results within defined time windows, treatment exposures, and acute complications.19,20 In tasks such as sepsis, cardiac arrest, and multi-organ failure, methods including gradient boosting, random forests, and neural networks have repeatedly outperformed traditional regression in both discrimination and generalizability, and in some cases have improved workflows and outcomes in real-world deployment.21–23 However, a higher AUC does not automatically translate into bedside utility. 24 In practice, bedside usefulness depends on external validation, calibration, and decision-analytic net benefit—not discrimination alone.17,18,25 Moreover, opaque models lacking interpretability and transparent reporting struggle to gain consensus across clinical teams and to pass ethical or governance review. 26
Related work in oncology ICU mortality prediction
Recent retrospective studies have applied ML to short-term mortality prediction in oncology ICU populations, including general cancer ICU cohorts (e.g., CanICU) 27 and disease- or immune-status–specific cohorts such as lung cancer, 28 critically ill elderly colorectal cancer, 29 and immunocompromised ICU patients. 30 Across these studies, model classes have ranged from classical learners to gradient boosting and explainable ML, typically leveraging routinely available early ICU data within prespecified time windows. Despite encouraging discrimination, external validation remains limited in scope and reporting is heterogeneous, particularly regarding calibration, decision-analytic utility, and interpretability.31,32 Collectively, these gaps highlight the unmet need for a mortality risk prediction model in cancer ICUs that is generalizable, interpretable, and clinically deployable.
Open-access databases provide a “common testbed” for such research. The MIMIC database, derived from a single tertiary center, offers high-granularity electronic health records with structured data on vital signs, laboratory tests, diagnoses, and treatments, supporting model development and internal validation. 33 In contrast, the eICU database aggregates data from multiple hospitals and heterogeneous populations, providing a natural setting for independent external validation and cross-institutional generalizability assessment. 34 Building on these resources, the recent TRIPOD+AI and PROBAST+AI updates have established transparency and auditability as essential standards for modern prediction studies. These frameworks mandate clear reporting of data sources and time windows, variable definitions and handling of missingness, candidate selection and feature reduction strategies, and thresholding decisions, alongside parallel reporting of discrimination, calibration, and clinical net benefit. They further require independent external validation and, where necessary, prespecified recalibration strategies. 31 Data and code sharing via platforms such as PhysioNet can further enhance reproducibility and facilitate third-party auditing. 35 Recent reviews have highlighted how public ICU datasets enable standardized end-to-end pipelines encompassing development, internal validation, and external validation, offering a reproducible path for future work. 36 At the same time, interpretability has become a practical prerequisite for prediction models to enter clinical practice.37,38 Among current approaches, SHAP (Shapley Additive Explanations) is grounded in the principles of consistency and additivity.39,40 For tree-based ensembles, the exact TreeSHAP algorithm enables a coherent interpretability chain across global (mean |SHAP|), cohort-level (beeswarm/distribution), and individual-level (waterfall/dependence) views, capturing directionality, relative feature weight, and nonlinear or threshold-like heterogeneity without implying causal effects.41,42 In critical care, machine-learning models based on high-frequency ICU data have been used for early prediction of circulatory failure 19 and dynamic, explainable mortality prediction in critically ill patients. 20 Technically, gradient boosting methods such as XGBoost offer robust handling of sparsity and approximate split finding, making them well suited to structured ICU data. When combined with prespecified sparse feature selection (e.g., via LASSO) and post hoc SHAP interpretation, this forms an executable pipeline—“LASSO for feature selection + XGBoost for modeling + SHAP for explanation.” In real-world ICU studies, this pipeline has already been applied to high-risk tasks such as respiratory failure and infection, with successful external validation and interpretable visualization.43,44
Against this background, we developed and externally validated an interpretable first-day (0–24 h) risk-reassessment model for ICU mortality during the index ICU stay among critically ill cancer patients. Candidate predictors were restricted to routinely available variables collected within the first 0–24 h after ICU admission. Using MIMIC-IV for model development/internal validation and eICU-CRD for independent external validation,33,34 we combined LASSO-based feature selection, benchmarked machine-learning algorithms, and SHAP-based interpretation, with model performance evaluated using discrimination, calibration, threshold-dependent metrics, and decision-curve analysis.16–18,24,45
Materials and methods
Data sources and study population
This was a retrospective, dual-database cohort study. The derivation and internal validation cohort was obtained from the publicly available MIMIC (Medical Information Mart for Intensive Care) database, which contains de-identified ICU records from a U.S. tertiary academic medical center. The external validation cohort was drawn from the eICU Collaborative Research Database, covering ICU admissions across multiple U.S. hospitals during 2014–2015. Both databases are fully de-identified, accessed under data use agreements, and exempt from informed consent by institutional review boards.
Inclusion criteria were as follows: (1) age ≥18 years; (2) first ICU admission during hospitalization (index ICU stay); (3) ICU length of stay ≥24 h to ensure complete capture of 0–24-h predictors; and (4) documented diagnosis or history of malignancy (solid or hematologic). Accordingly, the primary model was intended for first-day (0–24-h) risk reassessment rather than risk estimation at ICU admission, and ICU stays <24 h (including very early deaths or rapid discharges) were excluded. Exclusion criteria were missing the primary outcome, missing essential predictors, or inability to ascertain outcomes. To avoid duplication, only the index ICU stay was retained for patients with multiple admissions.
Based on these criteria, 12,040 first-time ICU cancer admissions were initially screened in MIMIC. After excluding 2,508 patients with ICU stay <24 h or age <18 years, 9,532 patients were included in the derivation cohort. The eICU external validation cohort comprised 7,821 eligible patients. The primary study endpoint was ICU mortality, defined as death during the index ICU stay; ICU discharge alive was considered survival. Sample-size considerations. No formal a priori sample-size or power calculation was performed because this retrospective database study used all eligible admissions identified from MIMIC-IV and eICU-CRD after application of the prespecified inclusion and exclusion criteria. Accordingly, the final derivation/internal-validation and external-validation sample sizes were determined by database availability rather than by prospectively specified enrollment targets. For descriptive context, the MIMIC cohort included 9,532 patients with 901 ICU deaths before the internal train-test split, and the eICU external validation cohort included 7,821 patients with 578 ICU deaths, while 27 candidate predictors were prespecified for model development.
Variable definitions and data preprocessing
Candidate predictors
Based on prior evidence and clinical feasibility, 27 candidate features available within the first 0–24 hours of ICU admission were prespecified to support first-day risk reassessment after completion of the 0–24-h data window and to avoid using information recorded after that window. These variables spanned six domains: 1. 2. 3. 4. 5. 6.
For time-dependent variables, the minimum or maximum value observed within the 0–24 h window was used. Binary intervention/medication variables were coded as “1” if exposure occurred at any point during that window. These extreme-value summaries and intervention indicators were included to capture the early clinical course and treatment intensity during day 1; accordingly, they support first-day risk reassessment and should not be interpreted as baseline risk markers or causal effects.
Data processing and missing values
Variable definitions, units, and coding were harmonized across databases, and binary variables were encoded as 0/1. Before imputation, variable-level missingness was quantified separately in the MIMIC-IV and eICU-CRD cohorts and is summarized in Supplementary Figure S2. Variables with more than 30% missingness were prespecified for exclusion; no candidate variable exceeded this threshold. The maximum pre-imputation missingness was 3.4% in MIMIC-IV and 10.4% in eICU-CRD. Missing values were handled using a preprocessing pipeline fitted in the derivation training set and then applied without refitting to the internal test and external validation cohorts. For the XGBoost pipeline, preprocessing consisted of median imputation and standardization; for benchmark models, preprocessing followed the model-specific procedures summarized in Supplementary Table S1.
Model development and internal validation
Feature selection (LASSO)
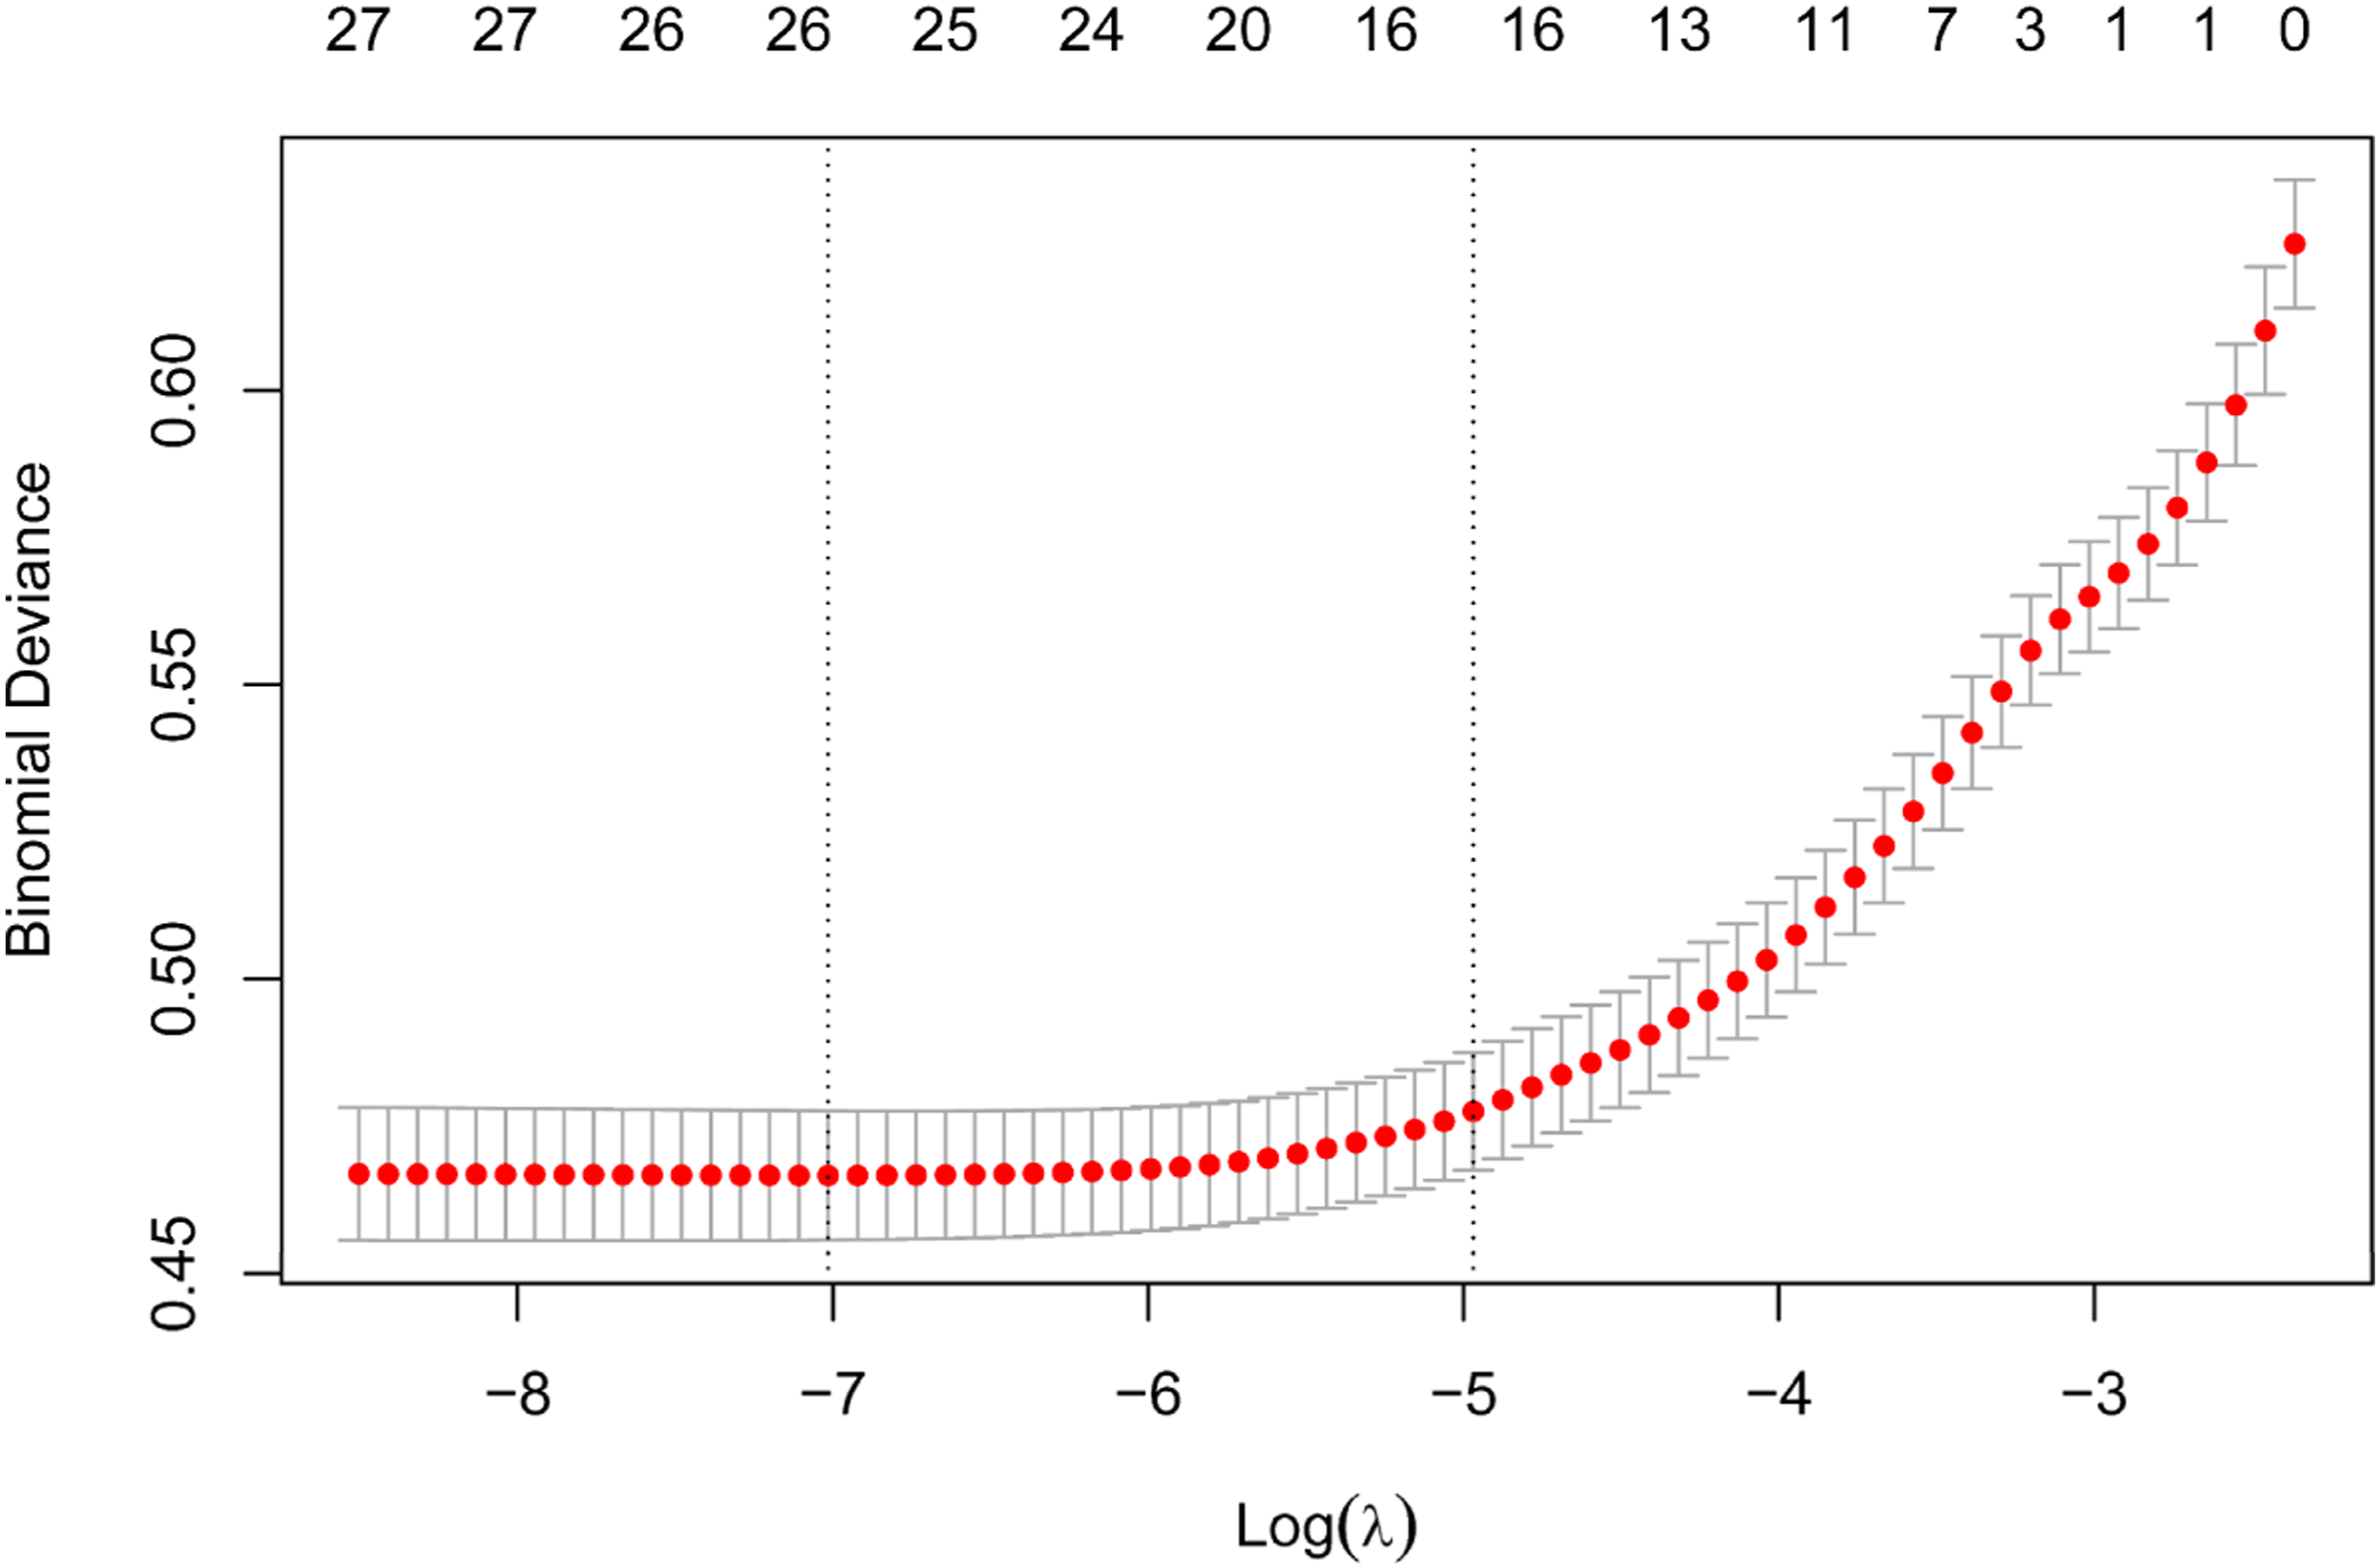
For feature selection and overfitting control, candidate predictors were entered into LASSO logistic regression in the training set, using 10-fold cross-validation with binomial deviance minimization. The cross-validation error reached its global minimum at log(λ) ≈ −7 (λ_min, ∼26 non-zero coefficients), while the 1-SE rule yielded a more parsimonious solution at log(λ) ≈ −5 (λ_1SE, ∼16 non-zero coefficients). As the penalty increased, coefficients monotonically shrank toward zero, with the number of retained features declining stepwise from 27 to 11 along the regularization path; the λ_1SE operating point retained approximately 16 predictors, whereas stronger penalization further reduced the feature count to 11 or fewer variables but was not used for the primary model. Balancing parsimony with generalizability, the 16-feature λ_1SE solution was prespecified for the primary analysis, whereas the λ_min solution (∼26 features) is presented as the less sparse alternative selected along the regularization path. The selected λ_1SE feature set included age, liver disease, AKI, sepsis, potassium_max, creatinine_max, BUN_max, HR_max, RR_max, SpO2_min, mechanical ventilation, vasopressor use, antibiotic use, antiarrhythmic therapy, diuretic use, and sedative use.
Model training and hyperparameter tuning
Nine candidate algorithms were benchmarked using the selected feature set: logistic regression, naïve Bayes, support vector machine, XGBoost, gradient boosting machine, random forest, k-nearest neighbors, neural network, and decision tree. Logistic regression, decision tree, random forest, gradient boosting, XGBoost, and neural network were prespecified as primary comparators, whereas naïve Bayes, support vector machine, and k-nearest neighbors were retained as exploratory benchmarks. Hyperparameters were tuned in the derivation training set using repeated cross-validation (5 folds × 2 repeats), with ROC-AUC as the selection metric. Model-specific preprocessing, search spaces, selected hyperparameters, and resampling settings are reported in Supplementary Table S1.
Data partitioning and internal validation
The MIMIC derivation cohort was randomly split at the patient level into training and internal test sets (≈70:30; training n=6,673, internal test n=2,859) using stratified sampling to preserve outcome balance. Random seeds were fixed to ensure reproducibility. Feature selection and hyperparameter tuning were performed exclusively within the training set; the internal test set remained completely sequestered until final evaluation. External validation using the eICU cohort was conducted independently, without retraining, retuning, or threshold adjustment, to provide a blinded assessment of cross-center generalizability.
Model performance evaluation metrics
Discrimination
Given the moderate class imbalance, discrimination was assessed using both ROC-AUC and PR-AUC across the training, internal test, and external validation cohorts. Ninety-five percent confidence intervals (CIs) for ROC-AUC were obtained via non-parametric bootstrap resampling at the patient level (1,000 iterations). Threshold-dependent metrics, including sensitivity, specificity, PPV, NPV, accuracy, F1 score, and F2 score, were computed at the Youden-optimal cut-off within each dataset. Sensitivity, PPV, and F2 were emphasized as screening-oriented measures, and the corresponding confusion matrices are shown in Supplementary Figure S1A–C.
Calibration and overall error
Calibration, or agreement between predicted and observed risk, was assessed using calibration (reliability) curves. Patients were grouped into 10 equally sized bins by predicted probability, and mean predicted risk was plotted against the observed event rate; LOESS smoothing was applied to visualize overall trends. Quantitatively, two global error measures were reported: the Brier score (mean squared error of predicted probabilities; lower is better) and the expected calibration error (ECE; the sample size–weighted average of |observed − predicted| across 10 bins; lower indicates smaller average deviation). These metrics were calculated independently in the internal test and external validation cohorts. Where relevant, calibration intercepts and slopes (with 95% CIs) were also reported to provide a more complete assessment of probability scaling.
Clinical net benefit (decision curve analysis, DCA)
To evaluate clinical utility across a range of threshold probabilities (p_t), net benefit (NB) was computed and compared against the default strategies of “treat-all” and “treat-none”:

External validation
After feature selection, hyperparameter optimization, and model training in the MIMIC derivation cohort, XGBoost was prespecified as the final model, and the complete preprocessing and modeling pipeline was locked before validation. The locked pipeline included variable definitions, the 0–24 h predictor window, missing-value handling, coding rules, and training-set-derived standardization parameters. It was then applied unchanged to the eICU cohort to generate patient-level predicted probabilities of ICU mortality after completion of the first ICU day. No retraining, retuning, threshold adjustment, or recalibration was performed for the primary external validation. Cohort-specific Youden cut-offs were used only to summarize operating-point performance and did not alter the locked predicted probabilities. All discrimination, calibration, threshold-dependent, and decision-curve metrics were evaluated as described above and reported in Tables 2 and 3 and Figures 4–6.
Model interpretation and visualization
To enhance transparency and facilitate clinical interpretation, the final XGBoost model was subjected to layered explanation using SHAP (Shapley Additive Explanations). Individual SHAP values were computed with the exact TreeSHAP algorithm on the logit scale, quantifying each feature’s marginal contribution to the prediction; when probability-scale display was required, values were transformed via logit-1 solely for visualization, without altering the computational basis. The background distribution for the explainer was drawn from the training set (with stratified subsampling if needed to ensure coverage of the feature space). All preprocessing parameters (standardization, imputation, field mapping) were fitted exclusively in the training set and then frozen for transfer to the evaluation data, preventing information leakage. Explanations and plots were first generated in the internal test set and then reproduced in the external validation cohort under identical settings.
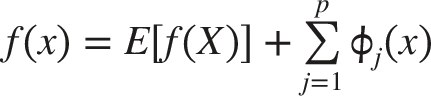
Formally, SHAP decomposes the model output as:
Software tools and statistical analysis
Data management and computational environment
Data extraction and cleaning were performed using PostgreSQL and Python 3.8. Feature engineering and model training relied on scikit-learn 0.24 and xgboost 1.3, while model interpretation employed shap 0.39 (TreeSHAP implementation). Numerical computation and data handling were performed with NumPy and pandas, and visualization with matplotlib (supplemented by R ggplot2 when needed). Statistical analyses were conducted in SciPy and R 4.0. All random processes were controlled with fixed seeds. Preprocessing and modeling pipelines—including field mapping, unit and range checks, missing-value handling, and standardization parameters—were fitted in the training set and then frozen for application to the internal test and external validation cohorts to prevent data leakage and ensure reproducibility. Key dependency versions, scripts, hyperparameter search spaces, selected values, preprocessing details, and resampling settings are provided in Supplementary Table S1 and the Supplementary Methods.
Descriptive statistics and inference
Continuous variables with approximately normal distributions were summarized as mean ± standard deviation, whereas skewed continuous variables were summarized as median (interquartile range); categorical variables were summarized as n (%). Between-group comparisons were conducted using two-sided tests: independent-samples t tests for approximately normally distributed continuous variables with homogeneous variances, Wilcoxon rank-sum tests for non-normally distributed continuous variables, and χ2 or Fisher’s exact tests for categorical variables. Statistical significance was defined as P < 0.05, with 95% confidence intervals (CIs) reported where relevant.
Performance estimation and uncertainty
Discrimination was assessed using both ROC-AUC and PR-AUC, with 95% CIs for ROC-AUC estimated via non-parametric bootstrap resampling at the patient level (1,000 iterations). Threshold-dependent metrics were calculated at the Youden-optimal cut-off within each dataset. No additional operating point was used for the primary model comparison. Calibration was evaluated with decile-based reliability curves (10 bins with LOESS smoothing) and quantified by Brier score and expected calibration error (ECE; weighted average of |observed − predicted| across bins). Calibration intercepts and slopes (95% CI) were reported when necessary. Clinical utility was examined with decision curve analysis (DCA), calculating net benefit across prespecified probability thresholds, compared with the default “treat-all” and “treat-none” strategies. Implementation details and threshold grids are provided in the Appendix.
Reporting standards and reproducibility
The study was reported with reference to the TRIPOD+AI guidance for prediction models using regression or machine-learning methods, and a completed TRIPOD+AI checklist is provided as Supplementary Appendix S1. To support reproducibility, we provide variable definitions, preprocessing specifications, fixed random seeds, dependency versions, hyperparameter search spaces, selected values, and resampling settings in the Supplementary Materials. Analytical code is available from the corresponding authors upon reasonable request.
Results
Cohort assembly and stratified data partitioning
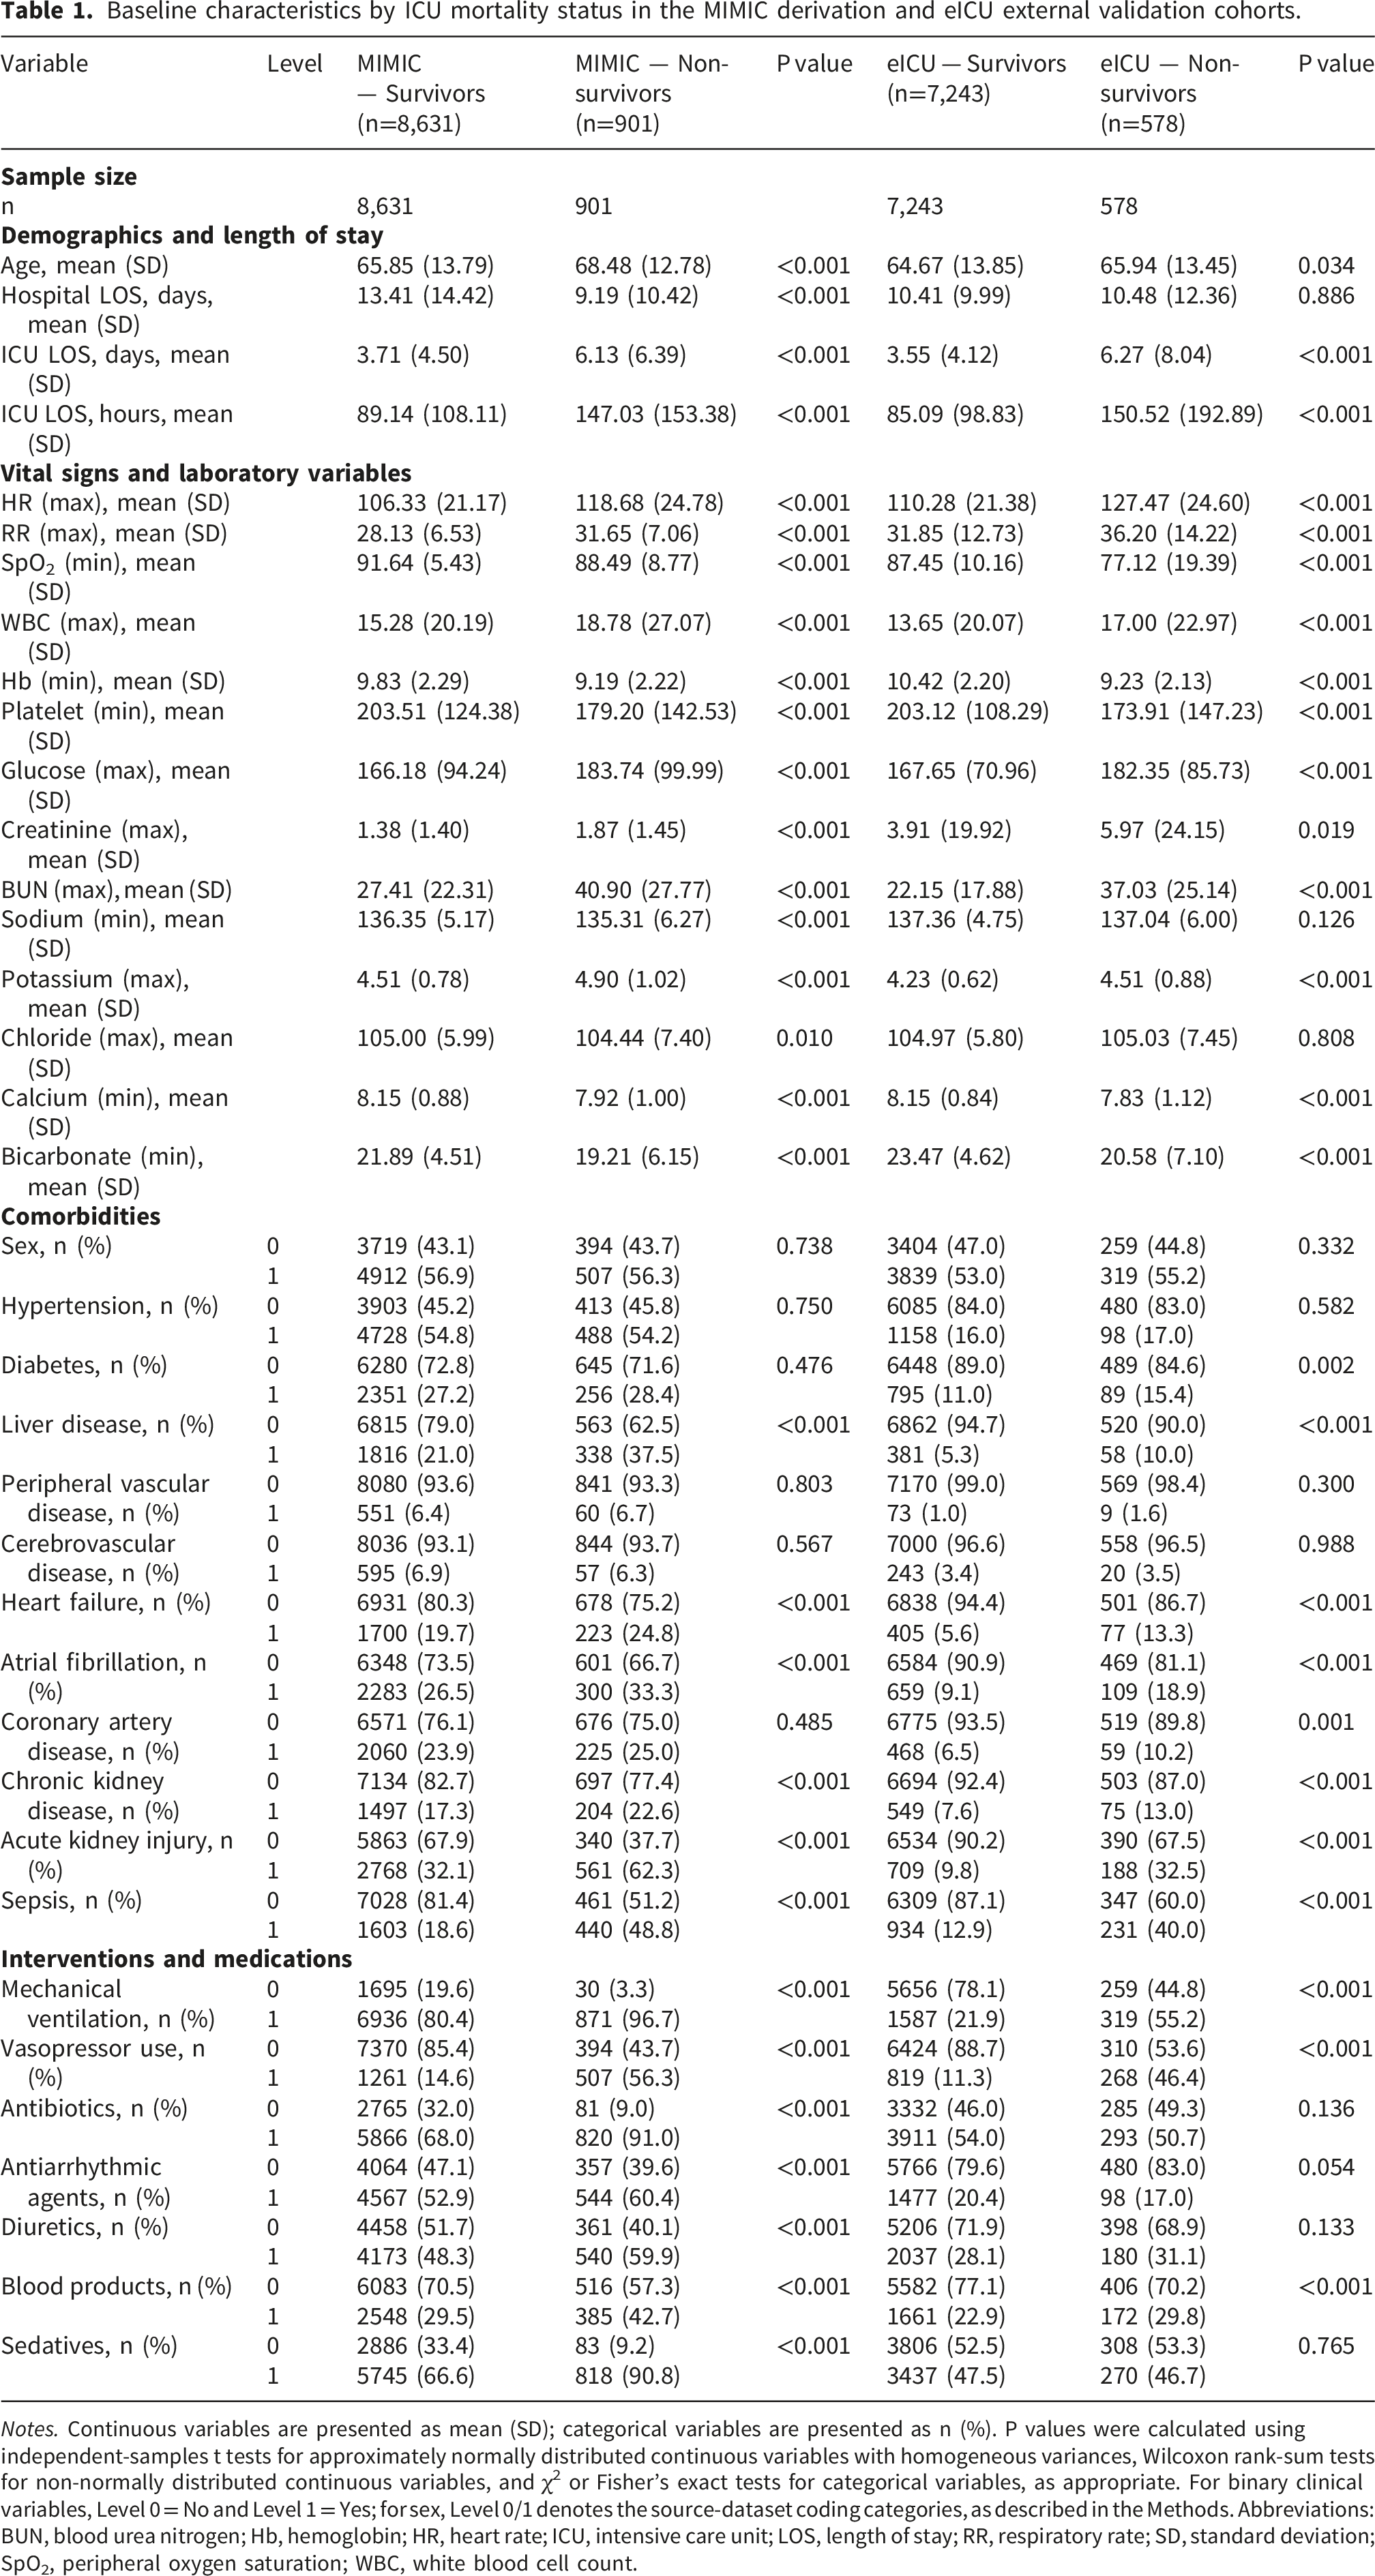
From the MIMIC-IV database, 12,040 adult ICU admissions with a history of malignancy were screened; 9,532 met the prespecified eligibility criteria (Methods; Figure 1) and were included for model development and internal validation. Stratified random sampling yielded a training set of 6,673 patients (≈70%) and an internal test set of 2,859 patients (≈30%), with an overall ICU mortality rate of 9.45% (901/9,532). The independent external validation cohort comprised 7,821 eligible patients from eICU-CRD with an event rate of 7.39% (578/7,821). Baseline characteristics by survival status are summarized in Table 1. Study flow, cohort assembly, model-development workflow, and external validation framework. Baseline characteristics by ICU mortality status in the MIMIC derivation and eICU external validation cohorts. Notes. Continuous variables are presented as mean (SD); categorical variables are presented as n (%). P values were calculated using independent-samples t tests for approximately normally distributed continuous variables with homogeneous variances, Wilcoxon rank-sum tests for non-normally distributed continuous variables, and χ2 or Fisher’s exact tests for categorical variables, as appropriate. For binary clinical variables, Level 0 = No and Level 1 = Yes; for sex, Level 0/1 denotes the source-dataset coding categories, as described in the Methods. Abbreviations: BUN, blood urea nitrogen; Hb, hemoglobin; HR, heart rate; ICU, intensive care unit; LOS, length of stay; RR, respiratory rate; SD, standard deviation; SpO2, peripheral oxygen saturation; WBC, white blood cell count.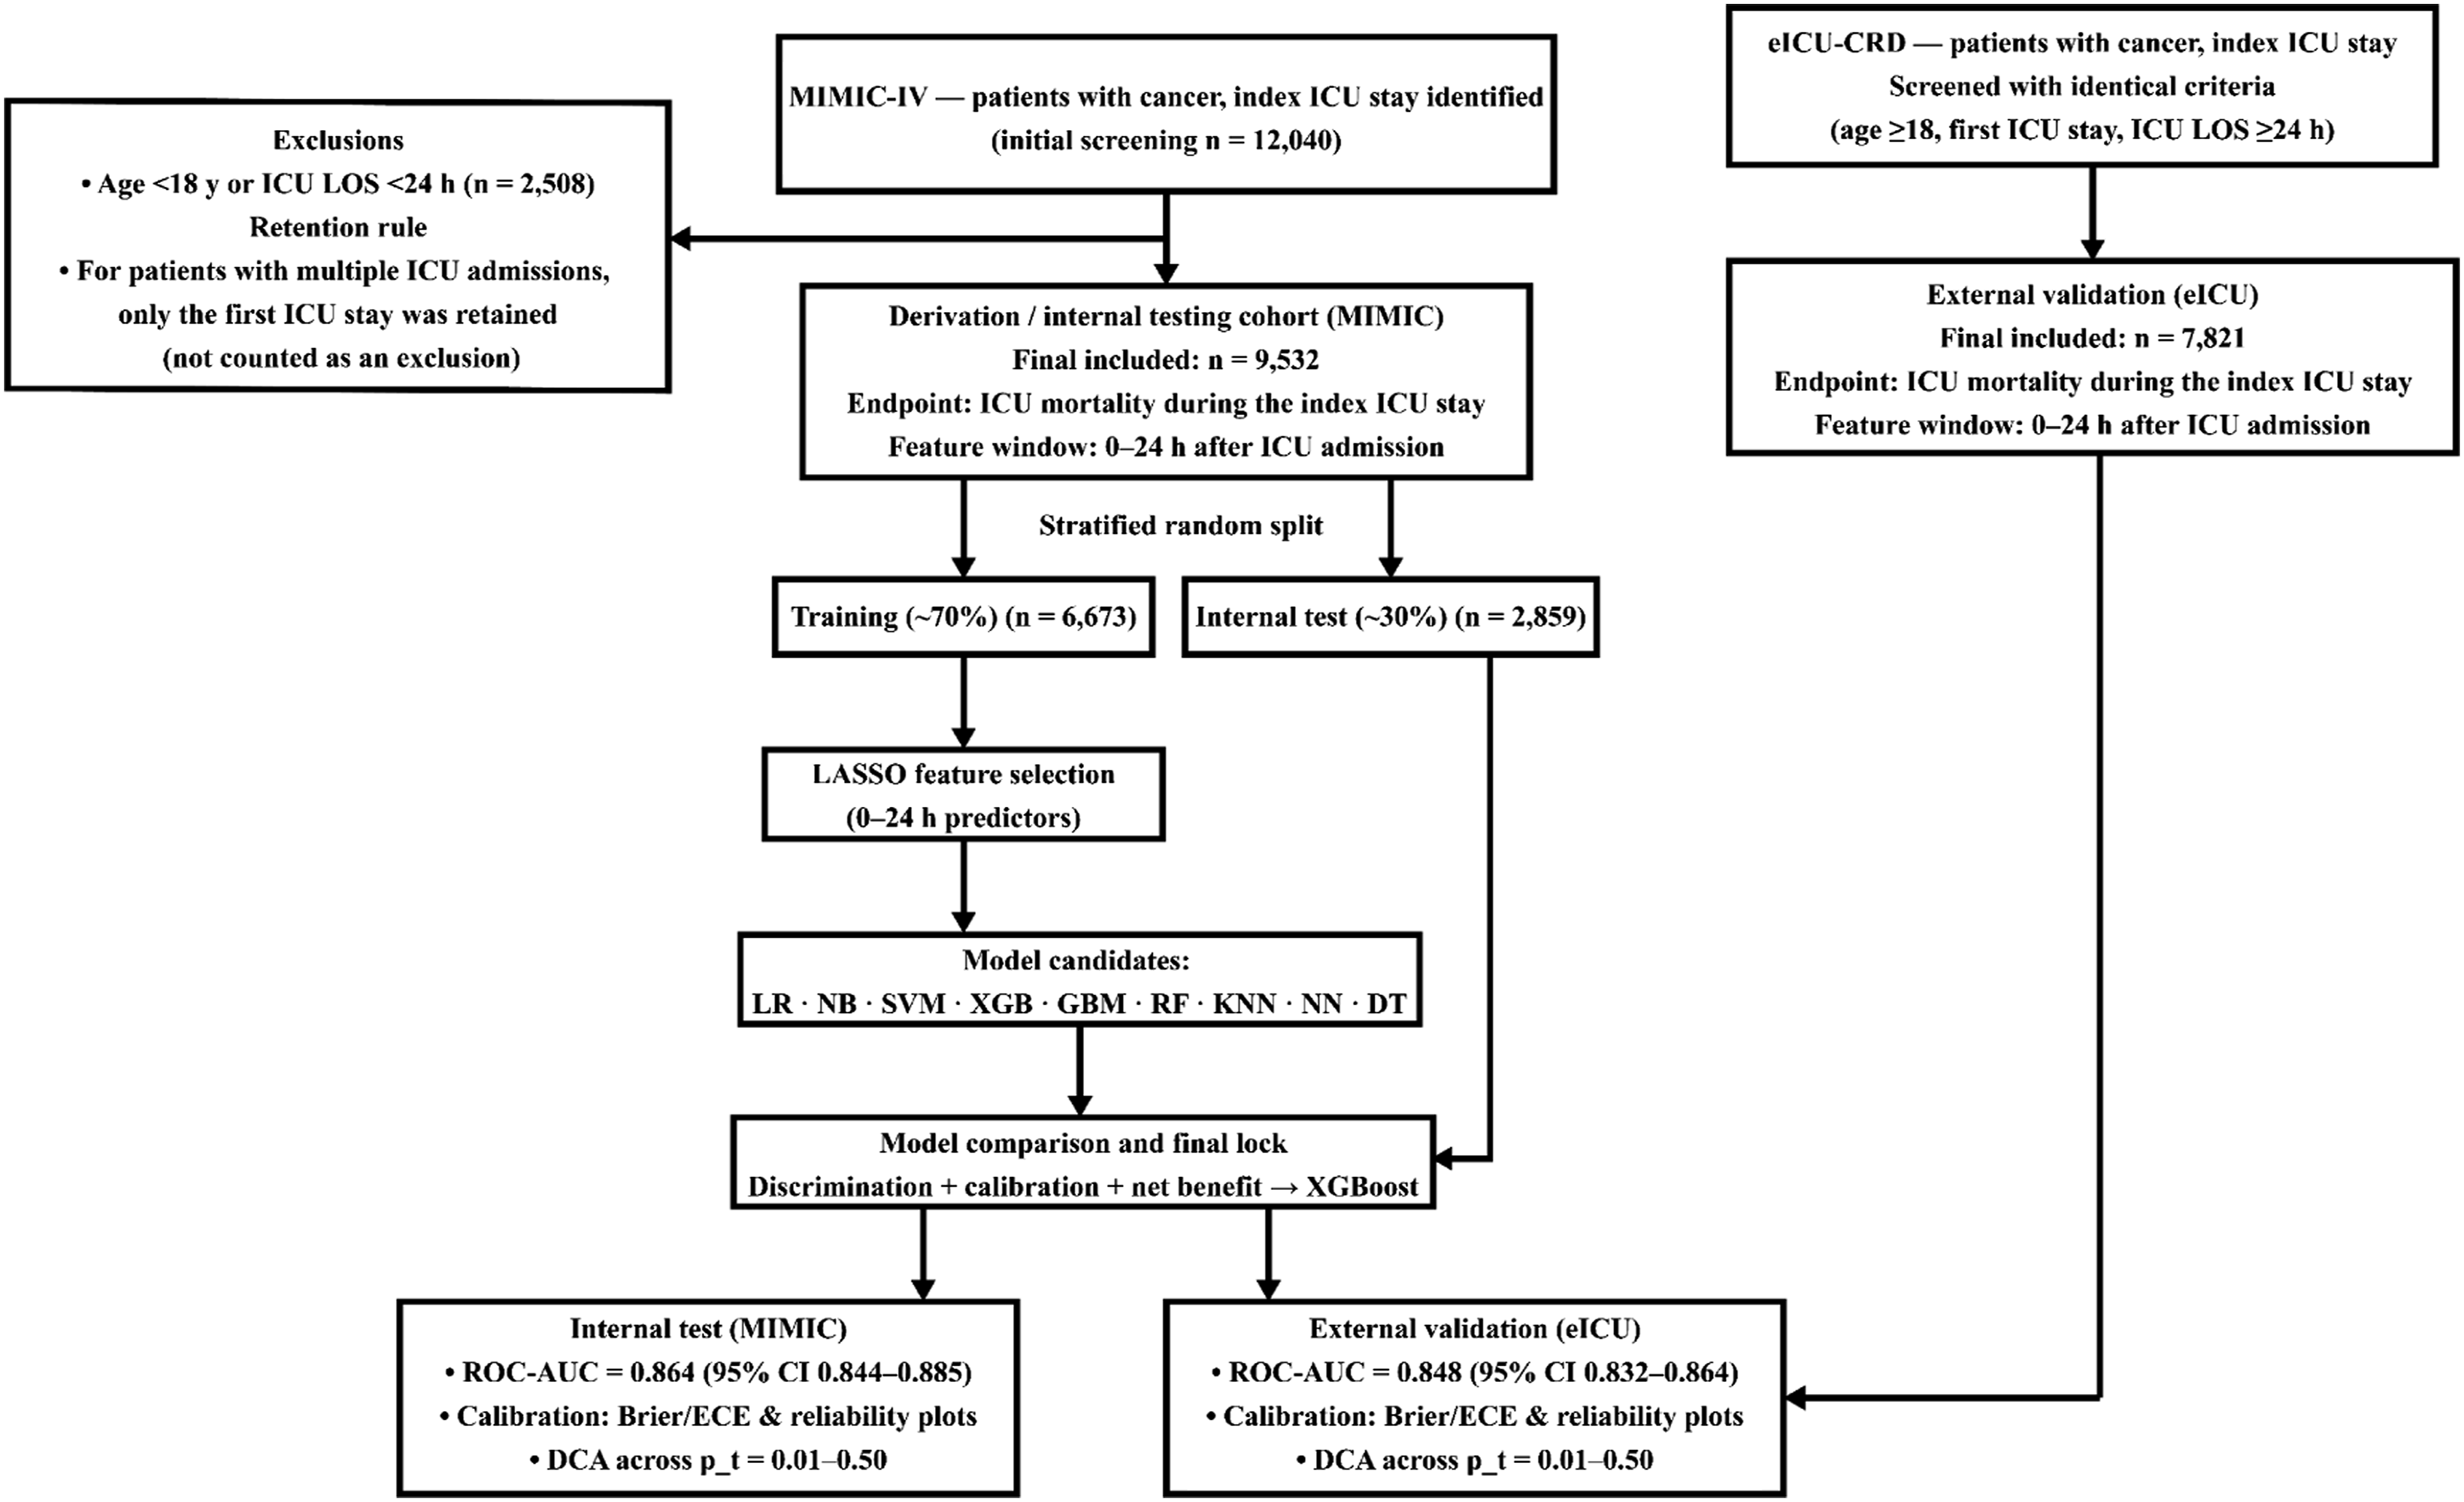
Feature selection by LASSO
LASSO selected a 16-feature λ_1SE predictor set for subsequent model development (Figures 2 and 3). The selected predictors were age, liver disease, AKI, sepsis, potassium_max, creatinine_max, BUN_max, HR_max, RR_max, SpO2_min, mechanical ventilation, vasopressor use, antibiotic use, antiarrhythmic therapy, diuretic use, and sedative use. The less sparse λ_min solution retained approximately 26 predictors and is shown in Figures 2 and 3 for comparison. LASSO coefficient paths in the MIMIC training set. LASSO cross-validation error curve in the MIMIC training set.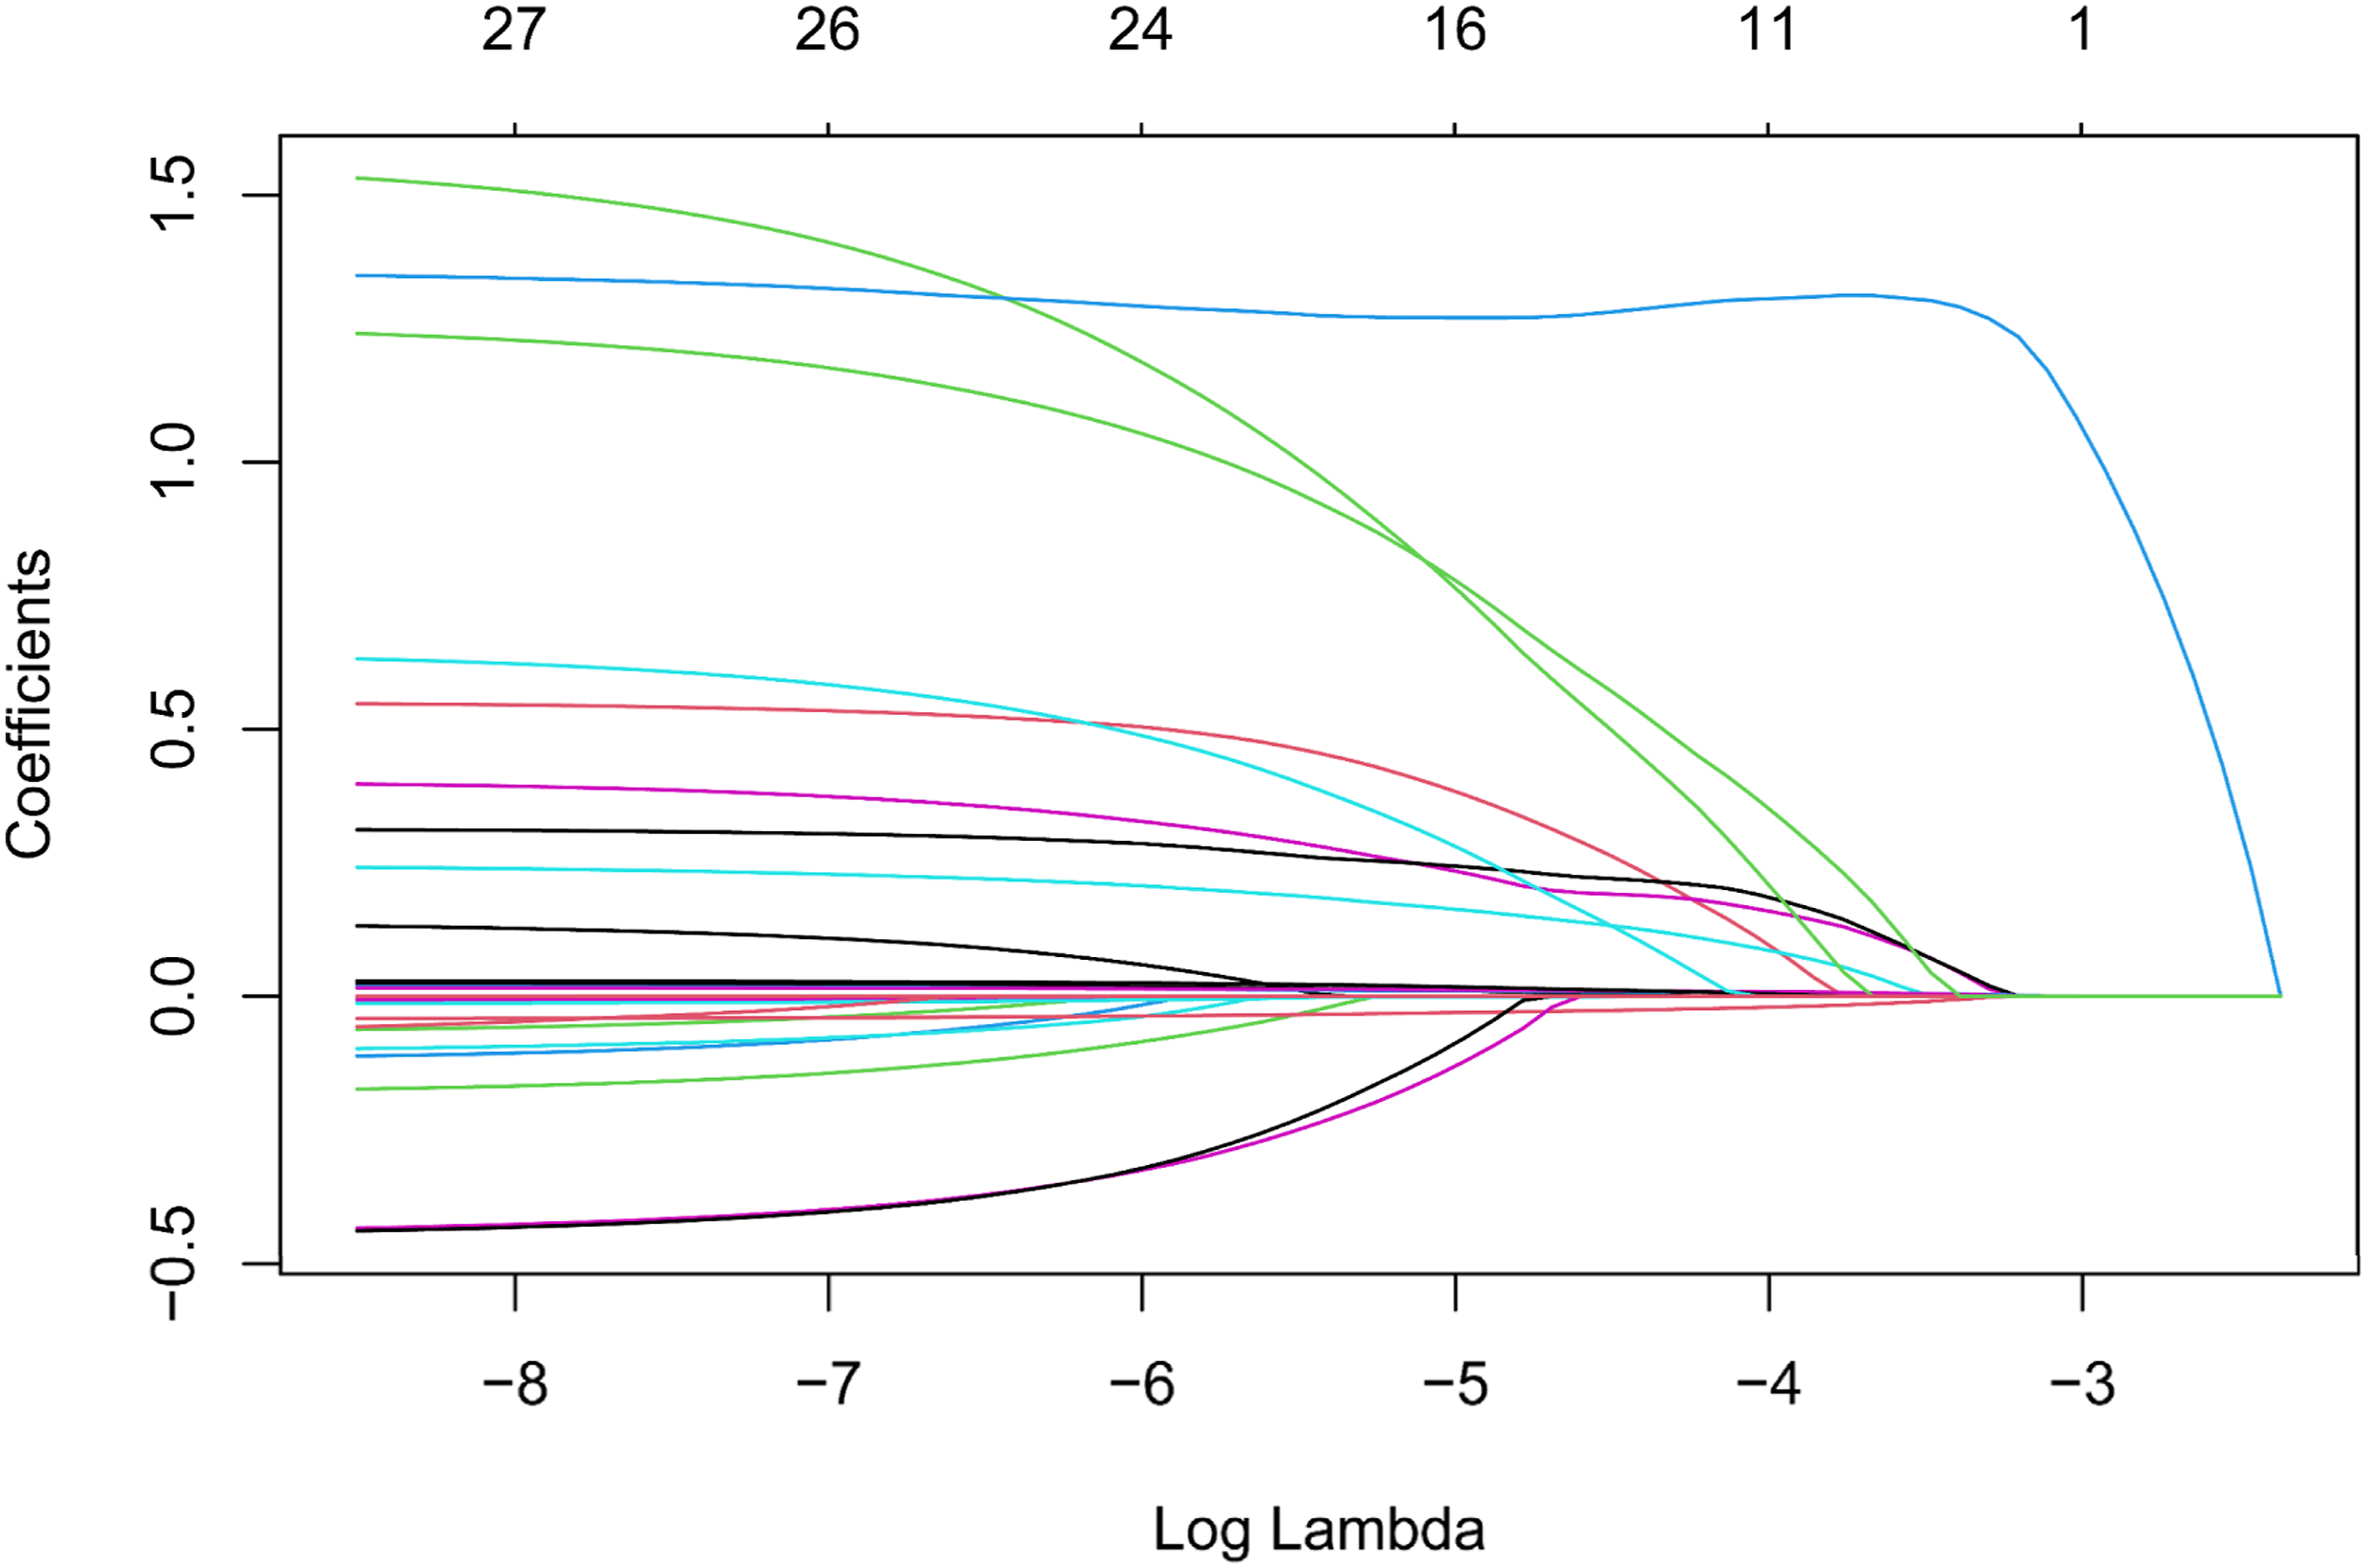
Discriminative performance and screening-oriented threshold-dependent performance
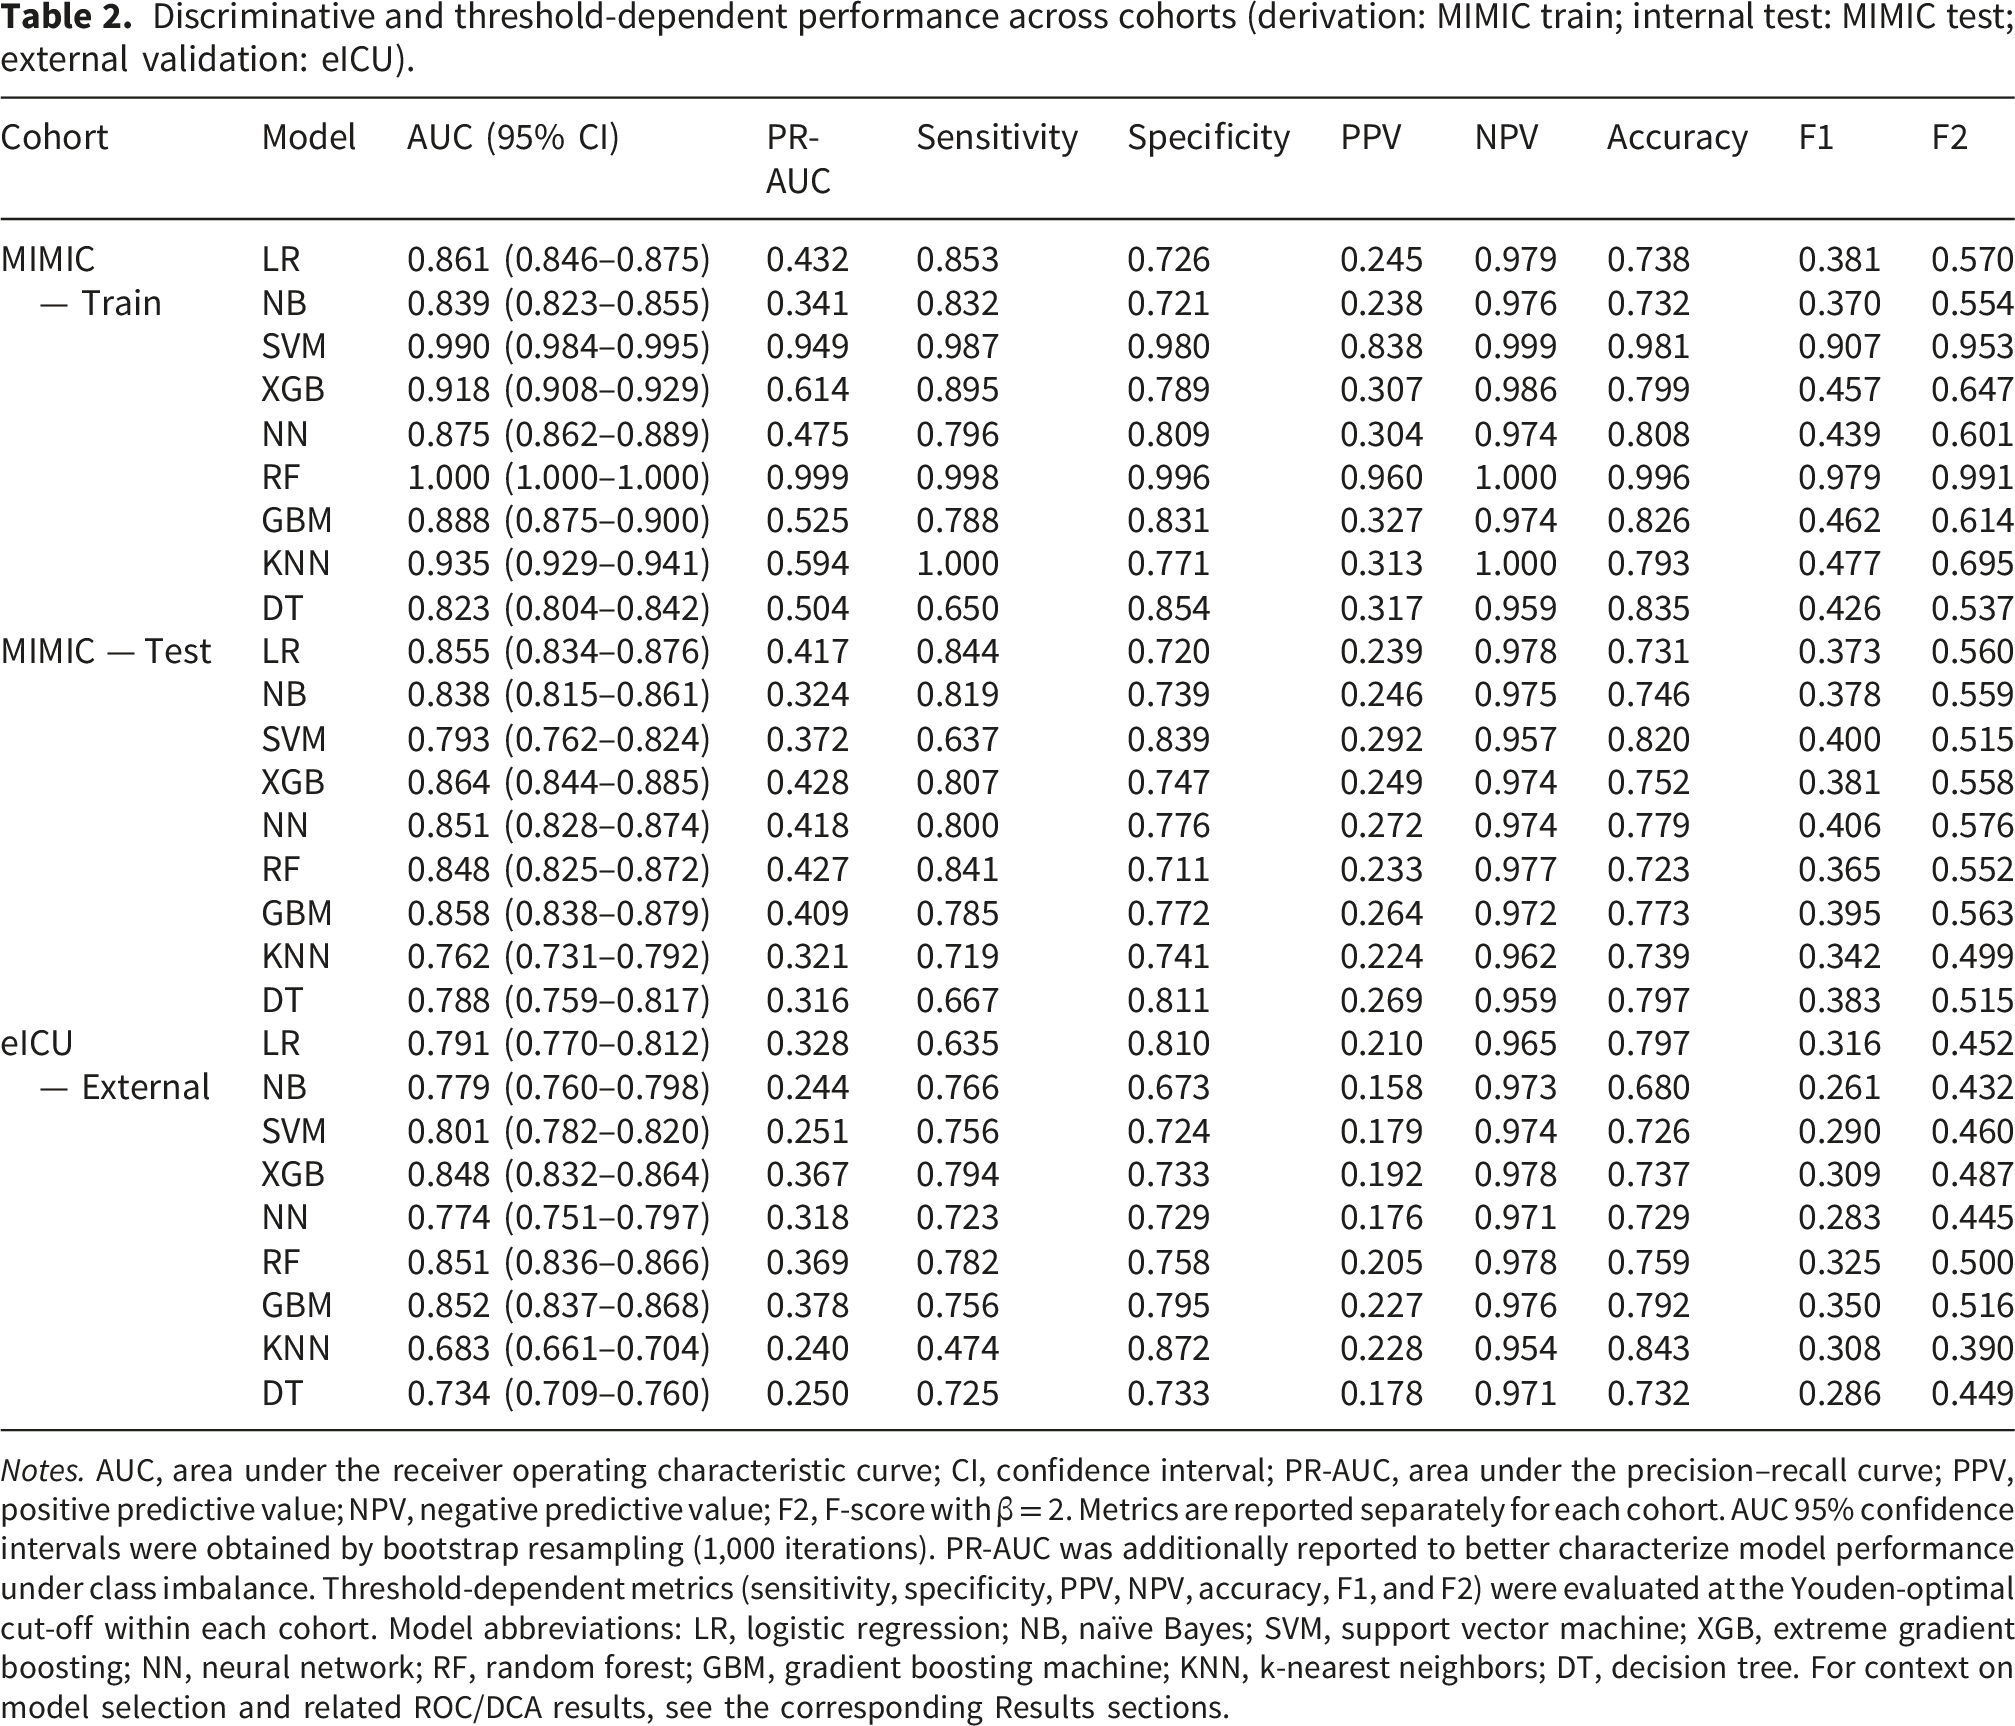
In the MIMIC training set, most algorithms achieved curves approaching the upper-left corner of the ROC space; however, Random Forest (AUC = 1.000) and SVM (AUC = 0.990) showed evidence of overfitting (Figure 4(a)). In the internal test set, XGBoost achieved the strongest overall discrimination among the non-overfitted models (AUC = 0.864, 95% CI 0.844–0.885; PR-AUC = 0.428), together with sensitivity 0.807, PPV 0.249, and F2 0.558 at the Youden-optimal threshold. GBM showed a slightly lower AUC (0.858) but comparable screening-oriented threshold-dependent performance (PR-AUC = 0.409; F2 = 0.563), whereas SVM and KNN yielded lower discrimination (AUC = 0.793 and 0.762, respectively; Figure 4(b)). In the eICU external validation cohort, XGBoost preserved stable external performance (AUC = 0.848, 95% CI 0.832–0.864; PR-AUC = 0.367; sensitivity 0.794; PPV 0.192; F2 = 0.487), although GBM and RF showed slightly higher external AUCs (0.852 and 0.851, respectively), and GBM showed the highest external F2 (0.516). Comprehensive threshold-dependent metrics are reported in Table 2. The corresponding cohort-specific confusion matrices for the nine candidate models at the Youden-optimal threshold are provided in Supplementary Figure S1A–C, allowing direct visual verification of the threshold-dependent metrics summarized in Table 2. Taken together, XGBoost was retained as the locked model because it offered the most balanced overall profile across internal discrimination, calibration, and clinically oriented threshold-dependent performance, while maintaining stable external generalizability. ROC curves across the MIMIC training, MIMIC internal test, and eICU external validation cohorts. (A) MIMIC training set; (B) MIMIC internal test set; (C) eICU external validation set. Curves show discrimination for the nine candidate models. AUC values with 95% confidence intervals are shown in the legends. Discriminative and threshold-dependent performance across cohorts (derivation: MIMIC train; internal test: MIMIC test; external validation: eICU). Notes. AUC, area under the receiver operating characteristic curve; CI, confidence interval; PR-AUC, area under the precision–recall curve; PPV, positive predictive value; NPV, negative predictive value; F2, F-score with β = 2. Metrics are reported separately for each cohort. AUC 95% confidence intervals were obtained by bootstrap resampling (1,000 iterations). PR-AUC was additionally reported to better characterize model performance under class imbalance. Threshold-dependent metrics (sensitivity, specificity, PPV, NPV, accuracy, F1, and F2) were evaluated at the Youden-optimal cut-off within each cohort. Model abbreviations: LR, logistic regression; NB, naïve Bayes; SVM, support vector machine; XGB, extreme gradient boosting; NN, neural network; RF, random forest; GBM, gradient boosting machine; KNN, k-nearest neighbors; DT, decision tree. For context on model selection and related ROC/DCA results, see the corresponding Results sections.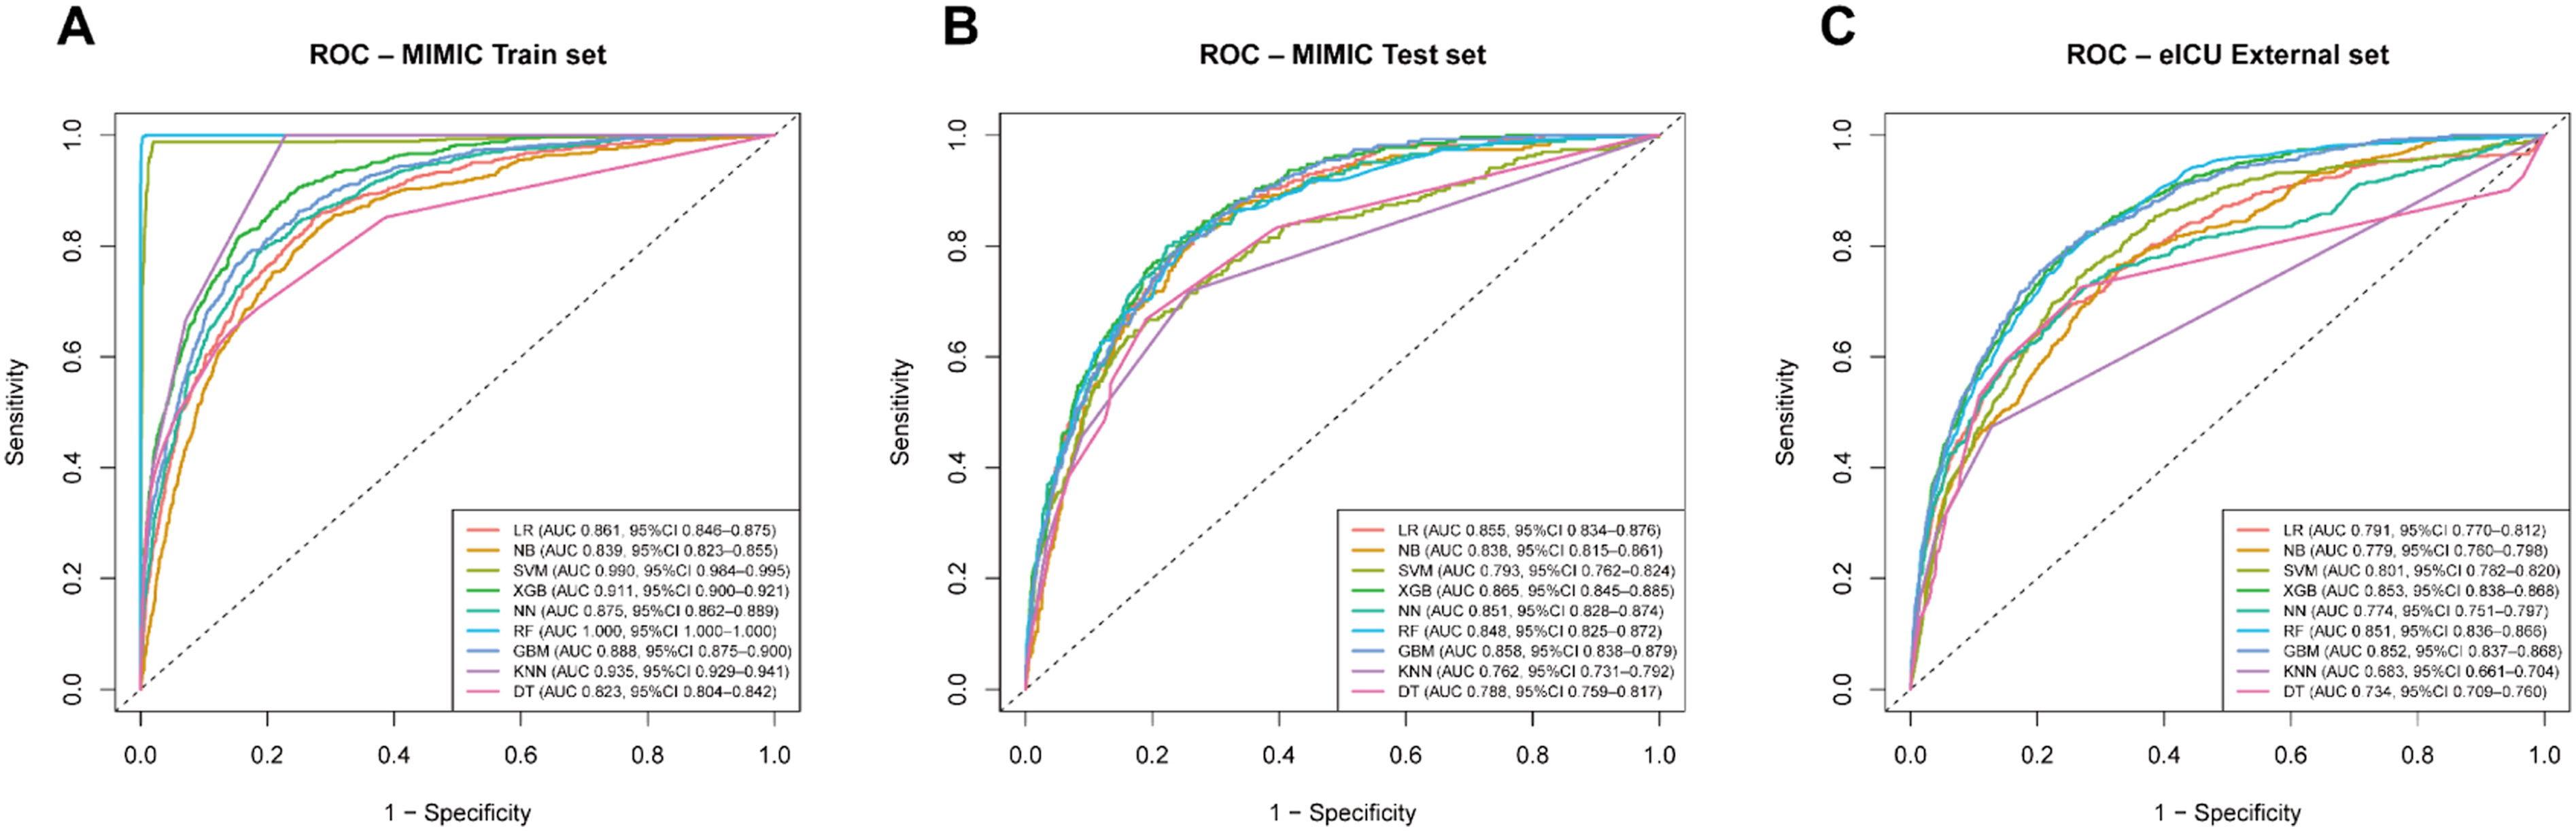
Threshold-dependent net benefit and clinical utility (decision curve analysis)
In the MIMIC training set, after recalculating net benefit (NB) using the standard definition, XGBoost, RF, LR, and GBM achieved positive net benefit compared with treat-all or treat-none strategies within the threshold range of approximately 0.05–0.30, consistent with the observed event rate; these results were considered as model-fitting references only (Figure 5(a)). In the internal test set, XGBoost, RF, LR, and GBM again demonstrated positive net benefit across p_t ≈ 0.05–0.30, whereas KNN and DT yielded near-zero or negative values at intermediate to high thresholds (Figure 5(b)). In the eICU external validation cohort, XGBoost, RF, GBM, and LR achieved comparable positive net benefit across p_t ≈ 0.05–0.25, exceeding treat-none and most competing models; NB and SVM showed gains primarily at very low thresholds (Figure 5(c)). Taken together, with emphasis on the test and external validation results, XGBoost consistently provided stable positive net benefit within clinically acceptable thresholds (≈0.05–0.30 in the test set; ≈0.05–0.25 externally), comparable to RF, GBM, and LR, supporting its potential clinical applicability. Event rates in each cohort are reported in Table 1 to aid interpretation of net benefit magnitude. Decision curve analysis across threshold probabilities. (A) MIMIC training set; (B) MIMIC internal test set; (C) eICU external validation set. Net benefit was calculated as: 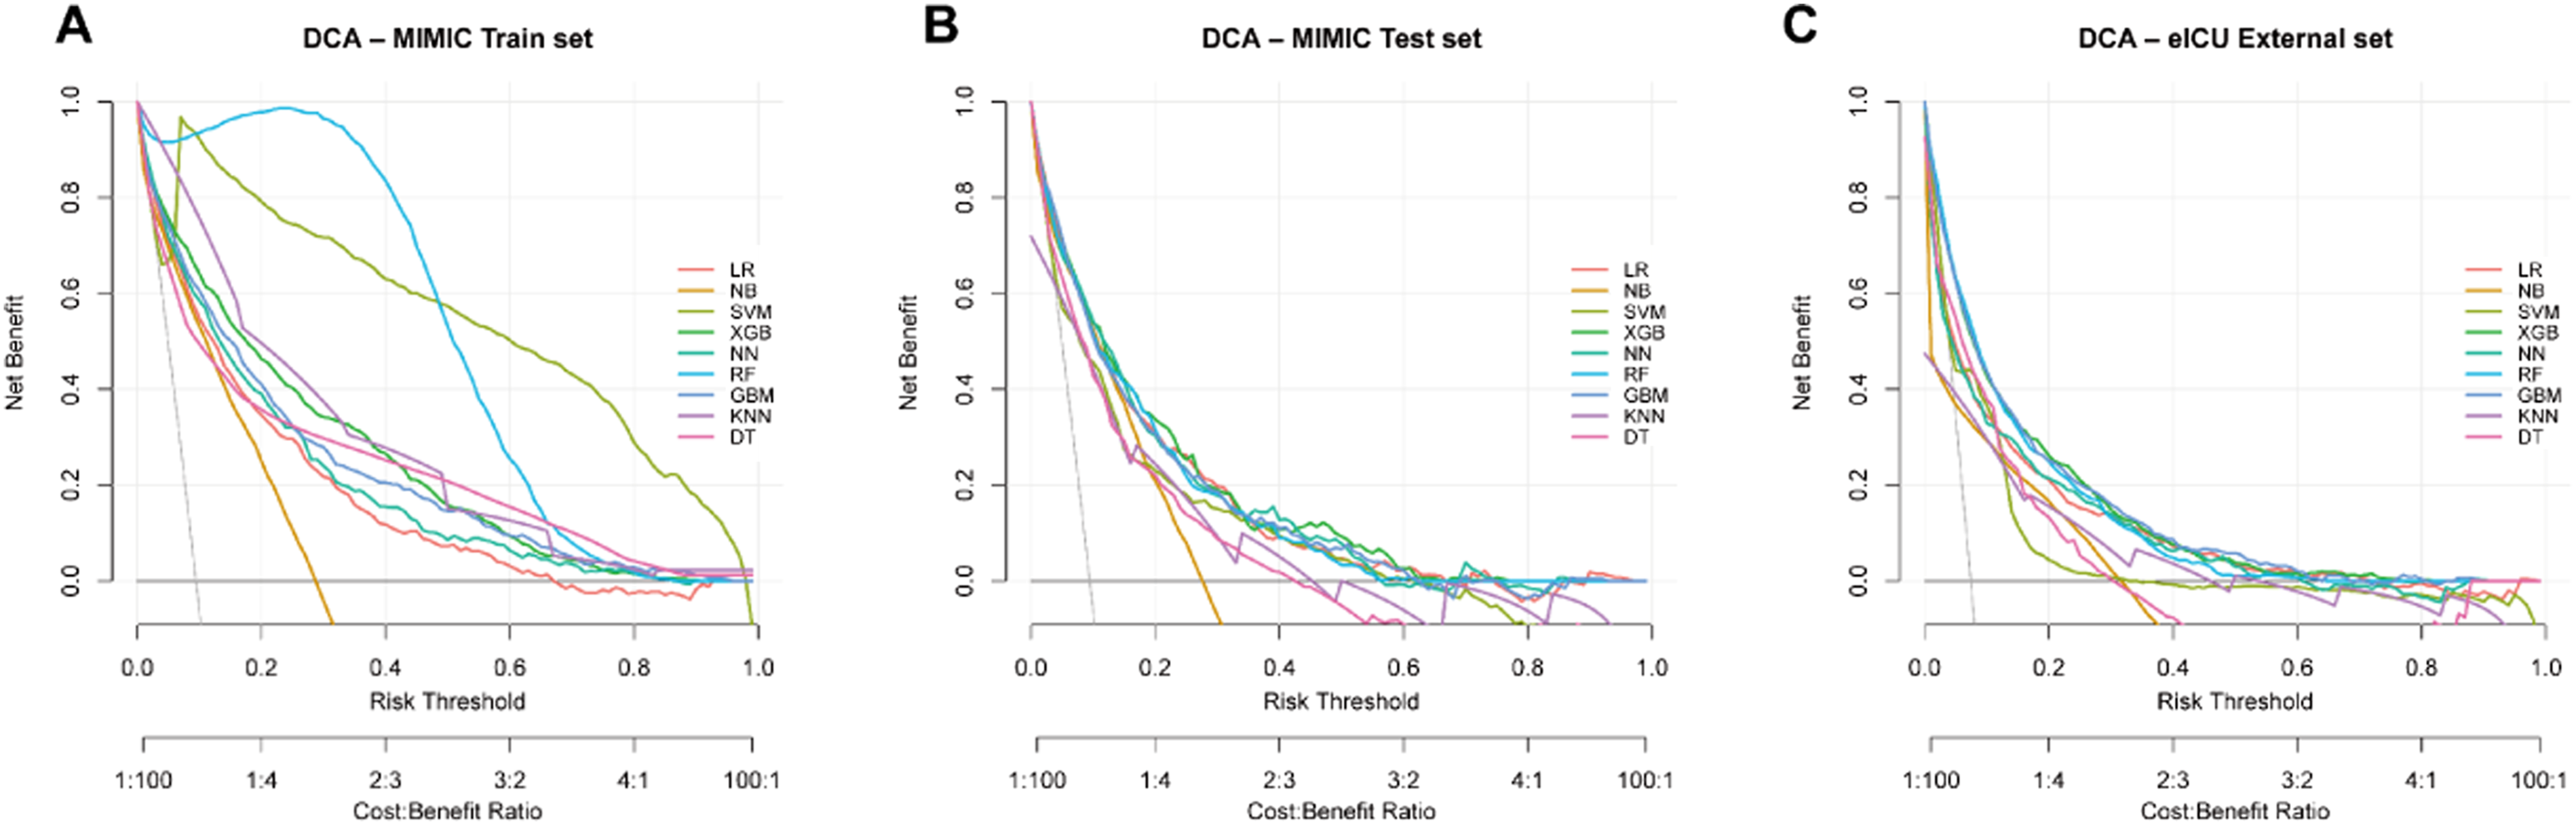
Probability calibration and cross-cohort consistency (calibration curves)
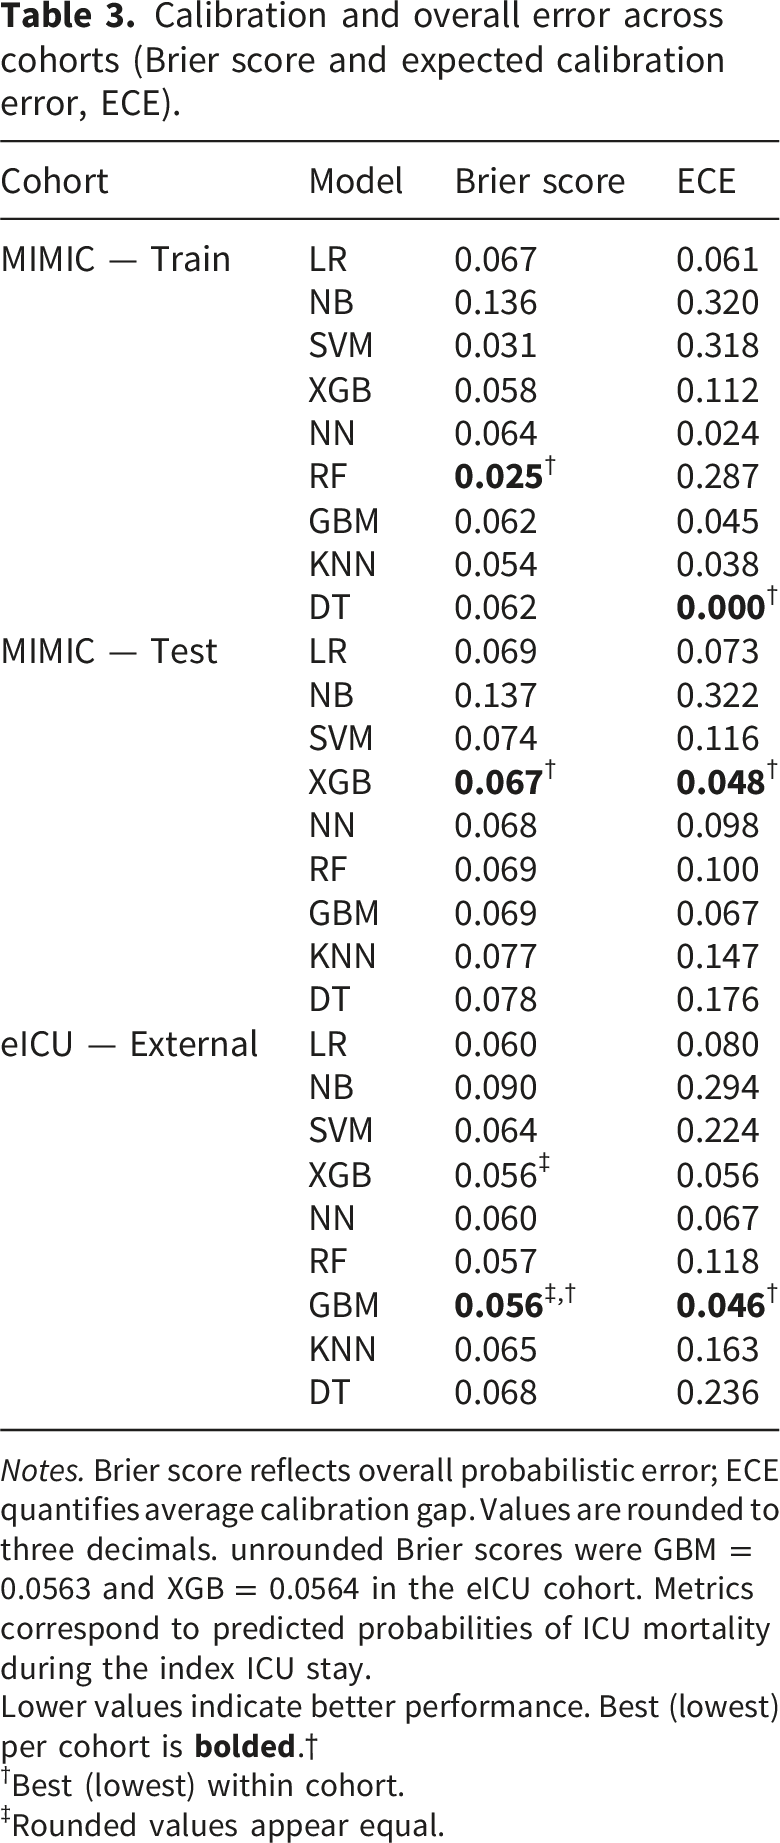
In the MIMIC training set, calibration curves for logistic regression, GBM, XGBoost, and the neural network closely followed the ideal diagonal, with the best agreement observed in the mid-probability range (≈0.2–0.6; Figure 6(a)). By contrast, random forest curves rose steeply and plateaued early at higher predicted risks, indicating systematic under-prediction of high-risk patients, whereas naïve Bayes consistently over-predicted risk across the full range. In the MIMIC internal test set, XGBoost, GBM, and logistic regression maintained near-linear correspondence between predicted and observed risk. Random forest showed improved alignment compared to its training performance, approximating the above models. In contrast, naïve Bayes and KNN/DT exhibited large fluctuations in the mid-to-high risk range, with wider scatter at extreme probabilities, consistent with instability due to limited sample size (Figure 6(b)). In the eICU external validation cohort, calibration for XGBoost, GBM, logistic regression, and random forest generally centered around the diagonal, showing consistency with the internal test set. Naïve Bayes and KNN continued to deviate, with localized under- or overestimation of risk (Figure 6(c)). Quantitative calibration metrics, including the Brier score and expected calibration error (ECE), are presented in Table 3, reinforcing the stability of probability scaling for XGBoost and GBM across datasets. Calibration curves across cohorts. (A) MIMIC training set; (B) MIMIC internal test set; (C) eICU external validation set. The dashed diagonal line indicates perfect calibration. Curves above the diagonal indicate under-prediction, whereas curves below the diagonal indicate over-prediction. Quantitative calibration metrics are reported in Table 3. Calibration and overall error across cohorts (Brier score and expected calibration error, ECE). Notes. Brier score reflects overall probabilistic error; ECE quantifies average calibration gap. Values are rounded to three decimals. unrounded Brier scores were GBM = 0.0563 and XGB = 0.0564 in the eICU cohort. Metrics correspond to predicted probabilities of ICU mortality during the index ICU stay. Lower values indicate better performance. Best (lowest) per cohort is †Best (lowest) within cohort. ‡Rounded values appear equal.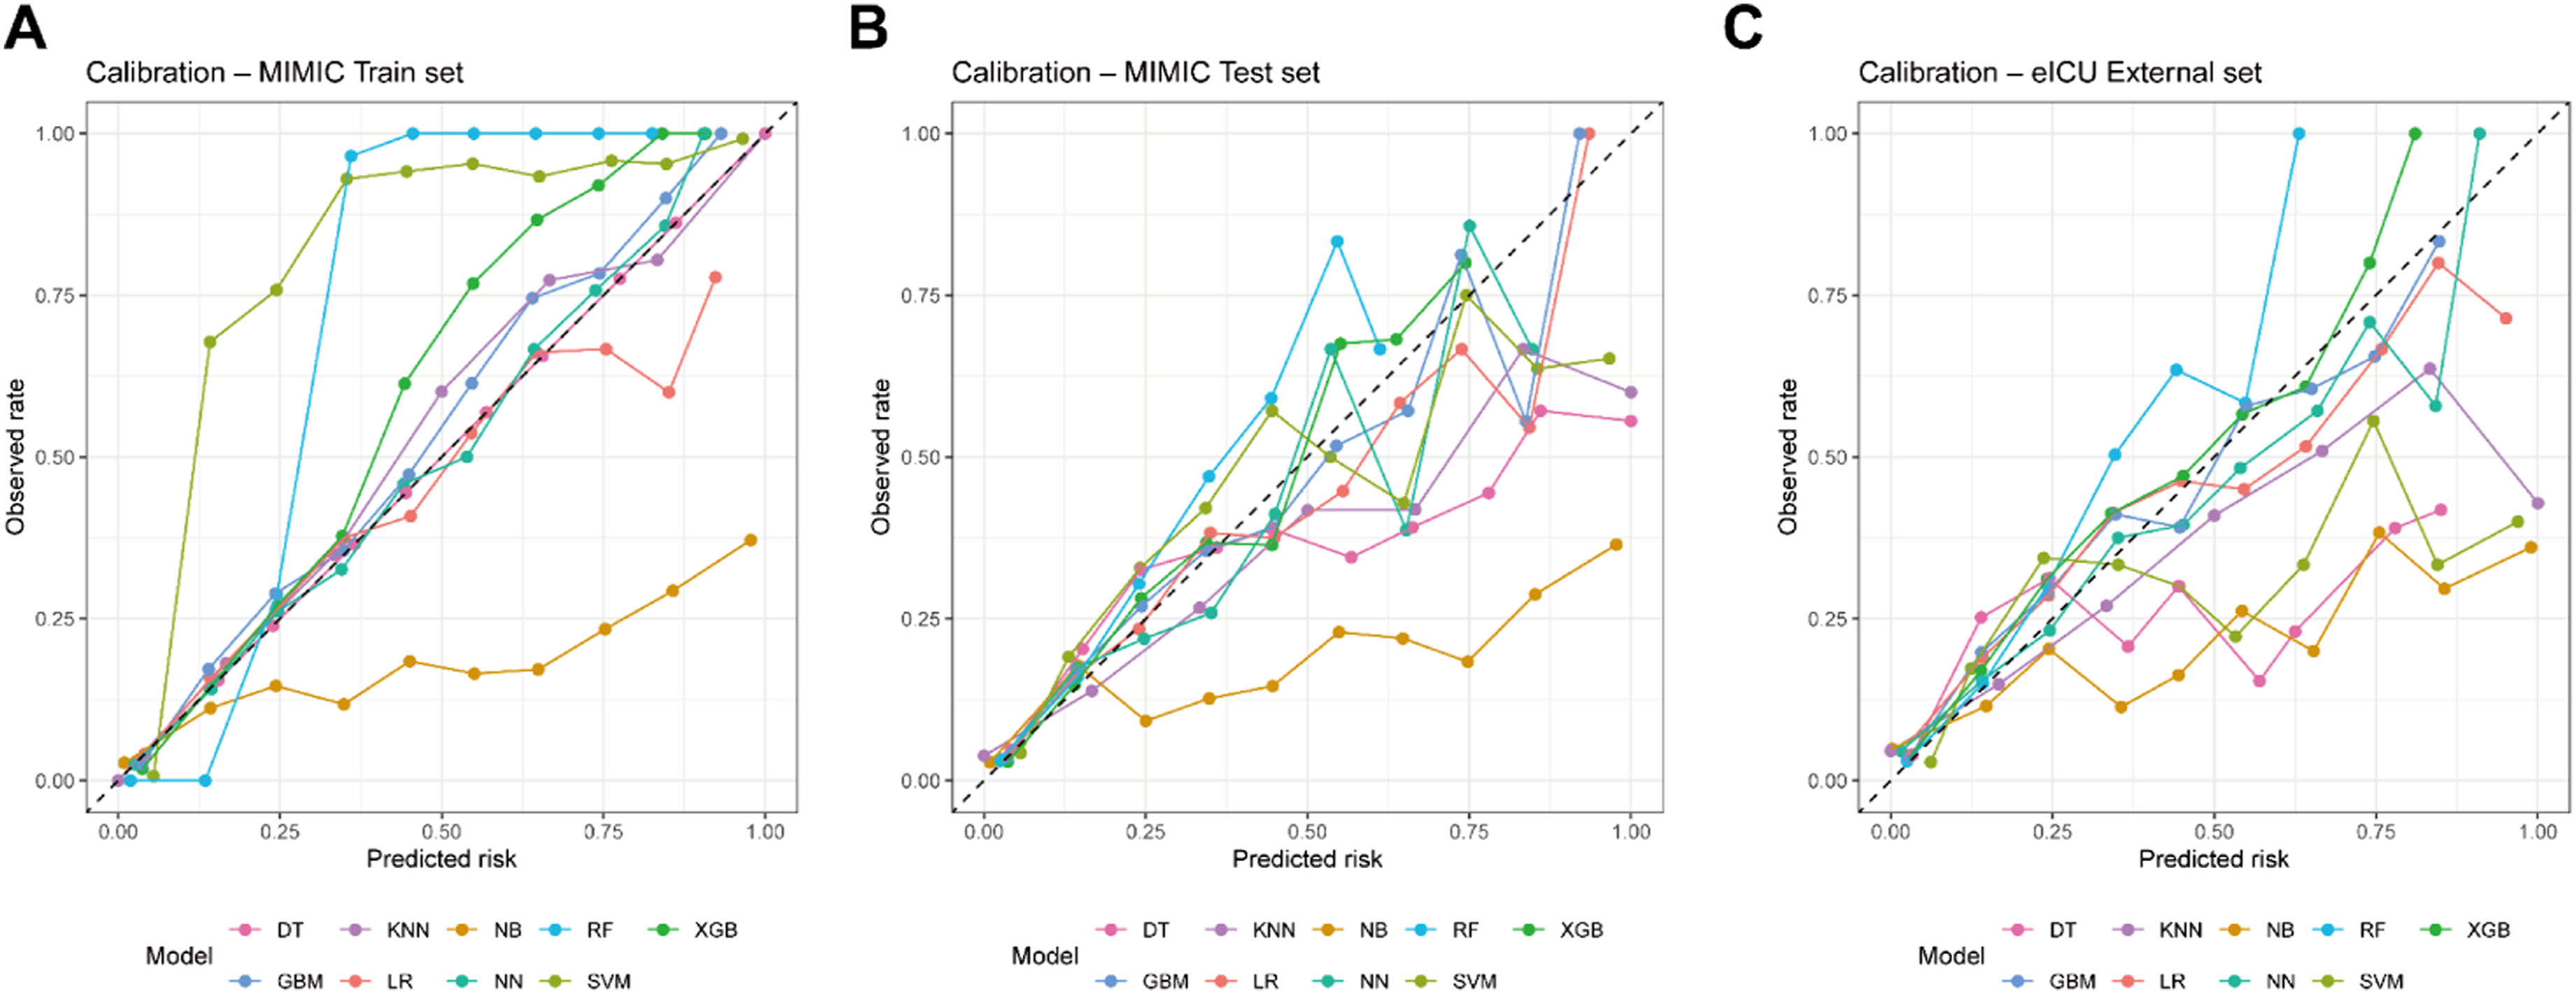
Model interpretation by SHAP
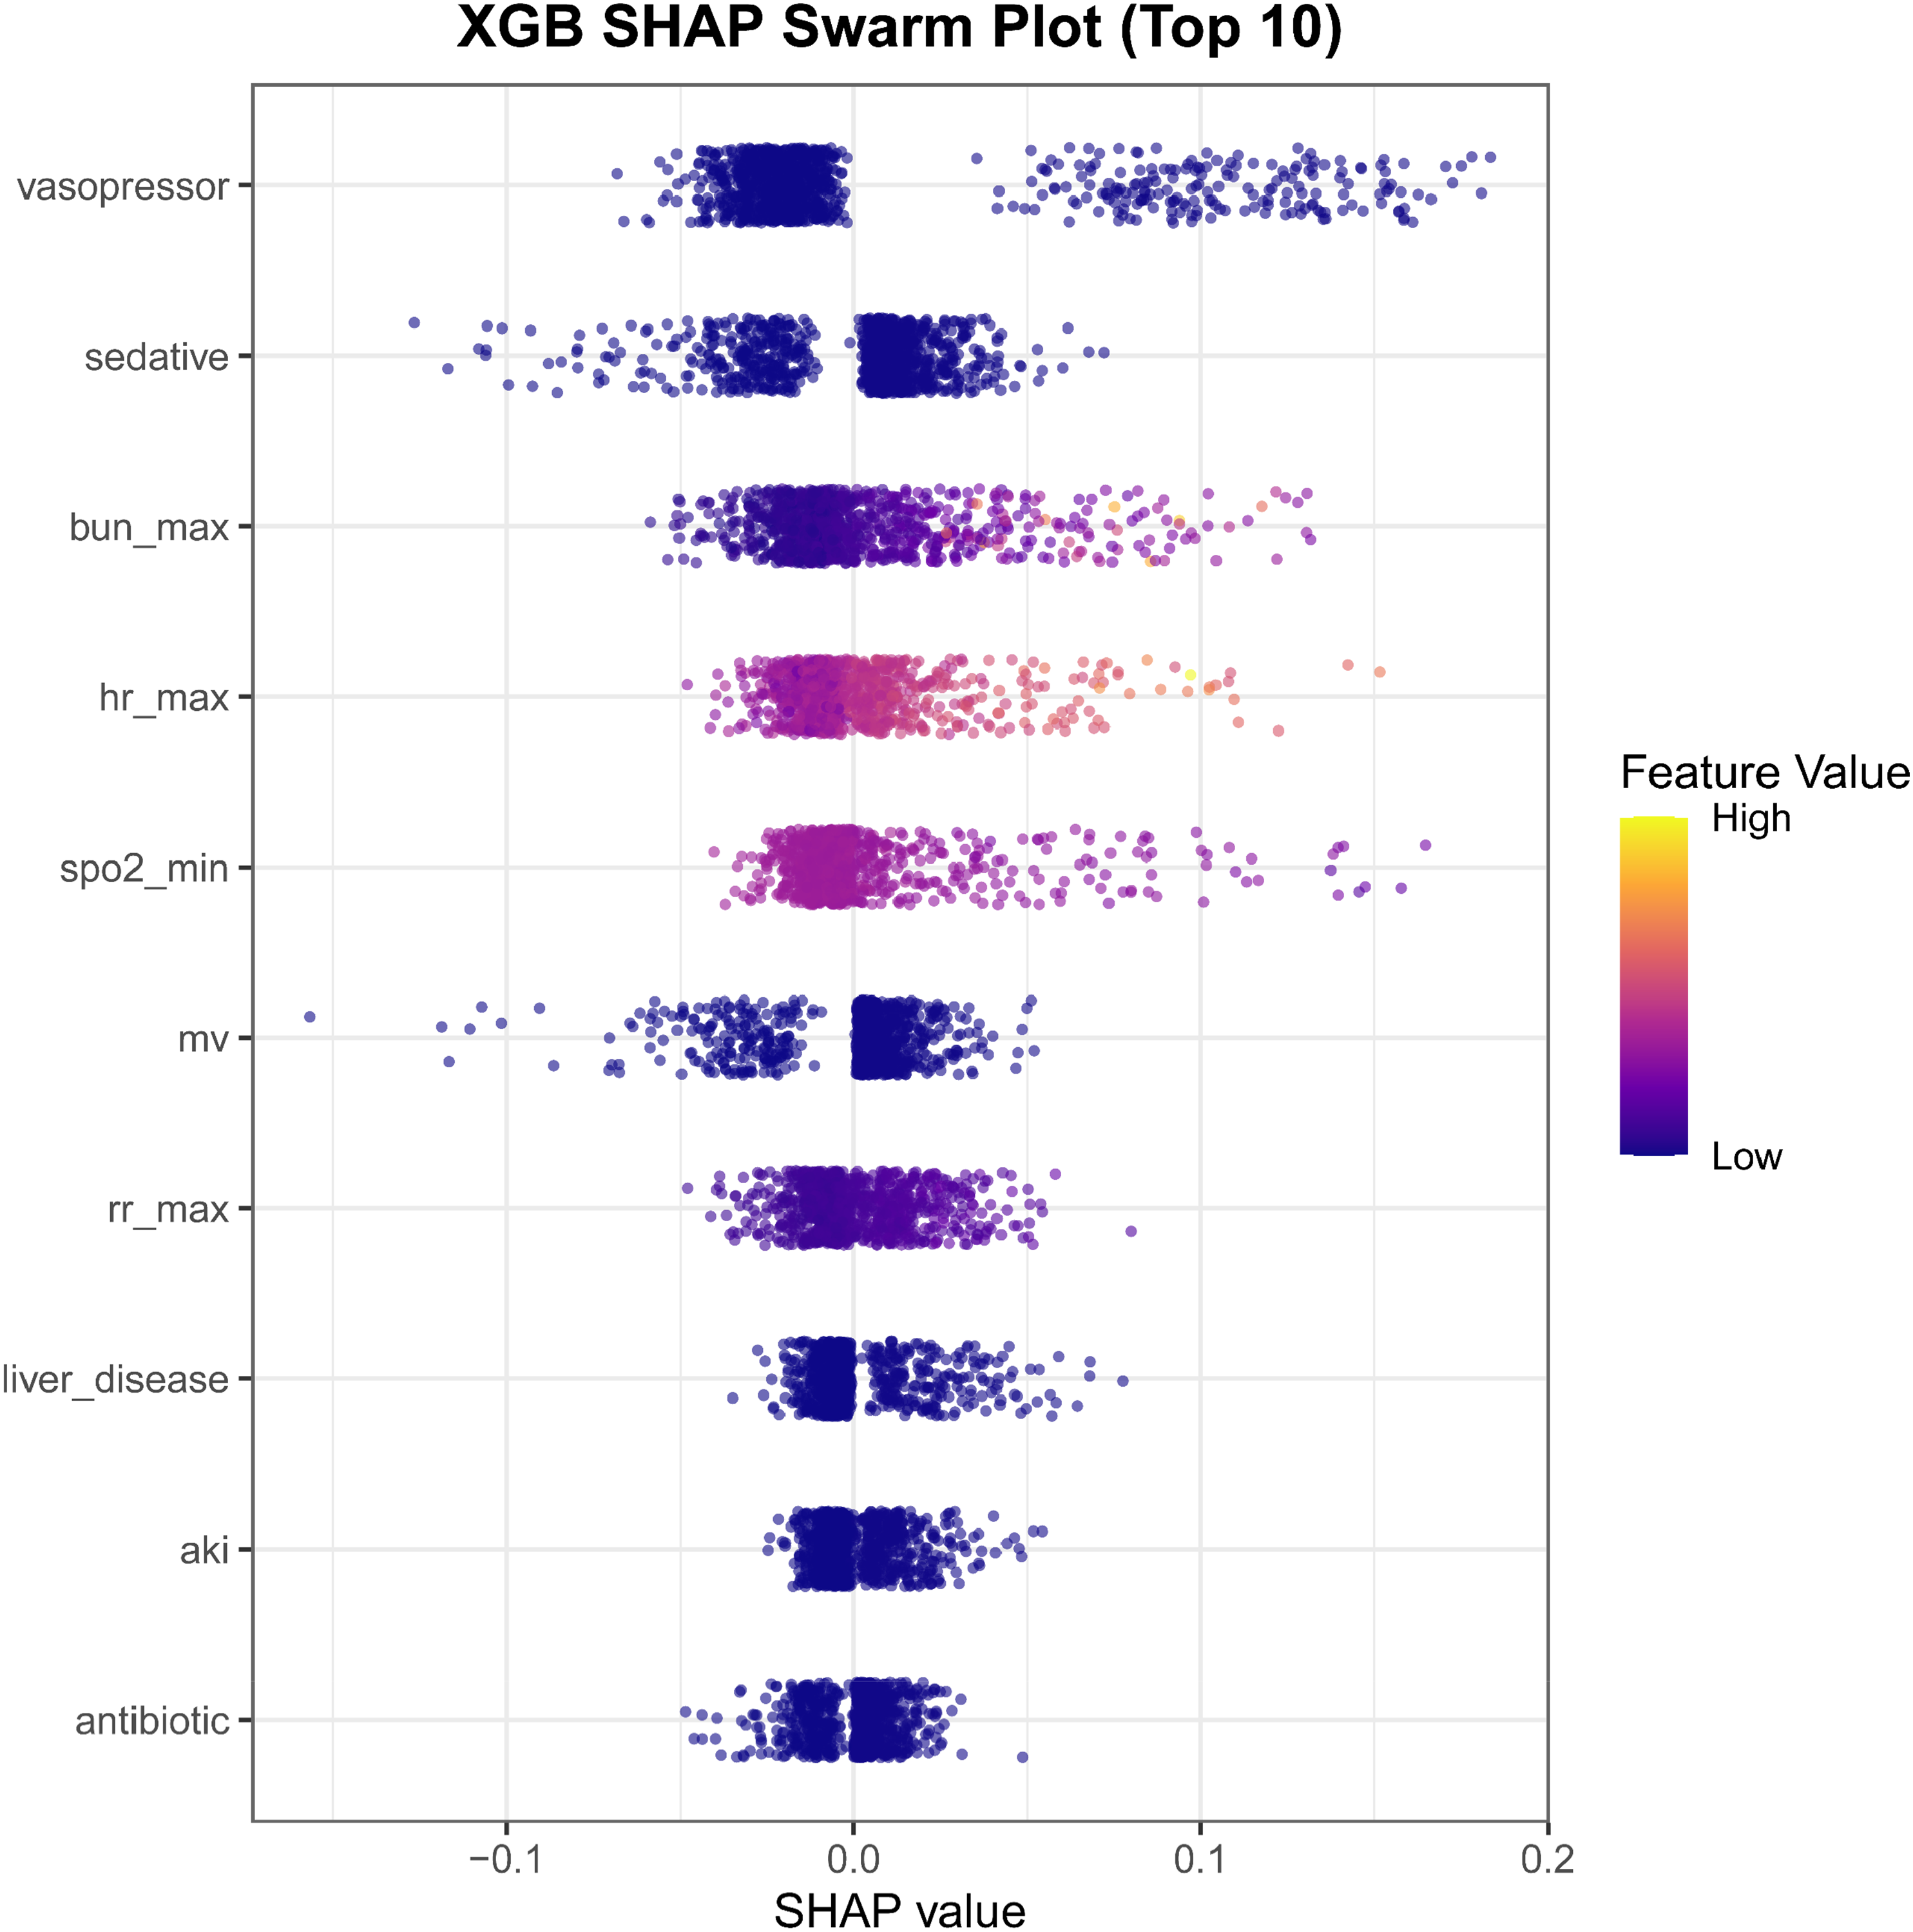
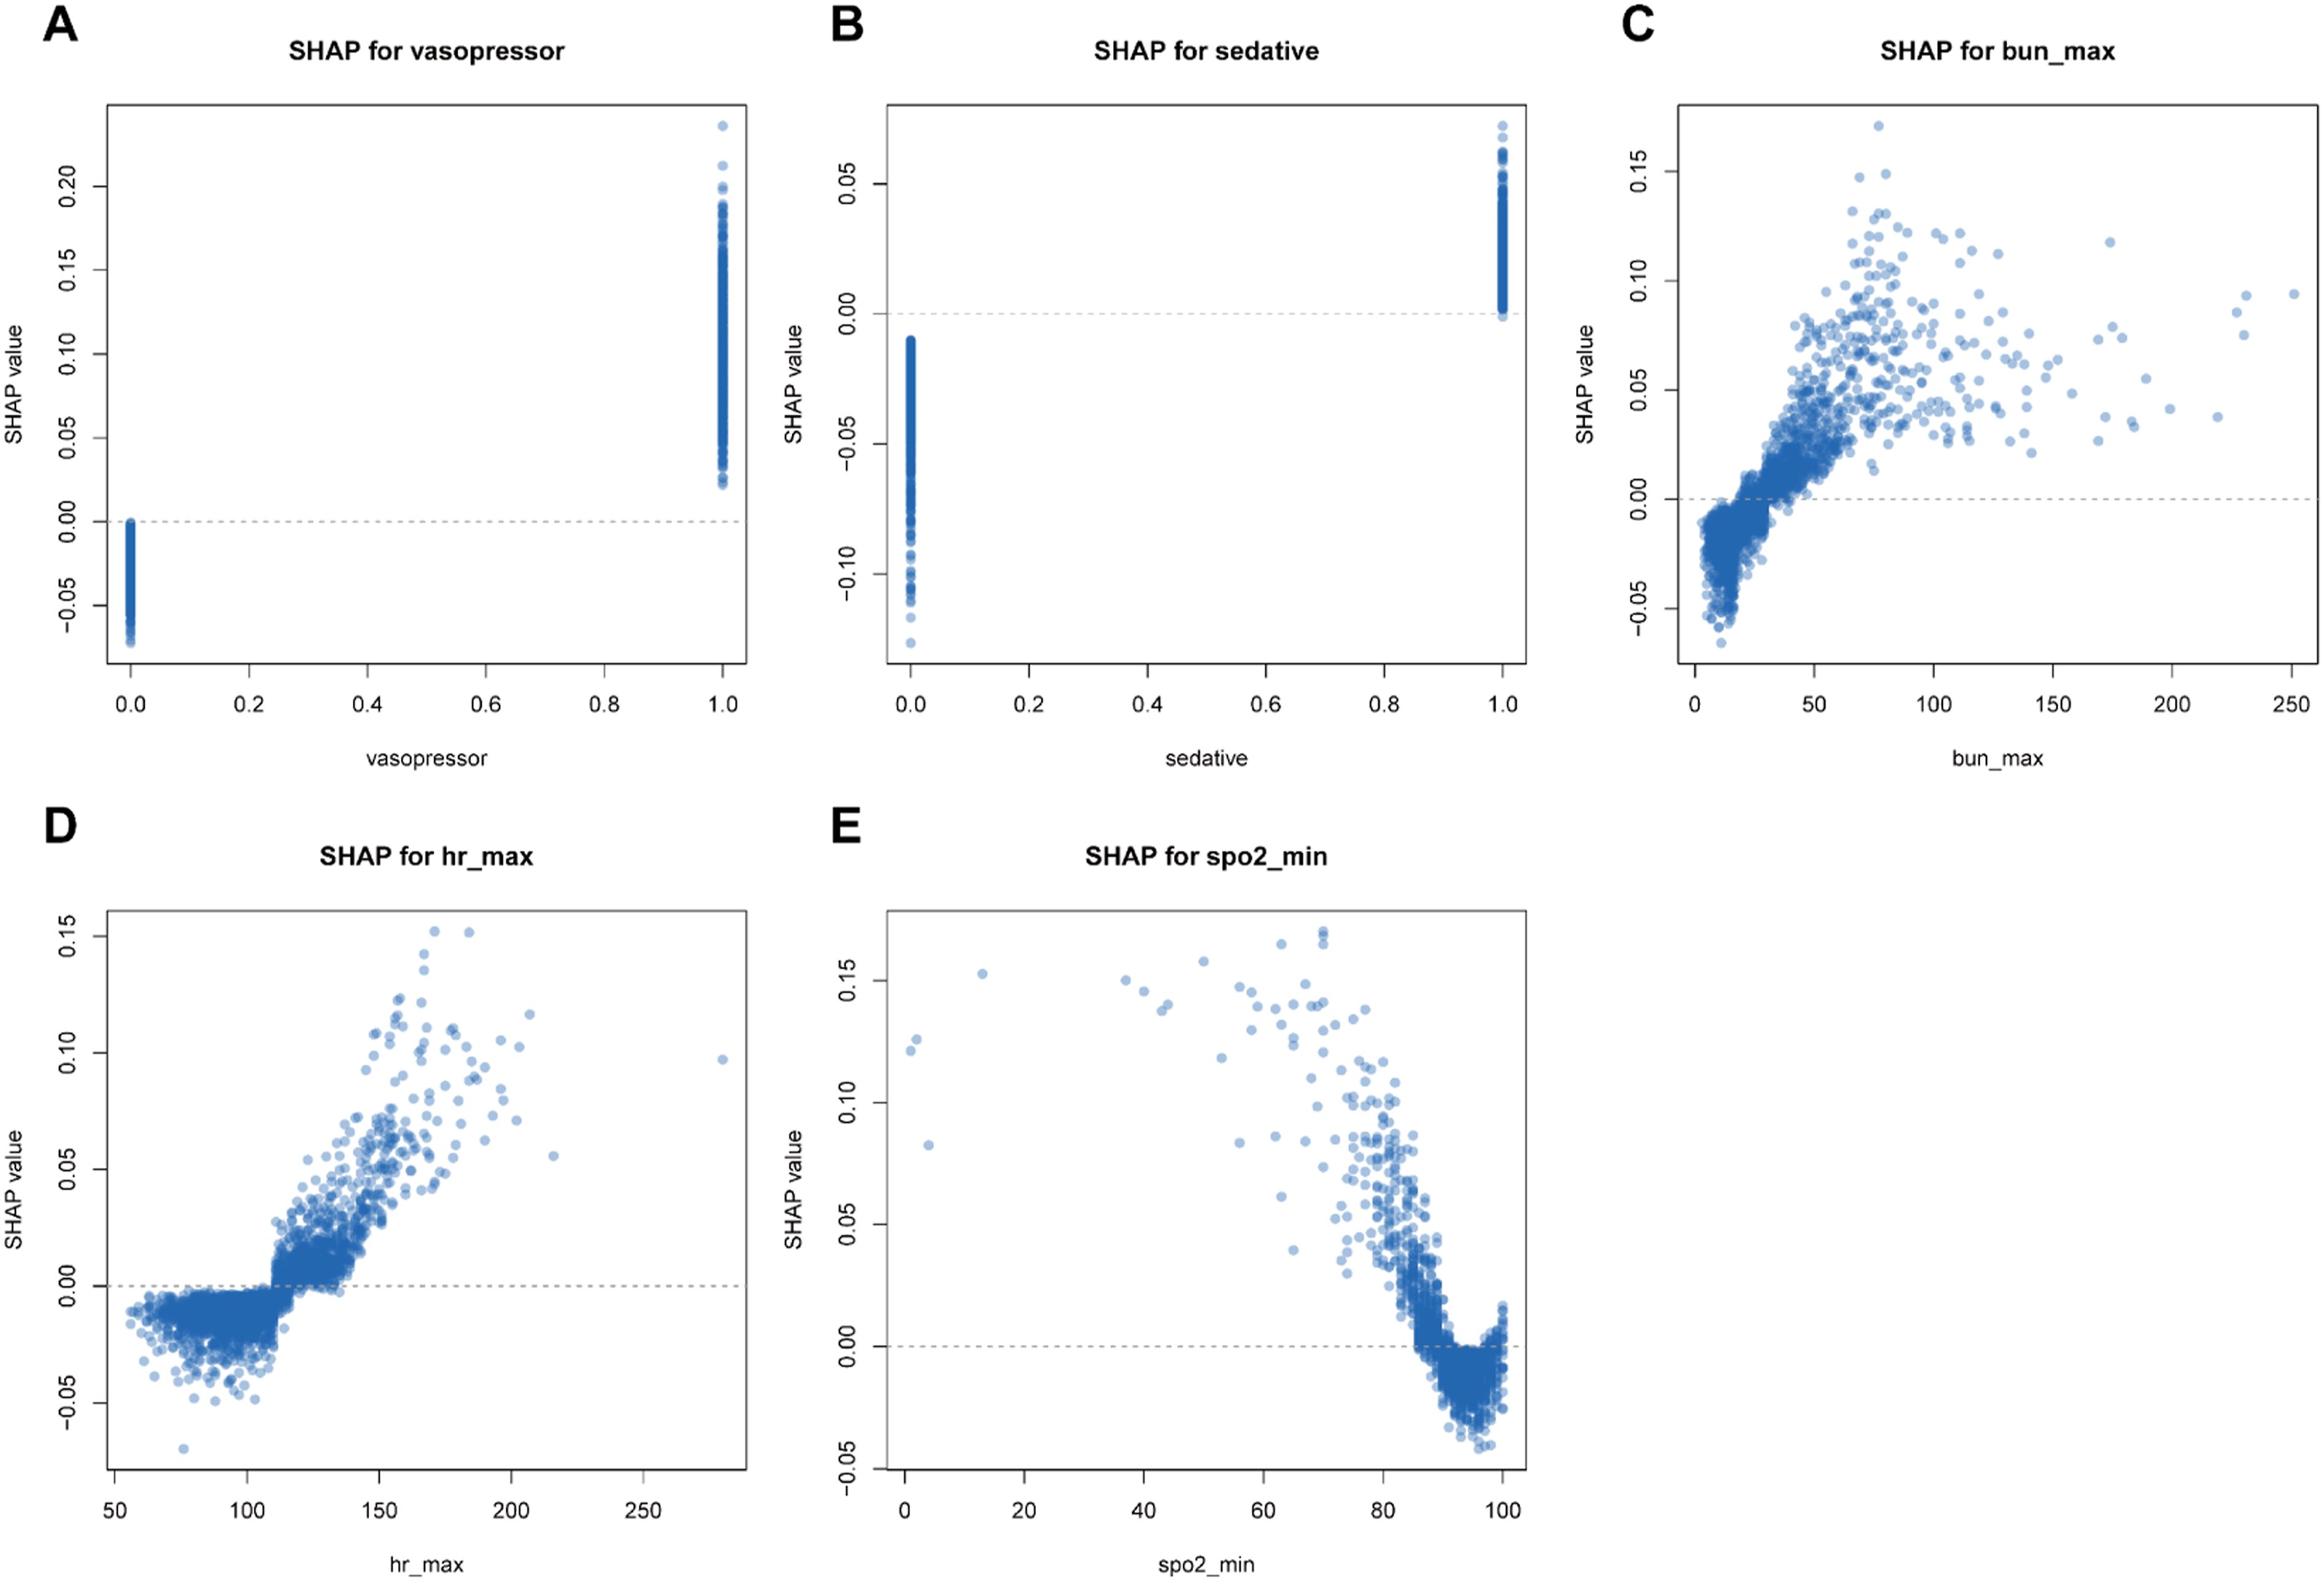
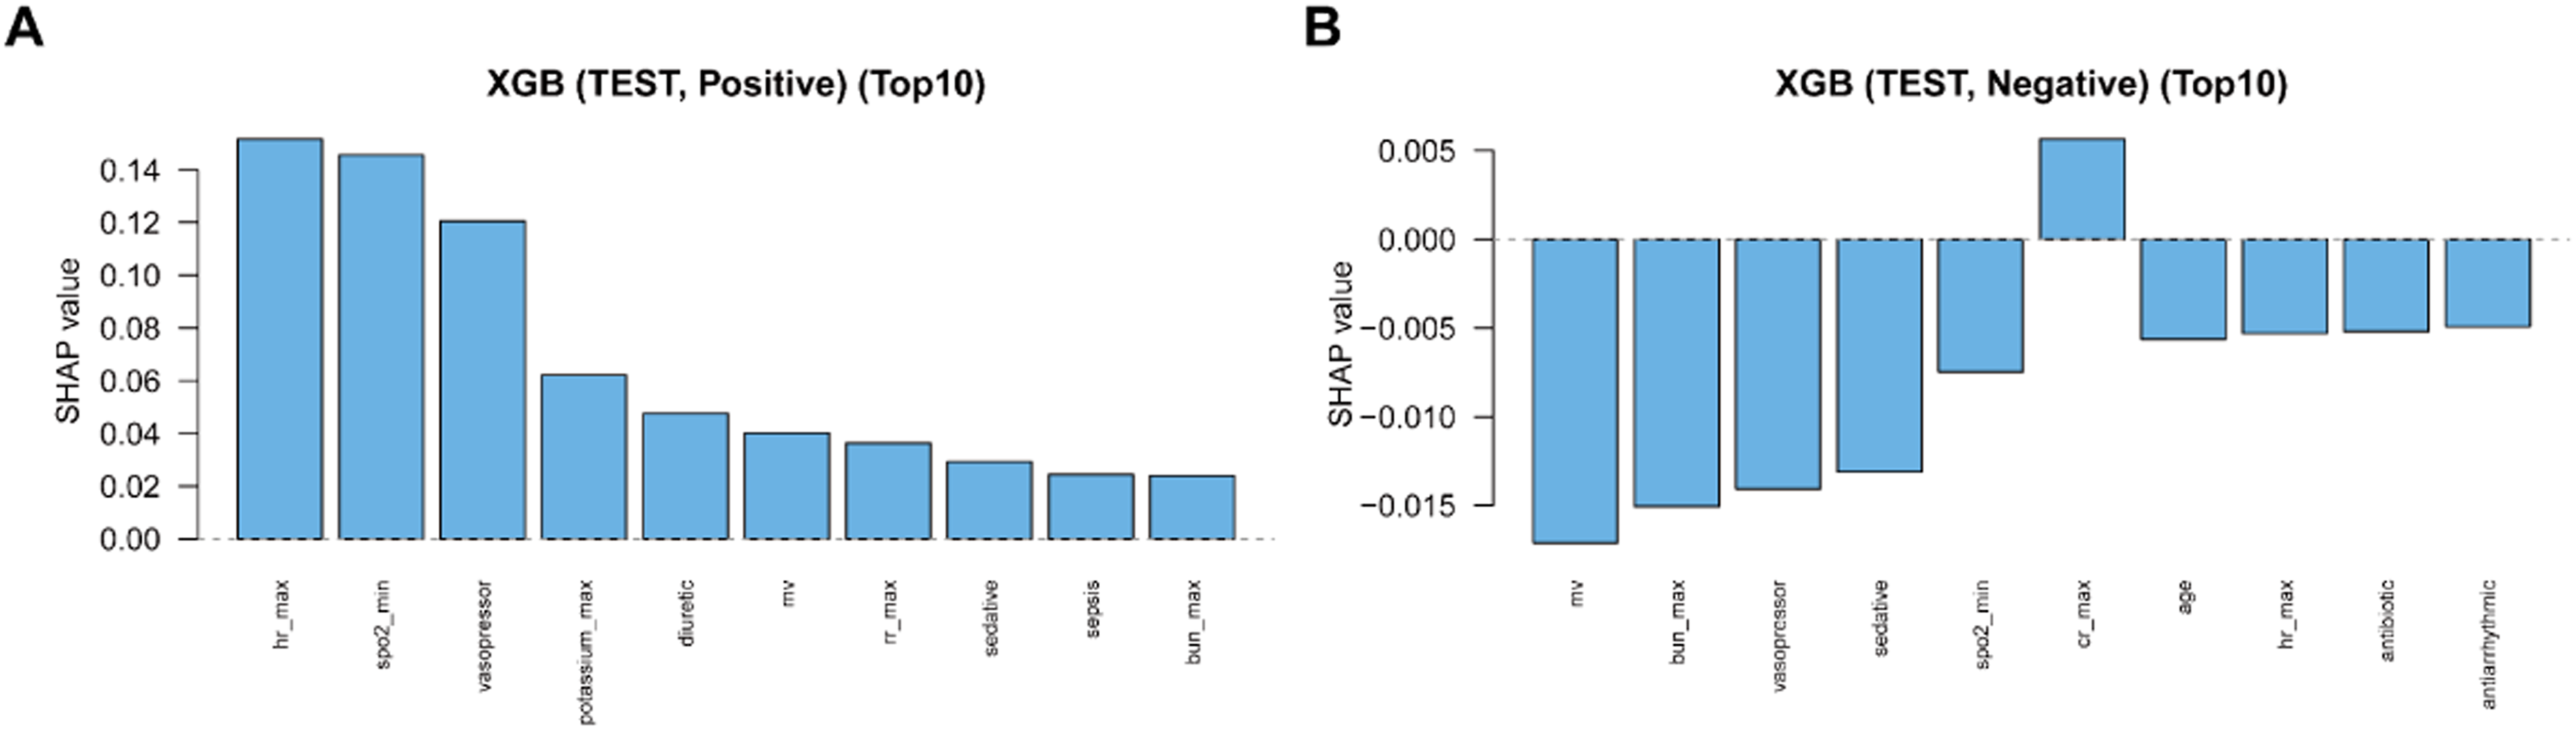
In the MIMIC internal test set, SHAP analysis identified vasopressor use, sedative exposure, BUN_max, HR_max, SpO2_min, mechanical ventilation, and RR_max as the leading contributors to XGBoost predictions (Figure 7). The beeswarm plot showed that vasopressor use, sedation, mechanical ventilation, higher BUN_max, higher HR_max, higher RR_max, and lower SpO2_min generally shifted predictions toward higher risk (Figure 8). Dependence plots further showed nonlinear patterns for key continuous predictors: HR_max showed a steeper positive contribution beyond approximately 110–120 beats/min, whereas lower SpO2_min values, particularly below approximately 90–92%, contributed to higher predicted risk (Figure 9). Directional summaries stratified by predicted class showed that several variables, including SpO2_min, HR_max, BUN_max, mechanical ventilation, and vasopressor use, contributed differently across positive and negative prediction groups (Figure 10). Global SHAP feature importance for the locked XGBoost model. SHAP beeswarm plot for the top 10 predictors. SHAP dependence plots for key predictors. Bidirectional SHAP contribution spectra. (A) Top positive contributors among patients predicted as positive. (B) Top negative contributors among patients predicted as negative. Bar height represents the signed mean SHAP value within each predicted group.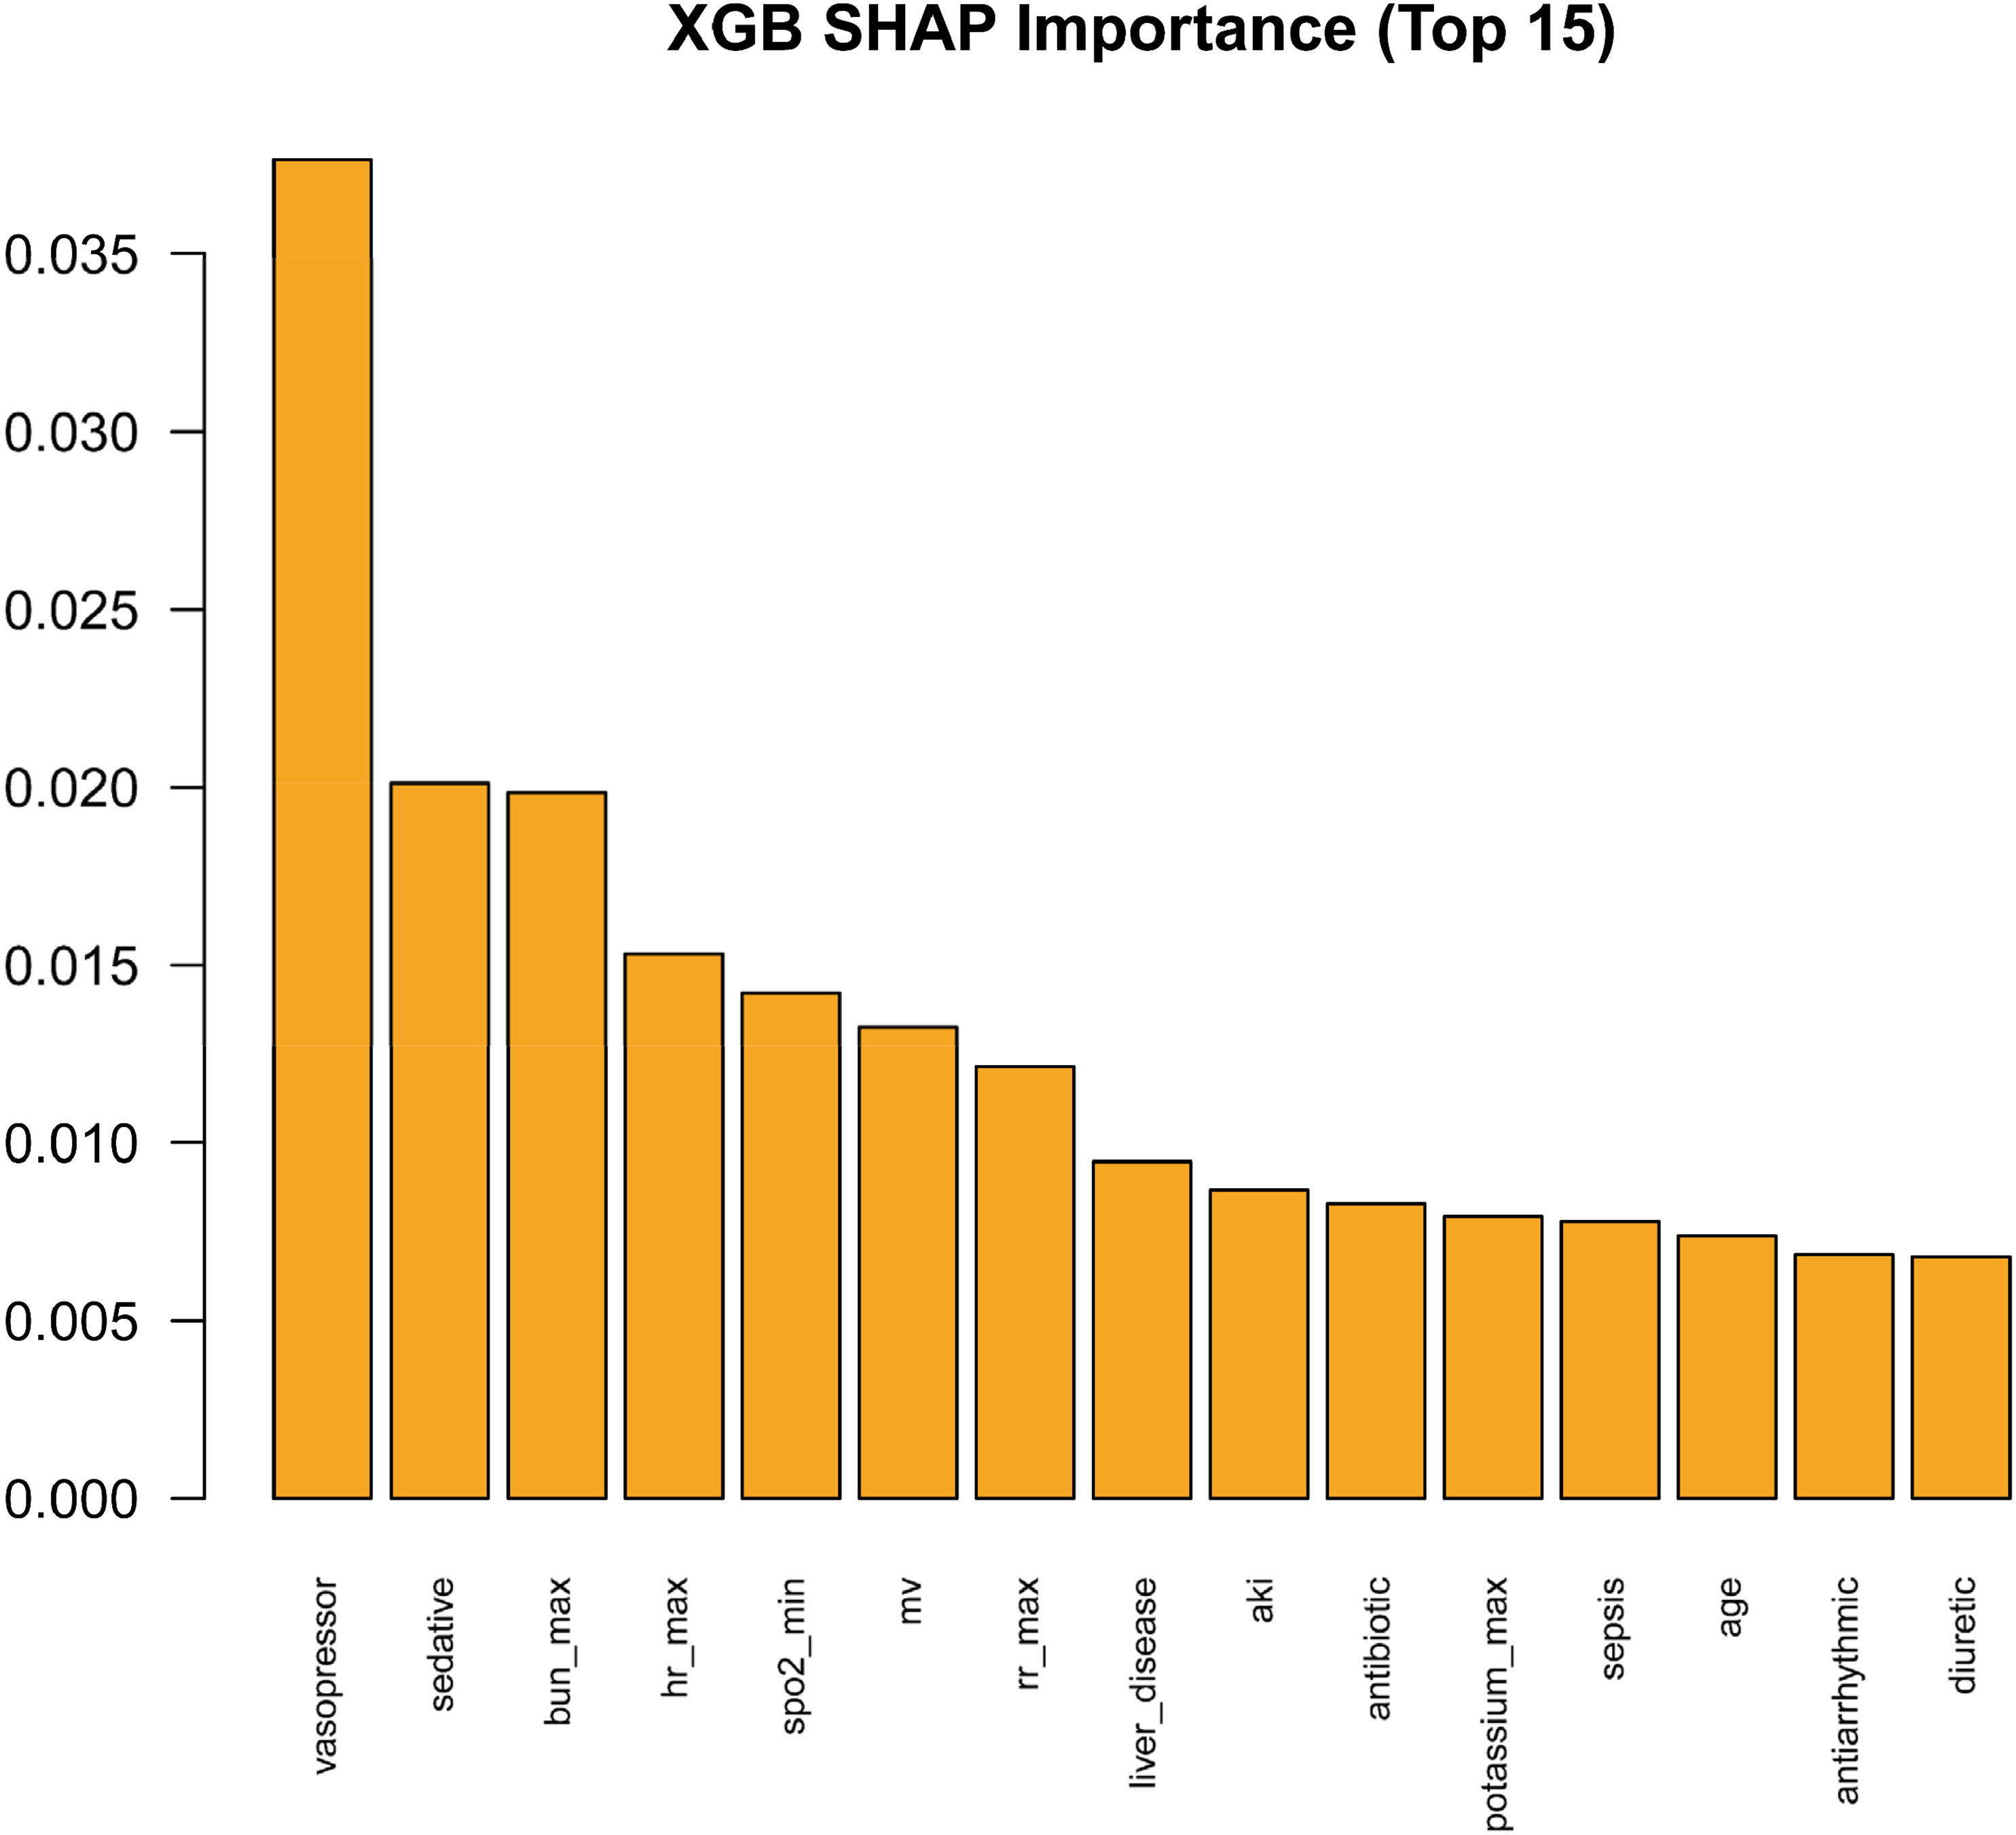
Discussion
In this study, we developed and locked a first-day risk-reassessment framework for ICU mortality during the index ICU stay using routinely available 0–24 h ICU data. XGBoost provided a balanced performance profile across internal testing and external validation, with discrimination, calibration, threshold-dependent metrics, and decision-curve analysis supporting its use as an adjunct reassessment tool after completion of the first ICU day. Model interpretation consistently identified treatment-intensity indicators and acute physiologic stressors as the dominant drivers of predicted risk. These findings support the feasibility of an interpretable, externally validated risk-reassessment framework for oncology ICU patients, while emphasizing that prediction models intended to inform clinical decisions should be evaluated beyond discrimination, with attention to calibration and decision-analytic clinical utility.16–18,24
Conventional severity scores (APACHE, SAPS, SOFA) remain valuable for risk adjustment and benchmarking, yet their extrapolation to cancer ICU populations often reveals two shortcomings: acceptable discrimination but poor calibration, and systematically inflated or deflated standardized mortality ratios (SMRs), which undermine their utility for high-stakes, threshold-based bedside decisions.46,47 Recent ML studies targeting cancer ICUs have reported superior discrimination relative to conventional scores and have begun to provide preliminary external validation in specific subgroups, such as lung cancer, elderly colorectal cancer, and immunocompromised cohorts.27–29 For example, in a lung cancer ICU cohort (MIMIC-IV development; eICU-CRD validation), Huang et al. reported that an ensemble model achieved an AUC of 0.93 in the validation cohort for in-hospital mortality. 28 In the CanICU study predicting 28-day mortality, Ko et al. reported an AUC of 0.939 in the internal YCC test dataset and AUCs of 0.775 (SMC) and 0.753 (MIMIC-III) in external validation cohorts, outperforming SOFA across cohorts. 27 Beyond oncology-specific cohorts, Awad et al. developed an early ICU mortality prediction model using variables from the first 6 h after ICU admission and reported AUROC values up to 0.90 ± 0.01 in cross-validated experiments. 48 Compared with the oncology ICU prediction studies summarized above, the present work adds three elements: a dual-database design using MIMIC-IV for model development/internal validation and eICU-CRD for independent external validation33,34; joint reporting of discrimination, calibration, threshold-dependent performance, and decision-curve utility16–18,24; and SHAP-based interpretation of the locked XGBoost model. These elements address common gaps in transportability, clinical utility, and interpretability while remaining within a routinely available 0–24 h predictor window.
The leading predictors were clinically plausible. Treatment-intensity indicators, including vasopressor use, mechanical ventilation, and sedation, reflected the severity of the day-1 clinical course rather than baseline risk; sedation depth and early sedation have been associated with adverse outcomes in mechanically ventilated ICU cohorts.49,50 Physiologic and biochemical extremes, including HR_max, SpO2_min, BUN_max, and potassium_max, captured acute organ stress, with elevated BUN previously linked to long-term mortality in critically ill patients. 51 Because intervention variables are affected by indication and time-dependent confounding, their SHAP contributions should be interpreted as predictive associations rather than treatment effects; causal analyses of such time-varying exposures require dedicated frameworks such as marginal structural models. 52
Because ROC-AUC can provide an incomplete impression of classifier performance in imbalanced datasets, we interpreted discrimination together with PR-AUC, sensitivity, PPV, and F2 rather than relying on ROC-AUC alone. 53 We further considered calibration and decision-curve net benefit, because prediction models intended to support clinical decisions require reliable probability estimates and clinically meaningful threshold-based utility, not ranking performance alone.16–18,24,54 This combined evaluation supports XGBoost as a balanced model across discrimination, class-imbalance-sensitive metrics, calibration, and clinical utility, rather than as the best-performing model on every individual metric.
Cross-database transportability should be interpreted cautiously because MIMIC-IV and eICU-CRD differ in data source, center structure, monitoring density, treatment exposure, and care processes.33,34 Such differences can preserve discrimination while degrading calibration, so acceptable external AUC should not be equated with deployment-ready risk estimates.16,46 In this study, XGBoost maintained stable external discrimination, calibration, and net benefit in eICU, although selected comparator models performed slightly better on some external metrics. These findings support cautious transportability while reinforcing the need for local calibration assessment before deployment.16,17,46 After completion of the first ICU day, the model may support subsequent monitoring prioritization, resource allocation, and short-cycle reassessment, but should complement rather than replace clinician-led decision-making.18,54
This study has several limitations. First, because predictors were defined over the first 0–24 h, we restricted the cohort to index ICU stays ≥24 h; this necessarily excluded patients who died or were discharged within the first 24 hours and may introduce survivorship bias, limiting applicability for ultra-early risk estimation at ICU admission. Accordingly, the present model should not be used to estimate risk at the moment of ICU admission or in patients who die or are discharged before the 24-h predictor window is complete. Future studies should extend the framework to ICU stays <24 h by using admission-only or early-window (e.g., first 6 h) predictors to enable truly early prediction at ICU admission. Second, the retrospective design cannot fully eliminate residual confounding and measurement error. Definitions of sepsis and AKI based on ICD codes or billing data are prone to misclassification and temporal sensitivity, which may affect the objectivity and comparability of risk estimates. Although pre-imputation missingness was low in MIMIC and modest in eICU, laboratory missingness may partly reflect site-specific measurement frequency and clinical workflow differences; therefore, residual missingness-related bias may persist despite prespecified imputation and frozen preprocessing. Third, restricting candidate variables to those available within the first 0–24 hours excluded key oncologic factors—such as tumor stage, burden, molecular subtype, and the timing of immunotherapy or targeted therapy—limiting fine-grained stratification and clinical interpretability for specific subgroups. Fourth, the strong associations observed between intervention variables (e.g., vasopressors, mechanical ventilation, sedation) and outcomes may be driven by indication and time-dependent confounding. While useful for first-day risk reassessment, these variables should not be interpreted causally. If the model were misinterpreted as an admission-time prediction tool, inclusion of treatment-escalation indicators and 0–24-h extreme values could overstate apparent performance for truly early decision-making. Sensitivity analyses using marginal structural models or active-comparator/new-user designs are warranted. Complementary admission-only, early-window, and intervention-excluded models will be needed to quantify robustness for earlier decision points. Fifth, we did not systematically evaluate model fairness or heterogeneity across sex, age, tumor types, or socioeconomic status. Real-world evidence suggests that clinical algorithms can exhibit systematic bias across populations, highlighting the need for stratified auditing and governance prior to deployment. 55 Sixth, the present framework is static and limited to the first 0–24 hours, without explicit modeling of high-frequency temporal dynamics or state transitions. Future work should explore rolling-window approaches and dynamic re-evaluation triggers to more sensitively capture risk evolution. 20 Seventh, no formal a priori sample-size or power calculation was performed. The study size was data-driven because all eligible admissions identified from MIMIC-IV and eICU-CRD after prespecified eligibility screening were included, rather than being determined by prospectively planned enrollment targets. Although the resulting cohorts were large and provided substantial numbers of outcome events for model development and external validation, the absence of a formal a priori sample-size framework should be considered when interpreting statistical precision and generalizability.
Future work should prioritize prospective impact evaluation, local calibration assessment, drift monitoring, dynamic rolling-window updating, and oncology-specific subgroup refinement. Prospective evaluation and reporting of AI-enabled clinical prediction models should follow established trial, reporting, and risk-of-bias guidance where applicable.26,31,32 Because external validation may preserve discrimination while calibration shifts, local calibration assessment and post-deployment drift monitoring should precede cross-institutional implementation.16,17,46 Additional oncology-specific predictors, including tumor stage, treatment timeline, molecular subtype, and treatment-related toxicity, may improve clinical granularity, whereas dynamic rolling-window updating may better capture evolving ICU risk. 20
Conclusion
Using routinely available information collected during the first 0–24 hours of ICU admission, we established a transparent and auditable framework for first-day risk reassessment of ICU mortality during the index ICU stay after completion of the 24-h predictor window in critically ill cancer patients, combining LASSO feature selection, XGBoost modeling, and TreeSHAP interpretation. The framework demonstrated strong internal test performance (AUC 0.864; PR-AUC 0.428; sensitivity 0.807; F2 0.558) and stable external performance (AUC 0.848; PR-AUC 0.367; sensitivity 0.794; F2 0.487), together with consistent calibration and sustained positive net benefit across clinically relevant thresholds. The model primarily captured the joint contribution of treatment intensity indicators (vasopressors, sedation, mechanical ventilation) and acute physiologic stressors (HR_max, SpO2_min, BUN_max, K+_max), revealing nonlinear and threshold effects that were interpretable across global, cohort, and individual levels. Clinically, this tool should be viewed as an adjunct stratification aid rather than a replacement for physician judgment. After completion of the first ICU day and with appropriate local recalibration, it can support subsequent prioritization of monitoring and interventions, facilitate short-cycle reassessment for reversible high-risk patients, and provide a unified risk scale for multicenter research and quality improvement. Embedding recalibration and model updating into routine MLOps pipelines, together with transparent reporting and governance procedures, will help ensure reproducibility, auditability, and accountability. Overall, this study delivers a transferable, interpretable, and deployable risk prediction framework for oncology ICUs, advancing critical care oncology from an experience-driven paradigm toward one that is evidence-driven and explanation-supported.
Supplemental material
Supplemental material - Interpretable early mortality prediction in oncology ICU patients: A dual-cohort validation of a LASSO–XGBoost–SHAP framework
Supplemental material for Interpretable early mortality prediction in oncology ICU patients: A dual-cohort validation of a LASSO–XGBoost–SHAP framework by Xinyi Chen, Lu Wang, Wan Qin, Mu Yang, Yuanmei Yan, Xiaoxiao Luo, Xianglin Yuan in DIGITAL HEALTH
Supplemental material
Supplemental material - Interpretable early mortality prediction in oncology ICU patients: A dual-cohort validation of a LASSO–XGBoost–SHAP framework
Supplemental material for Interpretable early mortality prediction in oncology ICU patients: A dual-cohort validation of a LASSO–XGBoost–SHAP framework by Xinyi Chen, Lu Wang, Wan Qin, Mu Yang, Yuanmei Yan, Xiaoxiao Luo, Xianglin Yuan in DIGITAL HEALTH
Supplemental material
Supplemental material - Interpretable early mortality prediction in oncology ICU patients: A dual-cohort validation of a LASSO–XGBoost–SHAP framework
Supplemental material for Interpretable early mortality prediction in oncology ICU patients: A dual-cohort validation of a LASSO–XGBoost–SHAP framework by Xinyi Chen, Lu Wang, Wan Qin, Mu Yang, Yuanmei Yan, Xiaoxiao Luo, Xianglin Yuan in DIGITAL HEALTH
Footnotes
Acknowledgements
The authors sincerely thank the PhysioNet team and the Laboratory for Computational Physiology at the Massachusetts Institute of Technology for maintaining the MIMIC-IV and eICU databases and for their contributions to open clinical data science. In preparing this manuscript, ChatGPT (OpenAI) was used to assist with language editing to improve grammar, clarity, and readability. Limited AI assistance was also used during code development for debugging support only. AI tools were not used to make scientific decisions, perform autonomous data analysis, generate final results, generate figures, or interpret clinical findings. All analytical code, model outputs, figures, and statistical interpretations were reviewed and verified by the authors and data analyst, and all authors reviewed and approved the final content and take full responsibility for the accuracy and integrity of the work.
Ethical considerations
This study was conducted in accordance with the Declaration of Helsinki.
Consent to participate
The use of the MIMIC-IV (v2.2) and eICU-CRD databases was approved by the institutional review boards of the Beth Israel Deaconess Medical Center and the Massachusetts Institute of Technology. Both databases contain fully de-identified patient information; therefore, additional institutional ethics approval and informed consent were waived.
Consent for publication
Not applicable, as this study utilized de-identified publicly available datasets and did not involve individual patient data.
Authors’ contributions
CRediT Authorship Contribution Statement.
All authors read and approved the final manuscript.
Funding
The authors disclosed receipt of the following financial support for the research, authorship, and/or publication of this article: This work was supported by the National Natural Science Foundation of China (General Program, Grant No. 82373522; Young Scientists Fund, Grant No. 82503499) and the China Postdoctoral Science Foundation (Grant No. 2024M761057). The funders had no role in the design of the study, analysis, interpretation of data, or in writing the manuscript.
Declaration of conflicting interests
The authors declared no potential conflicts of interest with respect to the research, authorship, and/or publication of this article.
Data Availability Statement
The datasets analyzed in this study are publicly available. The MIMIC-IV database (version 2.2) can be accessed via PhysioNet at https://physionet.org/content/mimiciv/2.2/ for credentialed researchers who complete the required training and data use agreement. The eICU Collaborative Research Database is also accessible at  under the same requirements. Analytical code and scripts used during the current study are available from the corresponding authors upon reasonable request.
Supplemental material
Supplemental material for this article is available online.
References
Supplementary Material
Please find the following supplemental material available below.
For Open Access articles published under a Creative Commons License, all supplemental material carries the same license as the article it is associated with.
For non-Open Access articles published, all supplemental material carries a non-exclusive license, and permission requests for re-use of supplemental material or any part of supplemental material shall be sent directly to the copyright owner as specified in the copyright notice associated with the article.
