






Abstract
Objective
This proof-of-concept study aimed to develop and preliminarily validate a hybrid artificial intelligence (AI) model that combines 2D facial photographs with clinical variables for non-invasive pediatric adenoid hypertrophy (AH) screening.
Methods
11,465 full-face photographs (2,097 children, 6–14 years) were retrospectively collected and labeled by adenoid-to-nasopharyngeal ratio (>0.6 was defined as AH). A multi-stage optimization framework was employed to develop a photo-based deep learning model (AHDNet). Subsequently, features from AHDNet were integrated with clinical variables to construct a hybrid model (HM). Comprehensive model evaluation was performed using multiple metrics and interpretability methods. AHDNet’s performance was also benchmarked against 21 clinicians of varying experience. To support further model optimization, an open-access testing platform was provided.
Results
For preliminary screening, AHDNet achieved an area under the receiver operating characteristic curve (AUC) of 0.669 (95% confidence interval [CI] 0.584–0.748), showing a discriminatory ability comparable to that of human raters. The HM exhibited improved performance with an AUC of 0.712 (95% CI 0.630–0.784) and more favorable calibration. Decision curve analysis (DCA) revealed that the HM maintained positive net benefit within the threshold range of 0.133 to 0.429. Interpretability analysis highlighted the eyes and mandibular angle as key discriminative regions and identified narrow maxillary dental arches and strained lip closure as significant clinical risk factors.
Conclusions
As a proof-of-concept, the hybrid AI model may serve as a non-invasive tool to assist with preliminary screening for pediatric AH, potentially facilitating timely detection and reducing the risk of subsequent maxillofacial deformities associated with AH.
Keywords
Introduction
Adenoid hypertrophy (AH), the most common cause of pediatric upper airway obstruction, affects 34.46% of children. 1 When left untreated, this chronic obstruction can remodel the craniofacial skeleton and significantly impair cardiopulmonary, neurocognitive, and sleep health.2–4 Current diagnostic methods, including clinical examination, endoscopy, cephalometry, cone beam computed tomography (CBCT), and ultrasound, are often subjective, invasive, associated with radiation exposure, dependent on operator skill, and limited in availability.5,6 These challenges often lead to delayed diagnosis and referral, highlighting the critical need for more accessible and reliable screening tools.
A key visible outcome of this process is adenoid facies, a suite of craniofacial alterations affecting the lips, mandible, eyes, nose, and facial muscles.7,8 Unfortunately, these tell-tale signs are often overlooked due to limited awareness among families and a lack of systematic screening guidelines. 9 Meanwhile, artificial intelligence (AI) has emerged as a transformative force in medical diagnostics, with deep learning models for facial analysis gaining attention as a promising method for disease screening. 10 Indeed, the feasibility of this approach has been demonstrated for several medical conditions directly from 2D facial images, including detecting coronary artery disease, 11 early identification of visual impairment in young children, 12 and predicting skin cancer risk using explainable AI. 13 In orthodontics, deep learning-based 3D facial analysis models can be used to predict facial outcomes after orthodontic treatment and orthognathic surgery.14,15 This blend of clinical need and technological advancement underscores AI-driven facial screening as a promising strategy for the early, low-burden detection of AH.
Nonetheless, translating this paradigm into effective AH diagnostic tools has been hindered by preliminary research, insufficient data, and inadequate model performance.16,17 Previous efforts, while valuable, have been limited to manual feature engineering from landmarks 16 or 3D points on relatively small cohorts, 18 resulting in suboptimal accuracy. Moreover, while graph neural networks have been explored for pediatric obstructive sleep apnea, 19 to the best of our knowledge, no study has yet developed a deep learning model for the auxiliary screening of AH using full-face 2D photographs. To address this issue, we hypothesize that a deep learning model trained directly on such photographs can detect the altered facial features associated with the progression of AH, thereby offering a potential tool for its timely screening.
Therefore, we developed and rigorously validated a deep learning model for AH screening directly from 2D facial photographs. To our knowledge, this study leverages the largest dedicated facial dataset for AH (11,465 photographs) to date and addresses prior limitations through a designed pipeline that analyzes multi-view images, employs class-imbalanced dynamic sampling, and incorporates a feature-fusion architecture. Beyond performance evaluation, we enhance clinical interpretability using ablation studies, Gradient-weighted Class Activation Mapping (Grad-CAM), and SHapley Additive exPlanations (SHAP) analysis. Furthermore, we present a quantitative analysis of facial region contributions, which may help capture subtle facial changes related to AH and assist clinical recognition of adenoid facies. By integrating a scalable technological solution with clinically relevant insights, our work establishes a novel, interpretable, and user-friendly framework for non-invasive auxiliary AH screening, thereby offering a practical strategy to facilitate timely identification and intervention.
Methods
Ethics approval
This study was approved by the Ethics Committee of the Affiliated Stomatological Hospital of Chongqing Medical University (Ethics No: 2025[LSNo.067]) and adhered to the ethical principles of the Declaration of Helsinki. We obtained written informed consent from all patients and their families for the analysis of facial photographs for research purposes, excluding public disclosure. The reporting conforms to the STROBE and TRIPOD+AI 20 checklists (Supplemental Material).
Participants and data collection
A retrospective screening was conducted among children aged 6–14 years from the Department of Orthodontics, the Affiliated Stomatological Hospital of Chongqing Medical University (Jan. 2013–Aug. 2024). The exclusion criteria were as follows: 1) Missing baseline orthodontic records; 2) all facial photographs missing or unclear; 3) CBCT missing or unclear; 4) prior adenoid treatment; 5) prior orthodontic treatment; 6) history of maxillofacial surgery.
Facial photographs and clinical variables were included to develop AH detection models. Each patient contributed 3 to 6 photographs drawn from the following six views: frontal, right 45°, and right 90° views under both neutral and smiling expressions. All photographs were acquired with a digital camera following a standardized protocol in Supplemental Methods 1.1. Facial photo quality was assessed by two reviewers who were blinded to the study according to protocol in Supplemental Methods 1.2. Unqualified facial photos were excluded. The inclusion/exclusion flow and the distribution of photographs are shown in Figure 1. Clinical data were obtained from orthodontic electronic health records and included 12 variables: age, sex, family history, angle classification, facial profile, lip-tooth relationship, anterior overbite, anterior overjet, maxillary dentition crowding, mandibular dentition crowding, mouth breathing, and narrow maxillary dental arch. Patient recruitment workflow. CBCT, Cone Beam Computed Tomography; AH, adenoid hypertrophy. (a), frontal natural view; (b), frontal smiling view; (c), right 45° natural view; (d), right 45° smiling view; (e), right 90° natural view; F, right 90° smiling view.,  , natural expression;
  , smiling expression.
Diagnosis and photo processing
Diagnosis was based on the adenoid-to-nasopharyngeal (A/N) ratio, with A/N >0.60 defining AH and A/N ≤0.60 as normal (Supplemental Methods 1.3). To ensure diagnostic accuracy, two independent orthodontists (H.Q.W. and Y.W., each with 5 years of clinical experience) performed all measurements, while a third senior specialist (H.Z., with 15 years of clinical experience) adjudicated any disagreements. All investigators received standardized training in CBCT measurement prior to the study.
Photographs were preprocessed by applying a face detection algorithm
21
to accurately detect and crop facial regions, removing background noise and focusing the model on anatomy most relevant to disease features. To prevent data leakage, the dataset was randomly split at the patient level into a development set and a test set (8:2 ratio). The development set was used for training and hyperparameter tuning, while the test set was reserved for final evaluation (Figure 2(a)). The distribution of patients and images across the six views is detailed in Supplemental Methods Table 1.1. The workflow diagram. (a) Data processing and data splitting. (b) Backbone network model selection, dynamic sample balancing, and model training. (c) Clinical feature extraction and hybrid model construction. (d) Model interpretability: ablation study, Grad-CAM, and SHAP analysis. AH, adenoid hypertrophy; Grad-CAM, Gradient-weighted Class Activation Mapping; SHAP, SHapley Additive exPlanations.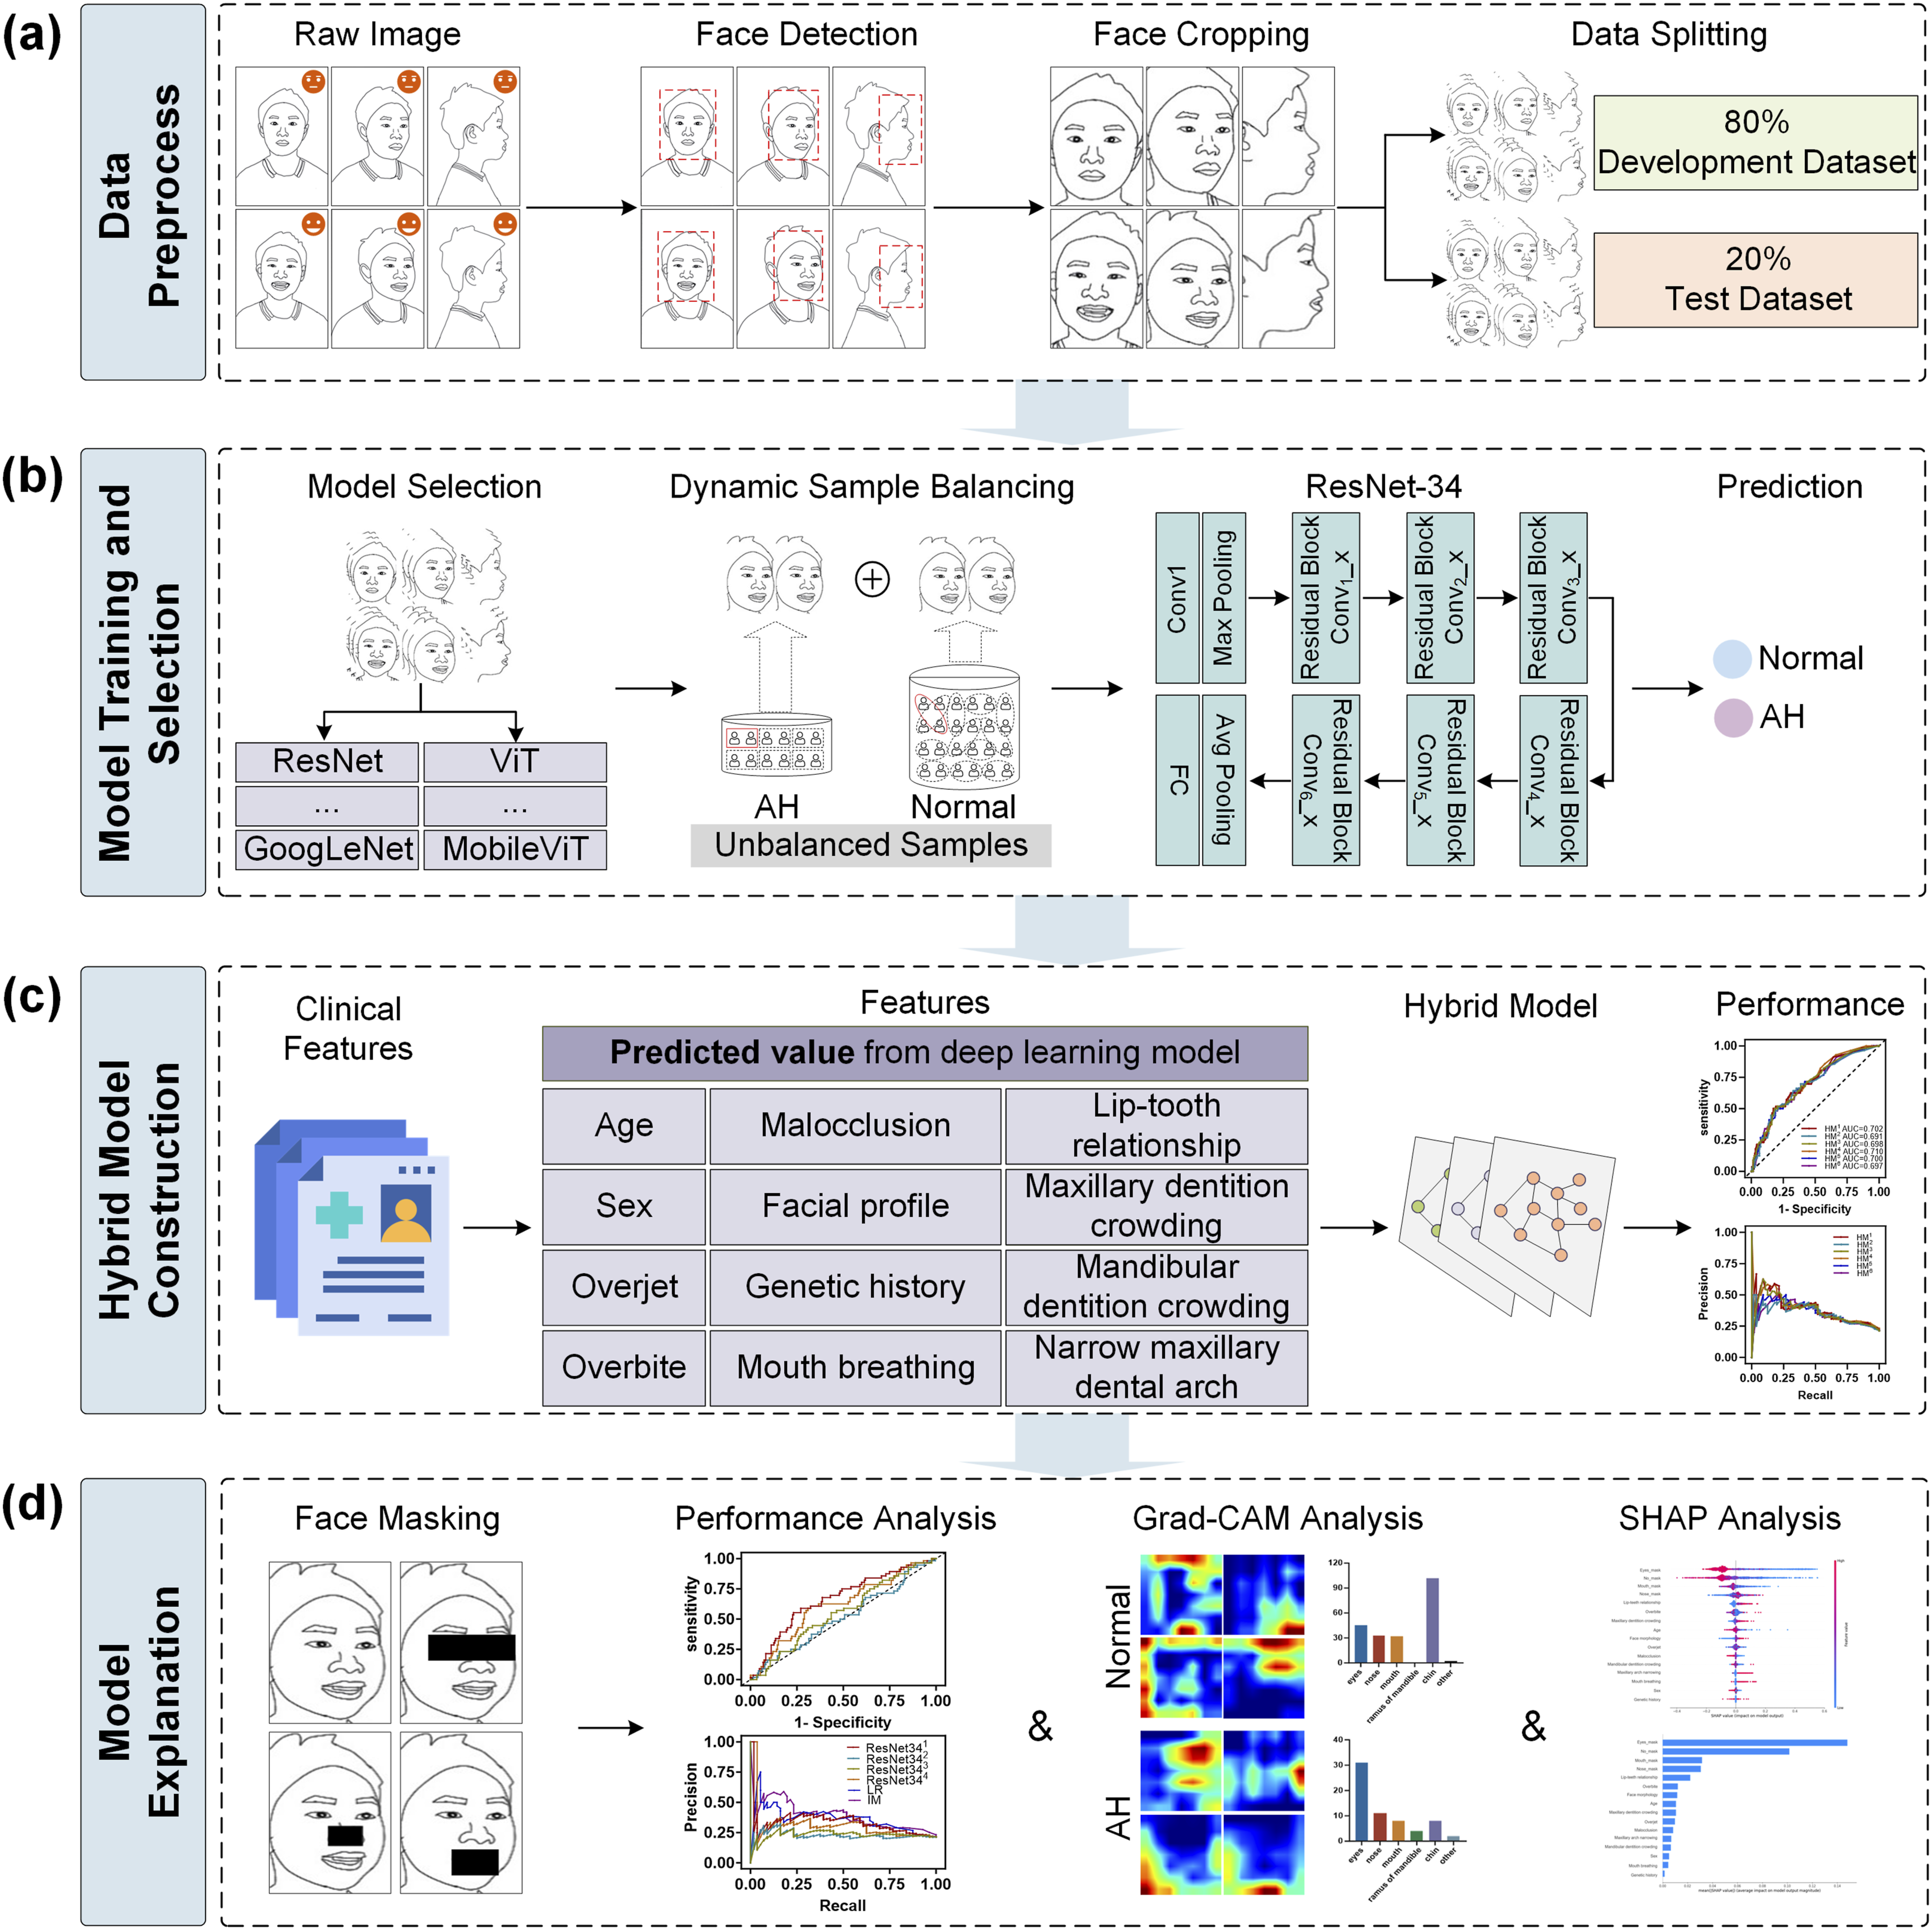
Deep learning model training and selection
Results of the optimal model for each view.
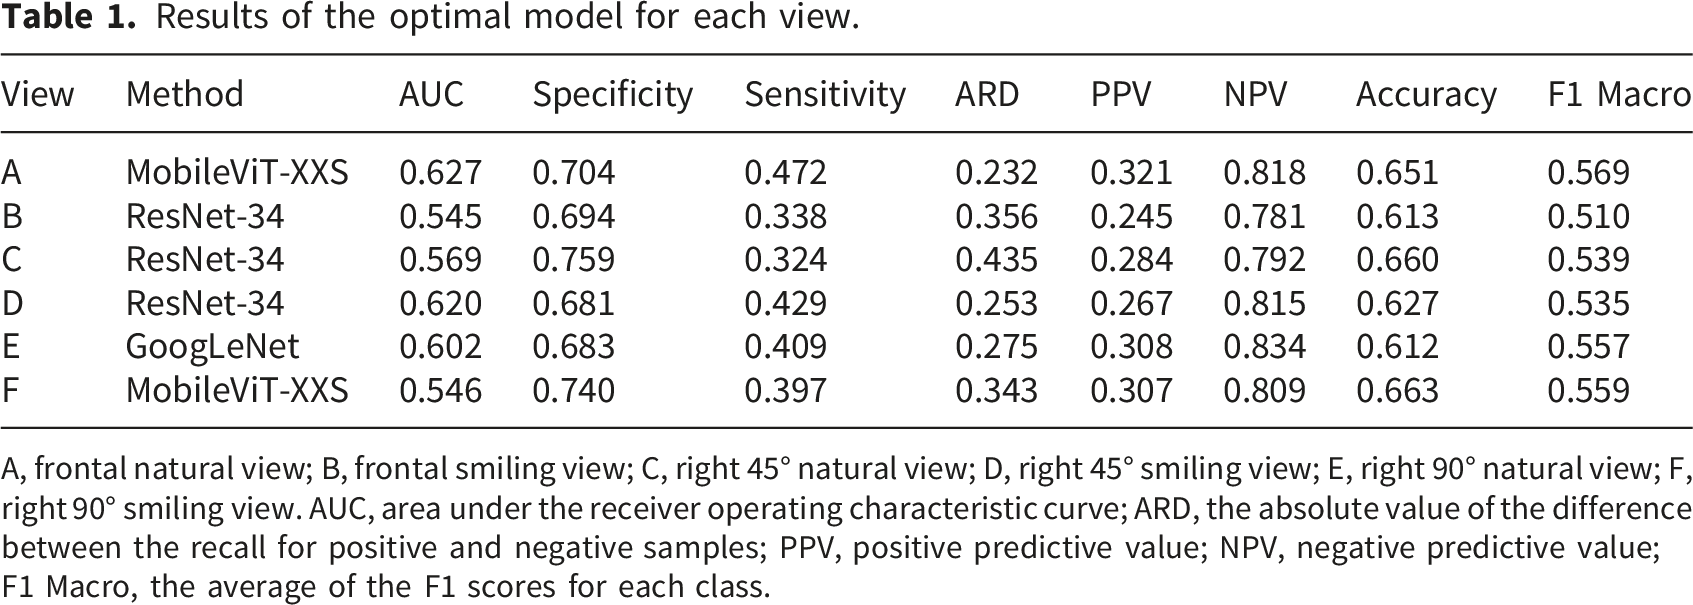
A, frontal natural view; B, frontal smiling view; C, right 45° natural view; D, right 45° smiling view; E, right 90° natural view; F, right 90° smiling view. AUC, area under the receiver operating characteristic curve; ARD, the absolute value of the difference between the recall for positive and negative samples; PPV, positive predictive value; NPV, negative predictive value; F1 Macro, the average of the F1 scores for each class.
Performance of the model under the dynamic sampling strategy.
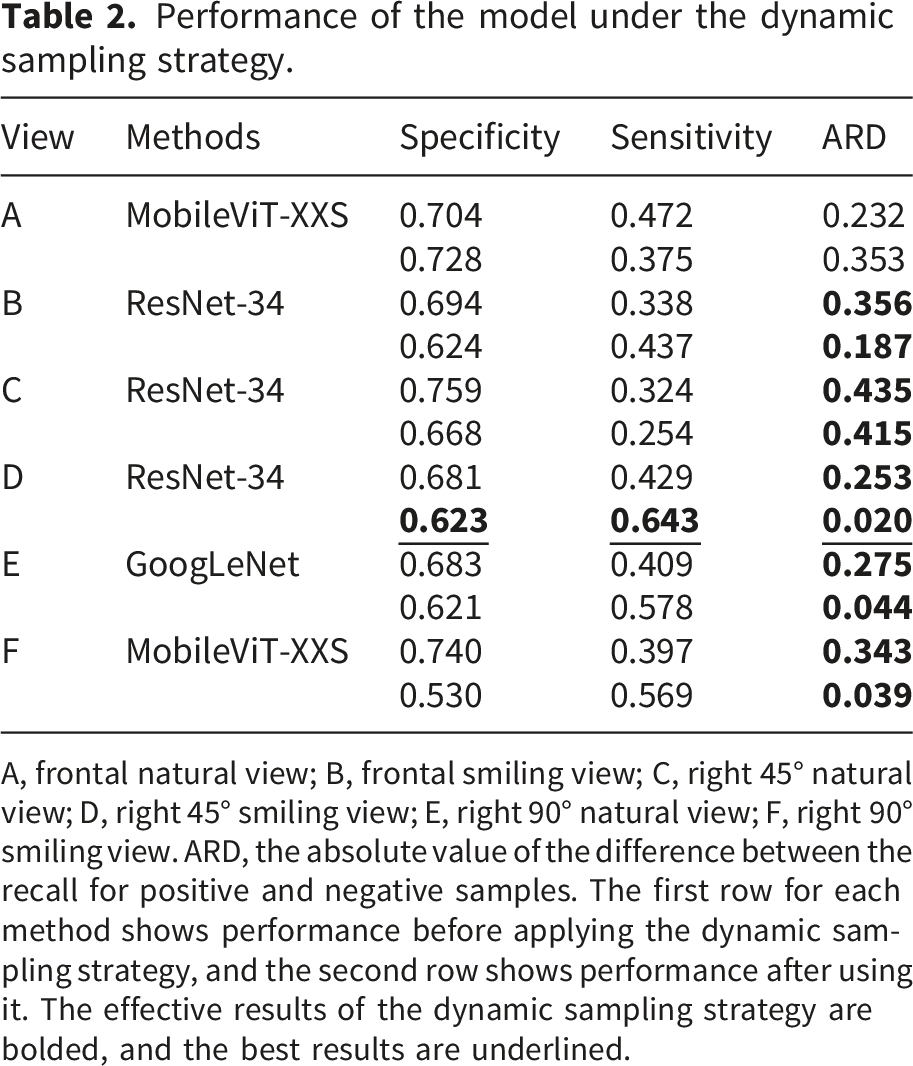
A, frontal natural view; B, frontal smiling view; C, right 45° natural view; D, right 45° smiling view; E, right 90° natural view; F, right 90° smiling view. ARD, the absolute value of the difference between the recall for positive and negative samples. The first row for each method shows performance before applying the dynamic sampling strategy, and the second row shows performance after using it. The effective results of the dynamic sampling strategy are bolded, and the best results are underlined.
For improved generalization, training incorporated data augmentation (random horizontal flipping, rotation, and color jitter). The model was optimized using Adam with a learning rate of 0.0001 over 200 epochs and a batch size of 4. All implementations were based on the PyTorch framework and executed on an NVIDIA RTX A6000 GPU. The workflow for model training and selection is summarized in Figure 2(b).
Hybrid model construction
Given the established clinical relevance of craniofacial and dental characteristics to AH and related obstructive conditions, we extracted 12 candidate clinical features from electronic health records.24,25 These variables included age, sex, family history, Angle’s classification, facial profile, lip-tooth relationship, anterior overjet, anterior overbite, maxillary and mandibular dentition crowding, mouth breathing, and narrow maxillary dental arch. All 12 clinical variables were complete in the dataset, so no imputation for missing data was required. The above 12 variables were subsequently used to develop the logistic regression (LR) model (Supplemental Methods 2.1). Continuous and ordinal variables (age, maxillary and mandibular crowding) were log-transformed to improve linearity with the logit. Multicollinearity among the clinical predictors was assessed using standard collinearity diagnostics, and categorical variables were dummy-coded. The final LR model was derived by forward selection based on the likelihood ratio (Supplemental Methods 2.2).
For the hybrid model (HM), we integrated photograph information by adding the prediction scores from the optimal photo-based deep learning model (AHDNet) as an additional predictor to the 12 clinical variables. All predictors were entered simultaneously. Both the LR and HM models were trained on the development dataset and evaluated on the held-out test dataset, using the same datasets as AHDNet. Further modeling details (Box-Tidwell tests, collinearity diagnostics, and model fit statistics) are provided in Supplemental Methods 2.2. The schematic of the HM pipeline is shown in Figure 2(c).
Model decision-based feature importance
The interpretability framework comprised three components (Figure 2(d)): (i) Regional ablation. We used RetinaFace to automatically localize Key regions (eyes, nose, and mouth). Each region was then in turn masked, followed by retraining and evaluation of AHDNet. The performance difference of models trained under these masking conditions was used to infer the importance of the occluded region (Supplemental Methods 3.1). (ii) Attention visualization. Grad-CAM was applied to the AHDNet and three ablation models to generate heatmaps that visualize spatial attention patterns across the test dataset 26 (Supplemental Methods 3.2). Furthermore, we conducted a statistical analysis of the focused regions for the four models on the test dataset (Supplemental Methods 3.3). (iii) SHAP analysis. A unified quantitative analysis of all input features was conducted using SHAP, which assigned importance values to each image-derived and clinical variable, enabling a ranked interpretation of their contributions to the model’s output (Supplemental Methods 3.4).
Comparison of AHDNet and human raters’ performance
To comprehensively evaluate AHDNet, human raters with varying levels of orthodontic experience were recruited and categorized into three groups: Group A (>5 years of experience, n = 8), Group B (2–4 years, n = 7), and Group C (<1 year, n=6). Following informed consent, 21 raters independently evaluated all 263 patient-level photographs in the test dataset.
Statistical analysis
Model performance was evaluated using the area under the receiver operating characteristic (ROC) curve (AUC), precision-recall (PR) curve, specificity, sensitivity, ARD, positive predictive value (PPV), negative predictive value (NPV), accuracy, and F1 Macro score (appropriate for imbalanced data), together with calibration-in-the-large, calibration slope, and a calibration plot for calibration assessment, as well as decision curve analysis (DCA) to evaluate clinical utility. Corresponding confusion matrices were reported in Supplemental Methods 4. Continuous variables were expressed as mean ± standard deviation (SD) if normally distributed, or median (interquartile range, IQR) if not. Categorical variables were expressed as percentages. Group comparisons used t-tests or Mann-Whitney U tests for continuous variables, and chi-square or Fisher’s exact tests for categorical variables. Intraclass correlation coefficients (ICC) and Cohen’s kappa were used to assess agreement in AH diagnosis. ICC values greater than 0.90 indicate excellent reliability. Cohen’s kappa between 0.81 and 1.00 indicates almost perfect agreement. To compare model performance with human raters, differences in accuracy, specificity, and sensitivity were assessed using the McNemar test; AUC differences were evaluated with the DeLong test; and differences in PPV, NPV, and F1 Macro were analyzed via paired bootstrap tests. The level of statistical significance was set at 0.05. All analyses were conducted in IBM SPSS Statistics (v27.0, IBM Corp., USA) and Python (v3.12.7). Codes and the open-access AHDNet platform for future model optimization and performance enhancement are available at https://github.com/1jayyang/AHDNet.
Results
Datasets characteristics
Patient characteristics and data distribution (right 45° smiling view) among patient-level split datasets.
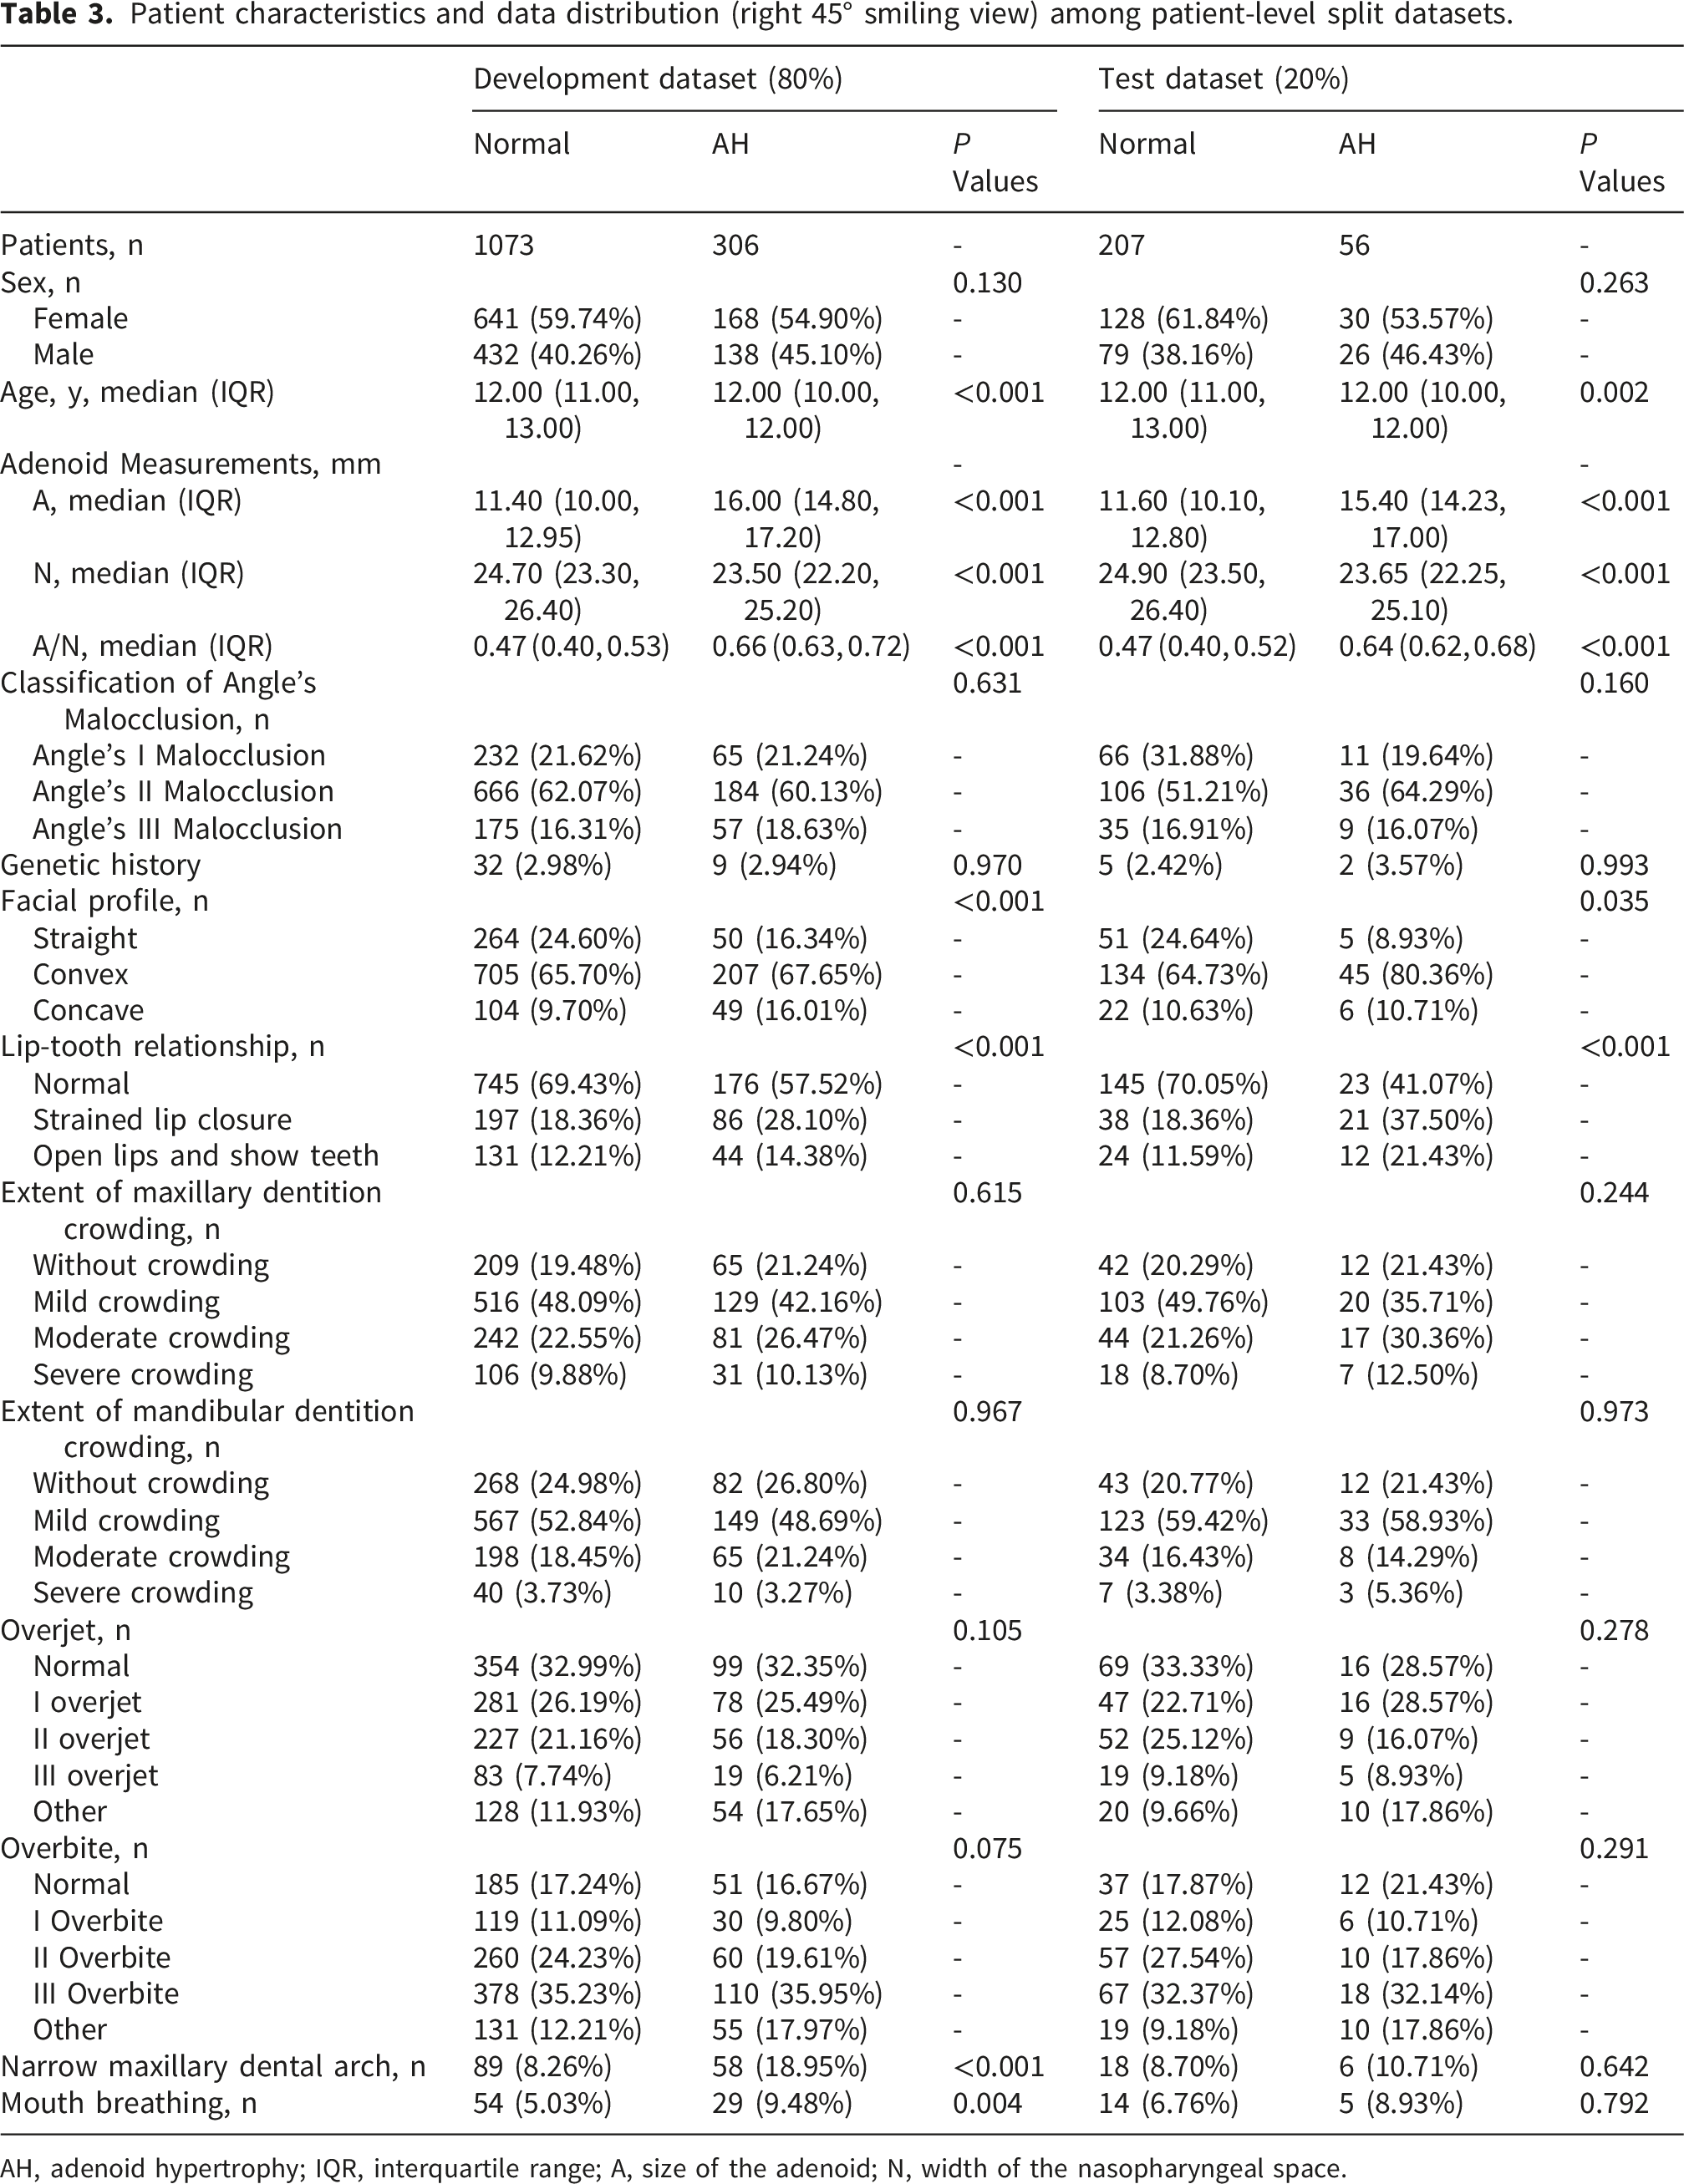
AH, adenoid hypertrophy; IQR, interquartile range; A, size of the adenoid; N, width of the nasopharyngeal space.
Model performance
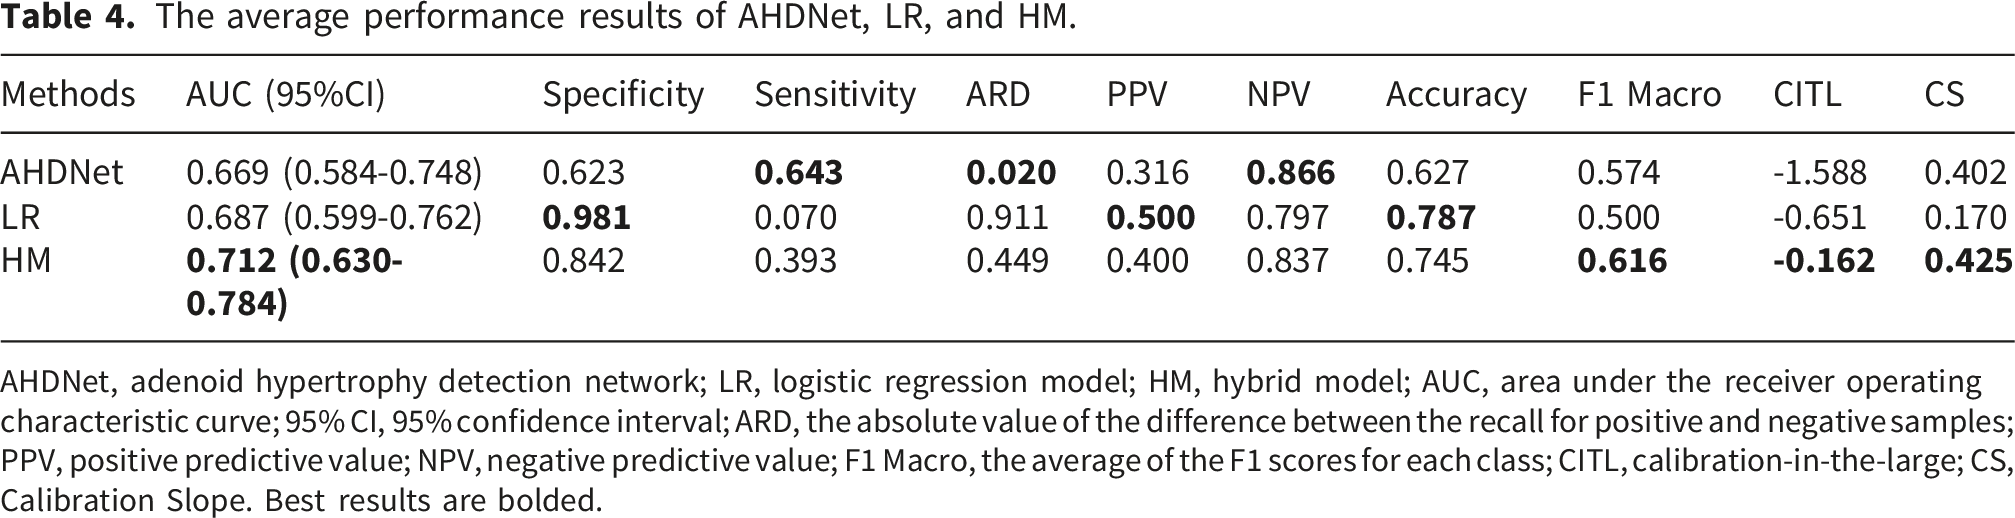
Figure 3 and Table 4 summarize the performance of the three models. For AHDNet, the AUC (95% confidence interval [CI]) was 0.669 (0.584–0.748). The AHDNet model demonstrated the most balanced recall (ARD = 0.020) and the highest NPV (0.866). In contrast, the clinical-feature LR model excelled in specificity (0.981), PPV (0.500), and accuracy (0.787). The HM synergized these strengths, achieving the top AUC (0.712 [0.630–0.784]) and F1 Macro score (0.616), underscoring the value of feature fusion. In terms of model calibration, the calibration-in-the-large values for AHDNet, LR, and HM were −1.588, −0.651, and −0.162, with corresponding calibration slopes of 0.402, 0.170, and 0.425, respectively. All models showed negative calibration-in-the-large values, indicating overall overestimation of event probability. Among them, HM exhibited the most favorable calibration performance with the calibration-in-the-large closest to 0. The DCA curves revealed that when the clinical decision threshold ranged from 0.133 to 0.429, the net benefit of the HM model was higher than the “treat all” and “treat none” strategies, suggesting its clinical applicability. The LR model (Supplemental Table 2) identified strained lip closure (OR = 1.790, P <0.001) and a narrow maxillary dental arch (OR = 1.849, P = 0.002) as significant risk factors for AH. Conversely, older age was a protective factor (OR = 0.788, P <0.001). Overview performance of AHDNet, LR, and HM. (a) ROC curves of AHDNet, LR, and HM. (b) PR curves of AHDNet, LR, and HM. (c) Confusion matrix of AHDNet. (d) Confusion matrix of LR. (e) Confusion matrix of HM, AHDNet, adenoid hypertrophy detection network. (f) Calibration plots of AHDNet, LR, and HM. (g) Decision curve analysis of AHDNet, LR, and HM. LR, logistic regression model; HM, hybrid model; AUC, area under the receiver operating characteristic curve; Treat all, strategy assuming all patients are at high risk and thus everyone is treated; Treat none, strategy assuming no patients are at high risk and thus no one is treated. The average performance results of AHDNet, LR, and HM. AHDNet, adenoid hypertrophy detection network; LR, logistic regression model; HM, hybrid model; AUC, area under the receiver operating characteristic curve; 95% CI, 95% confidence interval; ARD, the absolute value of the difference between the recall for positive and negative samples; PPV, positive predictive value; NPV, negative predictive value; F1 Macro, the average of the F1 scores for each class; CITL, calibration-in-the-large; CS, Calibration Slope. Best results are bolded.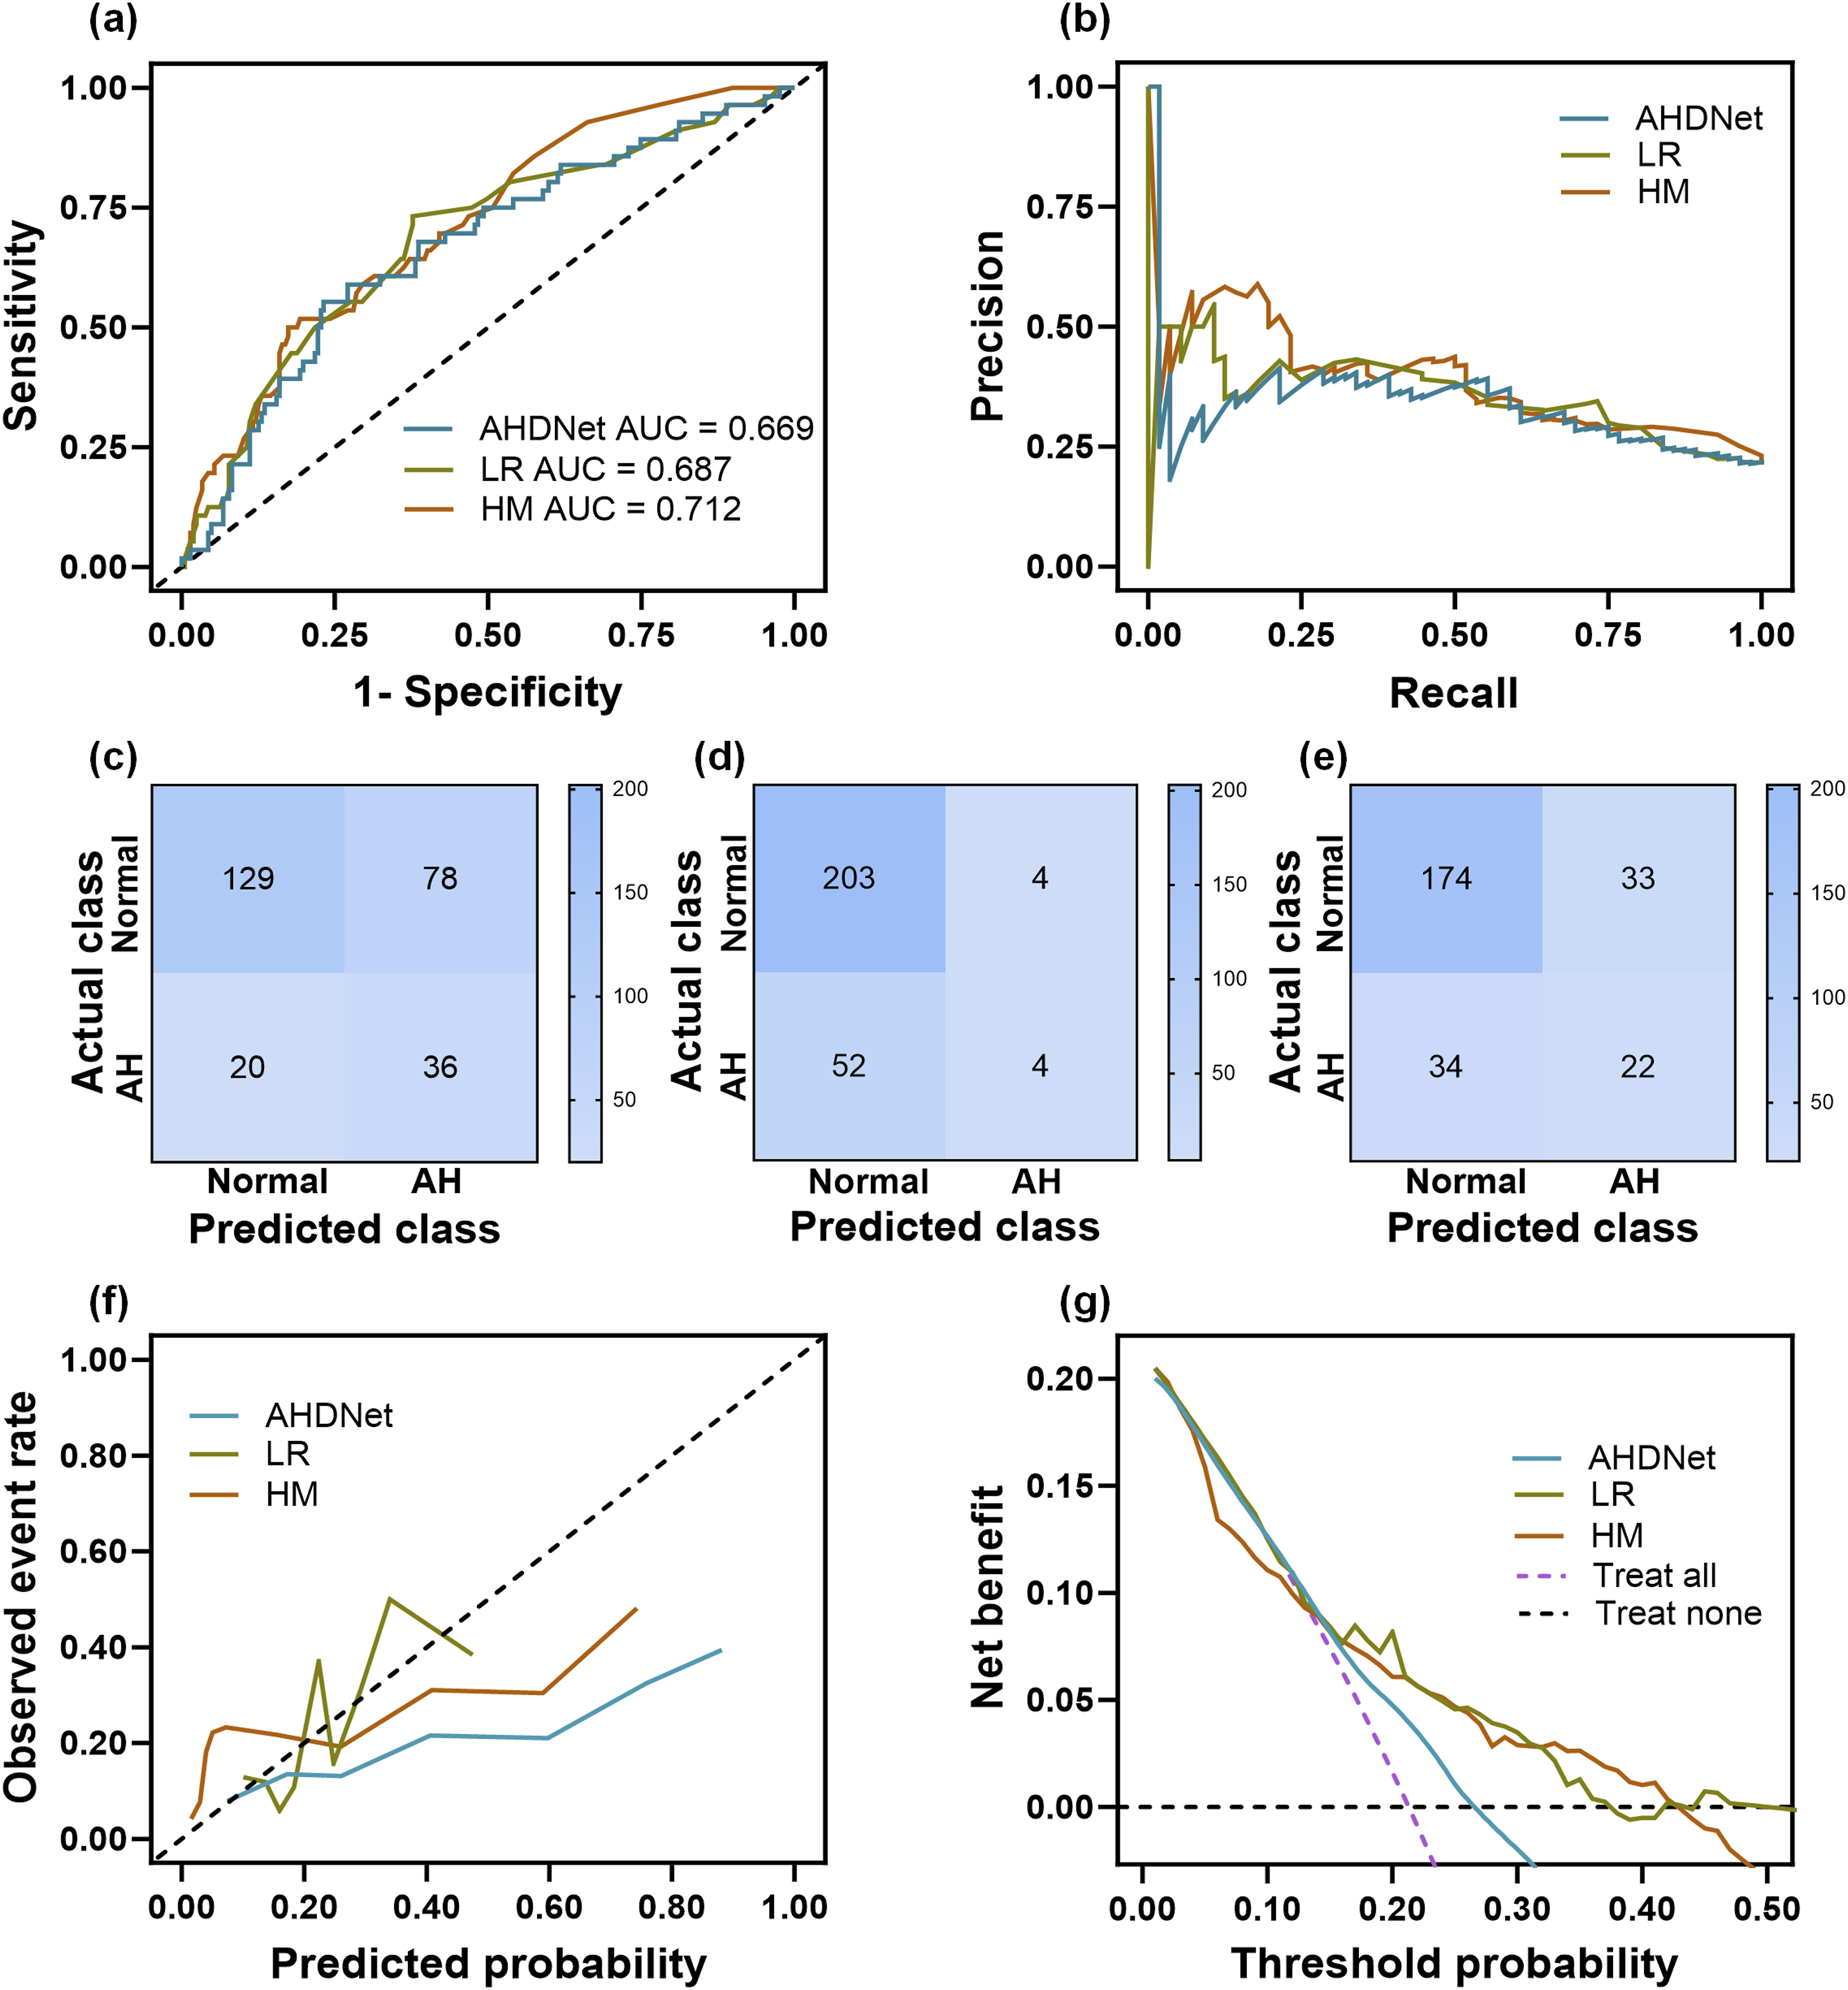
Model interpretability
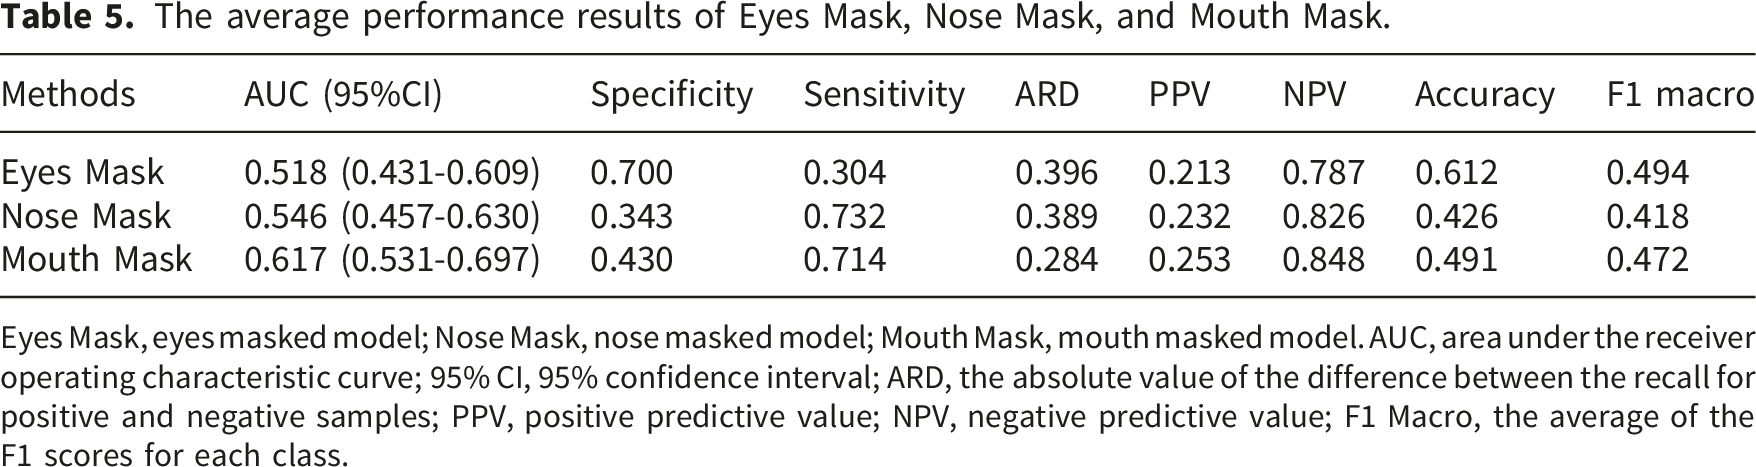
Ablation experiments demonstrated that masking the eyes caused the most significant performance drop (AUC = 0.518 [0.431–0.609], ARD = 0.396), indicating their critical importance, while masking the mouth had the least effect (AUC = 0.617 [0.531–0.697], ARD = 0.284) (Figure 4(a) and (b) and Table 5). These findings were corroborated by Grad-CAM visualizations, which showed that the model primarily focused on the eyes and mandibular angle when correctly identifying AH cases, and on the eyes and chin for normal cases (Figure 4(c), Supplemental Table 3). The results of the ablation study and Grad-CAM. (a) ROC curves of Eyes Mask, Nose Mask, and Mouth Mask. (b) PR curves of Eyes Mask, Nose Mask, and Mouth Mask. (c) Grad-CAM generated by AHDNet, Eyes Mask, Nose Mask, and Mouth Mask when predicting normal or AH, as well as statistics on the facial regions of interest. AHDNet, adenoid hypertrophy detection network; Eyes Mask, eyes masked model; Nose Mask, nose masked model; Mouth Mask, mouth masked model. AUC, area under the receiver operating characteristic curve; AH, adenoid hypertrophy; Grad-CAM, Gradient-weighted Class Activation Mapping. **P <0.01, ***P <0.001 indicate certain regions are more focused in identifying normal; ###P <0.001 indicates certain regions are more focused in identifying AH; ns, not significant; total normal/AH, the total number of focused regions in identifying normal/AH; active normal/AH, the number of specific focused regions in identifying normal/AH. The average performance results of Eyes Mask, Nose Mask, and Mouth Mask. Eyes Mask, eyes masked model; Nose Mask, nose masked model; Mouth Mask, mouth masked model. AUC, area under the receiver operating characteristic curve; 95% CI, 95% confidence interval; ARD, the absolute value of the difference between the recall for positive and negative samples; PPV, positive predictive value; NPV, negative predictive value; F1 Macro, the average of the F1 scores for each class.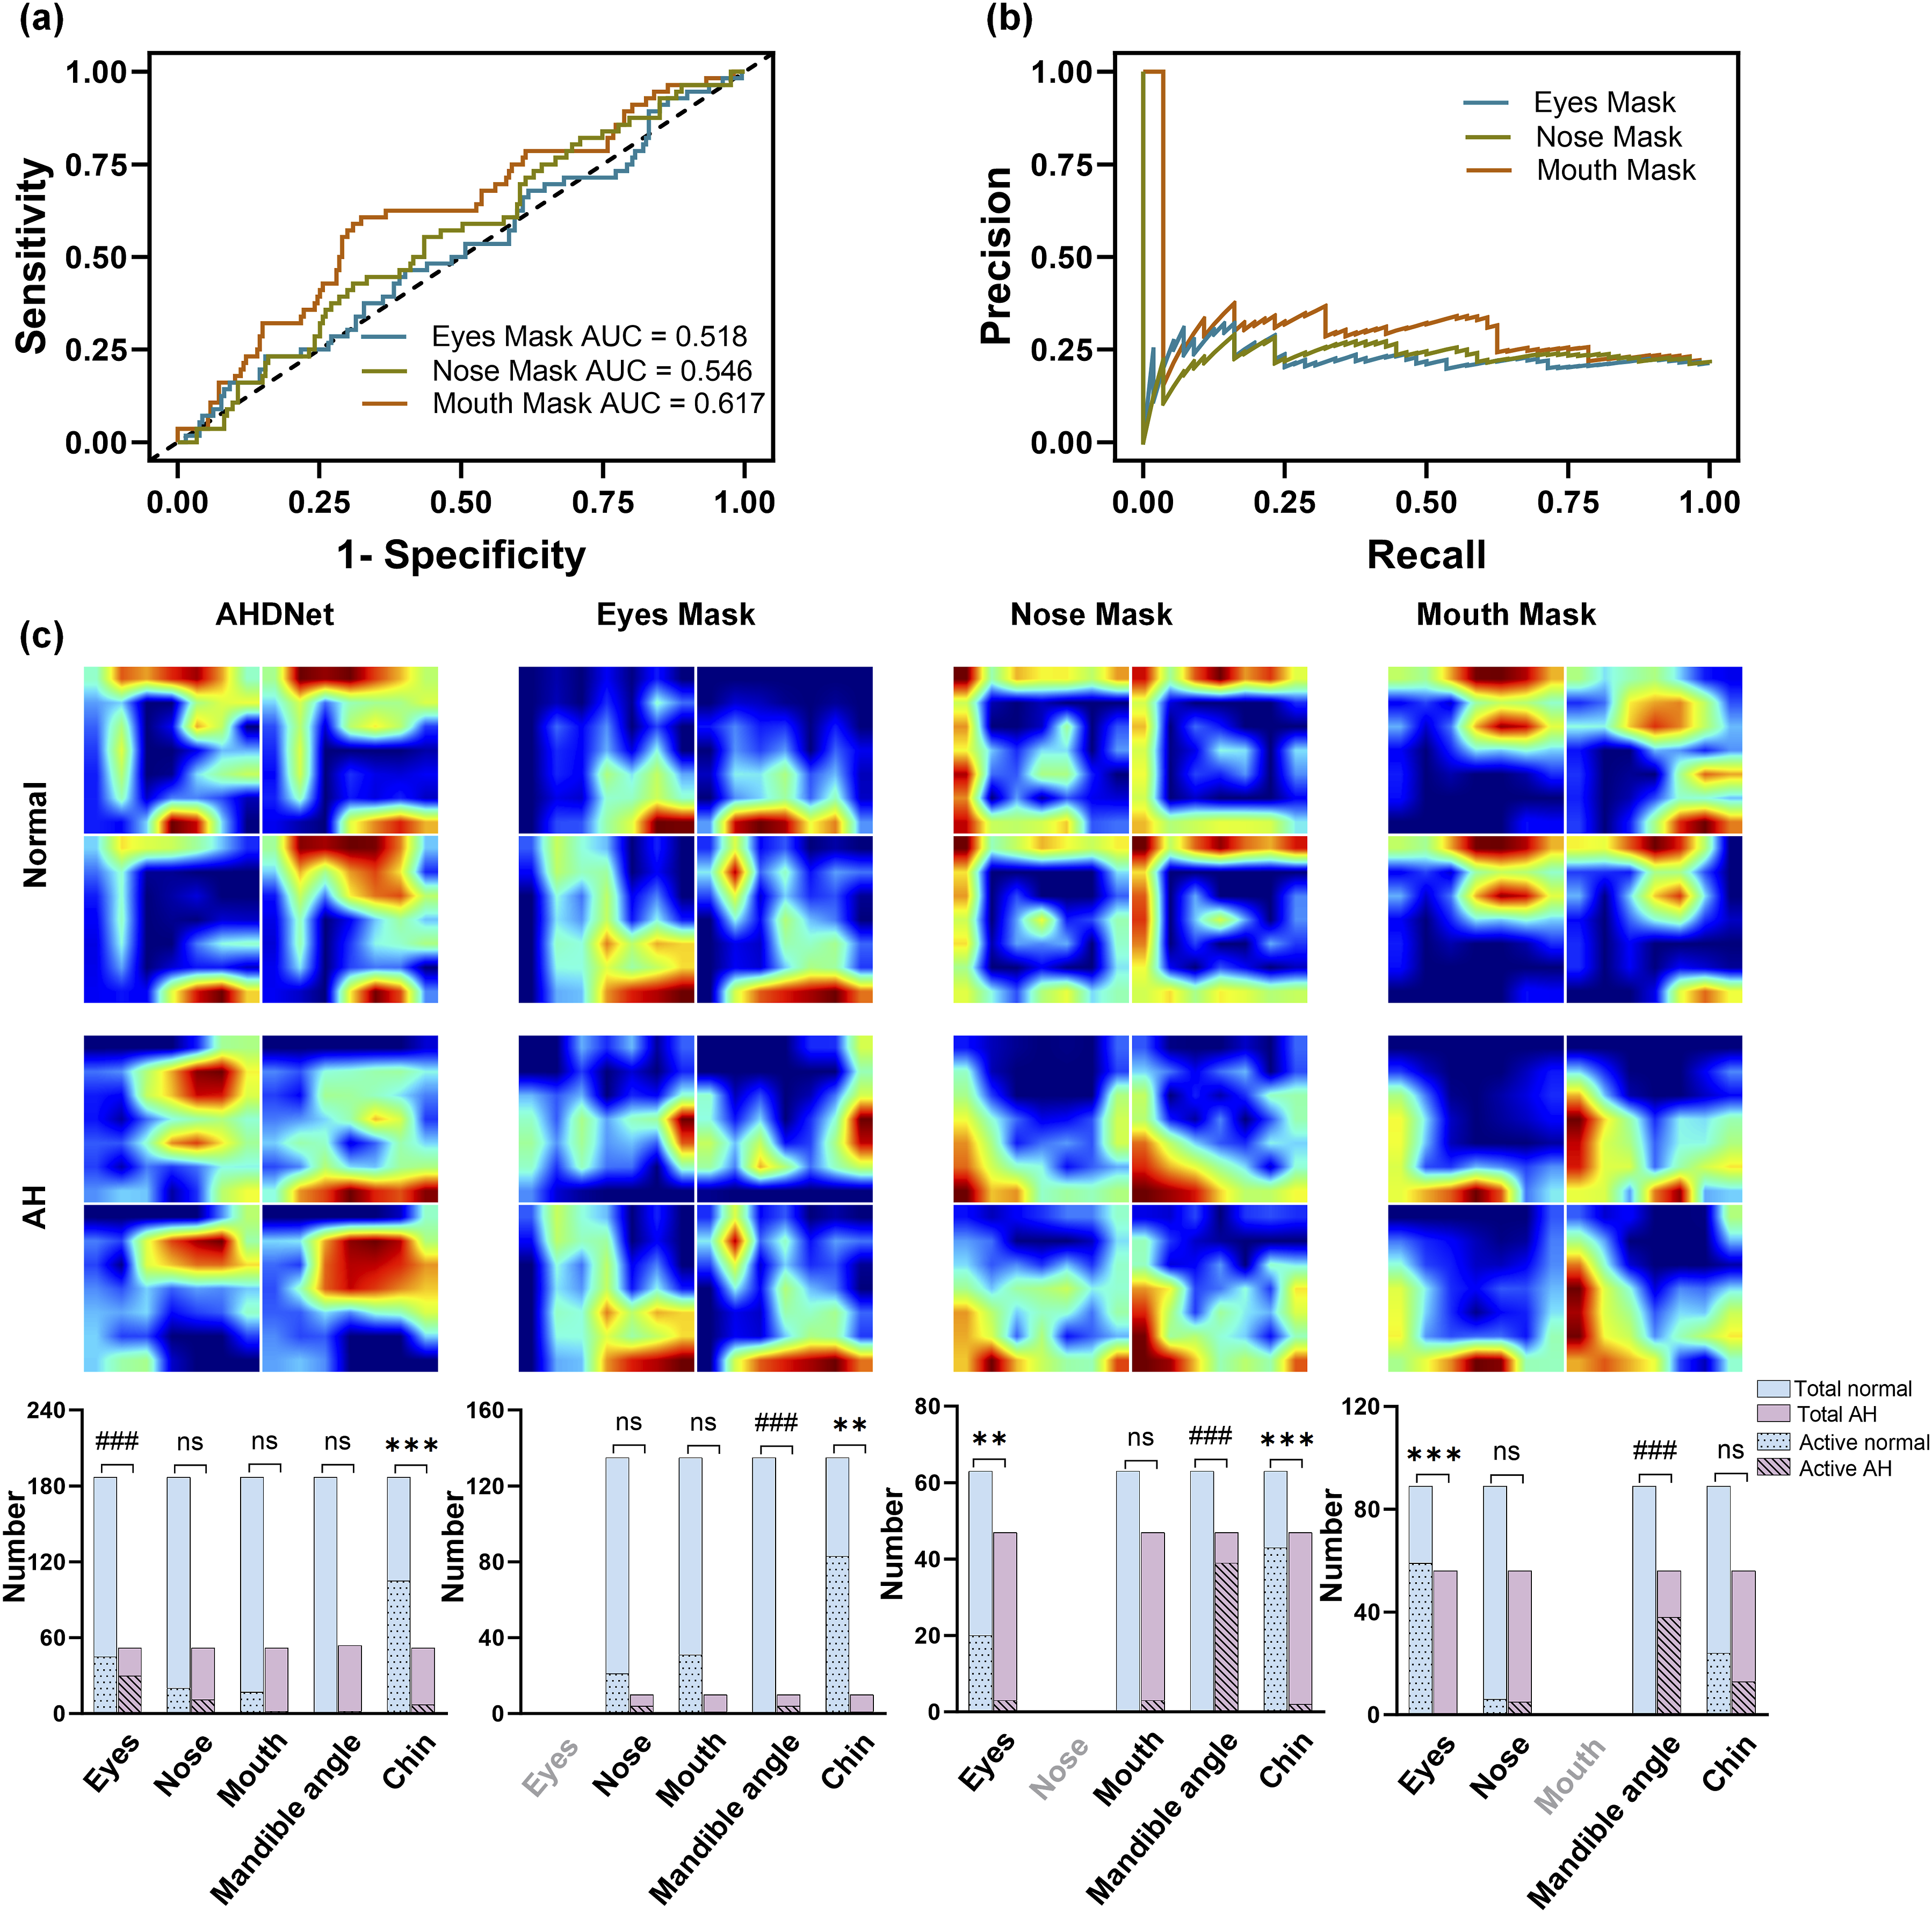
Furthermore, a global analysis of feature importance via SHAP (Figure 5(a)) identified that deep learning features, particularly those from models trained with the Eyes Mask, No Mask, Mouth Mask, and Nose Mask, were among the top predictors. The SHAP summary plot (Figure 5(b)) clarified the directional association of these features with the outcome. High values of features from the Eyes Mask and No Mask models, as well as increased age, were protective (pushing predictions toward normal). Conversely, high values of Nose Mask-derived features, along with clinical abnormalities such as an abnormal lip-tooth relationship, a narrow maxillary dental arch, and dentition crowding, were risk factors (pushing predictions toward AH). Jittered Strip plots for SHapley Additive exPlanations values in AH prediction for interpretable machine learning analysis. (a) A Jittered Strip Importance plot highlights how each variable affects the overall prediction of the model; the most sensitive variables are demonstrated on top of the plot. (b) The values on the right or left of the plot indicate the direction and magnitude of each feature’s effect on the prediction. The color of each point represents the value of the feature, with typically higher values in red and lower values in blue. AH, adenoid hypertrophy; AHDNet, adenoid hypertrophy detection network; Eyes Mask, eyes masked model; Nose Mask, nose masked model; Mouth Mask, mouth masked model.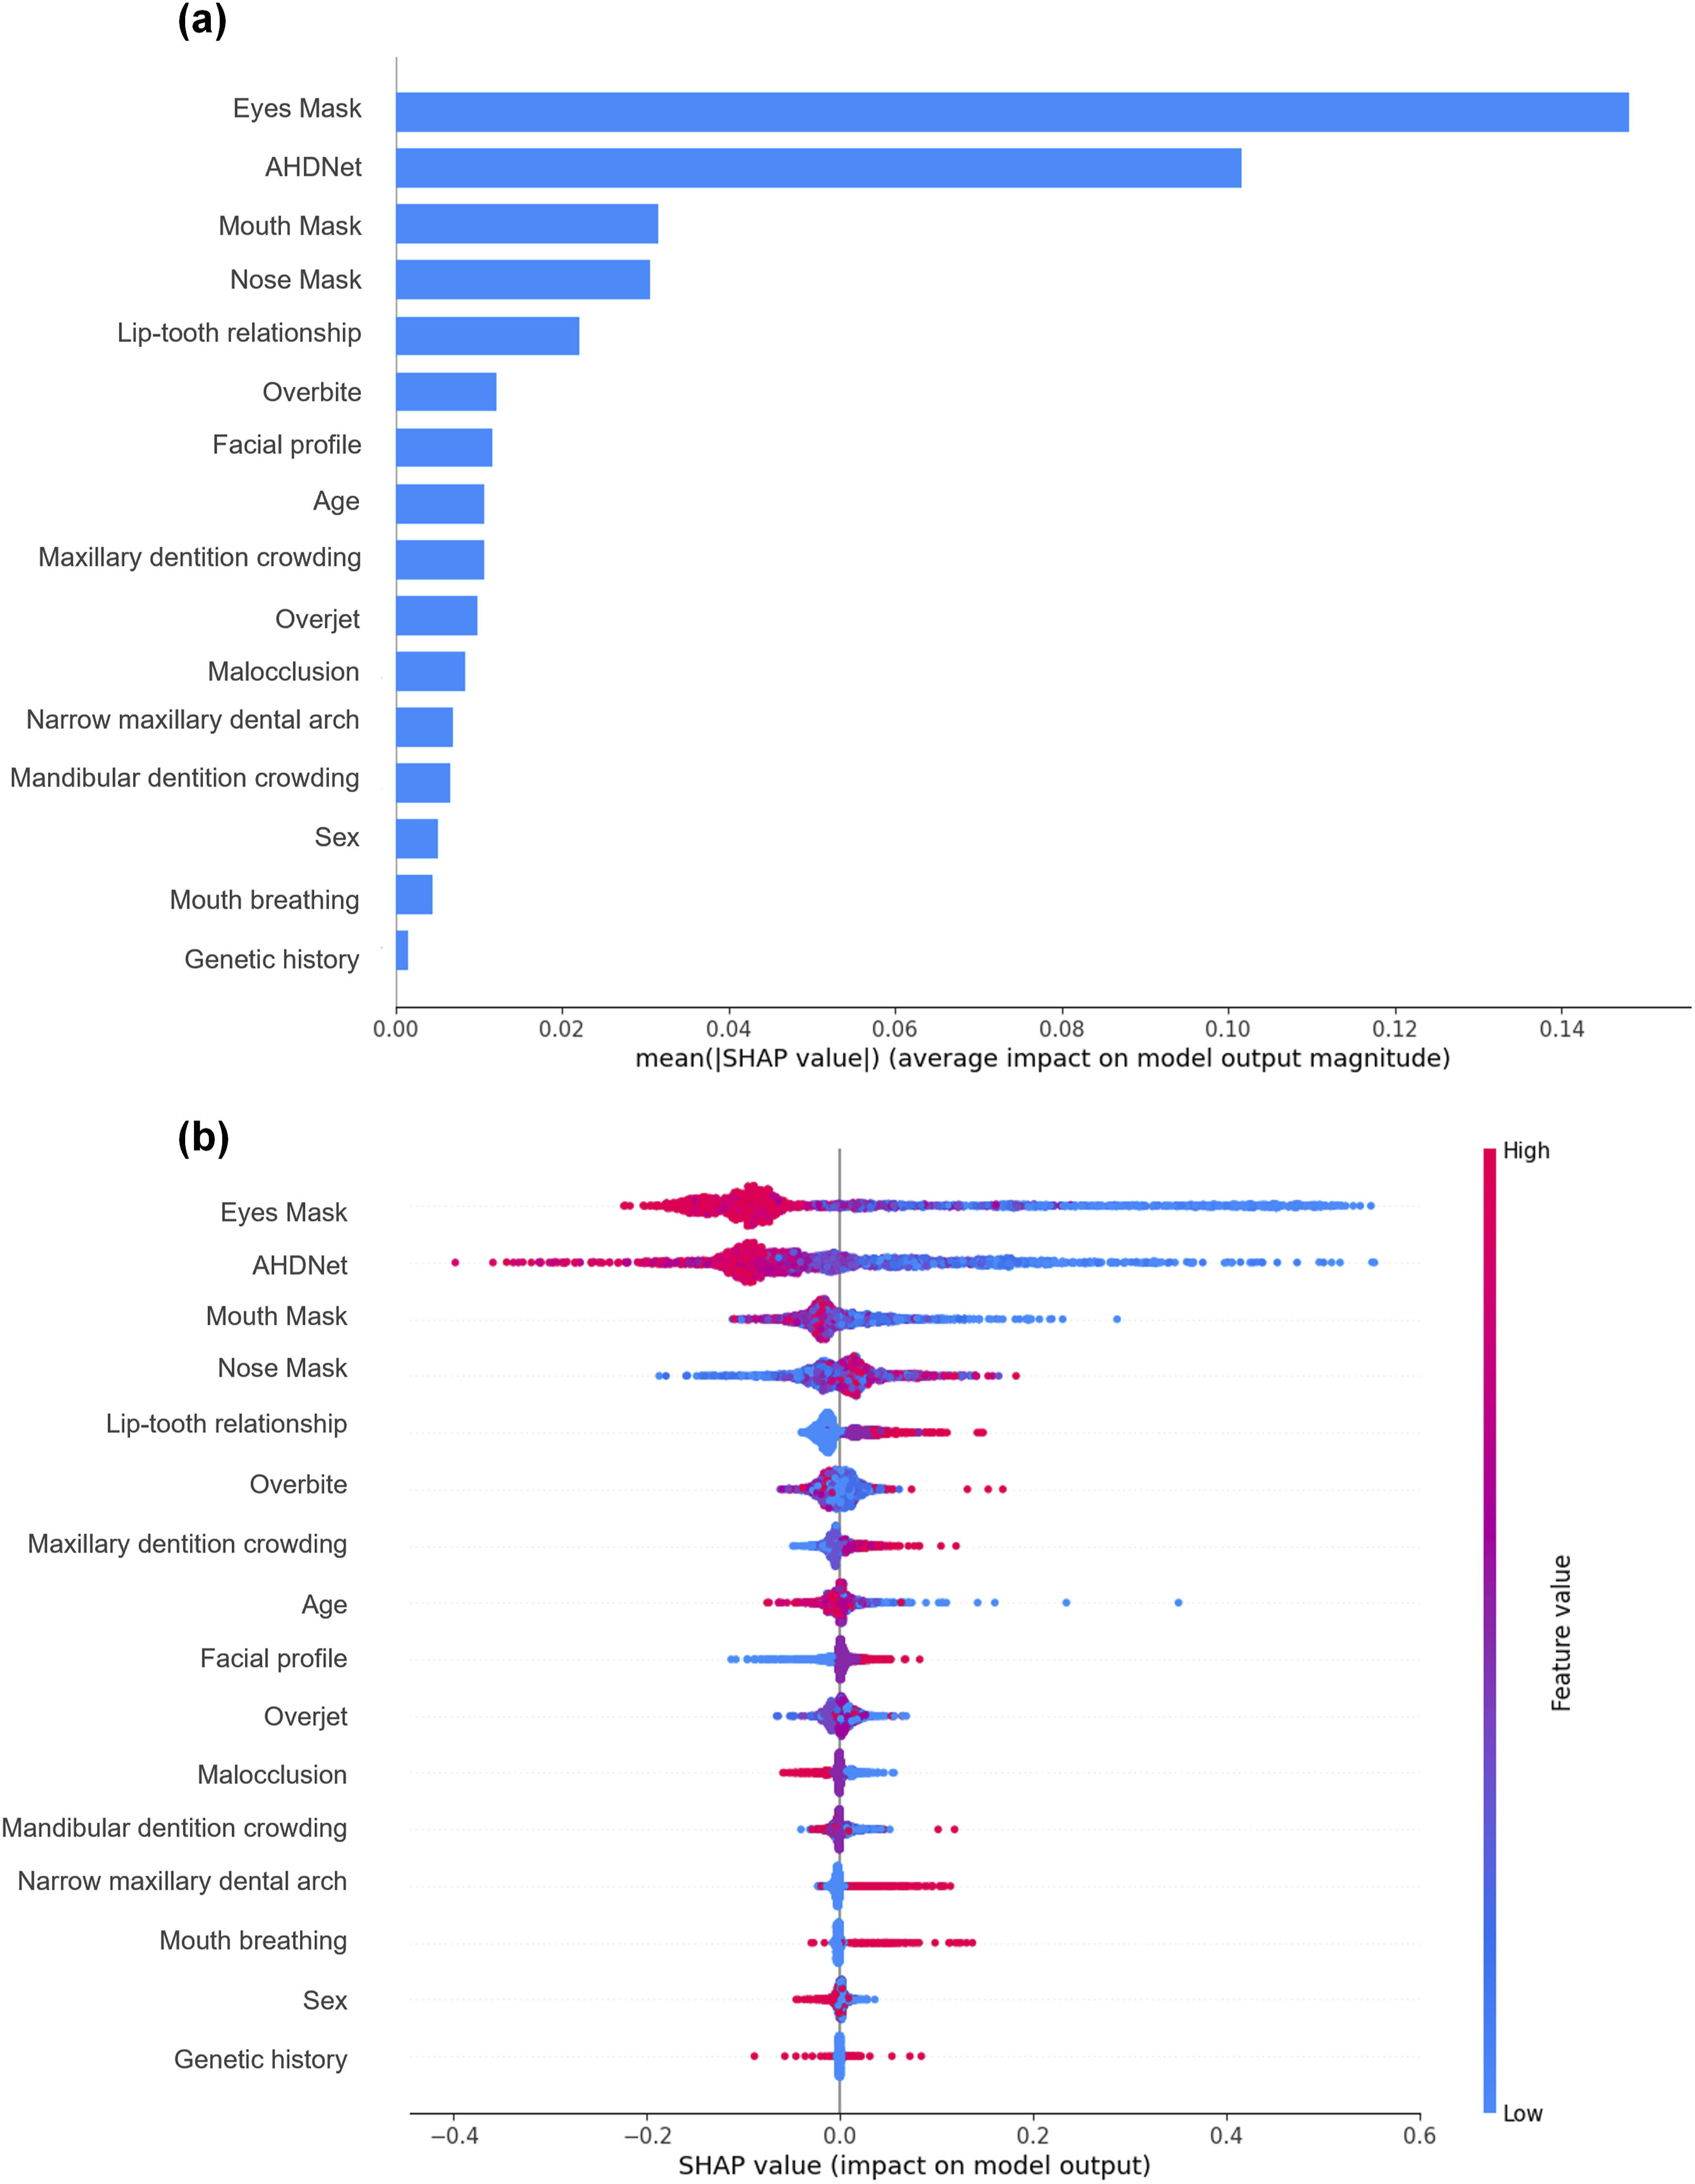
AHDNet versus human rater opinions
The comparative diagnostic performance of AHDNet and human raters are shown in Figure 6. AHDNet outperformed raters with ≤1 year orthodontic experience in sensitivity and NPV (P = 0.002 and P = 0.045; Figure 6(a), (c)). In contrast, the ≤1 year experience group exhibited significantly higher specificity than AHDNet (P = 0.021; Figure 6(b)). Although the model showed numerically higher performance than all three rater groups on accuracy, AUC and F1 Macro, these differences were not statistically significant (P >0.05; Figure 6(d)–(f), Supplemental Table 4). When compared with individual raters, the AHDNet showed numerically higher AUC, NPV, and F1 Macro than each of the 21 raters across experience levels (Supplemental Table 5). Comparative diagnostic performance of AHDNet and human raters with varying orthodontic experience. (a) Sensitivity, (b) specificity, (c) negative prediction value (NPV), (d) accuracy, (e) area under the receiver operating characteristic curve (AUC), (f) F1 Macro scores. AHDNet, adenoid hypertrophy detection network. *P <0.05, **P <0.01 indicate significantly better performance by AHDNet; #P <0.05 indicates significantly better performance by human raters.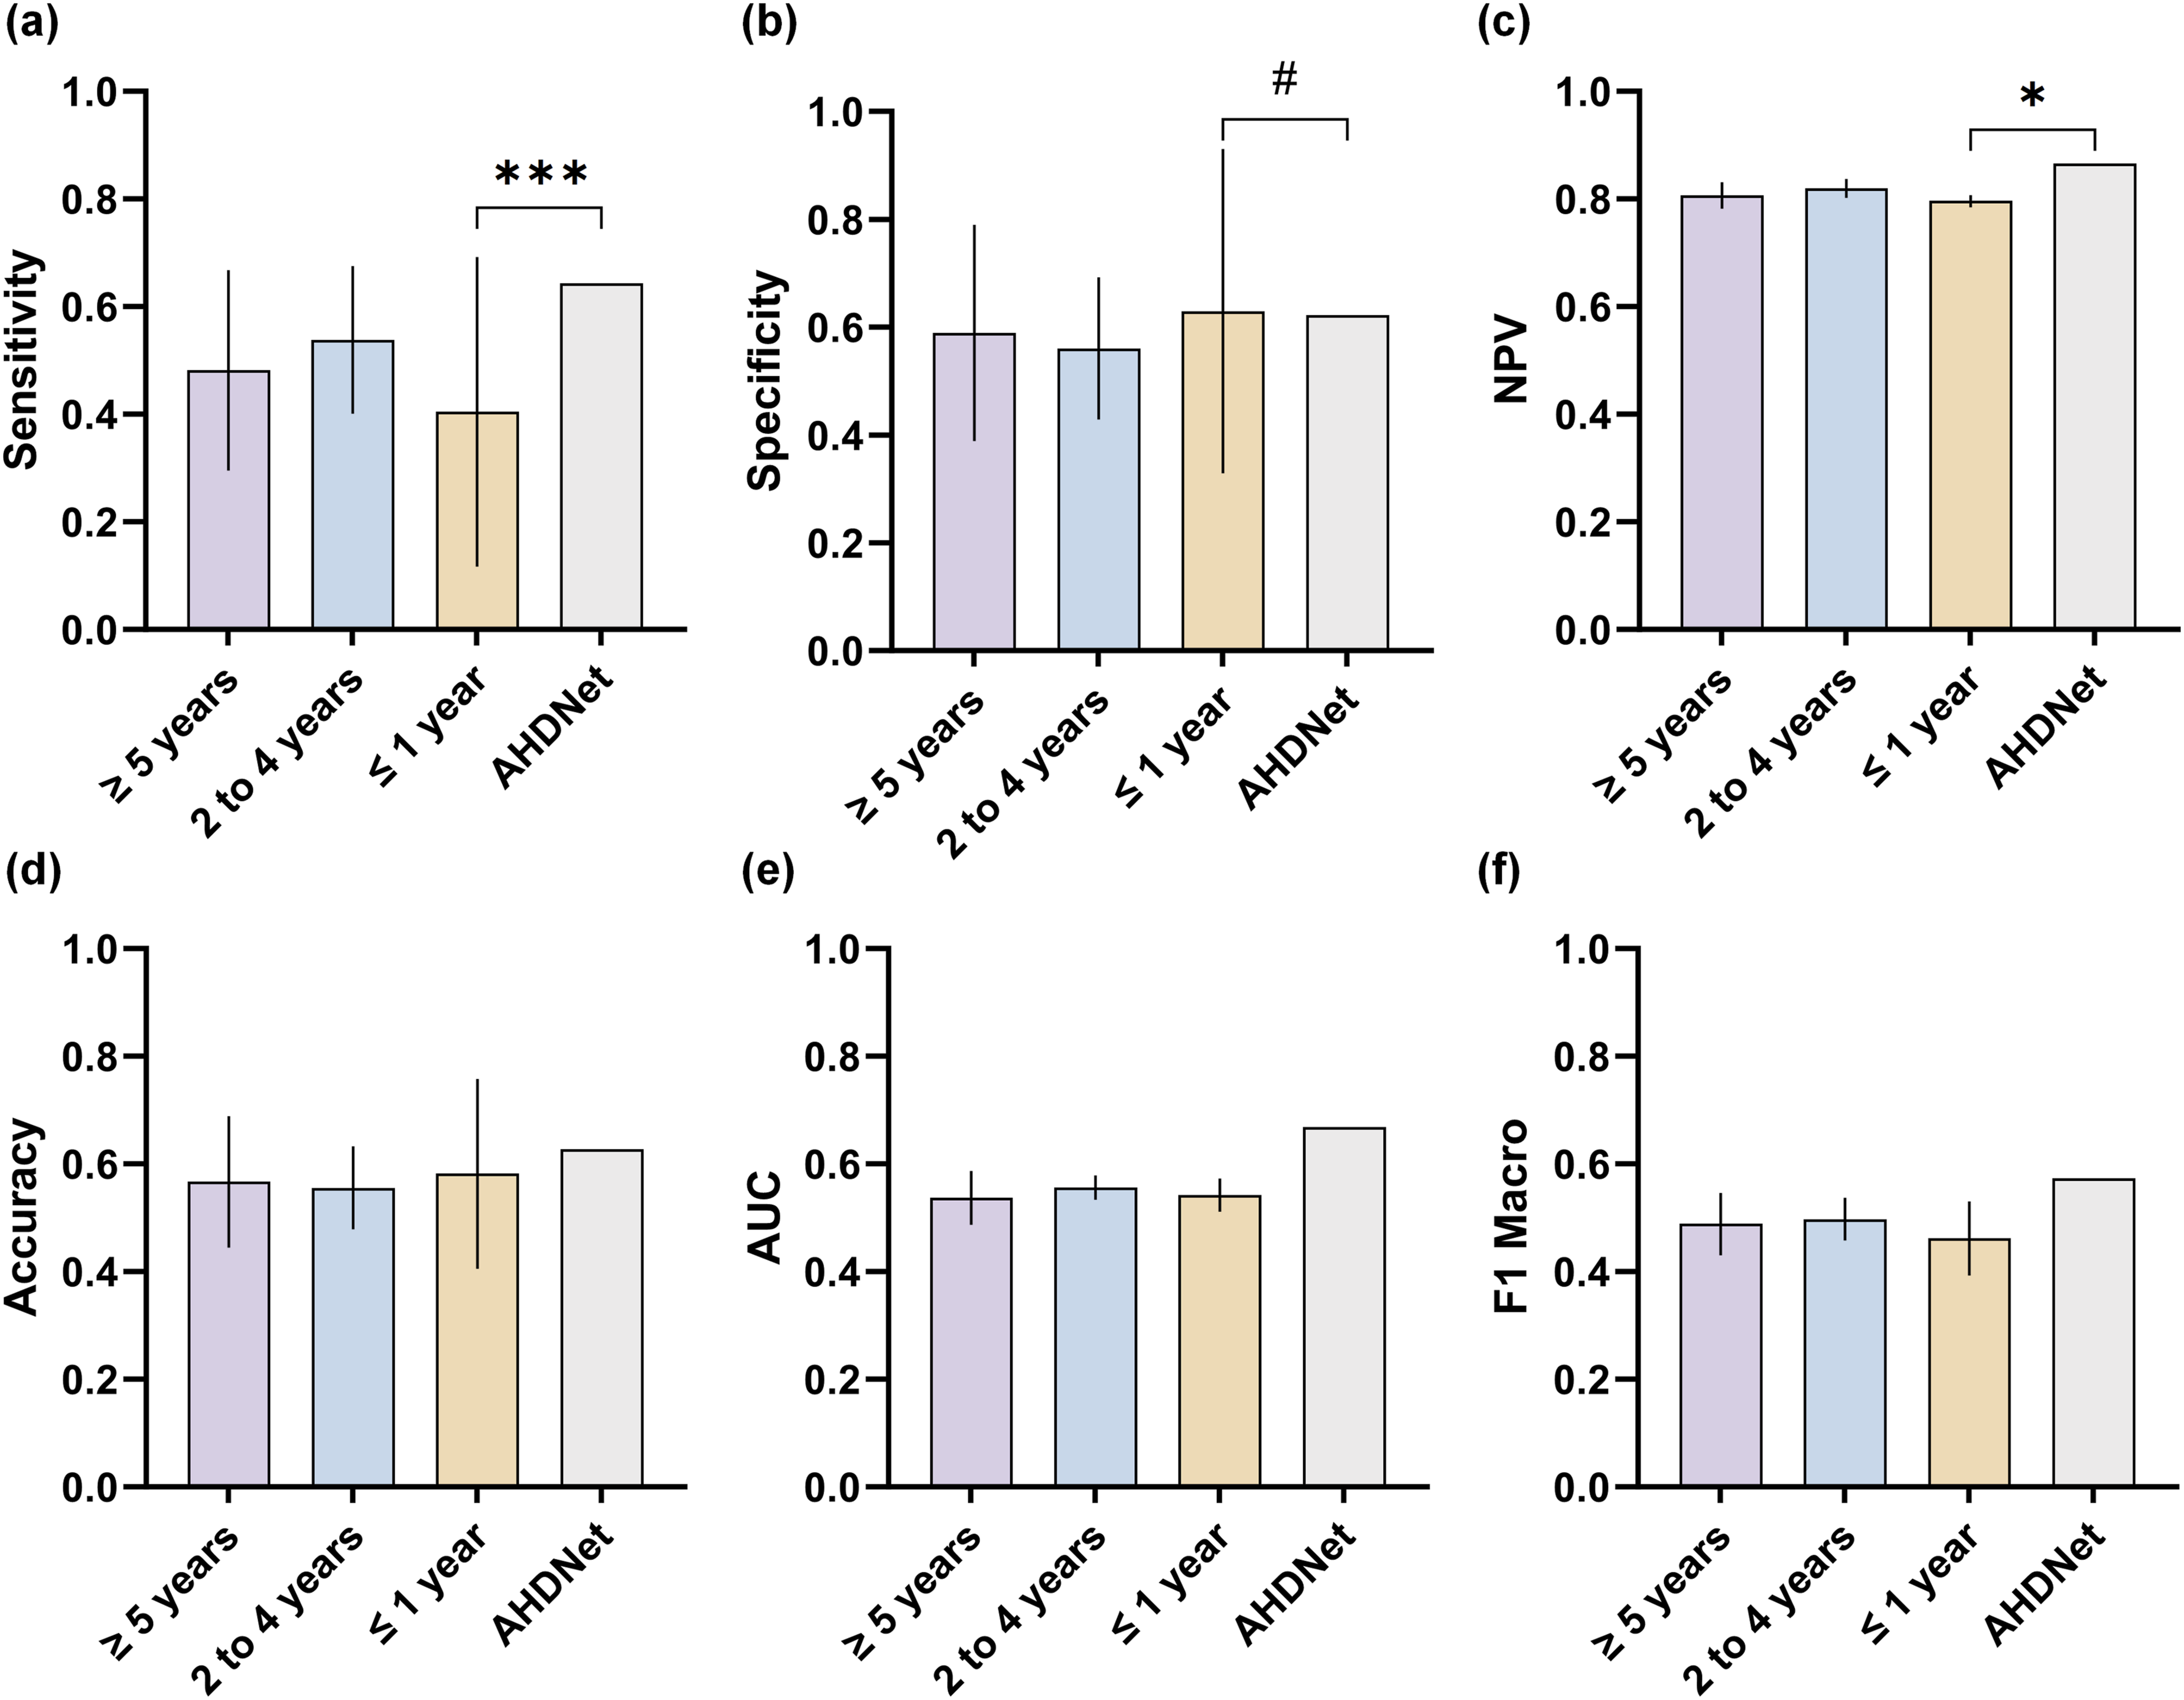
Discussion
In this study, we developed and evaluated AHDNet, a novel photo-based deep learning framework designed for the auxiliary screening of pediatric AH. Evaluation of multiple photographic views identified the right 45° smiling view as the optimal angle for capturing characteristic craniofacial patterns, such as lip-tooth relationships and maxillomandibular contours. While AHDNet showed moderate discriminative ability (AUC = 0.669), incorporating clinical and dental features into a hybrid model (HM) improved the AUC to 0.712 with better calibration. Notably, AHDNet’s performance was comparable to or slightly better than that of clinical raters, supporting its potential as a supportive screening adjunct. By providing an open-access platform, we aim to facilitate subsequent external validation and iterative refinement to ensure the model’s generalizability and clinical utility.
Although nasopharyngoscopy remains the diagnostic gold standard for AH, researchers have explored non-invasive, AI-driven techniques as potential alternatives. For instance, Liu et al. 27 developed an AH auto-detection method using lateral cephalograms, and Dong et al. 28 developed one using CBCT. Notably, CBCT-based approaches have achieved diagnostic performance approaching that of nasopharyngoscopy, with sensitivity and specificity ranging from 87.3% to 93.0%.29,30 Nevertheless, radiological assessments still inherently overestimate or underestimate clinical obstruction. Moreover, both approaches involve ionizing radiation and require specialized examination equipment. Consequently, these factors often constrain accessibility and increase technical dependency, rendering such methods suboptimal for widespread screening.5,6 Although Hu et al. 16 utilized facial photographs, which is a truly non-invasive modality, their study was limited by a small sample size, burdensome feature extraction processes, and uncertain generalizability to real-world data. To overcome these collective limitations, our study utilized the largest facial photographs dataset to date (11,465 photographs across six views) for AH screening. We employed CNNs for end-to-end feature learning, which eliminated errors associated with tedious feature point annotation and enhanced the model’s ability to recognize subtle facial features. Importantly, rigorous evaluation against established clinical standards remains essential, as AI-generated health outputs can exhibit significant variability across different models and contexts. 31
Current image-based AH detection research often relies on balanced datasets. However, in clinical practice, the number of children with AH is much lower than that of normal children, leading to severe class imbalance. This imbalance causes models to be biased towards normal samples, resulting in high specificity but low sensitivity, and making them prone to missed diagnoses. To address this, we designed a dynamic sampling balancing strategy that maintains class balance within each batch and dynamically updates the sample order at each epoch, ensuring the model encounters balanced samples throughout training. Our results show that this strategy improves sensitivity on the test dataset while maintaining stable specificity, indicating better reliability in detecting AH cases (Table 2). This strategy not only mitigates performance bias due to class imbalance but also provides a scalable solution for designing intelligent diagnostic models based on imbalanced medical data. However, it should be noted that while this balancing strategy was effective for the image-only AHDNet, its application was more constrained during the integration of the HM due to the complexity of the joint training pipeline. This discrepancy, combined with the inherent challenges of low disease prevalence in our dataset, explains the more conservative sensitivity observed in the final hybrid results (Table 4). We recognize this as a limitation; the current model thus functions as a user-friendly screening adjunct that prioritizes minimizing false negatives. Additionally, despite limited performance gains over previous studies (AUC = 0.669 vs 0.635), 16 our analyses were based on a relatively realistic disease scenario. Given the modest performance of the present model, this may be attributed to the inherent complexity and subtlety of morphological information contained in facial photographs. As reported in recent image-based AI assessment studies, the predictive accuracy of such models is largely dependent on the complexity of visual inputs and the capacity to identify subtle, non-overt phenotypic features. 32
In the LR model based on clinical features, we found that a narrow maxillary dental arch and strained lip closure were associated with a higher likelihood of AH, consistent with orofacial muscular imbalance caused by mouth breathing. 33 Mouth breathing can lead to transverse deficiency and excessive sagittal development of the maxilla, manifesting as a narrow maxillary dental arch, lip incompetence, and altered facial profile. 34 We also observed that the risk of AH decreased with increasing age, aligning with Huang 35 and the known physiology of adenoidal growth and involution. 36 These correlated clinical features may enable the LR model to achieve better calibration performance than the AHDNet. However, this model exhibits poor sensitivity and is more prone to missed diagnoses in children with AH. The clinical application value of the model should be objectively evaluated according to the predicted risk threshold derived from the DCA curve.
In recent years, deep learning has demonstrated considerable potential in detecting systemic and genetic conditions, such as biological age, skin cancer, and metabolic syndrome, from facial photographs.13,37,38 Our study extends this paradigm to AH as a preliminary proof-of-concept. Beyond performance metrics, our study provides a comprehensive framework for model interpretability. Interpretability analyses, including regional ablation, Grad-CAM and SHAP, suggest that regions around the eyes and the mandibular angle tended to carry higher predictive weight in our model’s decision-making process. It expands the recognized craniofacial regions for AH detection, indicating that model attention extends to the orbital and mandibular angle regions instead of being confined to the perioral area. This observed association diverges from earlier studies, which have predominantly emphasized upper lip thickness.16,19 It should be noted, however, that these findings do not establish direct biological causality. We posit that this discrepancy represents a potential strength of our data-driven approach: the model identifies subtle facial patterns that may not be fully appreciated via conventional subjective assessment. Specifically, the eye-focused features align with established AH signs, including allergic shiners and a vacant expression. These reflect mental fatigue and periorbital venous congestion due to insufficient sleep.7,8 Koca et al. 39 and Hu et al. 16 both reported alterations in periocular measurements, including the distance between the endocanthion and exocanthion. Additionally, Koca et al. 39 observed an increased angle between the Frankfort horizontal plane and the line connecting gnathion and angulus mandible in children with AH. Similarly, the importance of the mandibular angle corresponds with documented craniofacial adaptations, such as an increased mandibular plane angle resulting from clockwise rotation secondary to chronic mouth breathing.33,39 Consequently, our results suggest that while overt clinical indicators are important, AHDNet provides further informative cues by extracting subtle upper facial and skeletal features that are often overlooked or difficult to quantify in routine clinical assessments.
In the unified test dataset, we benchmarked AHDNet against 21 raters with varying levels of clinical experience. Compared with less-experienced raters (≤1 year), AHDNet demonstrated significantly higher sensitivity and NPV, albeit with slightly lower specificity. This trade-off aligns with screening settings, where minimizing missed cases is prioritized in the preliminary assessment of AH. Meanwhile, the overall performance metrics of AHDNet did not differ significantly from those of moderate or senior-level raters. In pairwise comparisons against each of the 21 raters, the model generally showed higher AUC, NPV, and F1 Macro, further supporting its robustness. Overall, these findings position AHDNet as a potential screening aid, approaching the discriminative level of human experts within the context of limited facial photographic data. However, given its single-center design, AHDNet must undergo formal guideline-aligned validation, ongoing expert oversight, and external validation across independent cohorts prior to clinical deployment. These rigorous evaluations position the model as a supportive adjunct for AH screening, with clinical expert judgment remaining paramount. 40
While this study demonstrates a significant step forward in photo-based AH screening, its clinical deployment faces several principal challenges. First and foremost, the limitation regarding the reference standard must be acknowledged. Although CBCT provides relatively accurate imaging evaluation for AH, it cannot be equated to nasopharyngoscopy, the clinical gold standard. As a retrospective study, our dataset relied on CBCT-derived grading information without corresponding endoscopic data. Consequently, the results should be interpreted with caution, and nasopharyngoscopy findings should be incorporated as diagnostic criteria in future model optimization. Second, its retrospective design, while enabling the assembly of a large cohort, may confound the specific facial phenotype identified due to the frequent co-occurrence of AH with conditions such as tonsillar hypertrophy and rhinitis. 41 Future prospective studies integrating 3D facial scans and acoustic profiles, particularly with the strategic inclusion of AH-specific inflammatory biomarkers,42,43 hold the potential to help disentangle these complex interactions and enhance model specificity. Third, the single-center data and lack of external validation limit generalizability. Ethnic, demographic, and imaging-environment variability may further affect model performance. Beyond these technical constraints, the broader adoption of AI in clinical diagnosis necessitates careful attention to ethical standards and data security, particularly when using identifiable biometric data such as facial photographs. 44 The future implementation of our screening platform and its multicenter validation within privacy-preserving frameworks 45 are crucial for further optimizing the model’s performance and verifying its applicability as a screening aid. Finally, a paramount future challenge will be the early identification of younger children in whom AH has not yet induced marked craniofacial changes, requiring even more sensitive feature detection capabilities, including the exploration of highly specific biological markers for AH.
Despite current constraints, our research indicates that multi-perspective facial photography analysis represents a feasible approach for the preliminary exploration of AH detection. Through web-based deployment, this approach could enable timely AH risk alerting, facilitating immediate intervention. In the context of global digital health advancement, this methodology has the potential to develop into an accessible, non-invasive preliminary screening tool. Its implementation could fundamentally reshape the screening pathway, equipping families and primary care settings with a simple yet effective method to identify potential cases and secure timely specialist care. Thus, this work not only charts a new course for personalized AI-driven medicine but also presents a scalable strategy to help balance healthcare disparities across different regions.
Conclusions
This study developed AHDNet using right 45° smiling facial photographs for non-invasive AH screening, with its preliminary screening performance approaching that of experienced human raters. By integrating image-derived features with clinical variables, including age, sex, and dental features, the HM achieved improved predictive performance. Compared with conventional imaging approaches, this method demonstrates preliminary discriminative capability while avoiding radiation exposure and invasive procedures, supporting its potential as a non-invasive adjunct for initial screening and longitudinal monitoring, particularly in underserved regions. In orthodontic practice, this tool may assist in the timely identification of upper airway obstruction caused by AH, facilitating specialist referral and multidisciplinary treatment. Future work should focus on integrating multimodal data to further enhance performance, alongside multicenter external validation and prospective clinical evaluations.
Supplemental material
Supplemental material - Photo-based deep Learning for detection of pediatric adenoid hypertrophy
Supplemental material for Photo-based deep Learning for detection of pediatric adenoid hypertrophy by Nannan Huang, Jie Zeng, Jie Yang, Huaqiao Wang, Yu Wang, Yuzhou Li, Yongchao Wang, He Zhang in Digital Health.
Supplemental material
Supplemental material - Photo-based deep Learning for detection of pediatric adenoid hypertrophy
Supplemental material for Photo-based deep Learning for detection of pediatric adenoid hypertrophy by Nannan Huang, Jie Zeng, Jie Yang, Huaqiao Wang, Yu Wang, Yuzhou Li, Yongchao Wang, He Zhang in Digital Health.
Supplemental material
Supplemental material - Photo-based deep Learning for detection of pediatric adenoid hypertrophy
Supplemental material for Photo-based deep Learning for detection of pediatric adenoid hypertrophy by Nannan Huang, Jie Zeng, Jie Yang, Huaqiao Wang, Yu Wang, Yuzhou Li, Yongchao Wang, He Zhang in Digital Health.
Footnotes

Ethical considerations
This study was approved by the Ethics Committee of the Affiliated Stomatological Hospital of Chongqing Medical University (Ethics No: 2025[LSNo.067]) and adhered to the ethical principles of the Declaration of Helsinki.
Consent to participate
We obtained written informed consent from all patients and their families for the analysis of facial photographs for research purposes, excluding public disclosure.
Author contributions
Nannan Huang contributed to writing – original draft, writing – review and editing, conceptualization, data curation, investigation, validation, visualization. Jie Zeng contributed to writing – original draft, conceptualization, data curation, investigation, validation, visualization. Jie Yang contributed to writing – review and editing, formal analysis, methodology, software, visualization. Huaqiao Wang, Yu Wang, Yuzhou Li contributed to writing – review and editing, conceptualization, data curation. Yongchao Wang contributed to writing – review and editing, conceptualization, project administration, resources, funding acquisition. He Zhang contributed to writing – review and editing, conceptualization, project administration, supervision, funding acquisition. All authors read and approved the final manuscript.
Funding
The authors disclosed receipt of the following financial support for the research, authorship, and/or publication of this article: This work was supported by the National Natural Science Foundation of China (Grant No. 82571106, 82371018, 82370973, 82170936), Joint Project of Chongqing Health Commission and Science and Technology Bureau (2026MSXM069, 2024MSXM049), the Postdoctoral Fellowship Program of CPSF (GZC20251082), Medical Young Top Talent Program of Chongqing Health Commission (YXQN202433), Science and Technology Research Project of Chongqing Education Commission (KJQN202200434), Educational Teaching Research Project of Stomatology School of Chongqing Medical University in 2024 (KQJ202417), New Technologies and Projects of Chongqing Medical University Affiliated Stomatological Hospital (QYYL2023X001), the Application of Modified PMTC (Professional Mechanical Tooth Cleaning, PMTC) Technique in the Clinical Process of Orthodontic Fixed Appliance Treatment (QYYL2022X014).
Declaration of conflicting interests
The authors declared no potential conflicts of interest with respect to the research, authorship, and/or publication of this article.
Data Availability Statement
Guarantor
He Zhang takes full responsibility for the work.
Supplemental material
Supplemental material for this article is available online.
References
Supplementary Material
Please find the following supplemental material available below.
For Open Access articles published under a Creative Commons License, all supplemental material carries the same license as the article it is associated with.
For non-Open Access articles published, all supplemental material carries a non-exclusive license, and permission requests for re-use of supplemental material or any part of supplemental material shall be sent directly to the copyright owner as specified in the copyright notice associated with the article.
