
Abstract
Background
Nearly 85% of patients with Multiple Sclerosis (MS) present oligoclonal bands (OB) by isoelectric focusing (IEF) in their cerebrospinal fluid (CSF). Currently, it is proposed to quantify free light chains (FLC), as a potential alternative for the analysis of intrathecal synthesis of immunoglobulins (ISI).
Objectives
To study FLC in CSF/serum by qualitative/quantitative methods, in comparison with the IEF.
Methods
Paired CSF/serum samples from 81 patients with a medical request for OB by IEF were analyzed. The FLC index was calculated: CSF/serum FLC quotient with reference to the albumin CSF/serum concentration (κ-Index and λ-Index). To analyze the dimer-monomer patterns of FLC in CSF-serum, qualitative Western blot (WB) immunoassay was performed with anti-κ and anti-λ antisera.
Results
A cut-off limit was obtained for κ-Index=20 and λ-Index=17, sensitivity 70% and 28%; and specificity 95% and 92%, respectively. The WB was positive when a higher proportion of κ-monomer (WBκ) and/or λ-dimer (WBλ) was observed in CSF versus serum. Sensitivity for WBκ and WBλ was 80% and 82% respectively, specificity of 93% for both. The combined use of κ-Index<20 and the presence of κ-monomer and/or λ-dimer by WB increased the sensitivity to 100%.
Conclusions
We propose analysis by WB when κ-Index<20, as an alternative algorithm to OB by IEF, for the investigation of ISI in CSF.
Introduction
Multiple sclerosis (MS) is a chronic inflammatory and demyelinating disease of autoimmune origin that mainly affects relatively young adults. In most patients, the disease initially presents with a relapse-like first episode, known as clinically isolated syndrome (CIS). 1 The diagnosis of MS is based on the McDonald criteria, which link clinical manifestation to characteristic lesions demonstrated by magnetic resonance imaging (MRI), cerebrospinal fluid (CSF) analysis, and visual evoked potentials. To increase the specificity of the MS diagnosis, the use of clinical and paraclinical criteria is recommended. 2 These include information obtained from both MRI and CSF analysis, where detection of oligoclonal bands (OB) of IgG in CSF indicates intrathecal synthesis of immunoglobulins (ISI) and supports the diagnosis of MS.
MRI is the most sensitive technique for detecting demyelinating lesions in the central nervous system (CNS) in MS patients. 3 The diagnostic criteria proposed by McDonald and collaborators gives great relevance to the findings of MRI studies, since it is possible to establish the diagnosis of MS in patients with a single apparent clinical episode, if MRI demonstrates demyelinating lesions in CNS that are disseminated in space and time.
The determination of OB regained prominence in the McDonald criteria in 2017, as its positivity replaced the absence of the time criterion. In the face of a typical CIS and clinical demonstration in MRI of dissemination in space, the presence of OB allowed the diagnosis of MS. When MRI findings did not show spatial dissemination, the presence of OB was a prognostic factor for its subsequent conversion to MS. 4 In the latest 2025 revision of the McDonald criteria, dissemination in time is now considered not essential for the diagnosis of MS, as it is not specific as first assumed, so OB would become important even if dissemination in time, clinical or radiological, developed. 5
Therefore, the great challenge in the face of CIS is to identify those patients at high risk of future relapses, given the importance of early treatment in MS with disease-modifying immunomodulatory therapies, which are more effective in the early stages of MS. 6
Several studies indicate that elevated free light chains (FLC) kappa (κ-FLC) and lambda (λ-FLC) in CSF may offer a quantitative tool to support the diagnosis of MS.7–9 In the latest 2025 revision of the McDonald criteria, κ-FLC concentrations in CSF can be used, when available, to provide supportive evidence and confer specificity for a diagnosis of MS in specific situations. 10
In addition, the advantage of a metric result seems to be especially important in predicting the probability of suffering a second clinical event, when the κ-Index is elevated at the beginning of the study, more so than in patients with low κ-Index. 11
Κaplan B et al. showed abnormal patterns of highly MS-specific FLC by the Western blot (WB) technique, with promising diagnostic significance for differentiating MS from other neurological diseases.12–14
Based on these studies, WB demonstrated an association between the presence of OB by isoelectric focusing (IEF) and a significant increase in at least κ-monomer (25 kDa) and/or λ-dimer (50 kDa) in CSF, compared to serum (p < 0.0001) (95% sensitivity, 90% specificity, PPV 83%). 15
Objective
The present study aimed to study FLC in CSF/serum by qualitative/quantitative methods, compared to the IEF, and to determine their usefulness in the investigation of ISI in CSF.
Materials and methods
Patients and samples
Paired samples of CSF (lumbar puncture) and serum were collected from 81 patients with a request for investigation of OB. All patients with a request for OB testing whose CSF and serum sample volumes were sufficient to perform all protein parameters included in this study were enrolled.
After the IEF, they were stored at a temperature of −20 °C between 2 and 8 months. Samples from patients with serum monoclonal components were excluded.
The study protocol complied with the Helsinki Declaration of the World Medical Association (latest version, 2024).
Quantification of IgG and Albumin in serum and CSF: IgG-Index
Quantification of IgG and Albumin (Alb) in CSF and serum was performed by immunoturbidimetry at
The IgG-Index was calculated, which considers the Alb datum to take into account the permeability of the blood-CSF barrier, since it is only synthesized in the liver and diffuses passively into the CSF.

The value of 0.7 was considered as the cut-off limit for the IgG-Index. 16
Oligoclonality test
OB were detected using a standard procedure with Hydragel CSF Isofocusing (InterLab G26, Rome, Italy). Subsequently, immunofixation with anti-IgG conjugated with peroxidase was performed. A positive result was considered when at least two extra bands were observed in the CSF compared to the serum. They were analyzed according to the classification criteria established for the IEF, and type II and III profiles were considered positive. IEF Classification Criteria: (Figure 1)
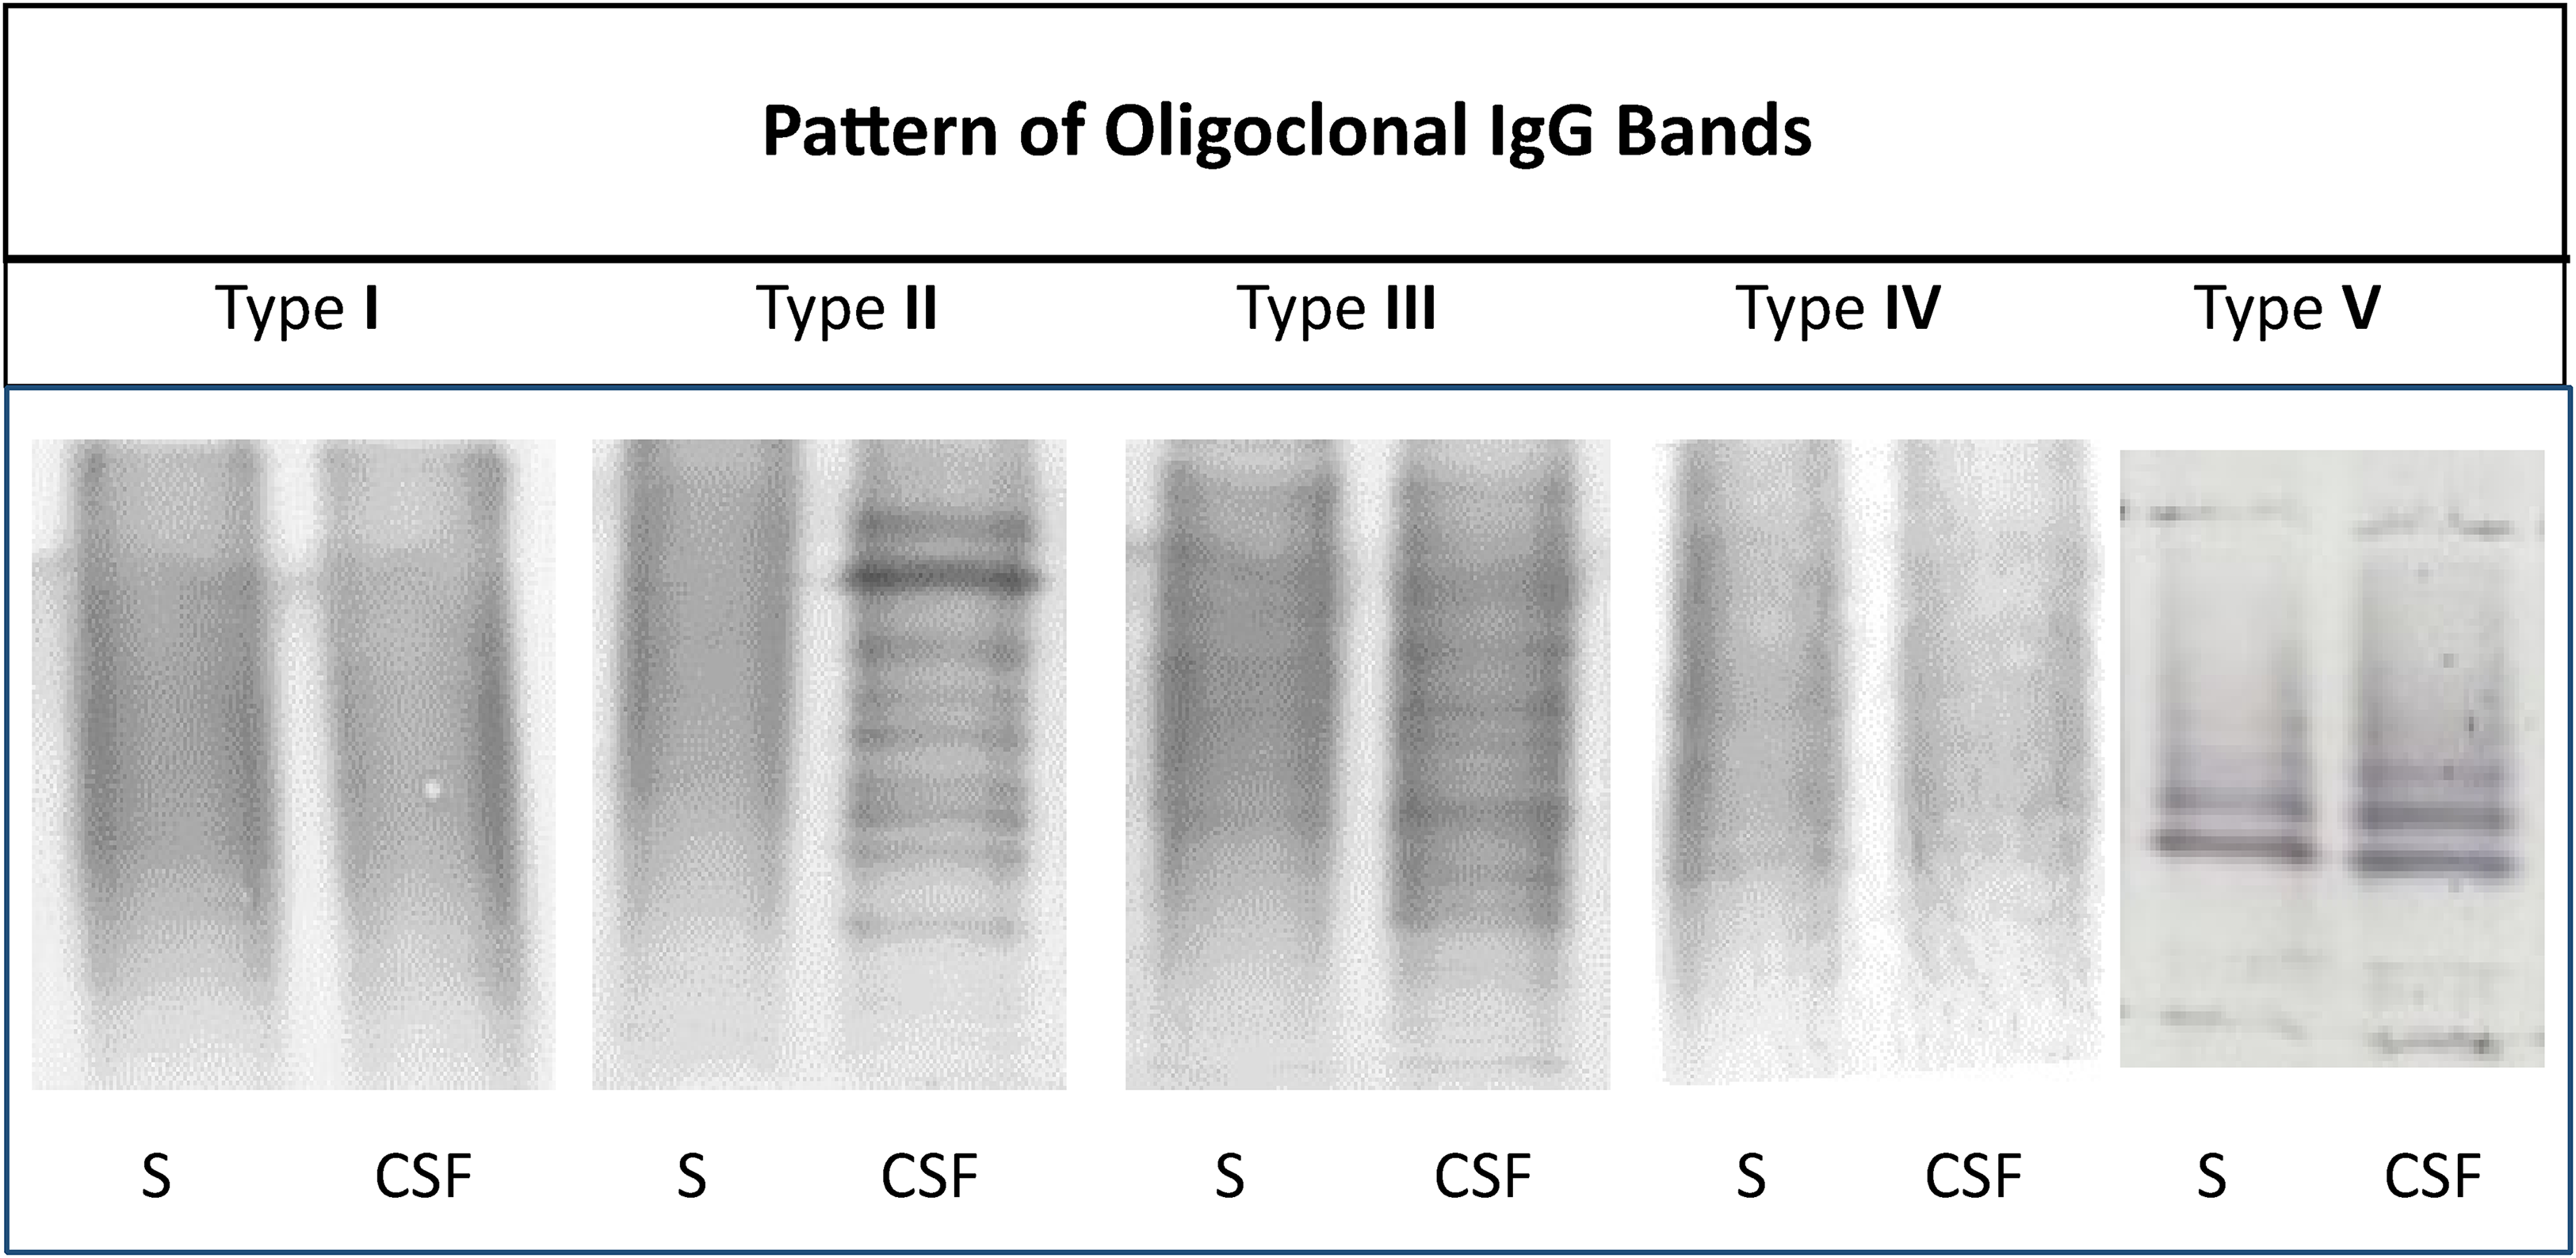
Oligoclonality test by isoelectric focusing.
The parallel focusing of CSF and serum samples allows five standardized interpretations:
Type I: Without OB in CSF and serum. Type II: OB in CSF, not in serum. Type III: OB in CSF and serum, but additional OB in CSF. Type IV: Identical OB in CSF and serum. Type V: Monoclonal bands in CSF and serum.
Type II and III indicate an ISI, type IV a systemic, actual inflammation, and type V a systemic paraproteinemia.
FLC analysis by WB
To compare the CSF/serum ratios obtained from the dimer–monomer of the FLC in each patient, we first equalized the IgG concentrations in both biological fluids. Serum was diluted to match the CSF IgG concentration, assuming that excess FLC in CSF would indicate ISI.
Electrophoresis of serum-CSF samples was performed in SDS-PAGE, which separates proteins by molecular weight, according to the following conditions: electrophoresis sample buffer 1:1 vol/vol, SDS 20%, Tris-HCl 1 M, and sucrose 0.5 g/ml, pH: 6.8; 12% polyacrylamide under non-reducing conditions, 200 V for 45 min, in Tris/Gly/SDS buffer; Mini Protean Tetra cell System (Bio-Rad. California. USA).
Subsequently, the electrophoretically separated proteins were transferred using the WB technique to 0.45 μm nitrocellulose (Hybond-ECL, Amersham Biosciences, Buckinghamshire, United Kingdom). Transfer conditions: 100 mA for 90 min in Tris/Gly/Methanol buffer.
Immunofixation was performed using a first goat antibody, κ and λ anti-light chains of human immunoglobulin (Biocientífica, Buenos Aires, Argentina); and a second antibody with anti-goat peroxidase-conjugated IgG (Sigma-Aldrich, St Louis, USA). It was developed with 4-Chloro 1-Naphthol substrate (Sigma-Aldrich. St Louis, USA).
Data analysis was based on a semi-quantitative assessment of the intensity of the immunoreactive bands of κ-FLC and λ-FLC in the CSF and serum of each patient, as a measure of the comparative levels of FLC between the two biological fluids. The imaging program ImageJ version 1.3v was used for this (National Institute of Health, USA). Analysis of ROC (Receiver Operating Curve) curves was applied to the relative intensity of the different polymerization states (dimer and monomer) of FLC in CSF with respect to serum. Higher intensity of the κ-monomer (cut-off point 1.45) and/or λ-dimer (cut-off point 1.20) bands was observed in patients with OB (+). This criterion was used as a positive result for WB, compared to the IEF test. 13 These FLC disproportions between the two biological fluids coincided with the operator's visualization.
FLC analysis by quantification, κ and λ Index
CSF/serum concentrations of κ-FLC and λ-FLC were measured by immunoturbidimetry, latex/antiserum using the FLC immunoassay Freelite ® kit for use on the SPAPLUS® (The Binding Site) (Birmingham, UK). The lower limit of detection for κ-FLC and λ-FLC was 0.40 and 0.43 mg/L, respectively.
The κ and λ Index were calculated, incorporating the concentration of Alb in both biological liquids as well as the IgG-Index, according to the following formulas:

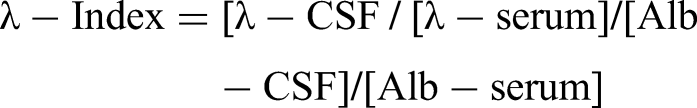
Results
The 81 OB studies were divided into four groups according to the IEF classification criteria, resulting in: 6 type I, 29 type II, 14 type III, and 32 type IV; against which the different methods carried out were compared.
Since the IEF types II and III were positive, a cut-off limit of 20 for κ-Index and 17 for λ-Index was determined, from which they should be considered positive for ISI.
Table 1 shows the descriptive statistics of the ranges and the mean of κ-Index and λ-Index obtained in each group of OB.
Descriptive statistics of the κ and λ Index versus types of oligoclonal bands by isoelectrofocus.
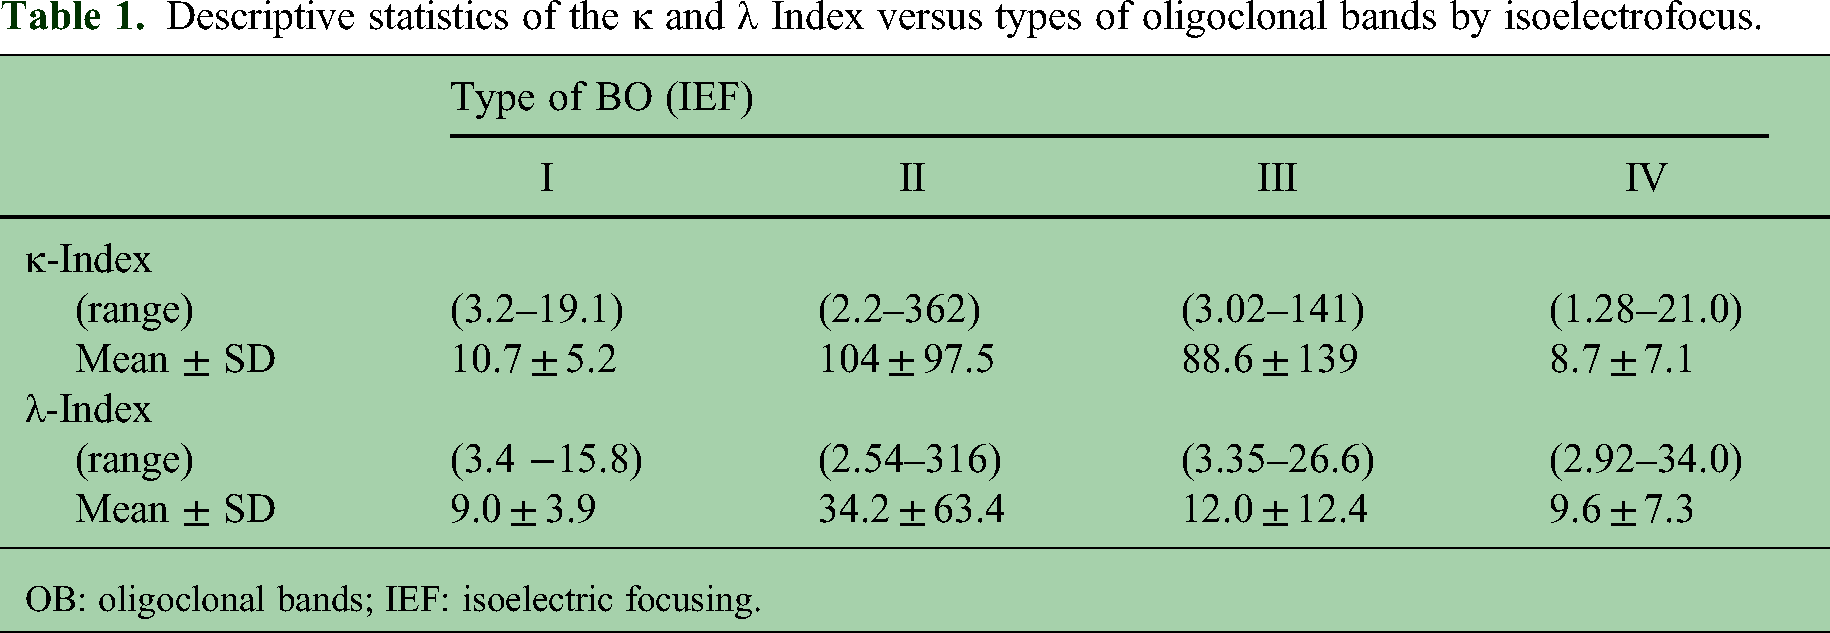
OB: oligoclonal bands; IEF: isoelectric focusing.
The light chain studies by WB were in agreement with previous results from our working group, with the κ-monomer (>1.45) and/or λ-dimer (>1.20) being more intense in CSF compared to serum in patients with OB (+) 13 (Figure 2).

CSF and serum from four patients. Panel A: Table of results (TP-CSF: total proteins, IgG in CSF and serum, and OB IEF: oligoclonal bands, by isoelectric focusing). Panel B: Electrophoretic separation of CSF and serum proteins (S). 1: Proteins fixed and colored with ultrasensitive colloidal silver staining in polyacrylamide gel (SDS-PAGE). 2: Proteins transferred to nitrocellulose membrane (Western blot) and first antibody in goat anti-light chains and second antibody with anti-goat labeled with peroxidase and revealed with the substrate. 4-Chloro 1-Naphthol: 2a: anti- Kappa and 2b: anti- Lambda.
It is important to highlight that when serum is diluted to match the IgG concentration of CSF, the levels of κ-FLC in CSF are higher than in the diluted serum. However, a CSF κ-FLC increase of at least 20- to 30-fold is required to obtain a positive WB result, as illustrated in Figure 3.

CSF/diluted serum κ ratio versus Western blot (WB) analysis. It can be observed how values above 20 and 30 of the CSF/diluted serum κ ratio, after equalizing the IgG concentrations in both biological fluids, correlate with positive Western blot (WB) analysis.
Furthermore, a schematic representation in Figure 4 shows the serum concentration of κ-FLC (mg/L) as a function of the CSF/diluted serum κ ratio, demonstrating that serum κ-FLC levels do not influence the outcomes of WB. The test becomes positive for ISI when κ-FLC levels in the CSF are 20 to 30 times higher than in diluted serum (Figure 4(A)). The same pattern is observed when compared to positive OB detected by IEF (Figure 4(B)).
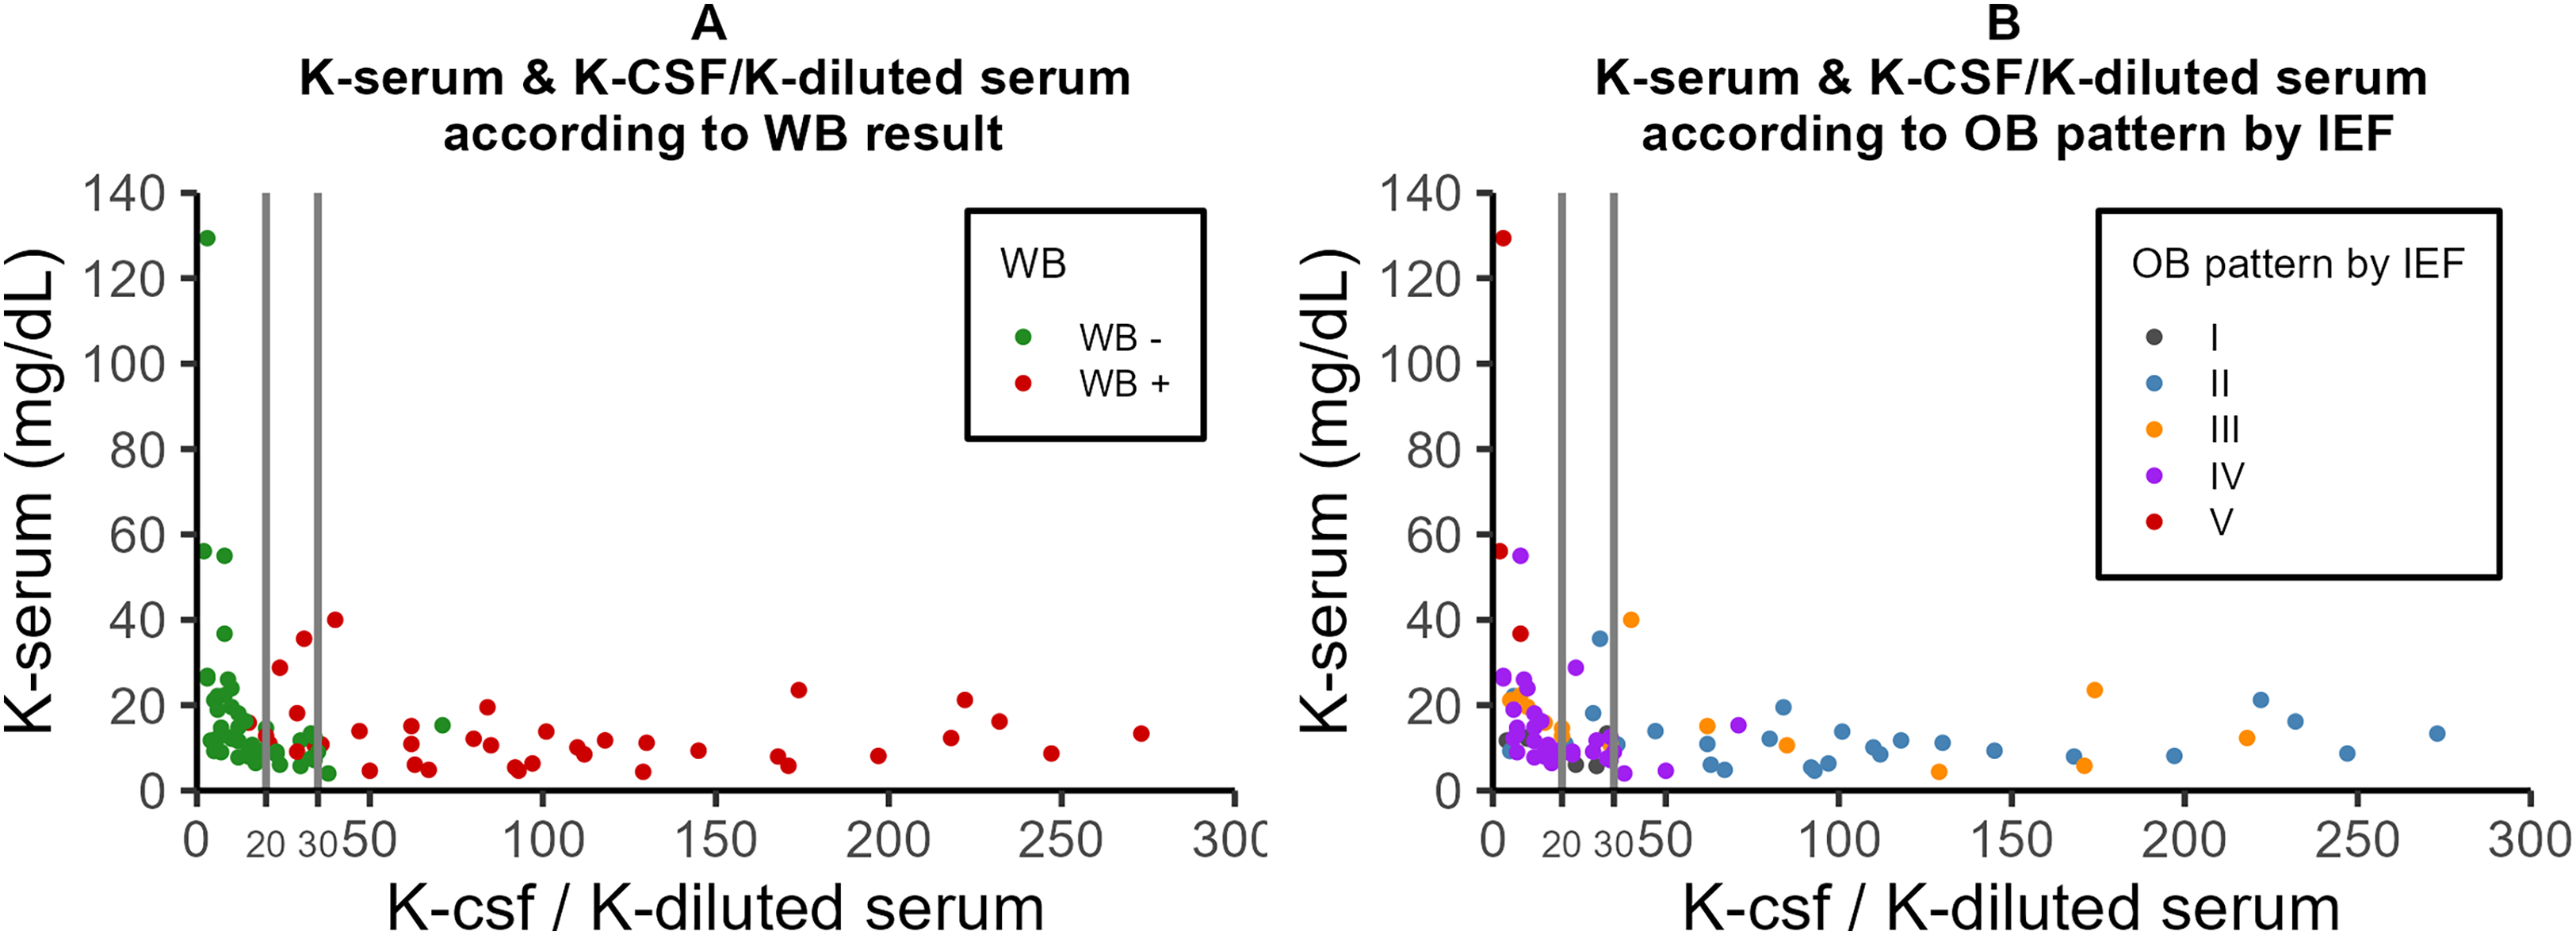
Schematic representation of serum κ-FLC concentration (mg/L) as a function of CSF/diluted serum κ ratio; and its comparison with qualitative methods for the assessment of intrathecal immunoglobulin synthesis. Panel A shows the results compared with Western blot (WB). Panel B shows the results compared with isoelectric focusing (IEF).
Table 2 shows the percentages of positivity achieved by the different methods, in comparison with the IEF. It can be seen in the type II IEF that κ-Index, κ-WB, and λ-WB were the methods that obtained the highest percentage of positivity; while for the group with type III IEF, it was λ-WB. Regarding type I IEF, considered negative for OB, the results of κ-Index, λ-Index, κ-WB, and λ-WB were negative. Some discrepancies were observed in the IEF type IV, also considered negative for OB, where a percentage close to 10% of positive results was obtained for κ-Index, λ-Index, κ-WB, and λ-WB. These results are shown graphically in Figure 5, which reveal the low sensitivity of the λ-Index, together with the already known low sensitivity of the IgG-Index. 17

Graph of percentage of positivity of the different techniques against the different types of isoelectric focusing (IEF) (I, II, III, and IV).
Percentages of positivity of the different methods versus types of oligoclonal bands.

OB: oligoclonal bands; IEF: isoelectric focusing; WB: Western blot; CSF: cerebrospinal fluid.
Table 3 shows the percentages of sensitivity, specificity, and statistical significance (p < 0.05) with respect to the IEF, obtained in each technique tested. While κ-Index, λ-Index, κ-WB, and λ-WB present specificity values similar to and greater than 90%, the highest sensitivity for the detection of ISI was observed in κ-WB and λ-WB, followed by the κ-Index.
Percentages of sensitivity and specificity of the different techniques with respect to isoelectric focusing.
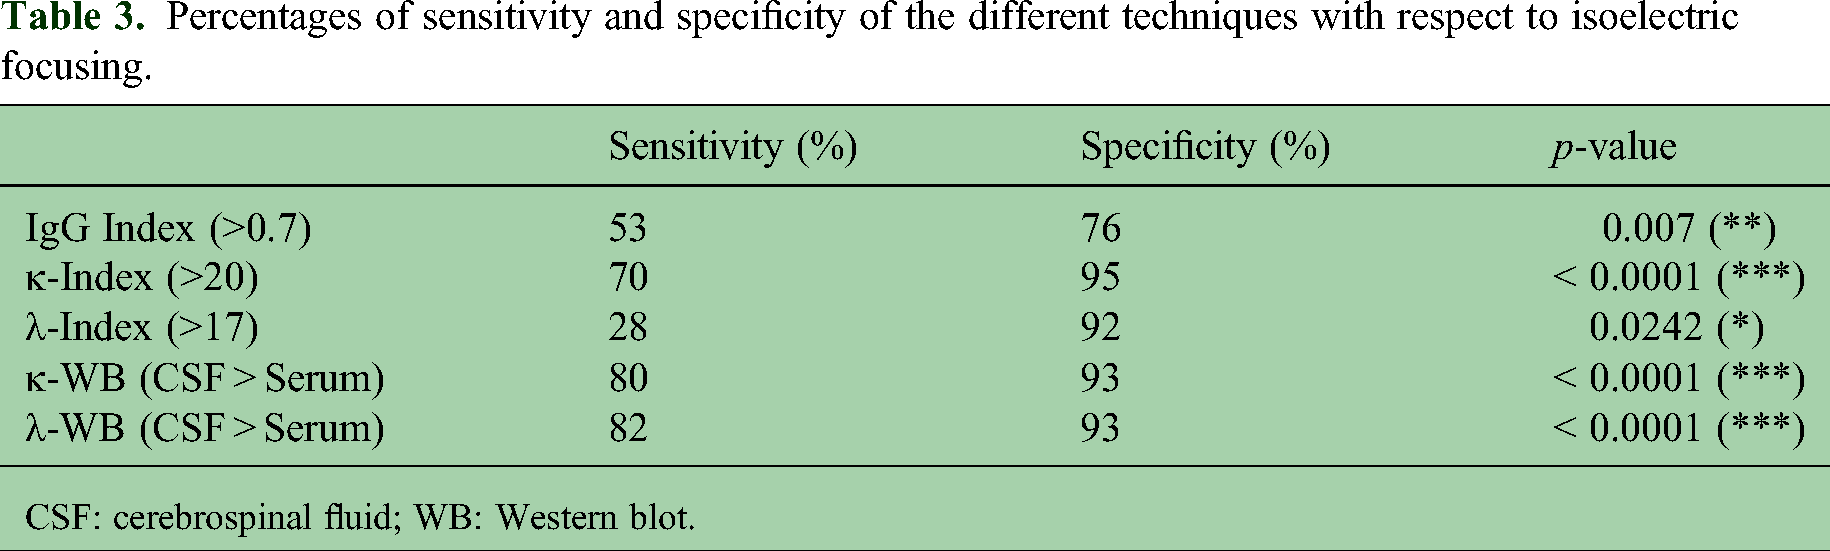
CSF: cerebrospinal fluid; WB: Western blot.
Table 4 presents examples of the parameters analyzed in different patients, providing additional support for the validity and interpretability of the results.
Examples of IgG, albumin, and kappa FLC quantification values from nine patients and their impact on different methods: isoelectric focusing (IEF), kappa Index (κ-Index), and Western blot (WB).
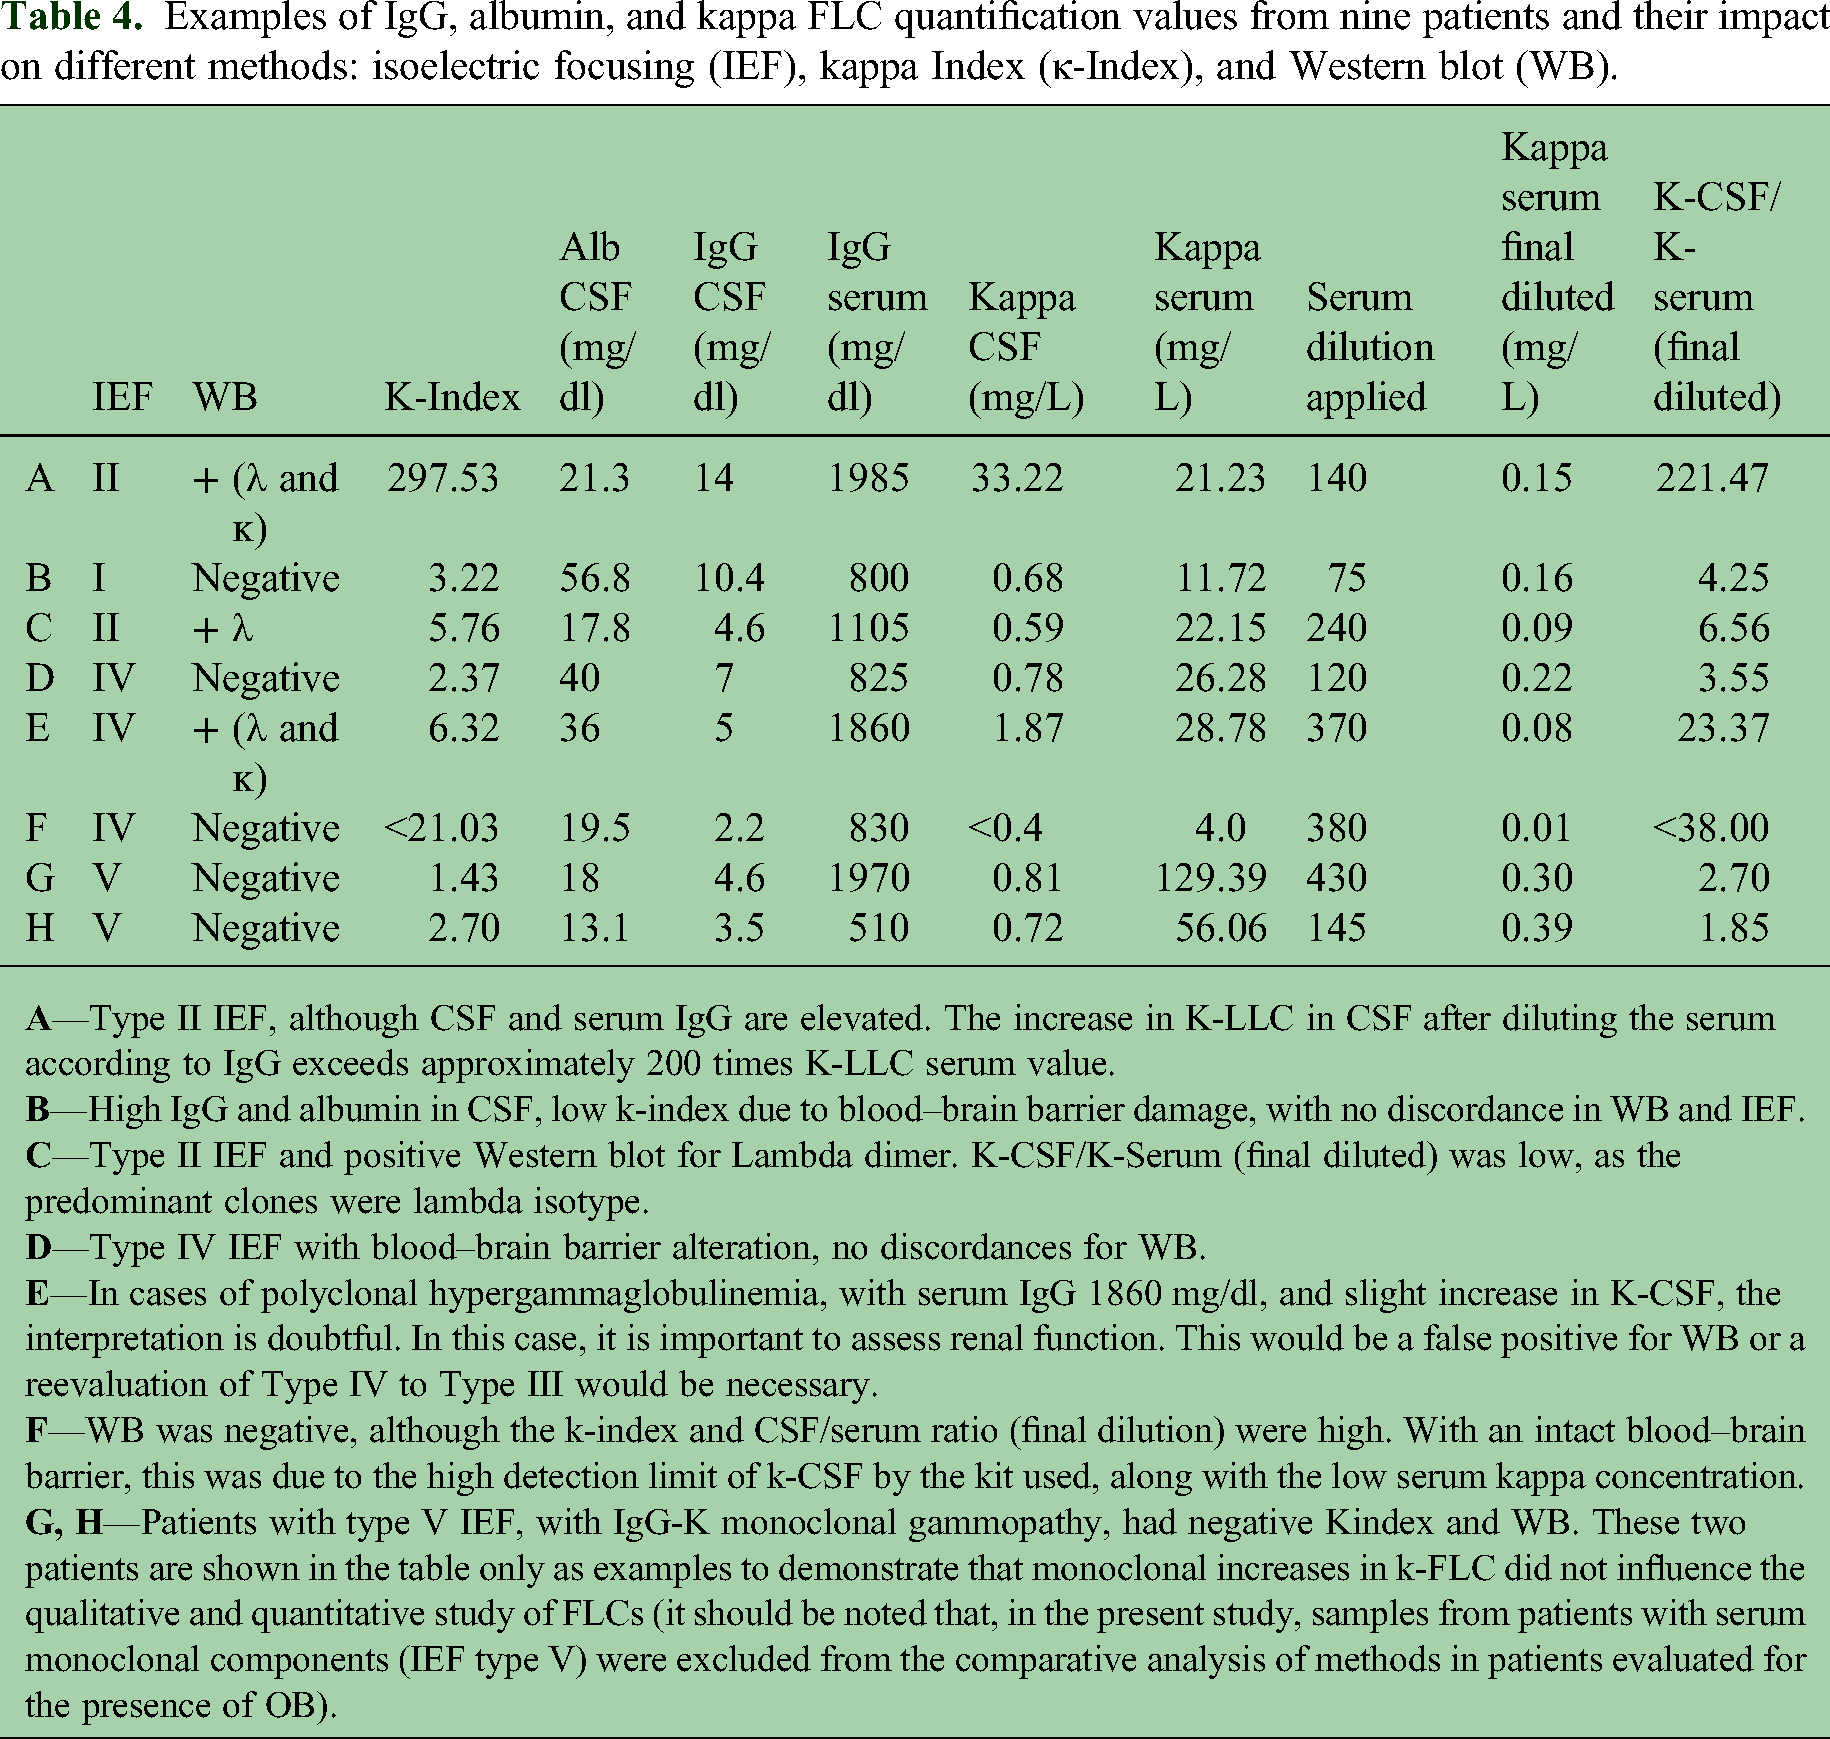
However, discrepancies were identified in a subset of patients. Negative κ-Index values (<20) were observed in 13 patients but with OB(+). Nine of them underwent κ-WB and λ-WB, all of which were positive according to the WB criterion (Table 5). On the other hand, one patient presented a κ-Index value close to the cut-off limit (21.03), IEF type IV, and WB(−) (F Case Table 4).
Patients exhibiting discrepancies between negative κ-Index values and positive results from isoelectric focusing (IEF) and Western blot (WB) used to assess intrathecal immunoglobulin synthesis (ISI).
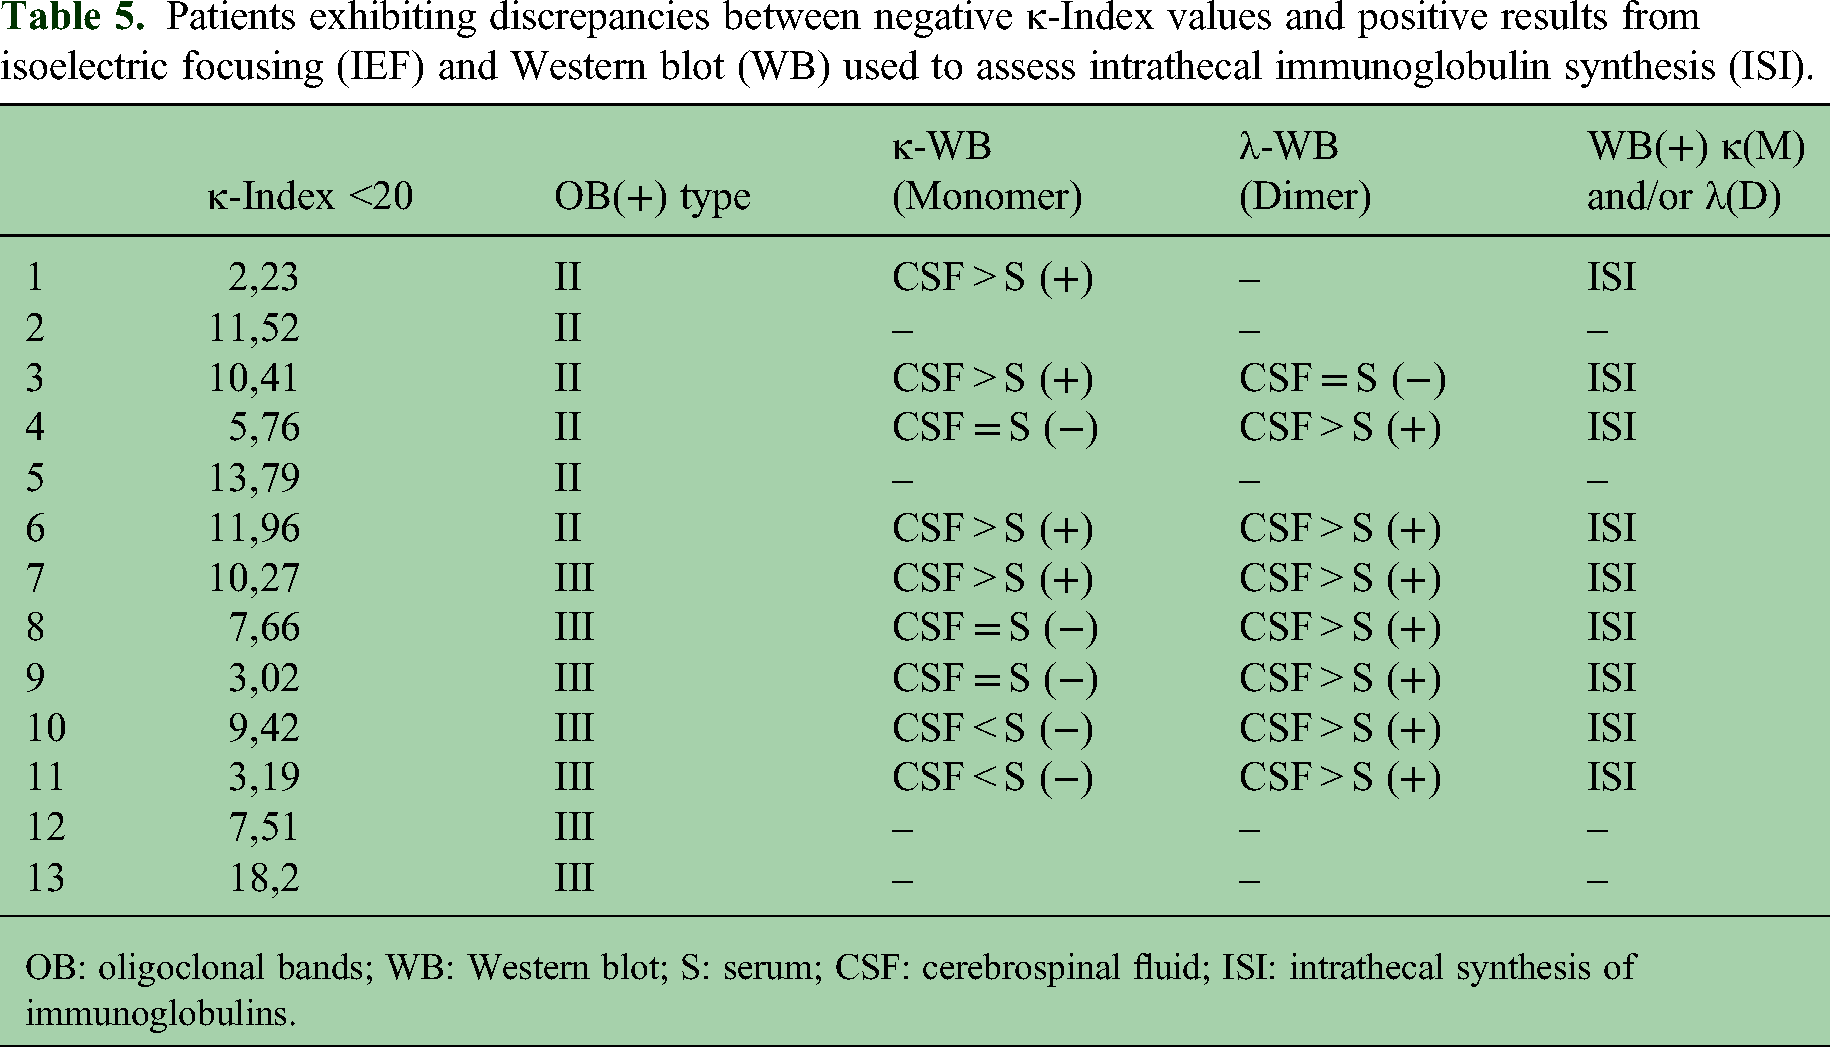
OB: oligoclonal bands; WB: Western blot; S: serum; CSF: cerebrospinal fluid; ISI: intrathecal synthesis of immunoglobulins.
In addition, two patients were observed with positive κ-WB and λ-WB, but type IV IEF and negative κ-Index and λ-Index values (patient-1: κ-Index=13.16 and λ-Index=4.69; patient-2: κ-Index=6.32 and λ-Index=15.12).
Discussion
The main fraction of proteins in CSF originates from blood; for example, Alb accounts for 35–80% of the total CSF protein content. The concentration of blood-derived proteins in CSF is the result of passive diffusion, which depends on molecular size and CSF flow rate. FLC have a smaller molecular size and therefore diffuse more readily. The dynamics of the small κ-FLC molecule contribute to the understanding of molecular size-dependent barrier functions. 18 The catabolism of FLCs occurs through glomerular filtration, degradation, and proximal tubular reabsorption in the kidney. Healthy individuals produce approximately 0.5–1 g of FLCs per day, and renal function efficiency allows for the reabsorption of 10–30 g/day, with only about 5–10 mg/day excreted in urine under normal conditions. 19 Patient-related factors can also influence κ-FLC concentration. Since serum κ-FLC is excreted in urine, renal function is assumed to be a crucial influencing factor to consider. Serum κ-FLC has a half-life of 2–6 h in vivo due to renal elimination and accumulates when renal function is impaired. 20
Different κ-Index cut-off values have been reported for distinguishing MS-positive patients from controls. The variability in κ-Index cut-off values is as follows: 72% of the articles reported a cut-off range between 2.4 and 7.83, used to differentiate MS-positive patients from controls; 21% employed a cut-off value between 8.33 and 9.58. Finally, to distinguish MS-positive patients from MS-negative patients, only a few studies (7%) used a cut-off value between 10.62 and 12.3. It is worth noting that the Freelite analyzer provides a minimum κ-Index cut-off value of 5.9 (with sensitivity and specificity of 93% and 95%, respectively), which appears to represent a sufficiently low threshold to differentiate MS-positive patients from controls (non-MS individuals). 21 In our work, one limitation we encountered in the quantification of κ-FLC with the SPAPLUS system (The Binding Site) was the detection limit for calculating the κ-Index. In cases of low serum IgG concentrations (resulting in correspondingly low serum FLC levels), the lower limit of 0.4 mg/L in CSF is too high for accurate index calculation, which can result in an artificially elevated result, whereas WB results were not affected (Case F, Table 4). Arbitrarily assigning a minimum detectable concentration value to samples with undetectable FLC in CSF may not be optimal, especially when using this value to calculate the kappa (or lambda) index. Alternatively, samples with a minimum detectable concentration in CSF could be considered negative for the corresponding FLC index by default, requiring investigation of ISI by IEF.
WB demonstrated an association between the presence of OB, as detected by IEF, and a significant increase in at least the κ-monomer and/or the λ-dimer in CSF compared to serum. For kappa, only the increase in monomer intensity was evaluated, as in some patients the κ-dimer was not observed despite the presence of positive OB. In contrast, for lambda, the dimeric form was consistently detected. 15 This finding is consistent with the fact that the predominant molecular forms of κ-FLC and λ-FLC are the monomer and dimer, respectively.
On the other hand, it is important to consider that if only an elevated κ-dimer is observed, it is likely due to interference caused by CSF degradation. In such cases, multiple bands are also seen in the CSF stained with silver stain in SDS-PAGE (which can also occur in serum), affecting the interpretation of results. Therefore, a degraded sample—due to cold chain disruption or prolonged refrigeration before processing—cannot be reliably analyzed using this method (data not shown). Hehle VK et al. reported that the ∼50 kDa band observed in the IgG degradation profile may contain a mixture of Fc and Fab fragments. 22
In the IEF technique, IgG concentrations are standardized to 3 mg/dL in both serum and CSF to optimize the visualization of bands between the two fluids, if present. In contrast, the WB technique follows a different rationale: serum is diluted to match the IgG concentration of the corresponding CSF, thereby simulating an equilibrium state that would result from passive diffusion across the blood–brain barrier. In the presence of ISI, this equilibrium is disrupted, and an imbalance in κ-FLC between CSF and serum becomes evident, as serum κ-FLC have a short half-life and is rapidly cleared via glomerular filtration. There is an obvious discrepancy between quantitative (CSF concentration: diluted serum concentration; more than 20 for positive WB results) and qualitative (intensity of k-FLC monomer or λ-FLC dimer band in CSF: intensity of the corresponding band in the diluted serum; more than 1.45 for k-FLC monomer and more than 1.2 for λ-FLC dimer is considered as a positive result) approaches. This may be due to completely different methods used: SDS-PAGE electrophoresis with WB estimating specifically and separately monomers and dimers, while Freelite™ reagents estimate the total concentration of kappa (or lambda) FLC in a liquid medium.
In the comparison of the various methodologies with the IEF, it was observed that the κ-Index had greater sensitivity than the λ-Index, in agreement with Hegen et al., who consider the quantification of κ-FLC to be the preferred choice for diagnosis and prognosis in MS, although further studies and evidence are needed to achieve methodological harmonization. 23 This observed difference between the κ-Index and the λ-Index appears to be methodological rather than pathophysiological. When comparing the WB technique with IEF, both the κ-monomer and the λ-dimer contribute to WB positivity, with high sensitivity and specificity. Notably, a minority of our patients showed isolated λ-WB positivity—an observation that should be considered in future studies related to patient diagnosis.
As for the 13 patients with κ-Index results <20 but OB(+) and WB(+), they could be considered false negatives for κ-Index. Desplat-Jégo, S et al. obtained the same cut-off value, κ-Index<20, in a study of 89 patients; and Menendez-Valladares P. et al. determined a κ-Index<10.62 in 176 patients, with the use of similar methodology (immunoturbidimetry and polyclonal antisera).24,25 These antecedents, while validating the κ-Index results obtained in the present work, confirm the need to have an additional method to improve the κ-Index sensitivity, even when its values are close to the cut-off limit. An alternative algorithm to OB research could be the use of WB after a κ-Index<20 result, since it increased sensitivity to 100% (Figure 6).
Two patients presented κ-Index<20 with κ-WB(+) and λ-WB(+), but OB(−) (type IV) and would have been classified as positive for ISI according to the proposed algorithm. These patients could represent a false positive or perhaps require a reclassification of the IEF pattern from type IV (negative) to type III (positive). It should be considered that the performance of the test depends both on the its structural limitations and on errors in interpretation.24–26 Likewise, FLC could reflect ISI, derived from both IgG and IgM.27–29
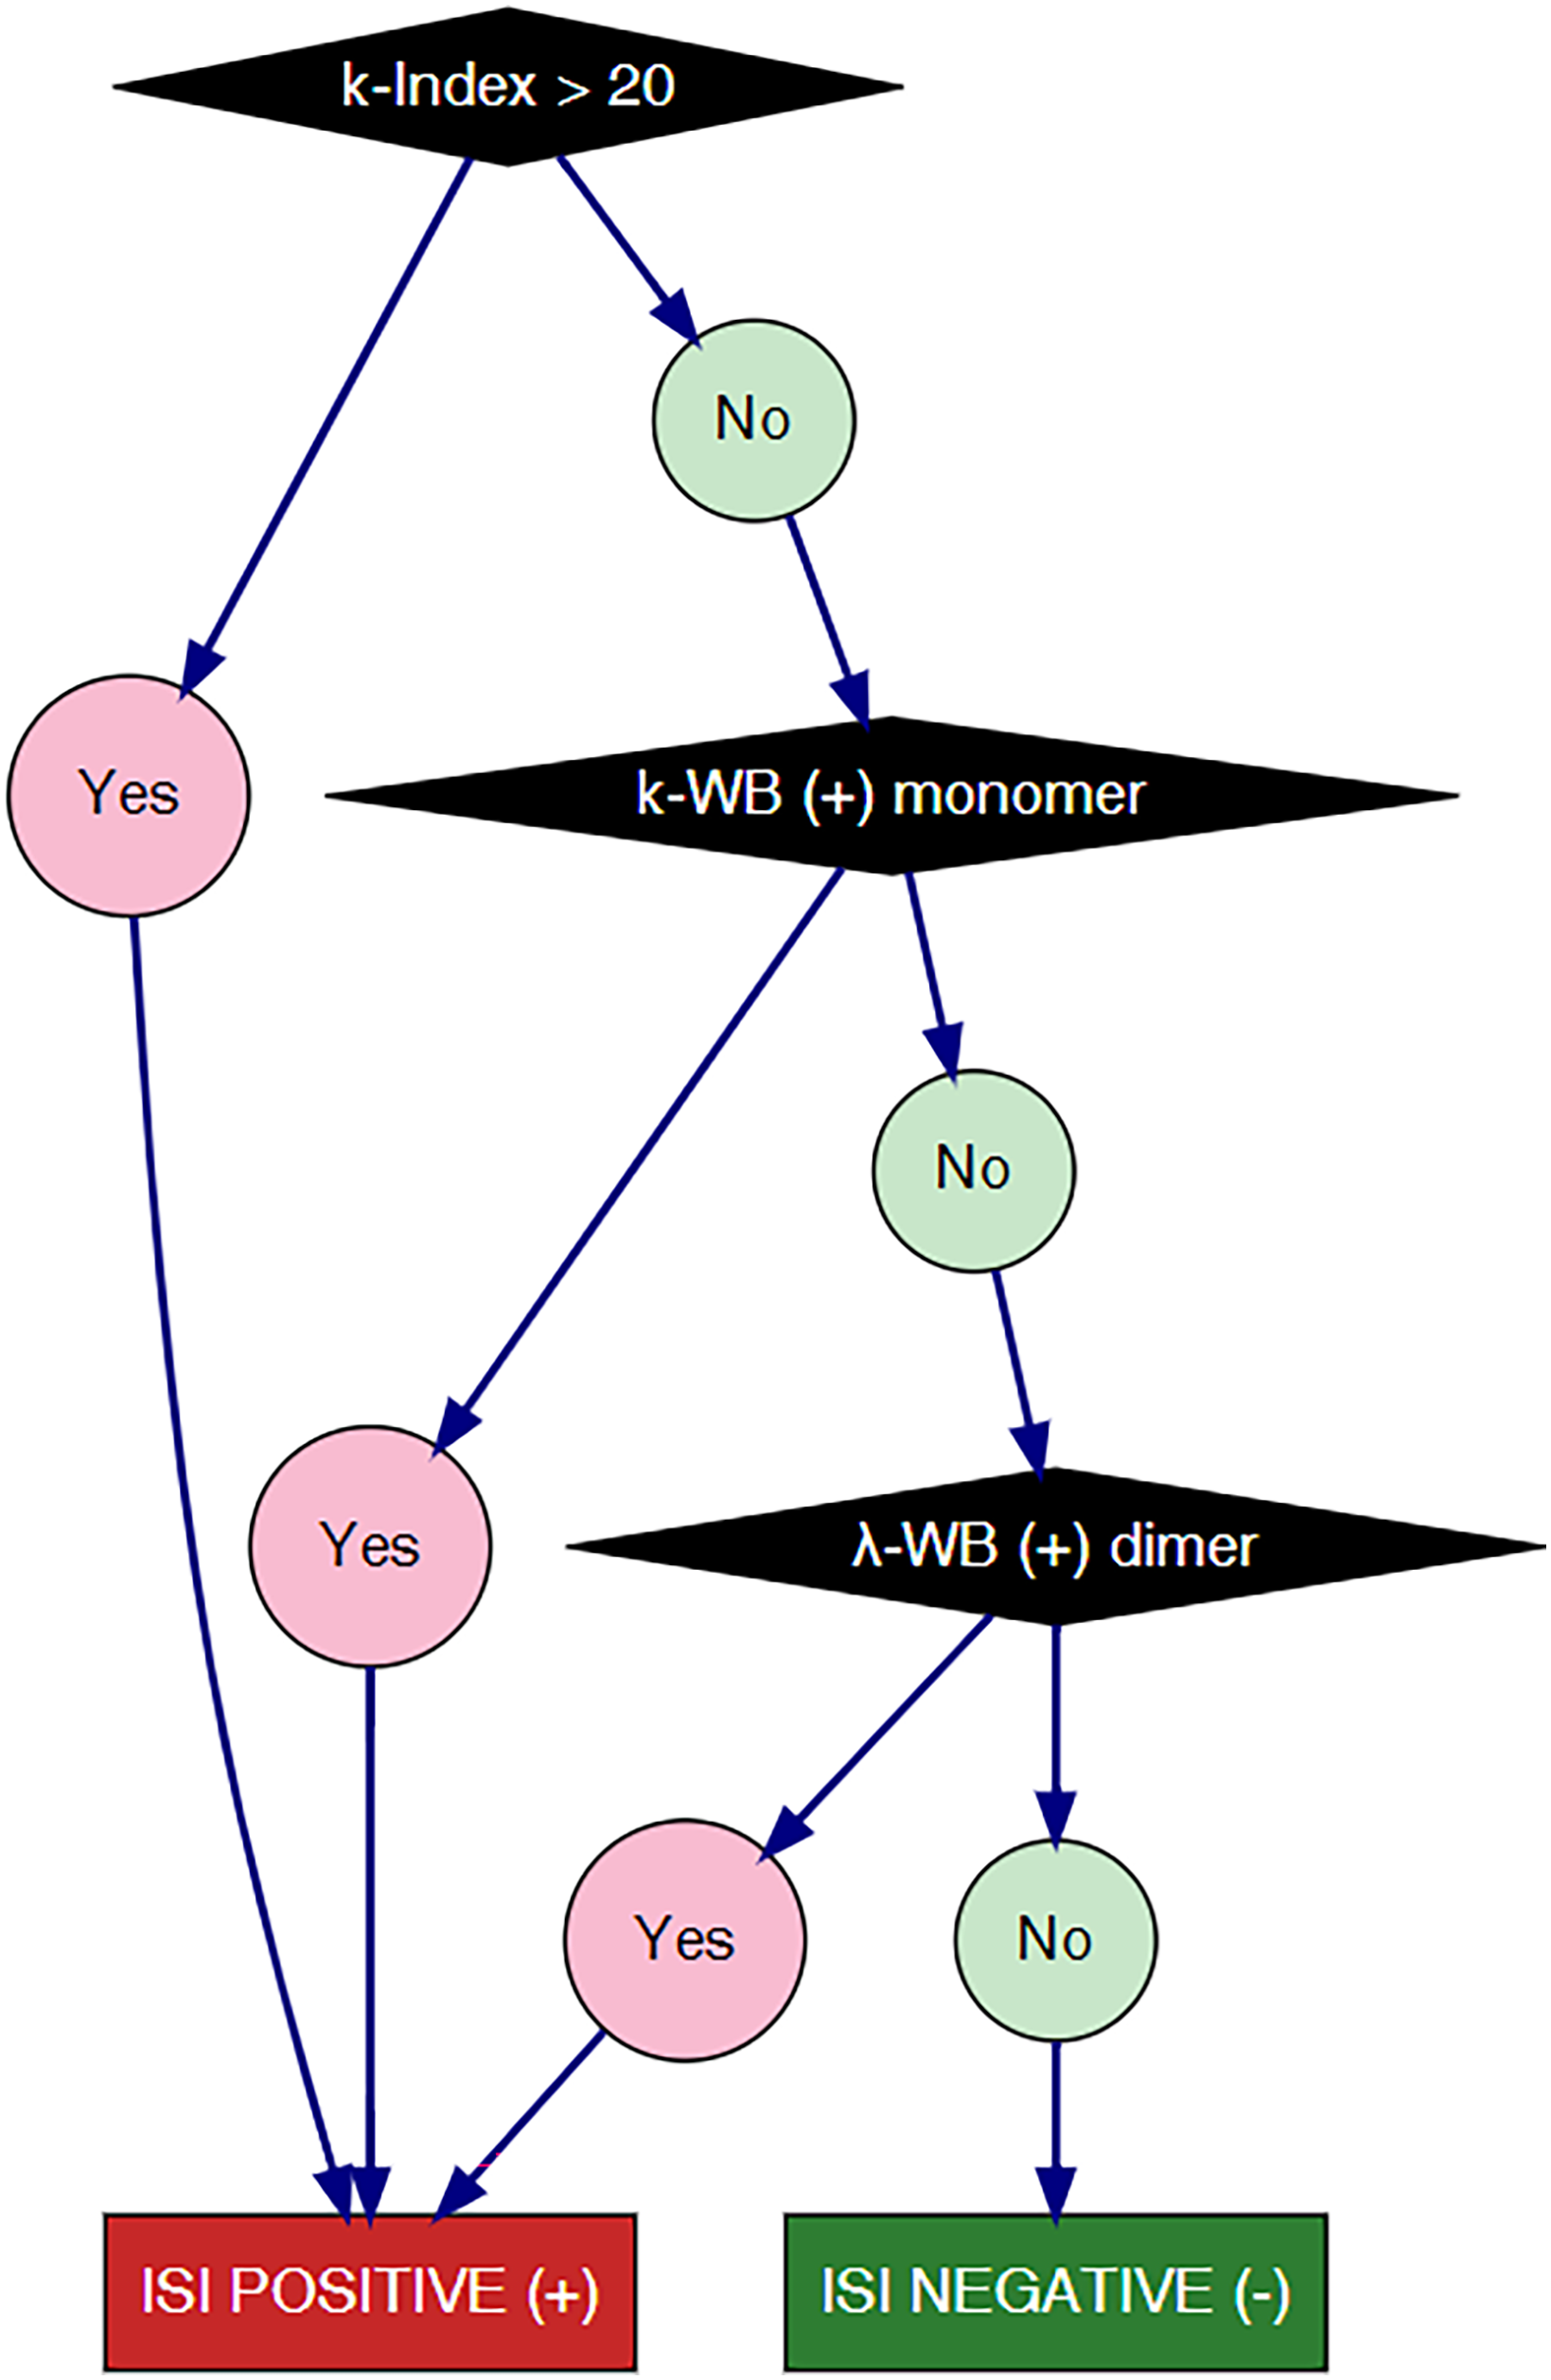
Alternative algorithm to oligoclonal bands by isoelectric focusing, for the detection of intrathecal synthesis of immunoglobulins.
The 2024 McDonald diagnostic criteria for MS introduce κ-FLC detection in CSF, which can be used interchangeably with IgG-OB to demonstrate ISI. They recommend calculating the κ-index with values of ≥6.1 performing best for diagnosing MS. 10
The strength of our work lies in the implementation of an alternative algorithm for the detection of ISI in CSF, with an efficiency similar to that of OB investigation by IEF, involving the quantification of k-index followed by the qualitative expression of FLCs (κ and λ) by WB.
Footnotes
Declaration of Conflicting Interests
The authors declared no potential conflicts of interest with respect to the research, authorship, and/or publication of this article.
Funding
The authors disclosed receipt of the following financial support for the research, authorship, and/or publication of this article: The study was funded, in part, by INFIBIOC and Specialized Protein Analysis Laboratory. Reagents for measurement of kappa and lambda free light chains were provided by The Binding Site (Latin American-Latam).