
Abstract
This research note empirically examines China’s development assistance to Asia, a region critical to China’s geostrategic ambition, from 2000 to 2014. It uses AidData’s Global Chinese Official Finance Dataset, one of the most reliable publicly available data sources on Chinese aid, which systematically collects and classifies different types of China’s official development finance. It is found that, despite a recent surge, China’s development assistance to Asia remains highly limited compared to that of Japan, Asia’s top donor, and that the economic sectors of energy, transport, and mining dominate financial flows. Econometric analysis results suggest that China’s aid allocation in Asia is influenced by its export relations, but, more importantly, that foreign policy considerations do not play a significant role, which is in contrast to the findings of recent work on Chinese aid to Africa. The results suggest that better measures may be needed to properly capture China’s strategic interests in Asia, including its involvement in the territorial dispute in the South China Sea.
Introduction
China’s rapid economic growth in the past decades has led to a significant expansion of its overseas development finance. The increase in the country’s development financing has created significant interest as well as alarm among policy makers and academics in the field of international development. Common perceptions in media reports and policy debate are that China allocates development finance for commercial purposes, that it uses aid to secure access to natural resources and to support Chinese companies for overseas investment opportunities, as well as for strategic purposes to promote its geostrategic interests ( Economist, 2008; Naim, 2007). Critics have argued that Chinese aid has serious, damaging consequences for recipient countries. China’s aid programs have been criticized for their lack of respect for social and environment standards and for not considering human rights or democracy conditions in recipient countries, thus hindering the political reforms of these countries (Crouigneau and Hiault, 2006). Others state that the rise of emerging donors, mostly notably China, may put international standards, embodied by the Paris Declaration on Aid Effectiveness, at risk (Manning, 2006) and challenge the US-led order in international development finance (Snell, 2015).
Scholars have pointed out that these popular media and policy accounts tend to conflate concessional and non-concessional development flows from China (Bräutigam, 2009, 2011; Dreher et al., 2018). In fact, among what is known as China’s development financial flows, what would be qualified as official development assistance (ODA) by the Organisation for Economic Co-operation and Development (OECD) definition may be relatively small (Bräutigam, 2011). Most of its development finance includes commercial loans, natural-resource-backed loans and export credits that do not meet ODA criteria and thus cannot be considered as development assistance. The fundamental cause for this misunderstanding is the lack of data. The Chinese government does not collect and disclose official aid statistics in accordance with international standards. In the absence of official statistics, various efforts have been made to estimate China’s development assistance comparable with international standards.
Recent studies on China’s international development finance have focused primarily on Chinese activities in Africa (Dreher et al., 2017, 2018; Guillon and Mathonnat, 2018). This may reflect the fact that Africa has greater development needs and has been the most aid-intensive continent, making the growing presence of China there conspicuous. Yet the rise of Chinese development finance also has important implications for China’s home continent, Asia. For obvious geostrategic and economic reasons, Asia figures prominently in China’s overall global strategy and its neighborhood policy, affecting not only its development finance projects in the region but also the behavior of other donors. To take one significant example, Japan, the traditional top donor and financier to Asia, has been actively reacting to the rise of Chinese development finance and investment activities by reorganizing its development finance institutions and expanding funding resources (Yoshimatsu, 2017). While studies on Chinese development finance in Asia do exist, they are mostly qualitative in nature (Dadabaev, 2018; Reilly, 2012). The following quantitative analysis of Chinese aid to Asia is meant to complement both the existing qualitative research on the region and the recent quantitative work focused on Africa.
This note assesses the size and sectoral distribution of Chinese aid to Asia and the determinants of bilateral aid, using AidData’s Global Chinese Official Finance Dataset (Version 1.0) provided by Dreher et al. (2017). It seeks to uncover the patterns in China’s aid-giving in Asia and to reveal how they differ from China’s development assistance in other world regions. The study proceeds as follows. The next section reviews recent studies on China’s development finance; the following two sections provide the descriptive statistics and examine the determinants of China’s bilateral development assistance to Asia; and the final section discusses the implications of the results and offers concluding remarks on potential directions for future research.
The literature on the scope and determinants of China’s development finance
Recent scholarly investigations have made clear that what is commonly referred to as China’s official development assistance is a mixture of what could be categorized by the OECD Development Assistance Committee (DAC) standards as ODA, and other, non-ODA types of development finance (Bräutigam, 2009, 2011; Dreher et al., 2018). The DAC has developed standards for what can be considered as ODA and has established a reporting regime, known as the OECD Creditor Reporting System (CRS). Detailed project-level information, the essential part of useful aggregate ODA data, is collected and made public according to this process. To qualify as ODA, a project should have a concessionality and development intent. ODA covers all grants, technical assistance and scholarships, loans with large grant elements, debt relief, and military aid with development intent. Especially for loans, they should have a grant element, calculated by a set formula, of at least 25 percent. To differentiate quasi-ODA from more concessional flows, the DAC also has its members report the “residual category” of Other Official Flows (OOF) that are developmental in character but “do not meet ODA criteria.” OOF is limited to loans and export credits that have little or no grant element as well as grants that are not intended for development.
China’s Foreign Aid White Paper 2014, one of the few official government sources currently available for China’s aggregate development finance, states that China’s total foreign “aid” totaled US$14 billion from 2010 to 2012 for 121 countries (Government of China, 2014). Yet it offers no information disaggregated by recipient country, year, sector, or flow type. This lack of official granular data poses a serious challenge to the systematic analysis of the determinants, characteristics, and impact of China’s aid allocation. Unfortunately, the data problem is unlikely to be resolved by the Chinese government in the immediate term. China may see benefits to operating outside the restrictions imposed by the OECD’s DAC. It may also fear public resentment if Chinese citizens feel their government prioritizes overseas development over their country’s own internal needs (Cheng and Smyth, 2016).
Due to its growing importance, there have been several attempts to unofficially estimate China’s development flows. Lum et al. (2009) estimate China’s “aid” to Africa, Latin America, and Southeast Asia from 2002 to 2007 based on media reports. The researchers employ a broad definition of China’s development finance, using “aid and related activities” that include a broad range of economic cooperation activities, including overseas investment by Chinese state-owned enterprises. The research suggests that China’s flows to the three regions grew from US$51 million in 2002 to US$25 billion in 2007.
Kitano and Harada (2016) estimate China’s net aid disbursements from 2001 to 2013 following a stricter definition of ODA. They only include grants, interest-free loans, scholarships, concessional loans, and contributions to international organizations, while providing estimates for China’s multilateral assistance as well as bilateral aid. Using a wide range of available Chinese government statistics, including financial yearbooks, China Exim Bank reports and information from ministry websites, the authors estimated that China’s net aid reached US$7.1 billion in 2013, which makes China the sixth largest donor in the world for that year.
As of now, the most reliable and comprehensive data source for the empirical study of China’s development finance at the recipient country and project level is AidData’s Global Chinese Official Finance Dataset (Version 1.0), developed by Dreher et al. (2017). Like AidData’s earlier project focused on Africa, the Chinese Official Finance to Africa Dataset (Version 1.2) (Strange et al., 2017b), this dataset’s primary methodology is drawn from media-based data collection. 1 In the current version, the Global Chinese Official Finance Dataset has information on Chinese development finance flows to all developing regions from 2000 to 2014. One of its advantages is the ability to differentiate official development assistance, or “ODA-like” activities, from other financial flows, or “OOF-like” activities, based on the OECD standard classification. Despite its limitations, AidData’s methodology is transparent and the limitations of its data therefore known to researchers, which is critical to unbiased empirical research.
Given the relative newness of the data, studies systematically investigating China’s bilateral aid relations in a cross-country setting have appeared only recently. Dreher and Fuchs (2015) examine bilateral aid allocation from 1956 to 2006 by the Chinese Ministry of Commerce, finding that, while trade and foreign policy interests are important motives in Chinese aid allocation, they do not set China meaningfully apart from Western donors. At the same time, Chinese aid is largely unlinked to natural resource endowments and the institutional characteristics of the recipient countries. The authors conclude that criticism of Chinese development assistance in Africa as “rogue aid” may be unjustified.
Using the Chinese Official Finance to Africa Dataset (Version 1.2), Dreher et al. (2018) analyze the determinants of China’s development finance to Africa from 2000 to 2013. They find that Chinese ODA-like flows to Africa are driven by foreign policy considerations, captured by temporary membership of the UN Security Council as well as Taiwan recognition. Like Dreher and Fuchs, they fail to find support for claims that Chinese aid is motivated by natural resource access or affected by the recipient country’s institutional quality or regime type. Nonetheless, they find that decisions for OOF-like flows are influenced by economic factors, such as natural resource wealth, financial risks, and institutional quality.
This note builds on recent findings in the literature showing that while it is important to distinguish China’s concessional state flows from non-concessional types, foreign policy considerations are important motives for China’s aid allocation. Given the strategic importance of Asia to China’s global rise, the question of whether these findings also hold in Asia merits serious investigation.
Size and characteristics of China’s development aid to Asia
The analysis in this section and the next uses data from the Global Chinese Official Finance Dataset (Version 1.0) discussed above, employing ODA-like flows while excluding OOF-like and vague flows. 2 Asia is defined as countries in South Asia, Southeast Asia, Central Asia, and the East Asia and the Pacific region outside Southeast Asia, based on the World Bank country grouping. 3
To put China’s aid in perspective, first it may be useful to compare it to that of the US, the global top donor, and Japan, Asia’s top donor. From 2000 to 2014, the US, Japan, and China provided US$396 billion, US$210 billion, and US$81 billion respectively in total aid commitment to developing countries. 4 The regional distribution of these three donors differs significantly. China has an overwhelming focus on Africa, which accounts for 57.9 percent of its total aid. Africa is also the largest recipient for US aid, but accounts for only a third of the total, with Latin American and Asian countries also receiving a substantial share. Japanese aid, on the other hand, is highly concentrated in Asia, with 64.4 percent of its total aid distributed there. Nonetheless, Asia is either the first or second recipient region for all donors (Table 1).
Regional distribution of aid by US, Japan, and China, 2000–2014 (%).
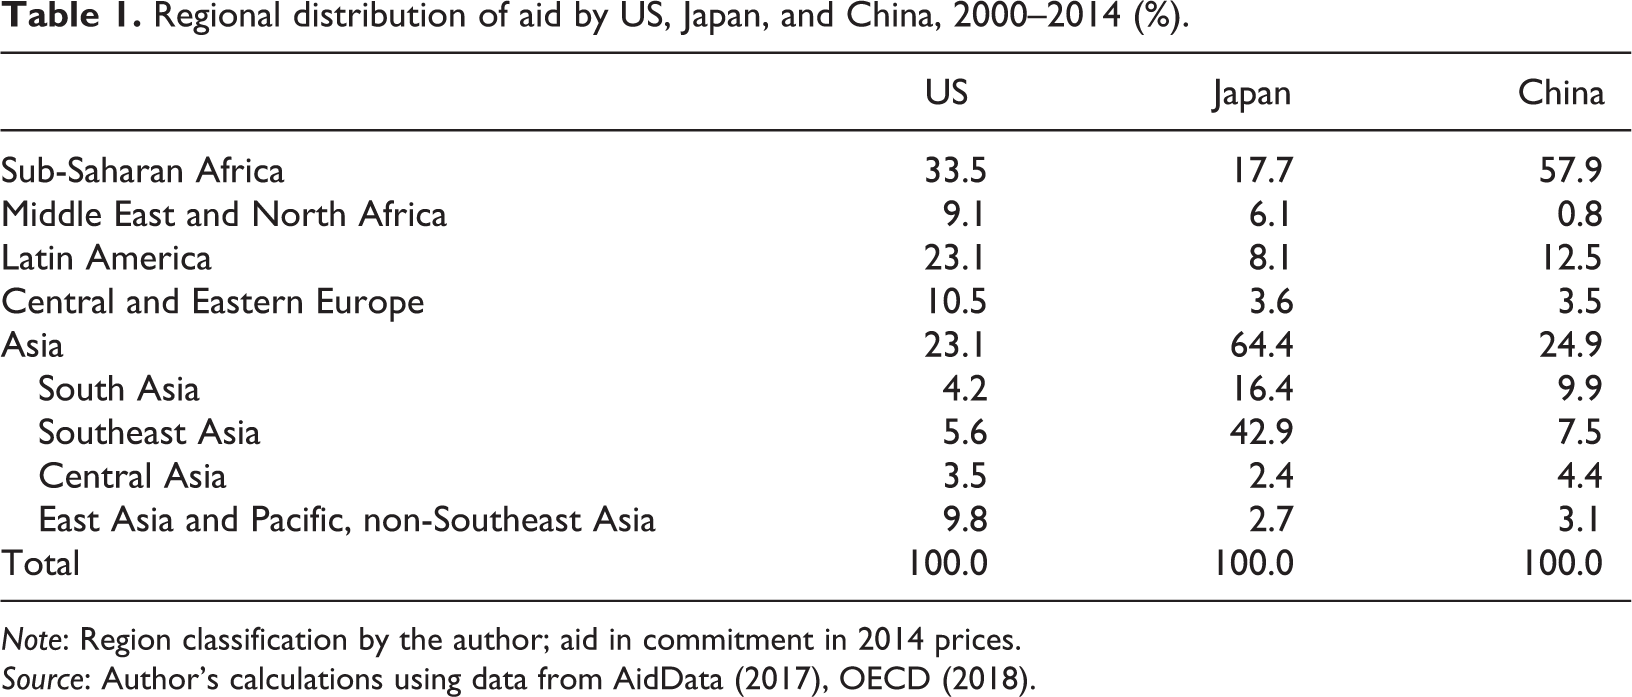
Note: Region classification by the author; aid in commitment in 2014 prices.
Source: Author’s calculations using data from AidData (2017), OECD (2018).
China provided US$14.9 billion to Asia in ODA-like flows from 2000 to 2014. Its aid has been increasing over the years and surged in 2006, 2009, and 2013 (Figure 1). Flows for 2010–2014 account for 45.4% of the total amount for 2000–2014, suggesting that China increased its flows in the later years. Nonetheless, compared to major DAC donors, China fails to measure up. Over this period, Japan, the top donor in Asia, provided US$87 billion and stepped up its aid commitment dramatically in 2013. The US offered the substantial amount of US$37.4 billion, but its aid commitment has been on the decline since 2010. This suggests that the major response to the increasing Chinese aid in Asia may be being undertaken by Japan, the regional rival.
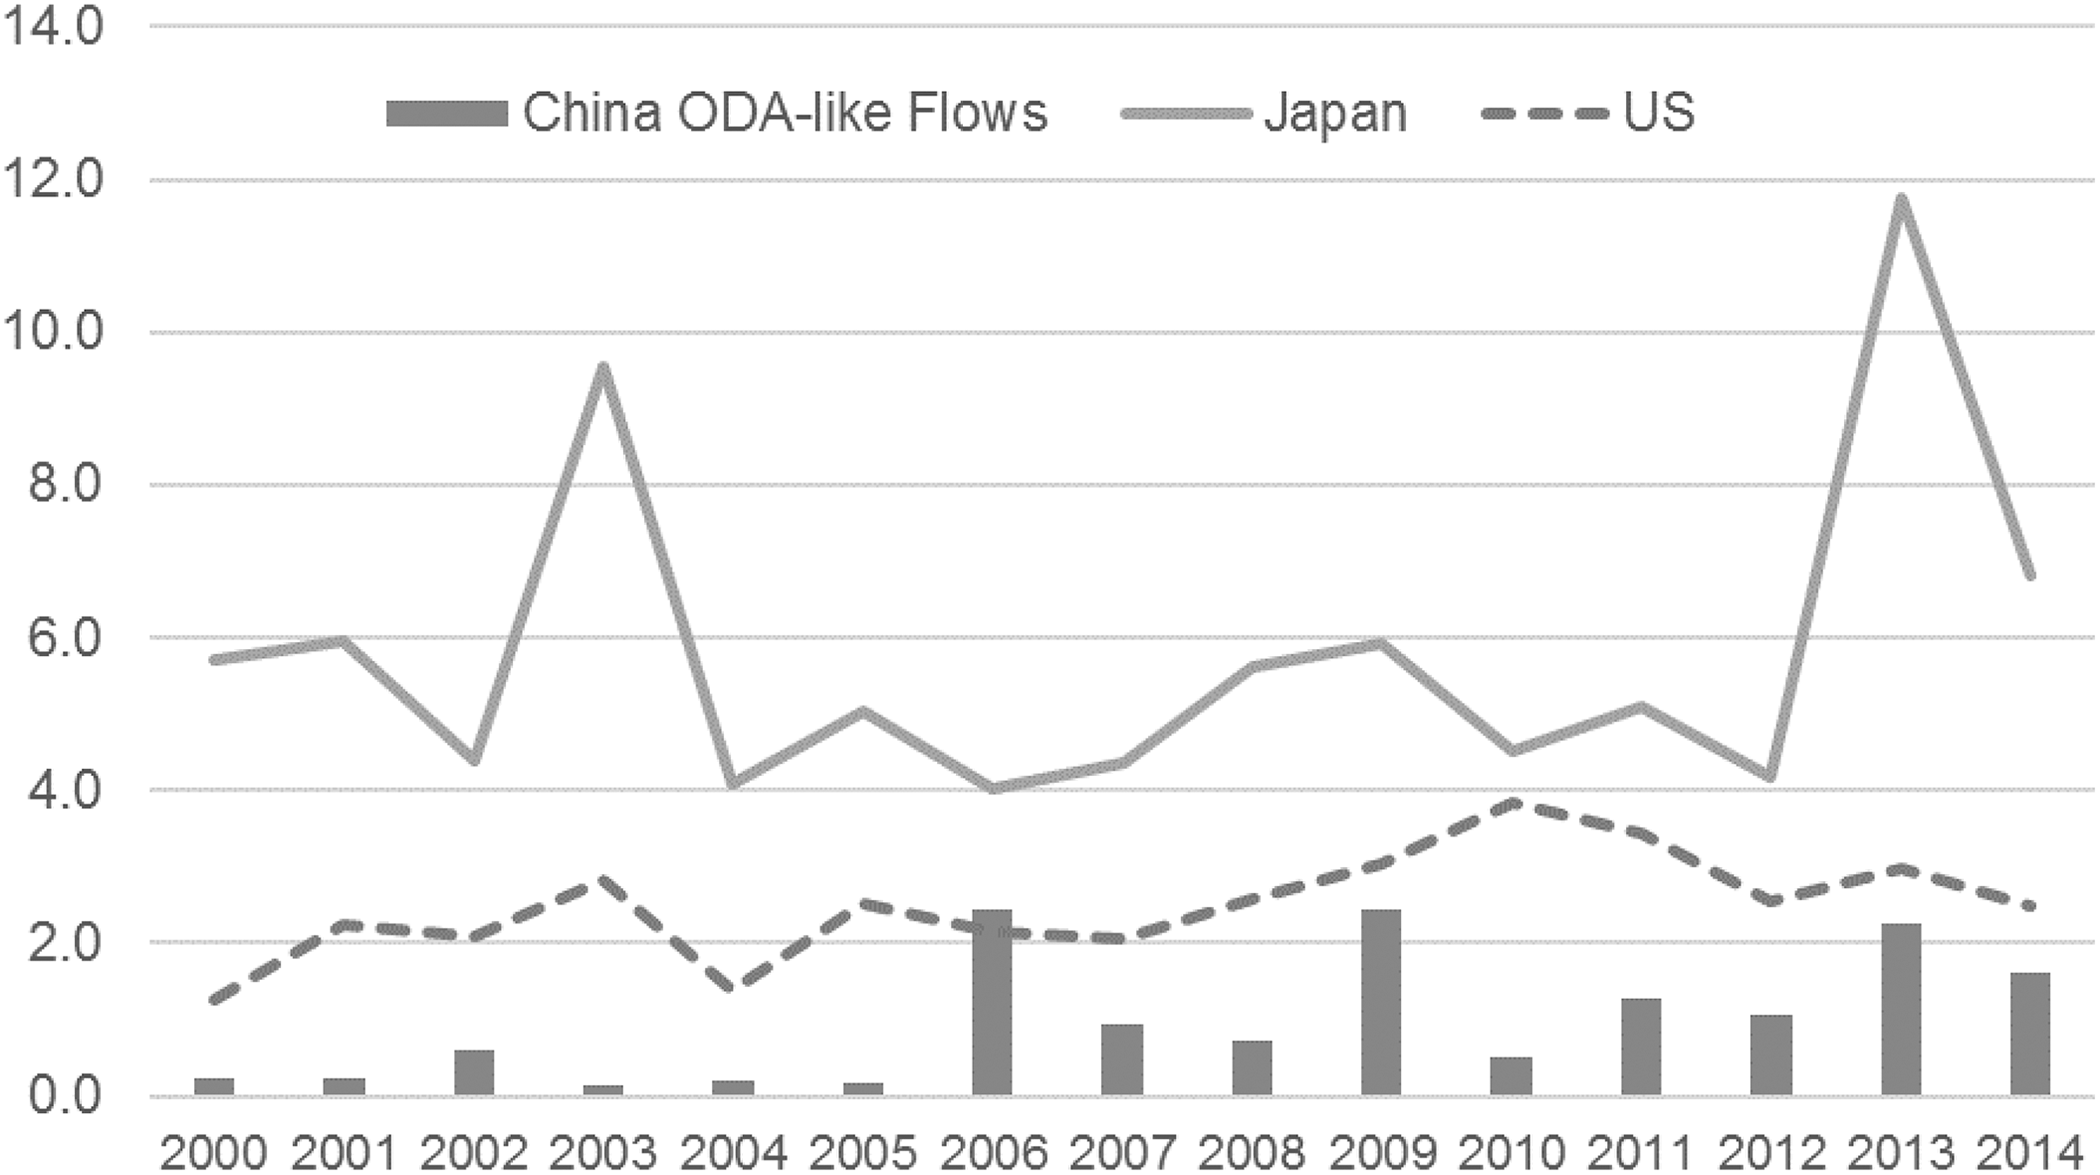
China’s ODA-like flows to Asia compared to Japanese and US aid, 2000–2014 (in US$ billion).
Within Asia, South Asia is the largest recipient of Chinese aid (39.8%), followed by Southeast Asia (30.1%) and Central Asia (17.8%). Countries in East Asia and the Pacific region (excluding Southeast Asia), largely represented by Pacific island states, make up the smallest group, receiving 12.3 percent. Although South Asia ranks first as a subregion, the largest country recipient is Cambodia of Southeast Asia, which received US$3.0 billion for the period. 5
The sectoral distribution of Chinese ODA-like flows to Asia clearly shows the importance of economic motives, including natural resource access and infrastructure development, to China’s development financing. For 2000–2014, a total of US$6.6 billion, representing 44.6 percent of total aid flows, went into the economic sector, which includes transport and energy. The second largest category is the social sector, which received US$3.6 billion (24.1%). The production sector, which includes mining and construction, came third, receiving US$1.8 billion and accounting for 12.1 percent of aid spending. These patterns are consistent with the common perception of Chinese aid as focused on infrastructure development, including power plants, roads and railway construction, and resource development. Yet they also show that Chinese aid does go toward the social sector such as health and education. Whether the 24 percent share of total aid is too limited is subject to debate. While it is true that DAC donors typically allocate more funds to the social sector than the economic one, this is not always the case. Moreover, patterns of aid spending fluctuate significantly over time (Figure 2). The social sector was the largest recipient of Chinese aid to Asia in 2004, 2005, 2009, and 2010, while the economic sector has been dominant since 2011. The volume of aid to the production sector was largely limited in the later years.
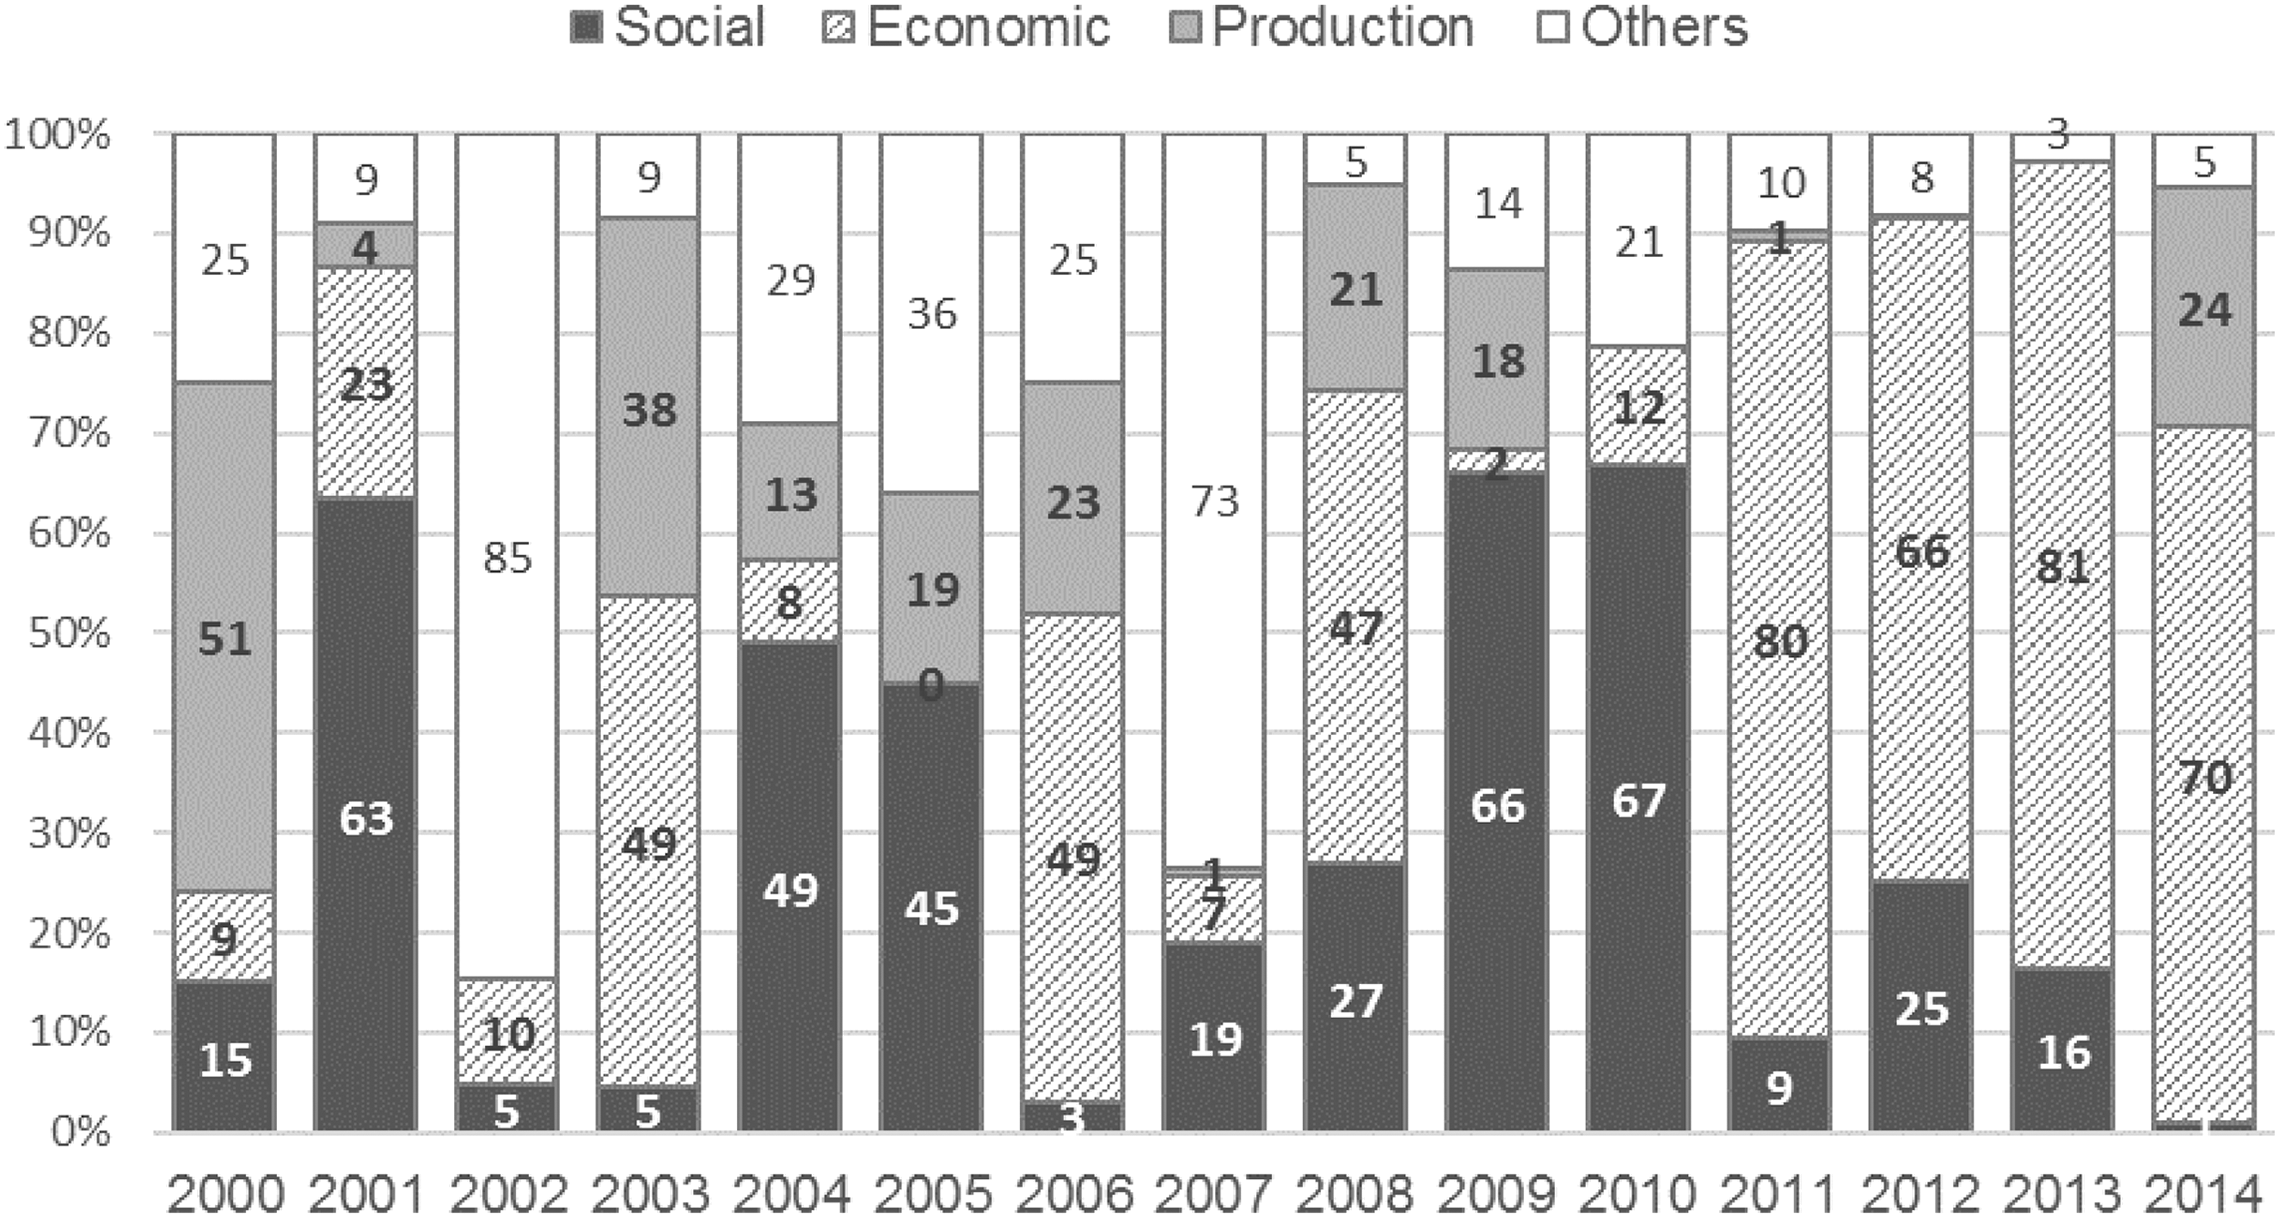
Sectoral distribution of China’s ODA-like flows to Asia.
What drives China’s development aid to Asia?
Model
My model specification largely follows Dreher et al. (2018). Explanatory variables are grouped into four categories: developmental/humanitarian, institutional, commercial, and foreign policy motives. The first group includes the developmental and humanitarian factors contributing to aid giving. For this group, I include GDP per capita from the World Bank, which is self-evident, and damages from natural disasters, measured by the total number of people affected, as provided by the international disasters database EM-DAT. For institutional merits of a recipient, I first use democracy as represented by the polity2 variable from the Polity IV Project. China is often accused of supporting other authoritarian regimes for its own survival or regional stability (Bader, 2015). Another variable in this group is the Control of Corruption index from the Worldwide Governance Indicators project, which ranges from –2.5 to 2.5, with higher values representing better governance. Third, for commercial considerations, I employ three measures. The first is a recipient country’s debt position, measured by its external debt stocks as a percentage of its Gross National Income (GNI), to capture the risk for concessional loans. As a proxy for China’s trade interests, I include the value of China’s exports to the recipient country, as export competition is often linked to aid allocations (Barthel et al., 2014). To account for China’s interest in securing access to natural resources, I include a measure of resource wealth provided by the World Bank.
There are three foreign policy variables. Following Thacker (1999), I first consider the voting behavior of recipient countries in the United Nations General Assembly (UNGA) in order to measure the degree to which the foreign policy preferences of China and each country overlap. To do so, I use the indicator for measuring voting similarity developed by Bailey, Strezhnev, and Voeten (2017), which rates the degree of similarity on a scale of 0 to 1. Second, I include a dummy variable for Taiwan recognition to account for a country’s position on the One China policy. Finally, I use a measure of donor competition by taking the sum of aid committed by all DAC donors to the recipient.
I also control for population, English as the official language to address the bias from the AidData’s data collection process, and a shared border with China to account for geostrategic peculiarities. I lag all time-varying explanatory variables by one year to account for the time needed for these factors to have influence.
Finally, since the focus of this analysis is on whether China’s aid allocation decisions are geographically conditioned, I include regional dummies and their interaction terms with economic and strategic variables. Three regional dummies are Asia, Africa, and “the rest” of the developing world. The reference category is the residual region of “the rest” outside of Asia and Africa, including all of the Middle East and North Africa, Latin America, and Central and Eastern Europe. What is of primary interest is whether the effects of the explanatory variable depend on the regional dummy and, in particular, whether being an Asian country modifies those effects differently.
Research on aid allocations often has to deal with a highly uneven distribution of aid values across countries and years. Since many countries receive zero flows, data distribution of the dependent variable is highly skewed. Aid allocation can be highly uneven for an unsystematic reason. Alternatively, zero flows in aid may be the result of a non-random decision by a donor that is nevertheless not captured in the econometric model. Finally, the uneven data distribution may be the result of a systematic error in the data collection process. The censored nature of the data naturally leads to consideration of estimation techniques such as the Heckman selection model and Tobit model in the aid literature. Yet it is also known that these two techniques are not without limitations. A two-stage Heckman sample selection model is a useful technique to address selection bias because it allows the error terms to be corrected for the correlation between the selection and allocation models (Heckman, 1979). The Heckman model depends on the existence of a variable that fulfills the exclusion restriction, i.e. that affects the first stage of aid decision, but not the second stage. However, it is unrealistic that any of the variables affecting the receipt of aid are independent of the allocation decision. As a result, some of the previous studies on aid estimate the allocation equation without correcting for selection (Fleck and Kilby, 2010; Hoeffler and Outram, 2011). On the other hand, the high frequency of zeros in the data suggests that the data may be censored, leading to consideration of a Tobit estimator. However, the Tobit model relies heavily on the assumption that errors are not heteroscedastic or non-normal (Wooldridge, 2010), which could be quite problematic for cross-national aid research.
AidData’s Global Chinese Official Finance Dataset has an even more skewed distribution. This is because China is a relatively new, emerging donor with fewer observations than established ones and the used metric is aid commitment, which is usually more skewed than disbursement. Although the dataset has a panel structure, the presence of too many zeros, indicating no receipt of Chinese aid in a given year, presents more difficult challenges than the usual DAC aid dataset. Log-transformation creates more standardized distribution, but this drops quite a number of observations. In my sample, zero values on ODA account for about 60 percent of all country years. If log-transformed, the results only indicate the factors affecting the level of Chinese aid among recipients. For this reason, I keep the variable in a level form. Finally, for estimation models, Breusch-Pagan Lagrange multiplier test results suggest the presence of significant differences across units in the sample, and Hausman test results indicate that fixed effects models are inappropriate. Thus, I estimate random effects models with year dummies.
Results
Table 2 shows the panel estimation results for China’s ODA-like flows to developing countries. I focus my discussion on whether regional differences exist for economic and foreign policy considerations. After presenting the baseline model in Model 1, I introduce interaction terms with Asia and Africa per a variable of interest. The results in Model 2 suggest that Chinese exports to the recipient country, one of two major economic variables, have a stronger positive correlation with the amount of Chinese aid when the recipient is located in Asia. Substantively, a 1 percent increase in China’s exports to a country leads to a US$120,150 increase in aid when the country is Asia, as compared to “the rest” region. Countries with greater natural resource wealth do not receive more Chinese aid when the country is in Asia, as shown in Model 3.
Allocation of China’s ODA-like flows, random effects panel estimates, 2000−2014.
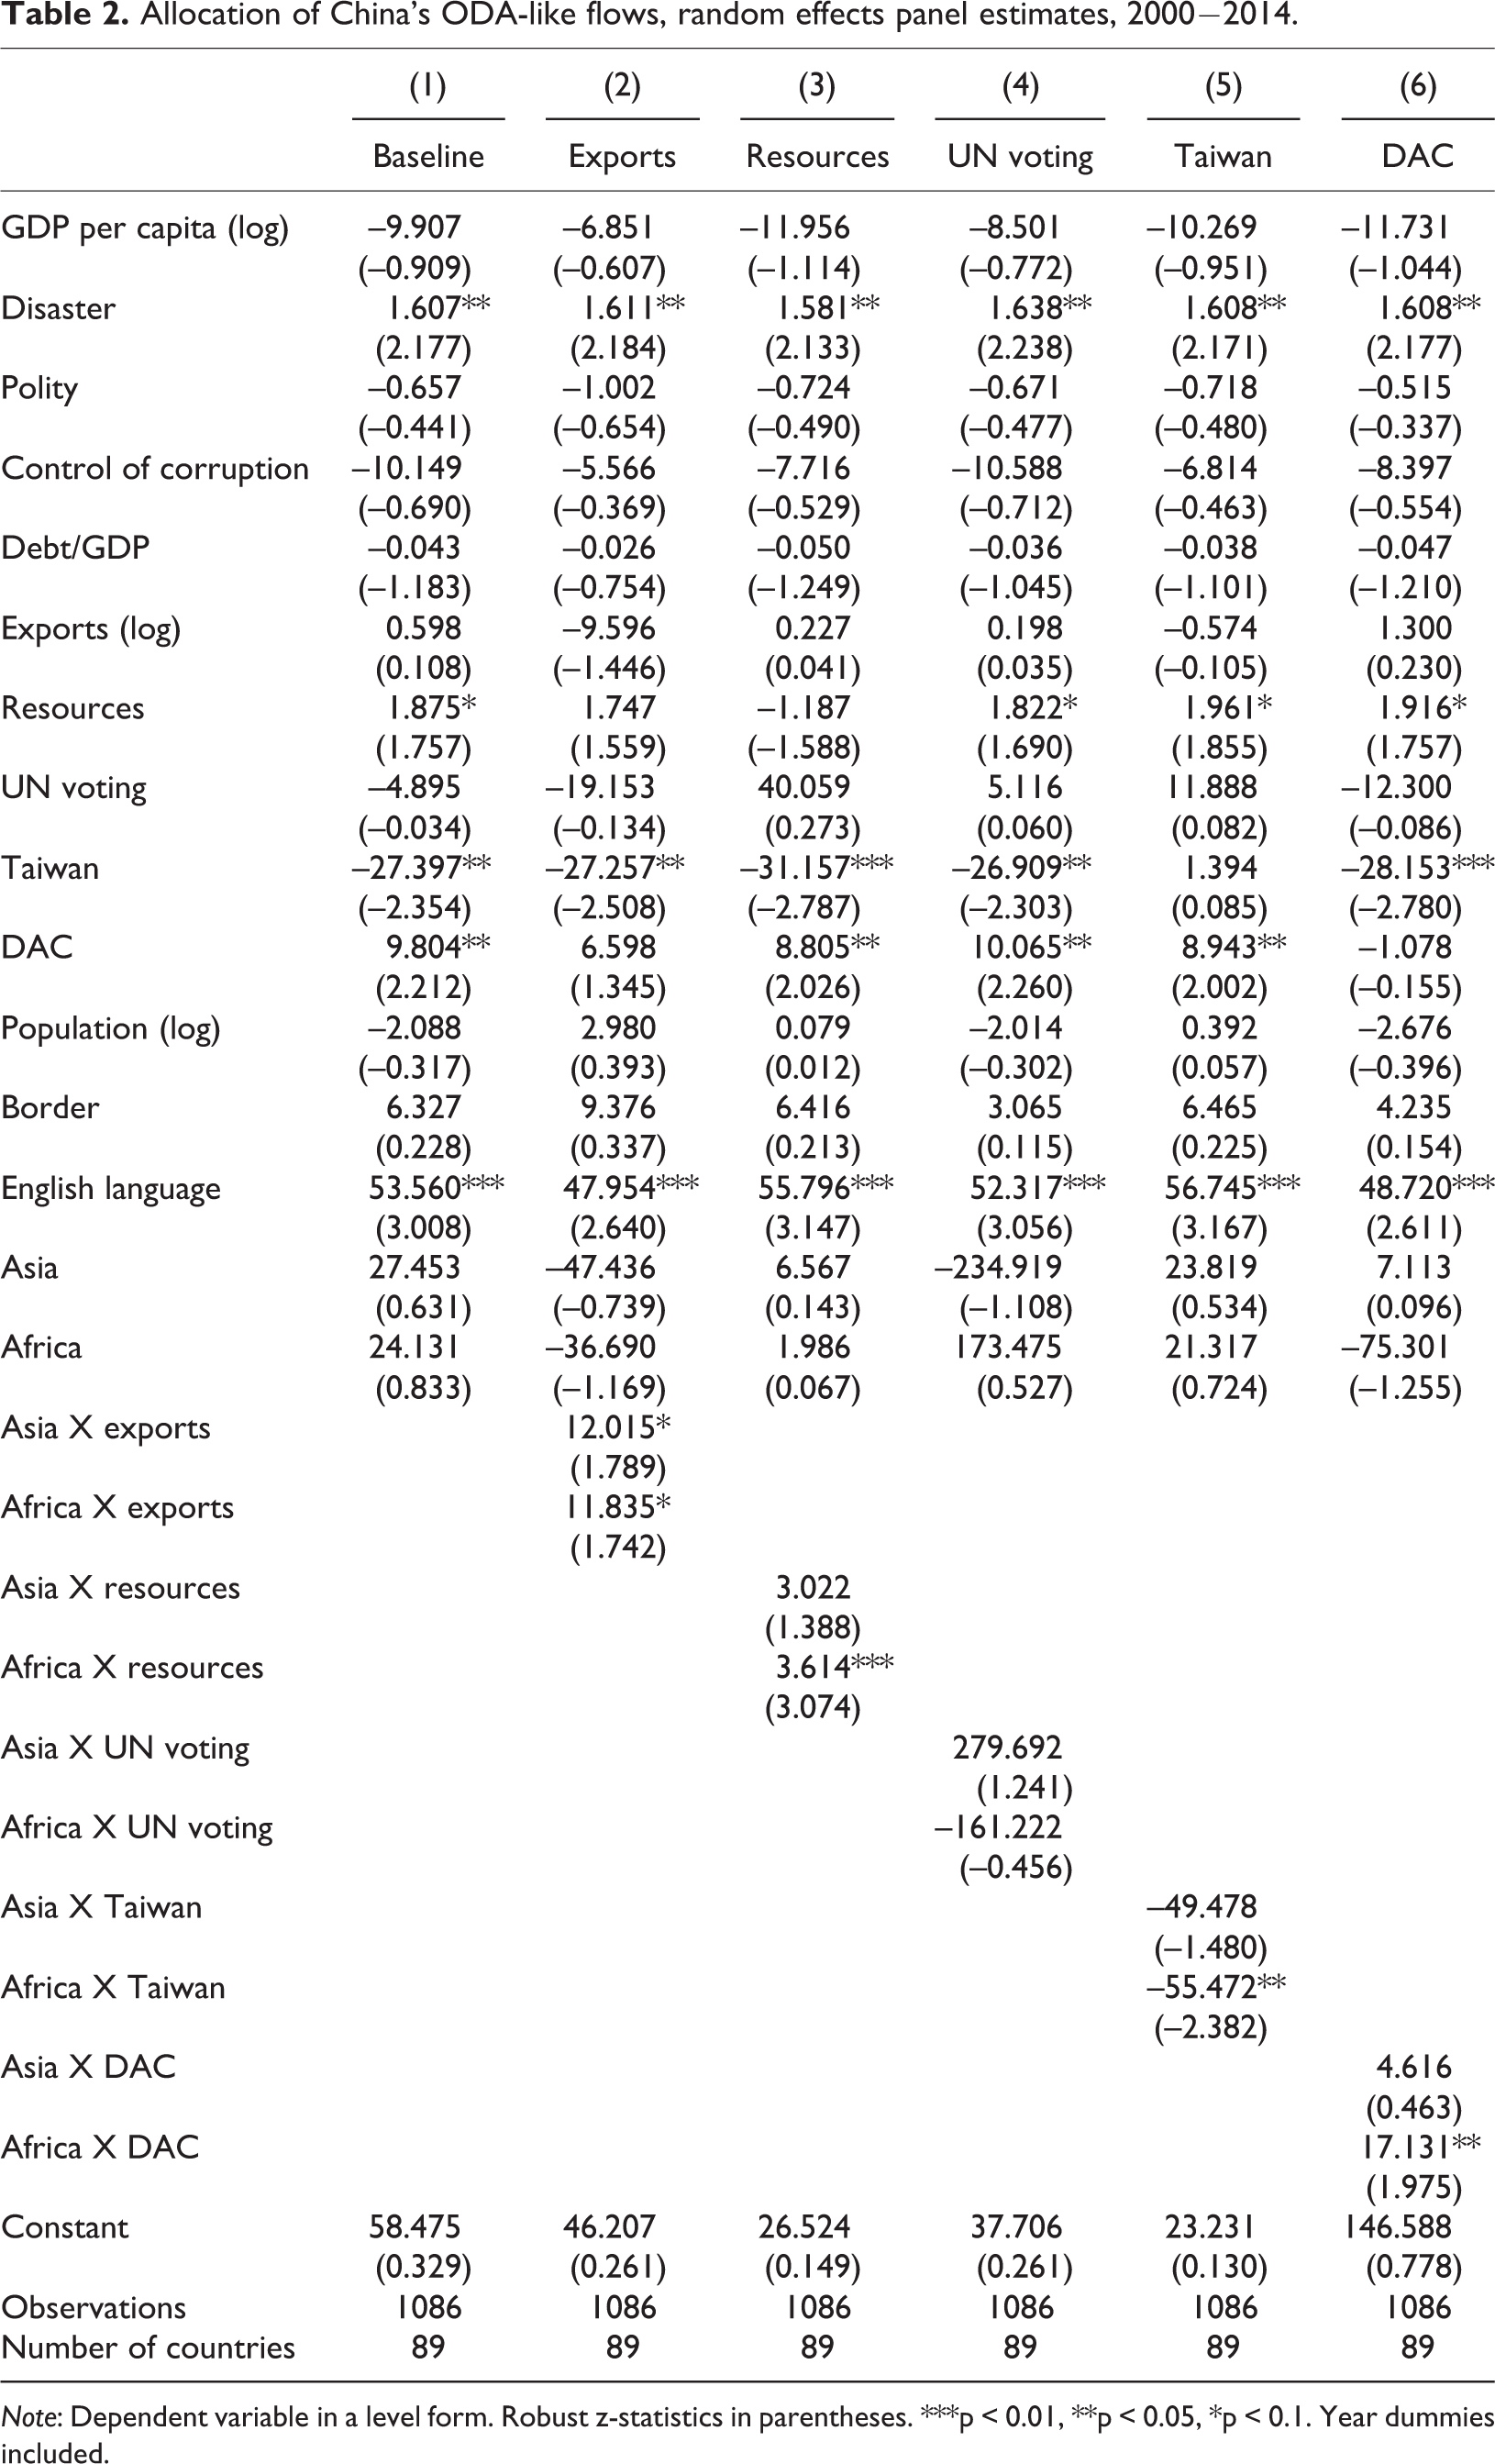
Note: Dependent variable in a level form. Robust z-statistics in parentheses. ***p < 0.01, **p < 0.05, *p < 0.1. Year dummies included.
Importantly, foreign policy considerations, including UN voting alignment, Taiwan recognition, and DAC aid competition are not significant and their effects are not dependent on the recipient country’s location in Asia or “the rest” region, as shown in Models 4–6. The location in Africa, on the other hand, appears to be significant on all interaction terms except UN voting alignment. In sum, China is likely to allocate more aid to countries with which it has stronger export relationships in Asia, while it gives more aid to African countries with stronger export relationships, greater resource wealth, and more DAC aid, and less aid to African countries with diplomatic ties to Taiwan.
For other explanatory variables, GDP per capita has no impact, but damages from natural disasters are positively associated with an increase in Chinese aid. Higher debt burdens, population size, and shared borders have no impact on Chinese aid allocation. Among other findings, the non-relationship between domestic institutions and aid allocation is actually consistent with China’s aid principles of “non-interference” and “no political conditionality,” which are based on the Five Principles of Peaceful Coexistence, a major pillar of China’s foreign policy dating from 1954. 6
All this may weigh against the conclusion that China strategically uses its aid to reward its allies or attract new friends in Asia. Nonetheless, while this note fails to find positive support for the role of foreign policy factors for Chinese aid, it is difficult to believe that they play no role. Instead, it is more reasonable to think that the three variables used in the current analysis, although widely used in the literature, may not be effective measures of foreign relations in the Asian context. In fact, UN voting alignment and Taiwan recognition may not vary significantly among countries in Asia. Asian countries may tend to vote in a similar fashion for historical and cultural reasons, limiting variability. It is also the case that only very few countries, mostly in the Pacific, maintain diplomatic relations with Taiwan. Finally, Asian countries heavily favored by DAC donors are likely to have legitimate development needs that also draw Chinese aid.
Therefore, research on Chinese aid in Asia may need foreign policy variables that are more fine-tuned to Asia but that are still in line with China’s global strategic interests. A country’s position regarding the South China Sea (SCS) territorial dispute may be a good place to start. The relationship between the SCS dispute and China’s aid allocation patterns in the region is a curious one. For instance, Cambodia is the largest recipient of Chinese aid, as mentioned in the preceding section, and at the same time has been a close ally of China in the SCS dispute. Cambodia consistently and forcefully supported China’s position in the ruling of the Permanent Court of Arbitration (PCA) in 2016, where the international court decided in favor of the Philippines in its dispute with China. Right after the PCA ruling, it even blocked the issuance of a joint statement at the Association of Southeast Asian Nations (ASEAN) Foreign Ministers Meeting, which supports the court’s decision. 7
Conclusion
Descriptive statistical analysis of China’s development aid using the best available data shows that Chinese aid to Asia remains highly limited compared to Japan or the US. Sector-wise, the economic sector, including energy, transport, and mining, receives the bulk of financing. The econometric analysis shows that Chinese aid to Asia is mainly associated with commercial interests, and not particularly with foreign policy interests. This is interesting when compared with the findings on Africa, which suggest that Chinese aid allocations there are robustly driven by strategic considerations.
What these results suggest is the need to develop a better way to capture the strategic interactions between China and its Asian neighbors in a quantitative setting. The results may be driven by the potentially limited variability in the conventional foreign policy variables among Asian countries, rather than the limited explanatory power of the foreign policy variables per se. This suggests that Asia may need foreign policy variables that better capture the regional dynamics unique to Asia while remaining in tune with China’s global strategic interests. This requires developing cross-national data of regional countries’ behaviors on the issues related to the rise of China in Asia, such as the South China Sea dispute.
Footnotes
Acknowledgements
The author wishes to thank the editor of the Asian Journal of Comparative Politics, the two anonymous reviewers, and Woo Hyun Chang for thoughtful insights and suggestions. The views expressed here do not reflect those of the Korea Institute for International Economic Policy. The usual caveats apply.
Declaration of conflicting interests
The author(s) declared no potential conflicts of interest with respect to the research, authorship, and/or publication of this article.
Funding
The author(s) received no financial support for the research, authorship, and/or publication of this article.