






Abstract
Assessing equivalence across survey data-collection modes requires methodological approaches that go beyond simple mean comparisons. Building on this need, the present study proposes a multidimensional framework for evaluating methodological equivalence, integrating quantitative, qualitative, and auxiliary indicators. Using a homogeneous sample of 424 undergraduate students with comparable digital literacy, data were collected via online and paper-and-pencil administrations of the Nomophobia Scale and the Oxford Happiness Scale. Quantitative equivalence was assessed using the two one-sided tests (TOST) procedure, allowing for direct evaluation of practical equivalence rather than difference testing. Qualitative equivalence focused on distributional characteristics and response patterns, while auxiliary equivalence was examined through response styles. Results show that conclusions about equivalence depend strongly on the dimension examined, underscoring the limitations of relying solely on mean-based comparisons. By demonstrating how different equivalence dimensions may converge or diverge, the study offers a transferable methodological template for evaluating survey mode effects in applied research, extending beyond the specific instruments and sample analyzed here.
Keywords
Introduction
The increasing integration of digital technologies into research practice has substantially transformed survey-based data collection. Online surveys have become widely adopted as an alternative to traditional paper-and-pencil (P&P) administration due to their advantages in cost efficiency, speed, and logistical convenience. As a result, online data collection is now common in educational, psychological, and social science research. Despite this widespread adoption, ongoing concerns remain regarding the comparability of data collected through online and P&P survey modes.
Research comparing different survey administration modes has a long history, with early studies focusing on mail, telephone, and face-to-face surveys. With the expansion of internet access, scholarly attention shifted toward comparisons between online and traditional survey methods, particularly P&P administration. However, findings from this literature remain inconsistent. While some studies report minimal differences between online and P&P surveys, others identify systematic variations in scale means, response patterns, or reliability estimates across modes. These mixed results suggest that conclusions about mode equivalence depend heavily on how equivalence is defined and evaluated.
A major limitation of prior research lies in its reliance on mean-based comparisons and null hypotheses significant test (NHST) to assess equivalence between survey modes. Non-significant mean differences are often interpreted as evidence of equivalence, despite the fact that such results do not demonstrate that observed differences are substantively negligible. Consequently, mean-focused analyses may provide an incomplete or potentially misleading assessment of survey mode equivalence.
Equivalence between survey modes is inherently multidimensional. Quantitative equivalence concerns similarity in central tendencies, whereas qualitative equivalence relates to the preservation of psychometric properties such as inter-item relationships, factor structure, and reliability. In addition, auxiliary equivalence addresses similarities in response behaviors and styles that may vary across administration modes and influence substantive conclusions. Limiting analyses to a single dimension of equivalence may therefore obscure meaningful method effects.
Recent shifts toward online data collection, particularly in contexts where established P&P instruments are transferred to digital formats, further highlight the importance of evaluating equivalence comprehensively. Assessing whether online surveys reproduce comparable quantitative outcomes, psychometric structures, and response behaviors is essential for ensuring the validity of inferences drawn from digitally collected data.
Against this background, the present study examines the equivalence of online and P&P survey administration across quantitative, qualitative, and auxiliary dimensions. Using a homogeneous undergraduate sample with comparable levels of internet access and digital literacy, the study applies formal equivalence testing and response style analysis to evaluate whether online and P&P data can be considered methodologically comparable.
Literature review
Online data collection methods encompass a variety of formats, including self-selected participation, voluntary opt-in panels, list-based sampling, and intercept-based approaches (Couper, 2000). Despite these methodological variations, respondents’ perceptions of online surveys tend to be relatively similar across digital formats, while differing in important ways from traditional P&P surveys. Factors such as perceived anonymity, ease of access, and the absence of physical presence distinguish online survey contexts and may influence respondent engagement and response behavior (Tuten, 2010; Van Selm and Jankowski, 2006).
The expansion of online data collection has also increased the accessibility and inclusiveness of social research, enabling participation from geographically dispersed populations and reducing logistical barriers (Frippiat and Marquis, 2010). This shift was further accelerated during the COVID-19 pandemic, when online surveys became not only a preferred option but, in many cases, a methodological necessity (Dow-Fleisner et al., 2022). As a result, established P&P instruments have increasingly been transferred to digital formats, often without comprehensive evaluation of equivalence across administration modes.
Alongside this rapid adoption, a substantial body of research has examined the comparability of online and P&P survey methods. As summarized in Table 1, empirical findings spanning more than two decades reveal no uniform conclusion regarding equivalence. Early studies frequently reported psychometric similarity across modes, including comparable factor structures, reliability coefficients, and inter-item relationships (e.g., Davis, 1999; Meyerson and Tryon, 2003; Stanton, 1998). Subsequent large-scale and cross-national investigations likewise documented equivalence under certain conditions (e.g., Beuckelaer and Lievens, 2009; Van de Looij-Jansen and de Wilde, 2008), supporting the interchangeability of online and P&P surveys in specific contexts.
Research on equivalency between online and P&P methods (1998–2024).
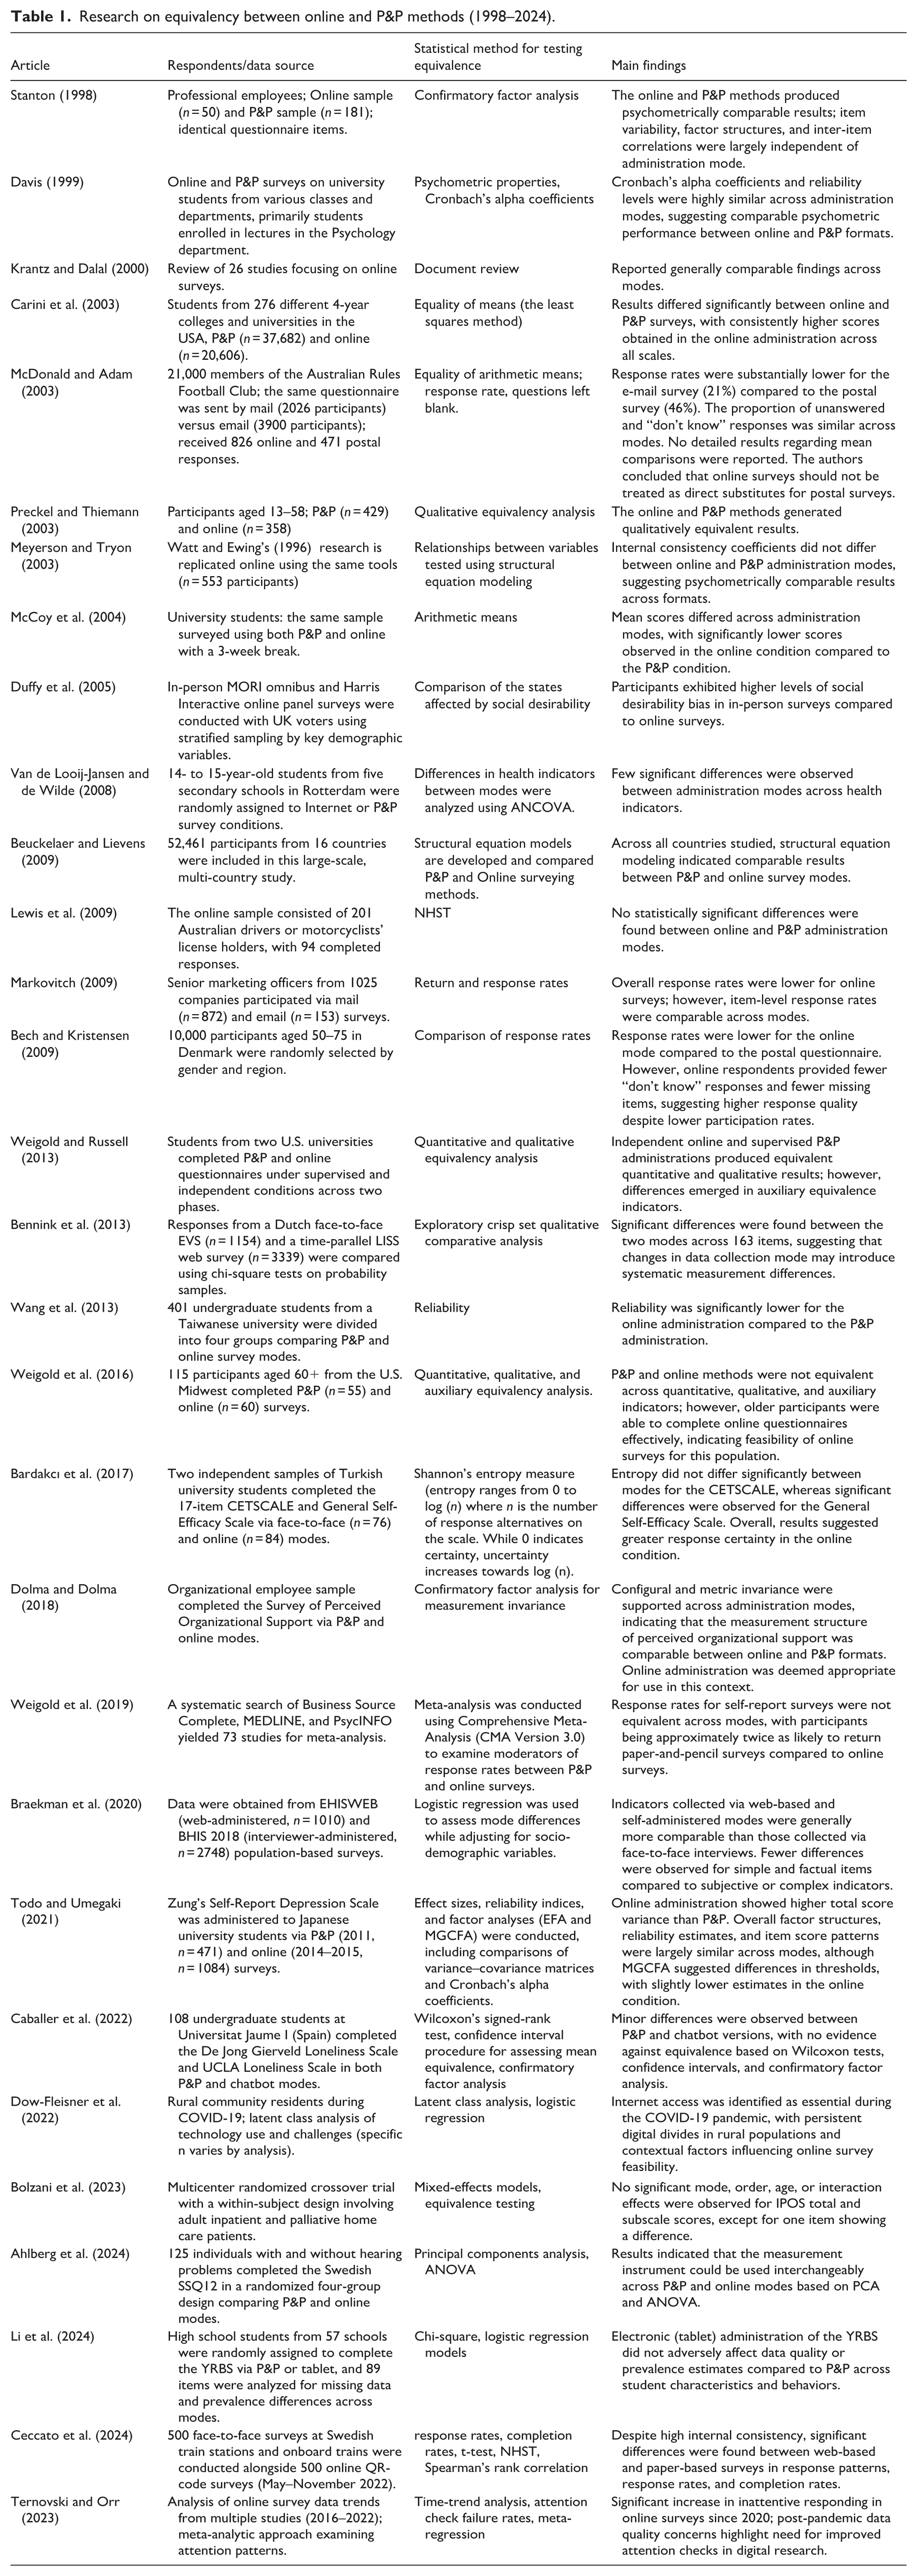
At the same time, a considerable number of studies identified systematic mode-related differences. These differences include disparities in mean scores (Carini et al., 2003; McCoy et al., 2004), response and completion rates (Bech and Kristensen, 2009; McDonald and Adam, 2003; Weigold et al., 2019), response styles and auxiliary indicators (Weigold et al., 2016; Weigold and Russell, 2013), and variance or threshold parameters (Todo and Umegaki, 2021). More recent work continues to document both equivalence and non-equivalence across domains such as health, criminology, and education (Bolzani et al., 2023; Ceccato et al., 2024; Li et al., 2024), suggesting that mode effects remain context-dependent rather than resolved.
A closer examination of Table 1 further indicates that inconsistencies in prior findings are closely linked to methodological choices. Many studies rely primarily on mean comparisons or NHST, while others focus on psychometric structure, response rates, or auxiliary indicators such as item nonresponse and response styles. As a result, equivalence is often assessed along a single dimension, limiting the ability to draw comprehensive conclusions about overall comparability between online and P&P survey modes.
Taken together, the literature demonstrates that equivalence between online and P&P surveys cannot be assumed nor evaluated adequately through mean comparisons alone. Instead, prior research points to the need for a more integrative approach that simultaneously considers quantitative outcomes, qualitative psychometric properties, and auxiliary response behaviors. Building on this body of work, the present study adopts a multidimensional framework to examine equivalence across these three domains within a homogeneous, digitally literate undergraduate sample.
Equivalence of methods
The methodological literature points to a persistent conceptual gap in the operationalization and interpretation of equivalence of methods (Lewis et al., 2009). Weigold and Russell (2013), together with Weigold et al. (2016), note that relatively few studies have systematically addressed the multidimensional nature of equivalence in survey mode comparisons. They argue that equivalence should be evaluated across three distinct but interrelated dimensions: quantitative, qualitative, and auxiliary equivalence.
Quantitative equivalence
Quantitative equivalence has traditionally been assessed using NHST, most commonly through item-by-item comparisons of group means. However, a substantial body of methodological research has criticized the use of NHST for equivalence testing, emphasizing that it imposes overly restrictive criteria that are designed to detect differences rather than to establish equivalence (Cribbie and Arpin-Cribbie, 2009; Preckel and Thiemann, 2003; Rogers et al., 1993; Tryon, 2001; Weigold and Russell, 2013). The core limitation of NHST lies in its logic: failing to reject the null hypothesis in NHST cannot be interpreted as evidence of equivalence (Lewis et al., 2009; Rusticus and Lovato, 2011).
A more appropriate approach for assessing quantitative equivalence is the Two One-Sided Tests (TOST) procedure (Rogers et al., 1993). Rather than testing for the absence of differences, TOST evaluates whether the observed difference between two group means falls within a predefined equivalence interval (Figure 1). This interval is typically defined as a proportion of the reference group’s mean, with a ±20% range commonly used as a conventional threshold in the social sciences (Rusticus and Lovato, 2011).
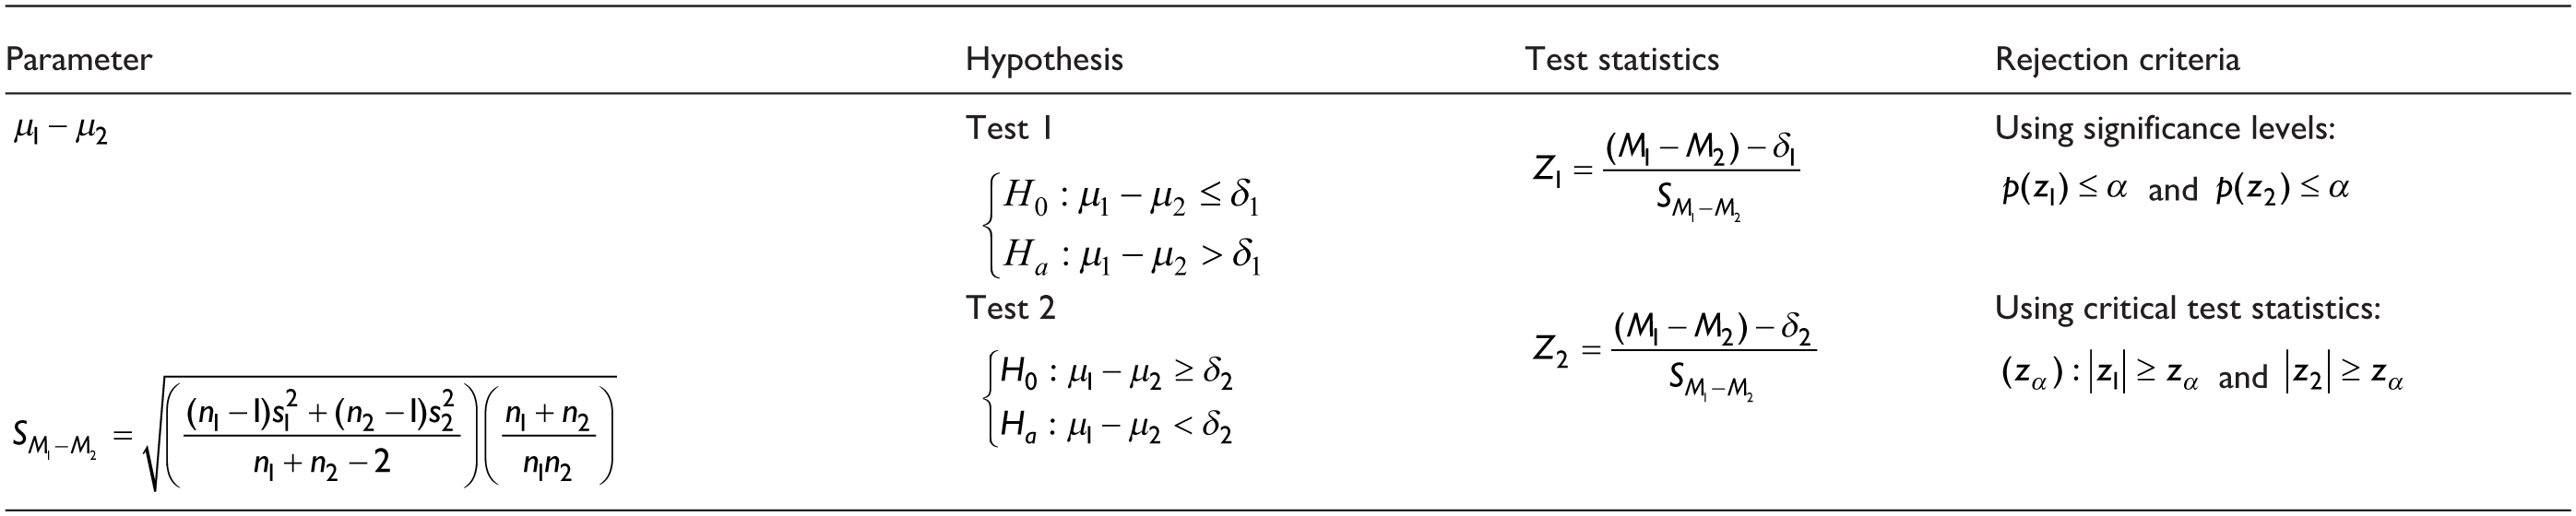
Formulas for equivalency testing.
Importantly, equivalence bounds should be defined a priori and grounded in empirical data rather than theoretical or standardized benchmarks (Rusticus and Lovato, 2011; Weigold and Russell, 2013). In the present study, equivalence bounds were defined a priori as ±20% of the P&P group mean for each construct, ensuring comparability across administration modes.
Statistical equivalence is established when both one-sided tests in the TOST procedure are statistically significant, indicating rejection of both null hypotheses. This corresponds to concluding that the true population difference (μ1 − μ2) lies entirely within the predefined equivalence interval (Rogers et al., 1993).
When combined with traditional NHST, the TOST framework yields four possible inferential outcomes: (1) statistically different and not equivalent, (2) not statistically different but statistically equivalent, (3) statistically different yet still within the predefined equivalence bounds (i.e., practically equivalent), and (4) inconclusive evidence for both difference and equivalence. These outcomes demonstrate that statistical significance and statistical equivalence represent distinct but complementary inferential conclusions (Lakens et al., 2018; Rogers et al., 1993).
Qualitative equivalency
Qualitative equivalence refers to the extent to which different measurement methods capture the same underlying theoretical construct. As noted by Honaker (1988), establishing qualitative equivalence requires demonstrating that the psychometric properties derived from each method are comparable. In this context, Meyerson and Tryon (2003) suggest that comparisons of internal consistency coefficients and inter-item correlations provide relatively straightforward initial approaches for evaluating this dimension of equivalence.
Relying on a single analytical criterion, however—whether factor structure, reliability coefficients, or structural equation modeling—may result in an incomplete assessment of qualitative equivalence. Ghiselli (1964), further elaborated in later work with colleagues (Ghiselli et al., 1981), argues that qualitative equivalence rests on three fundamental conditions: equality of arithmetic means, equality of variances, and similarity in correlational relationships among variables. Among these conditions, the preservation of correlational structure—specifically, the equality of correlations between corresponding items—is considered particularly central to establishing qualitative equivalence.
Subsequent methodological discussions have reinforced this perspective by emphasizing that qualitative equivalence should be evaluated through multiple complementary analyses rather than a single statistical test. Assessing internal consistency, correlational patterns, and factorial structure in combination provides a more robust basis for determining whether different data collection methods yield psychometrically comparable measurements of the same construct.
Auxiliary equivalency
Auxiliary equivalence refers to similarities in supplementary parameters that, while not directly related to core measurement properties, nevertheless influence data quality and respondent engagement. These parameters include response rates, completion times, ease of response, and patterns of missing data (Weigold and Russell, 2013). Building on this conceptualization, auxiliary equivalence can be extended to incorporate response styles—systematic tendencies in how respondents use rating scales—which provide important insights into the cognitive and behavioral processes underlying survey responses.
Response styles reflect consistent patterns of answer selection that are largely independent of item content and instead capture how respondents interact with measurement instruments across different administration modes. Incorporating response styles into assessments of auxiliary equivalence therefore allows for a more nuanced evaluation of method effects on response behavior beyond traditional psychometric indicators.
Baumgartner and Steenkamp (2001) identify several fundamental response styles that have been widely examined in the literature, including acquiescence response style (ARS), disacquiescence response style (DARS), net acquiescence response style (NARS), extreme response style (ERS), response range (RR), and midpoint responding (MR). Each of these styles captures a distinct aspect of systematic response behavior that may vary across data collection methods.
Subsequently, Weathers and Bardakcı (2015) introduced the Absolute Difference Between Responses to Consecutive Items (ADD) as an additional indicator of within-person response variability, further refining the classification of response patterns. Together, these response style measures provide a comprehensive framework for evaluating auxiliary equivalence.
Incorporating response styles into auxiliary equivalence assessments enables a more comprehensive examination of how data collection methods influence respondent behavior. By assessing whether response style patterns differ between online and P&P administrations, researchers can identify potential method-induced biases that may not be detectable through quantitative or qualitative equivalence testing alone. This expanded conceptualization of auxiliary equivalence contributes to a more thorough evaluation of measurement comparability across survey modes.
Method
Participants and procedure
Data 1 were collected from 424 undergraduate students enrolled at the Ereğli Faculty of Education during the 2019–2020 academic year. Of these participants, 150 completed the survey online via Google Forms, and 274 completed the P&P version. Data collection took place during the COVID-19 pandemic period. Survey mode was determined by participants’ accessibility and physical presence. Students who were not on campus were invited to complete the online questionnaire, whereas those who were present on campus were asked to complete the P&P version. Accordingly, assignment to administration mode was not randomized but reflected contextual and logistical constraints during the pandemic period.
The sample is considered homogeneous in terms of academic background and familiarity with both digital and traditional survey formats. Such homogeneity is particularly relevant for equivalence testing, as it reduces the influence of extraneous factors that could confound administration mode effects.
Data collection employed a combined questionnaire consisting of two established instruments: the Nomophobia Questionnaire and the Oxford Happiness Scale–Short Form (see Appendix).
The Nomophobia Questionnaire (Yıldırım et al., 2016) measures nomophobia, defined as anxiety or discomfort experienced when individuals are unable to access or use their mobile phones. The scale consists of 20 items rated on a 7-point Likert scale (1 = strongly disagree, 7 = strongly agree) and includes four dimensions: not being able to communicate, losing connectedness, not being able to access information, and giving up convenience. The original validation reported high internal consistency (α = 0.92; subscales ranging from 0.74 to 0.94).
The Oxford Happiness Scale–Short Form (Hills and Argyle, 2002; Turkish adaptation: Doğan and Çötok, 2011) assesses subjective well-being as a single-factor construct. It consists of 7 items measuring overall happiness and life satisfaction. Although the Turkish adaptation was originally validated using a 5-point scale, a 7-point Likert format was used in the present study to ensure consistency across instruments. The reliability coefficient of the Turkish version is reported as α = 0.74.
Both instruments were administered in full to all participants. The combined questionnaire was presented with identical item order, formatting, and scale orientation across administration modes, with the only difference being the mode of delivery (online vs P&P). Thus, response option direction (from “strongly disagree” to “strongly agree”) was fully preserved across both formats.
Analytical approach
Analyses were conducted in accordance with the three dimensions of equivalence outlined in the theoretical framework. Quantitative equivalence was assessed using the TOST procedure, with equivalence bounds defined as ±20% of the P&P group mean (Rogers et al., 1993; Rusticus and Lovato, 2011). Qualitative equivalence was evaluated through a combination of analyses, including comparisons of Pearson product–moment correlation matrices, exploratory and confirmatory factor analyses, and tests of internal consistency coefficients (Cronbach’s alpha) across administration modes. Auxiliary equivalence was examined by comparing response style indicators between groups, including acquiescence, disacquiescence, net acquiescence, extreme response style, midpoint responding, and within-person response variability as captured by the absolute difference between consecutive item responses (ADD; Weathers and Bardakcı, 2015). Response style indices were calculated following the procedures outlined by Baumgartner and Steenkamp (2001), and equivalence was assessed using both NHST and TOST procedures where appropriate.
Findings
Quantitative equivalency
The item-level results reported in Table 2 were interpreted in light of the combined NHST and TOST framework, which allows four possible inferential outcomes: statistical equivalence, statistical difference, mixed evidence, and inconclusive results. Overall, the majority of items demonstrated convergence between NHST and TOST results, indicating strong quantitative comparability between online and paper-and-pencil (P&P) administration modes.
NHST and TOST results.
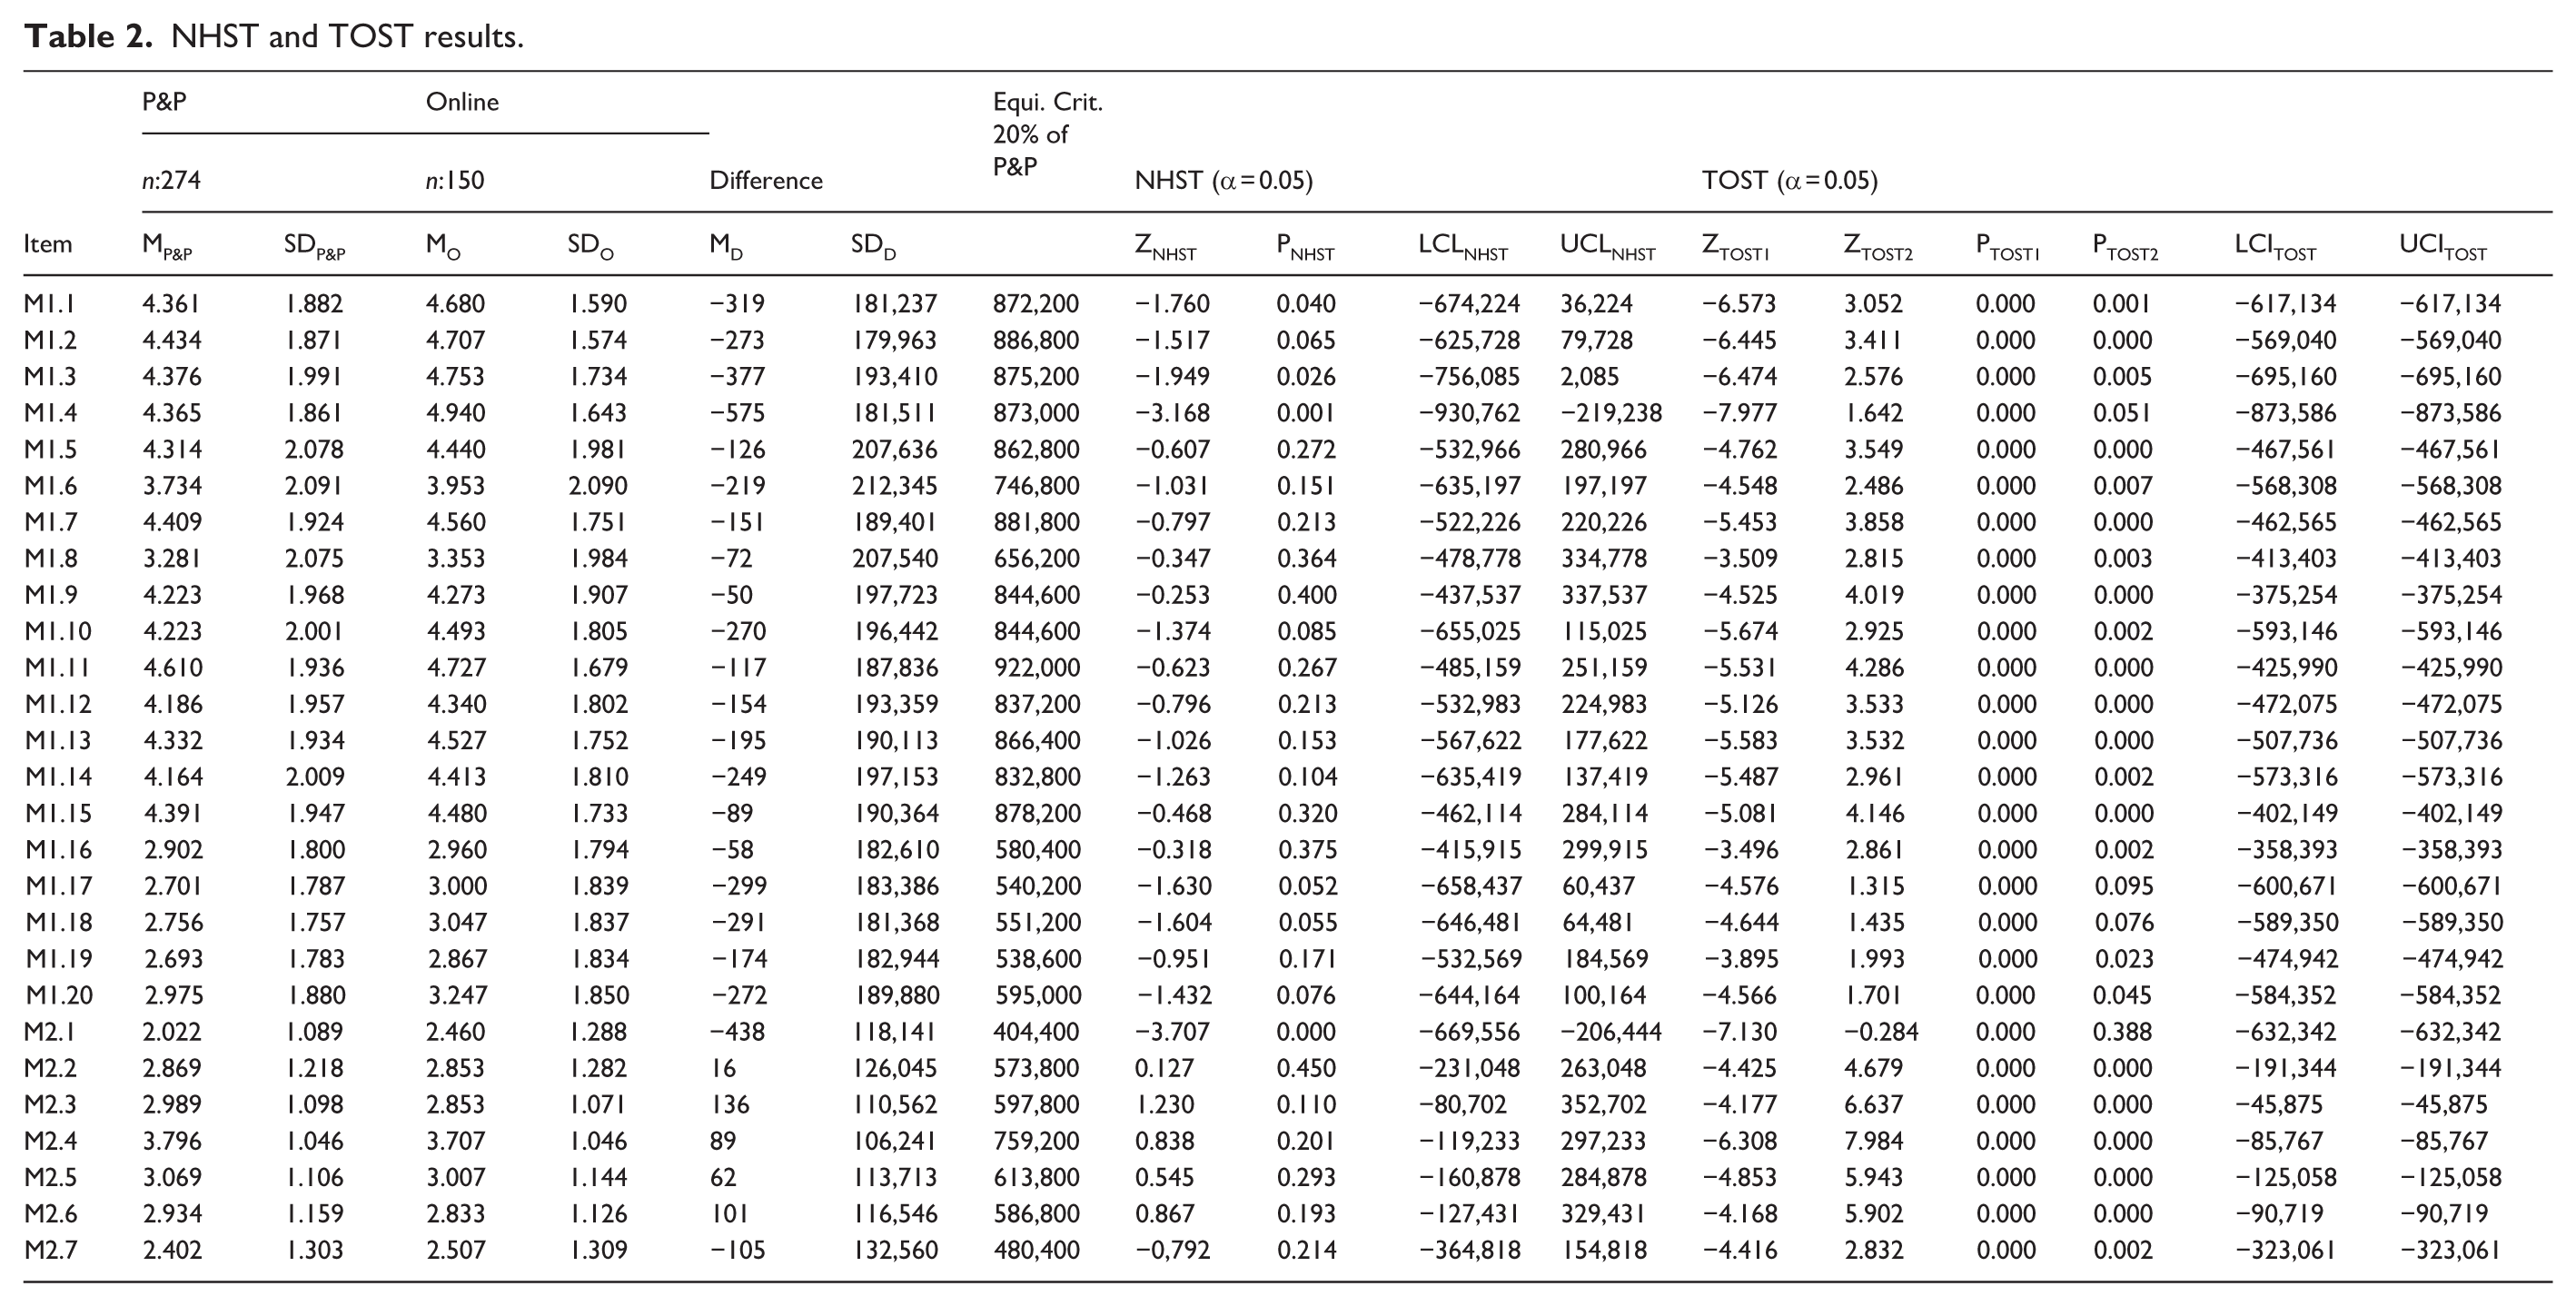
Specifically, a large proportion of items fell into the first outcome category, in which NHST failed to detect statistically significant mean differences while the TOST procedure confirmed that the observed differences remained within the predefined equivalence bounds (±20% of the P&P mean). This pattern indicates robust statistical equivalence and supports the conclusion that item-level responses are largely stable across administration modes.
A smaller subset of items (M1.3, M1.4, M1.17, M1.18, and M2.1) exceeded the equivalence thresholds, indicating non-equivalence under the TOST framework. Among these, M1.4 and M2.1 also produced statistically significant differences under NHST, representing clear mode effects that are both statistically and practically meaningful. In contrast, M1.17 and M1.18 did not yield statistically significant differences under NHST, yet still failed to meet equivalence criteria, reflecting ambiguous or unstable measurement behavior that does not clearly align with either inferential framework.
Importantly, no items fell into a pattern of statistically significant differences while simultaneously satisfying equivalence bounds, suggesting that observed significant effects were not merely trivial deviations within the equivalence interval. Conversely, several items showed non-significant NHST results but also failed TOST equivalence, highlighting the known limitation of NHST in distinguishing between “absence of evidence” and “evidence of equivalence.”
When both inferential approaches are integrated, the results indicate that most scale items demonstrate strong quantitative equivalence across administration modes, with only a limited number of items showing robust mode sensitivity. Overall, these findings support the general comparability of online and P&P administration while also identifying specific items that may be sensitive to administration mode effects.
Qualitative equivalency
Qualitative equivalence was evaluated using a multi-method approach that examined inter-item correlation patterns, factor structures, and reliability indices across online and P&P administrations.
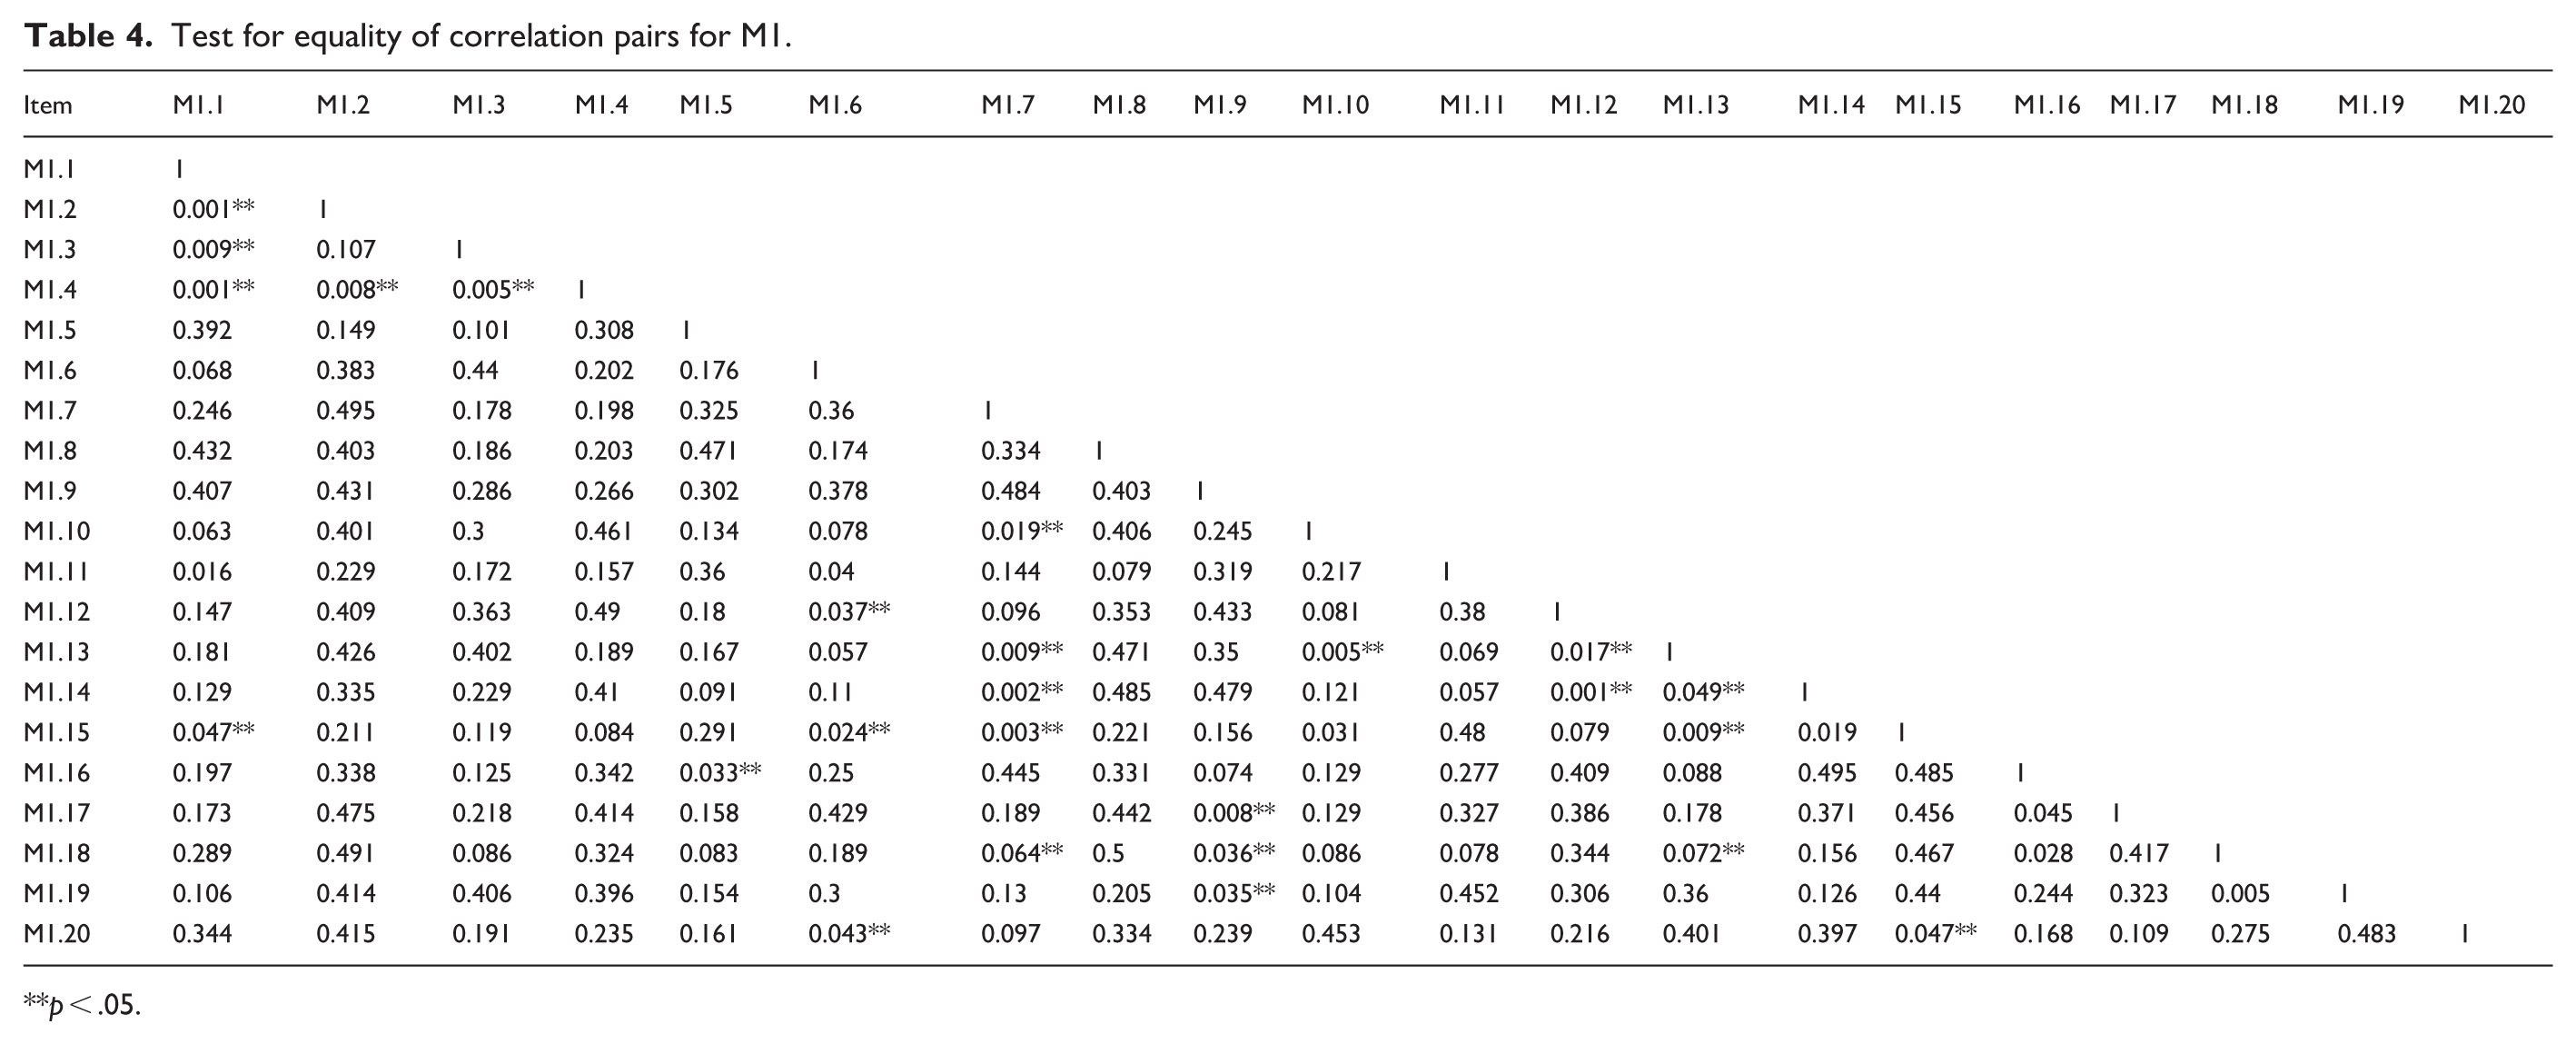
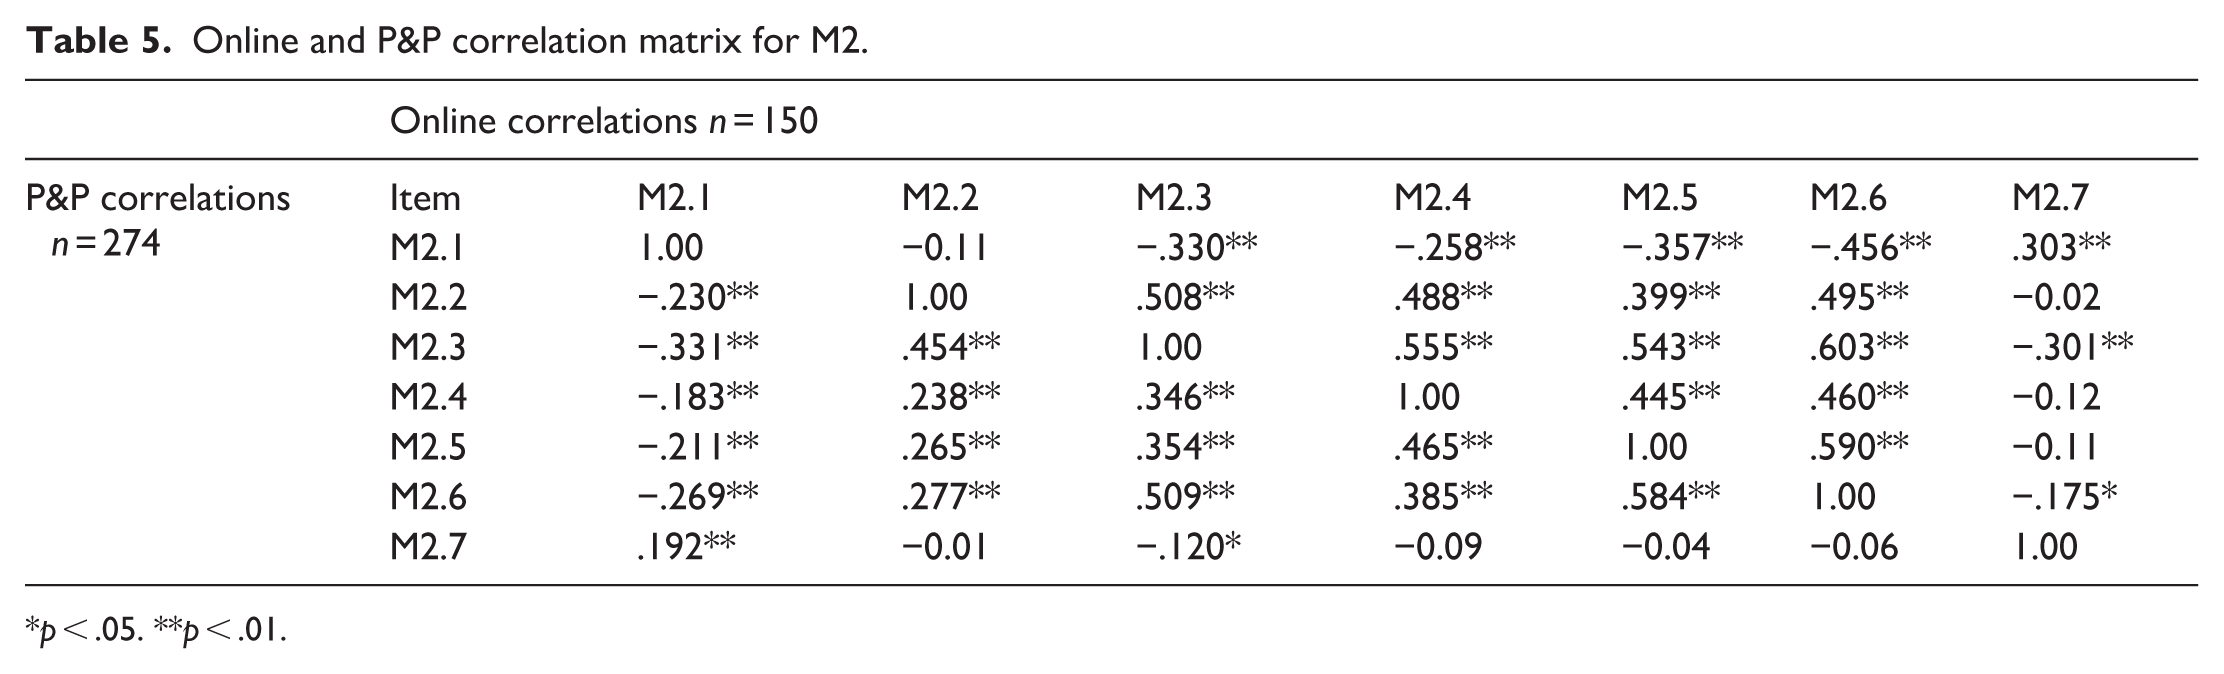
Inter-item correlation matrices were calculated separately for each administration mode. Table 3 presents the correlation matrix for the Nomophobia Scale (M1), with online correlations displayed above the diagonal and P&P correlations below the diagonal, while Table 5 provides the corresponding matrix for the Oxford Happiness Scale (M2). To statistically assess the similarity of correlation structures, tests for equality of correlation pairs were conducted using the procedure developed by Lenhard and Lenhard (2014), in line with established recommendations (Eid et al., 2010).
Online and P&P correlation matrix for M1.
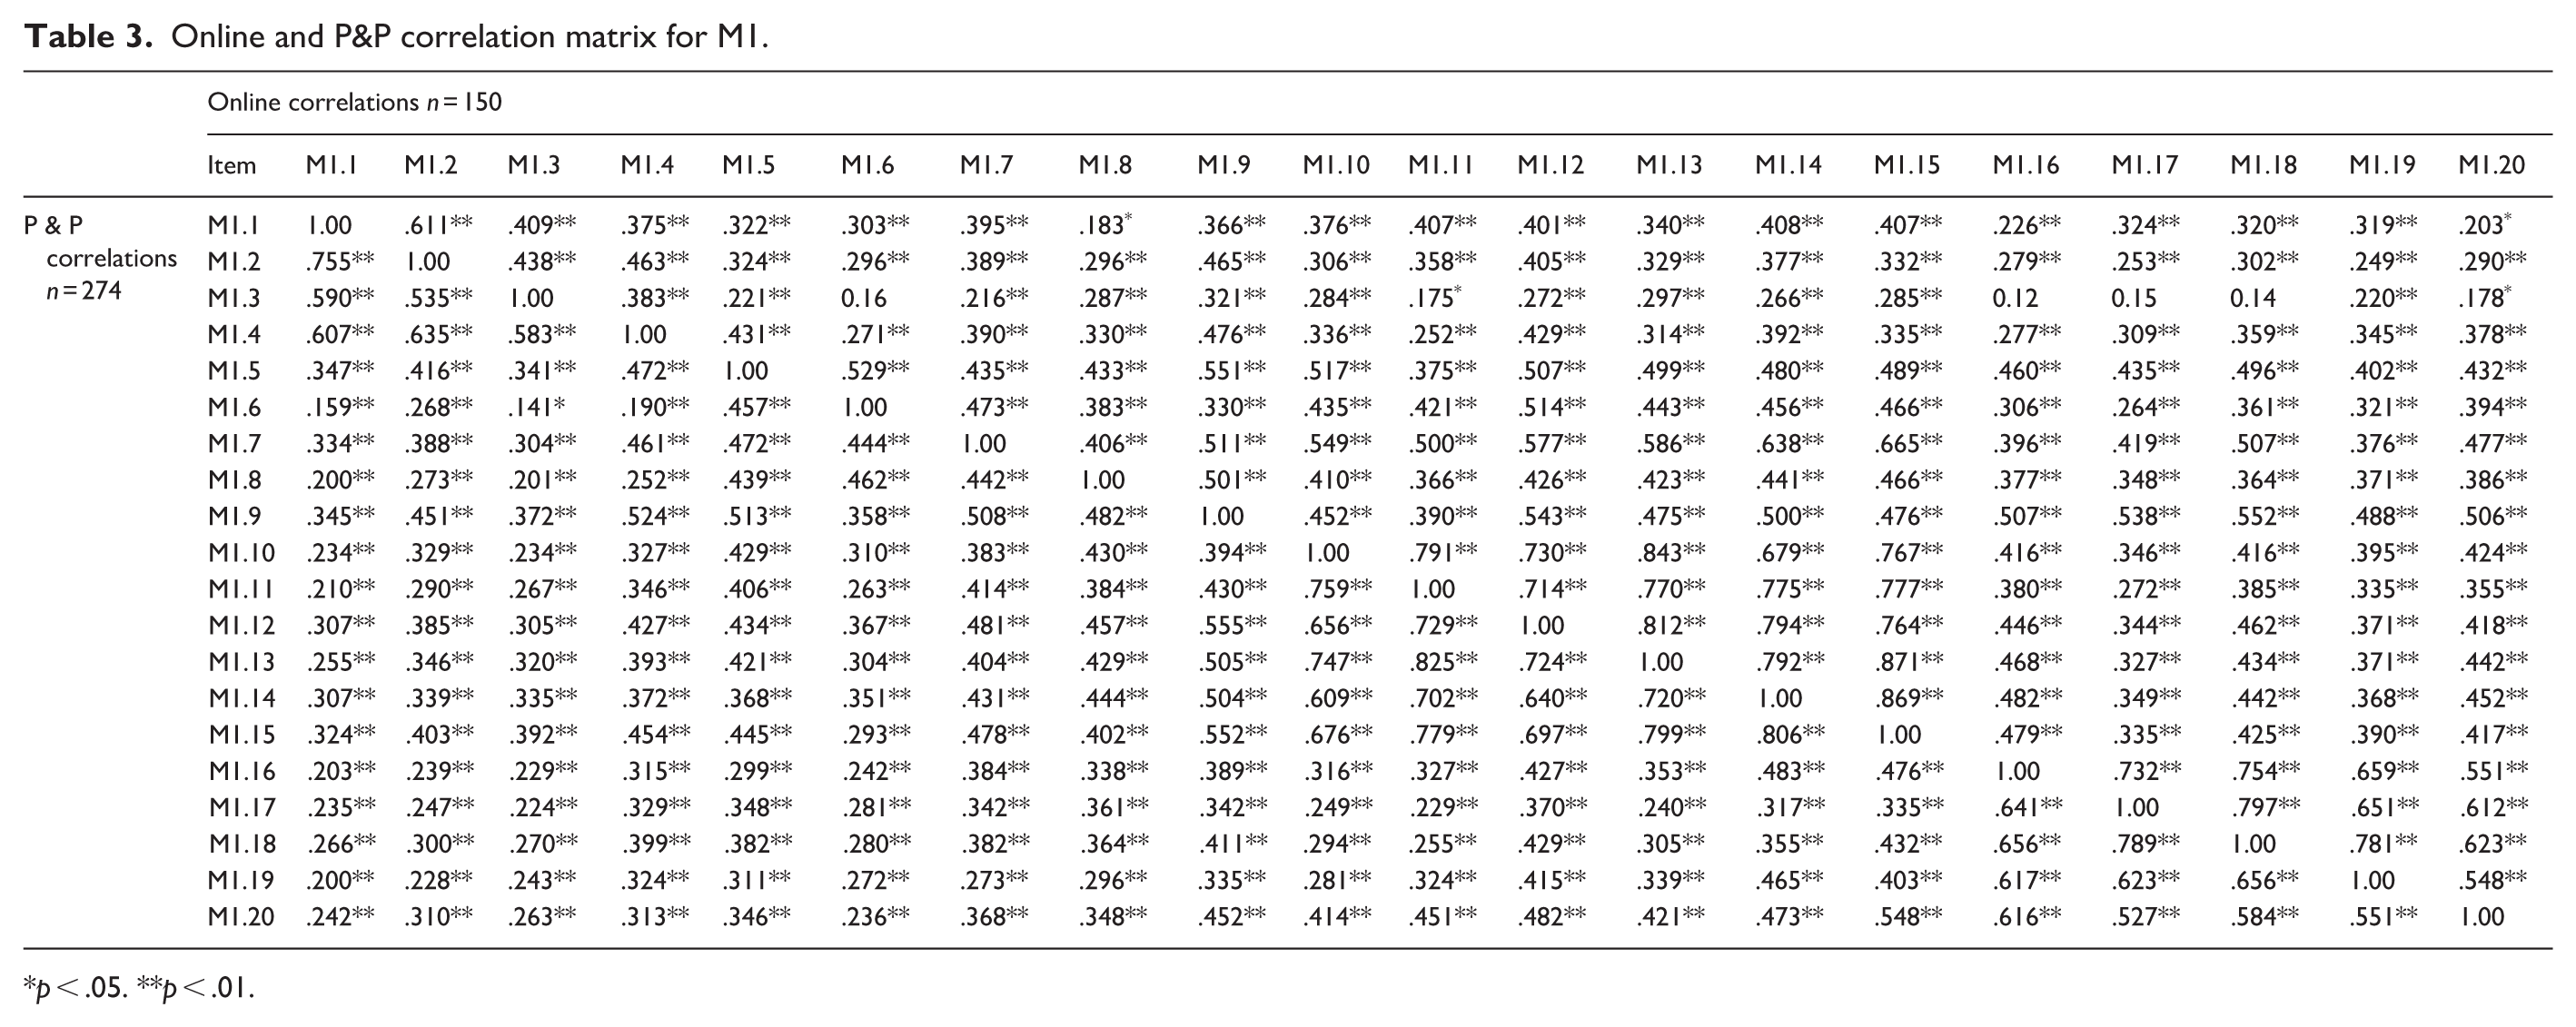
p < .05. **p < .01.
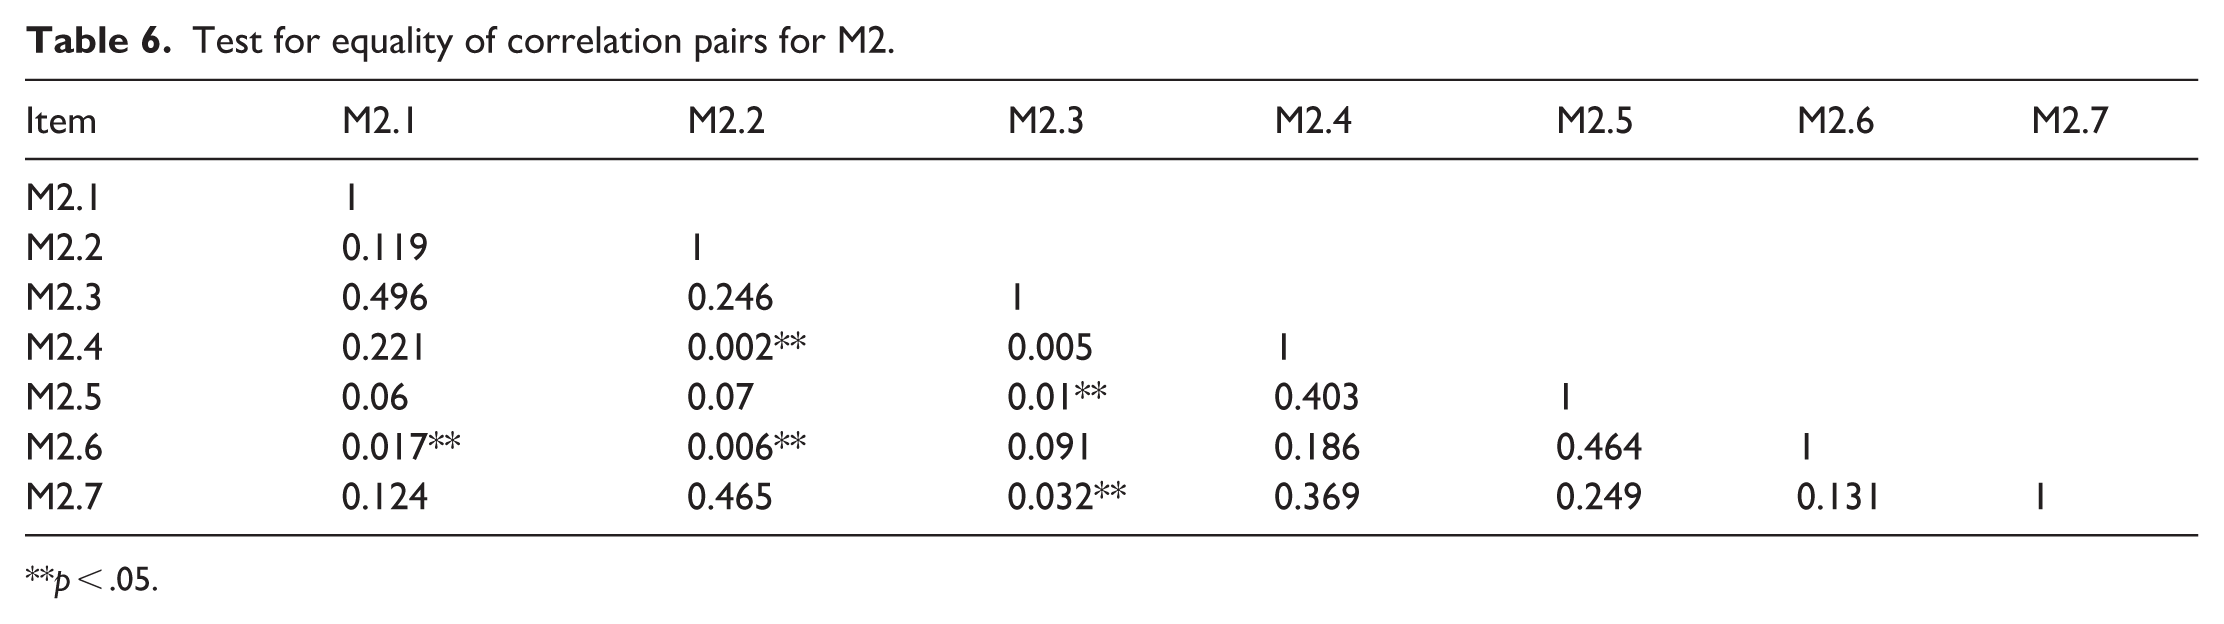
For M1, results reported in Tables 4 and 5 indicate that only 25 of 190 possible correlation pairs (13.16%) differed significantly at the α = 0.01 level. For M2, Table 6 shows that 4 of 21 correlation pairs (19.05%) differed significantly at α = 0.01, with one additional pair (4.76%) reaching significance at α = 0.05. Across both scales, only 29 of 211 total correlation pairs (13.74%) exhibited statistically significant differences at the 0.01 level, providing strong evidence for correlational equivalence between online and P&P administrations.
Test for equality of correlation pairs for M1.
p < .05.
Online and P&P correlation matrix for M2.
p < .05. **p < .01.
Test for equality of correlation pairs for M2.
p < .05.
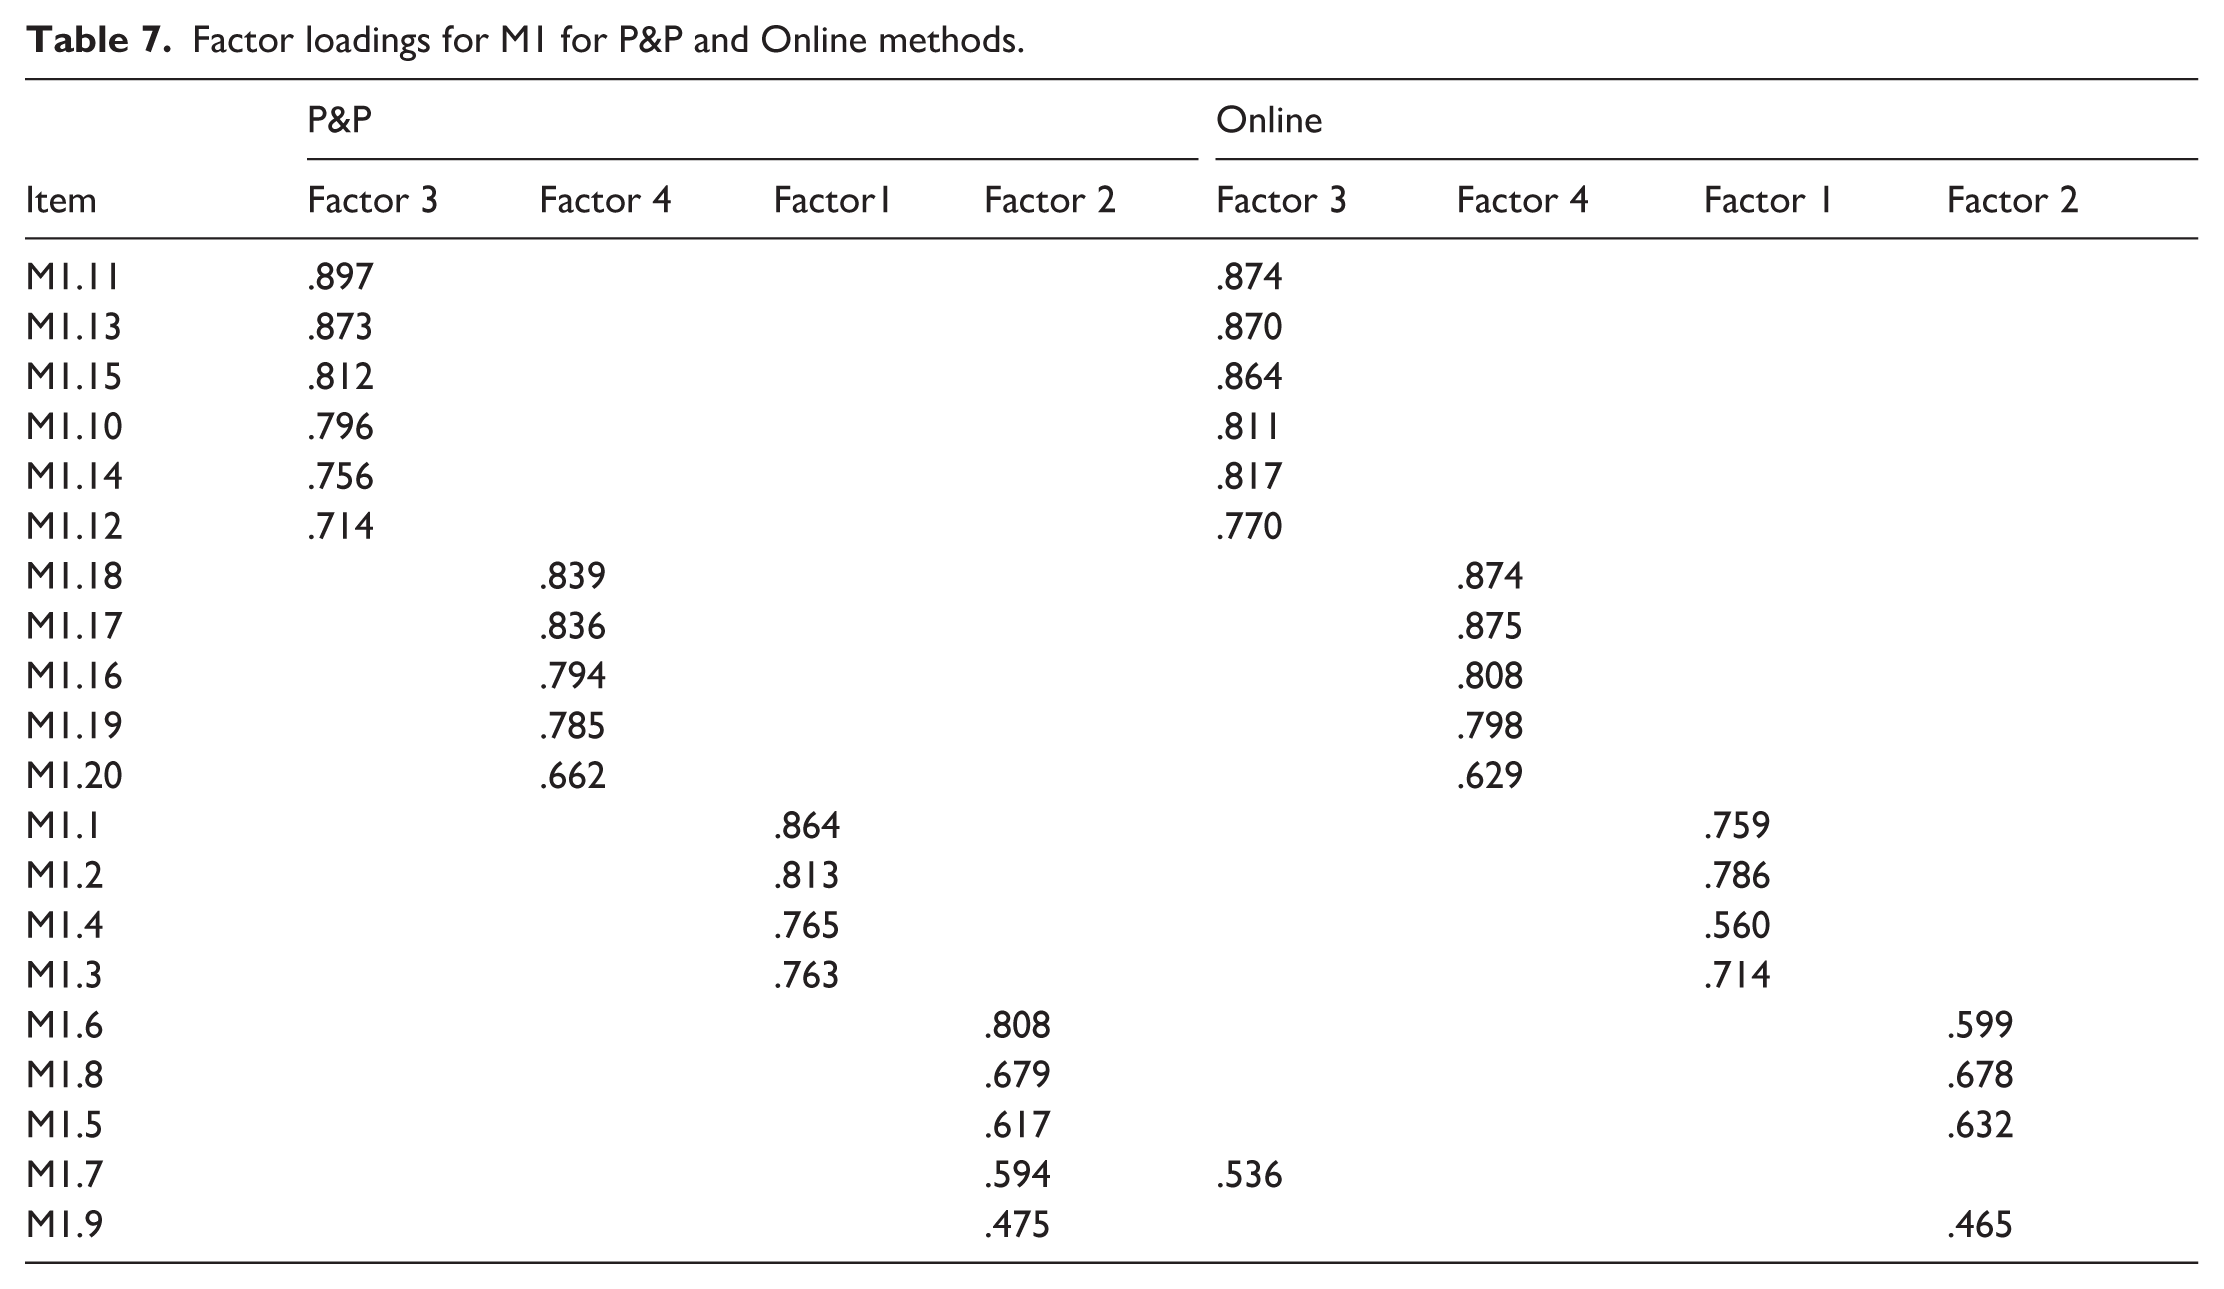
Factorial equivalence was further examined through exploratory and confirmatory factor analyses. Exploratory factor analysis using principal components extraction with Varimax rotation was conducted separately for each administration mode. For M1, both online and P&P administrations produced identical four-factor solutions with highly comparable factor loadings, as shown in Table 7. The total variance explained was approximately 70% in both conditions, indicating similar explanatory power. The only notable deviation concerned item M1.7, which exhibited differential factor loadings across modes.
Factor loadings for M1 for P&P and Online methods.
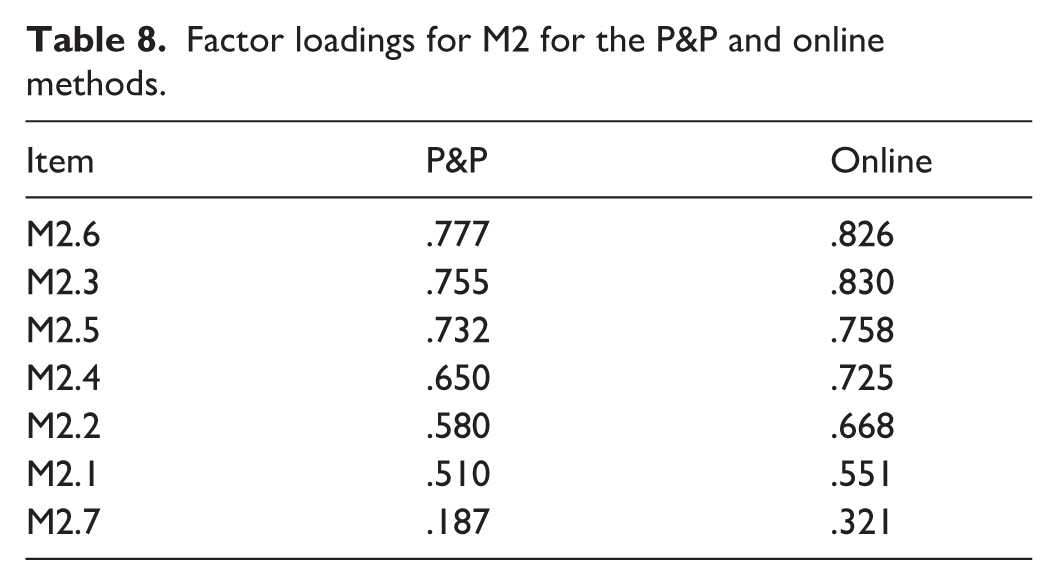
For M2, exploratory factor analysis yielded identical single-factor solutions for both administration methods (Table 8). Factor loadings were generally marginally higher in the online condition, suggesting slightly greater factor stability. Item M2.7 fell below the conventional 0.30 loading threshold in the P&P condition (0.187) but exceeded this threshold in the online condition (0.321).
Factor loadings for M2 for the P&P and online methods.
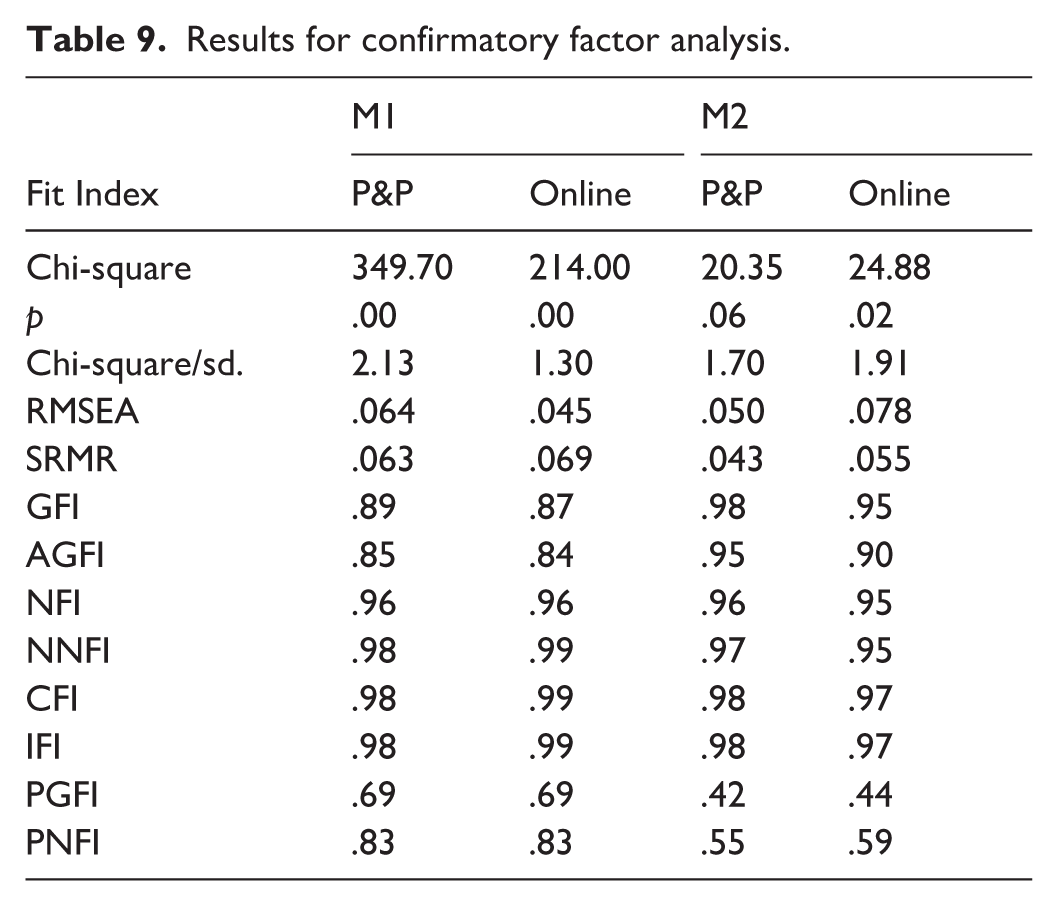
Confirmatory factor analysis results, presented in Table 9, further support qualitative equivalence. All goodness-of-fit indices for both M1 and M2 fell within acceptable ranges across online and P&P administrations (Hair et al., 2006; Kline, 2005; MacCallum et al., 2001). The close correspondence of fit indices across methods indicates strong factorial alignment between administration modes.
Results for confirmatory factor analysis.
Reliability equivalence was assessed by comparing internal consistency coefficients using the cocron procedure (Diedenhofen and Musch, 2016). Detailed results are reported in Table 10. For M1, reliability coefficients did not differ significantly across modes for three of the four factors. A statistically significant difference was observed only for Factor 1 (χ2 = 11.79, p = 0.0006). For M2, a significant difference emerged in overall scale reliability (χ2 = 4.10, p = 0.0429). Sensitivity analyses indicated that removal of specific items (M1.2 and M2.6) would equalize reliability coefficients, suggesting that observed differences are attributable to individual items rather than broader structural inconsistencies.
Cronbach’s alpha coefficient comparison test results for M1 and M2.
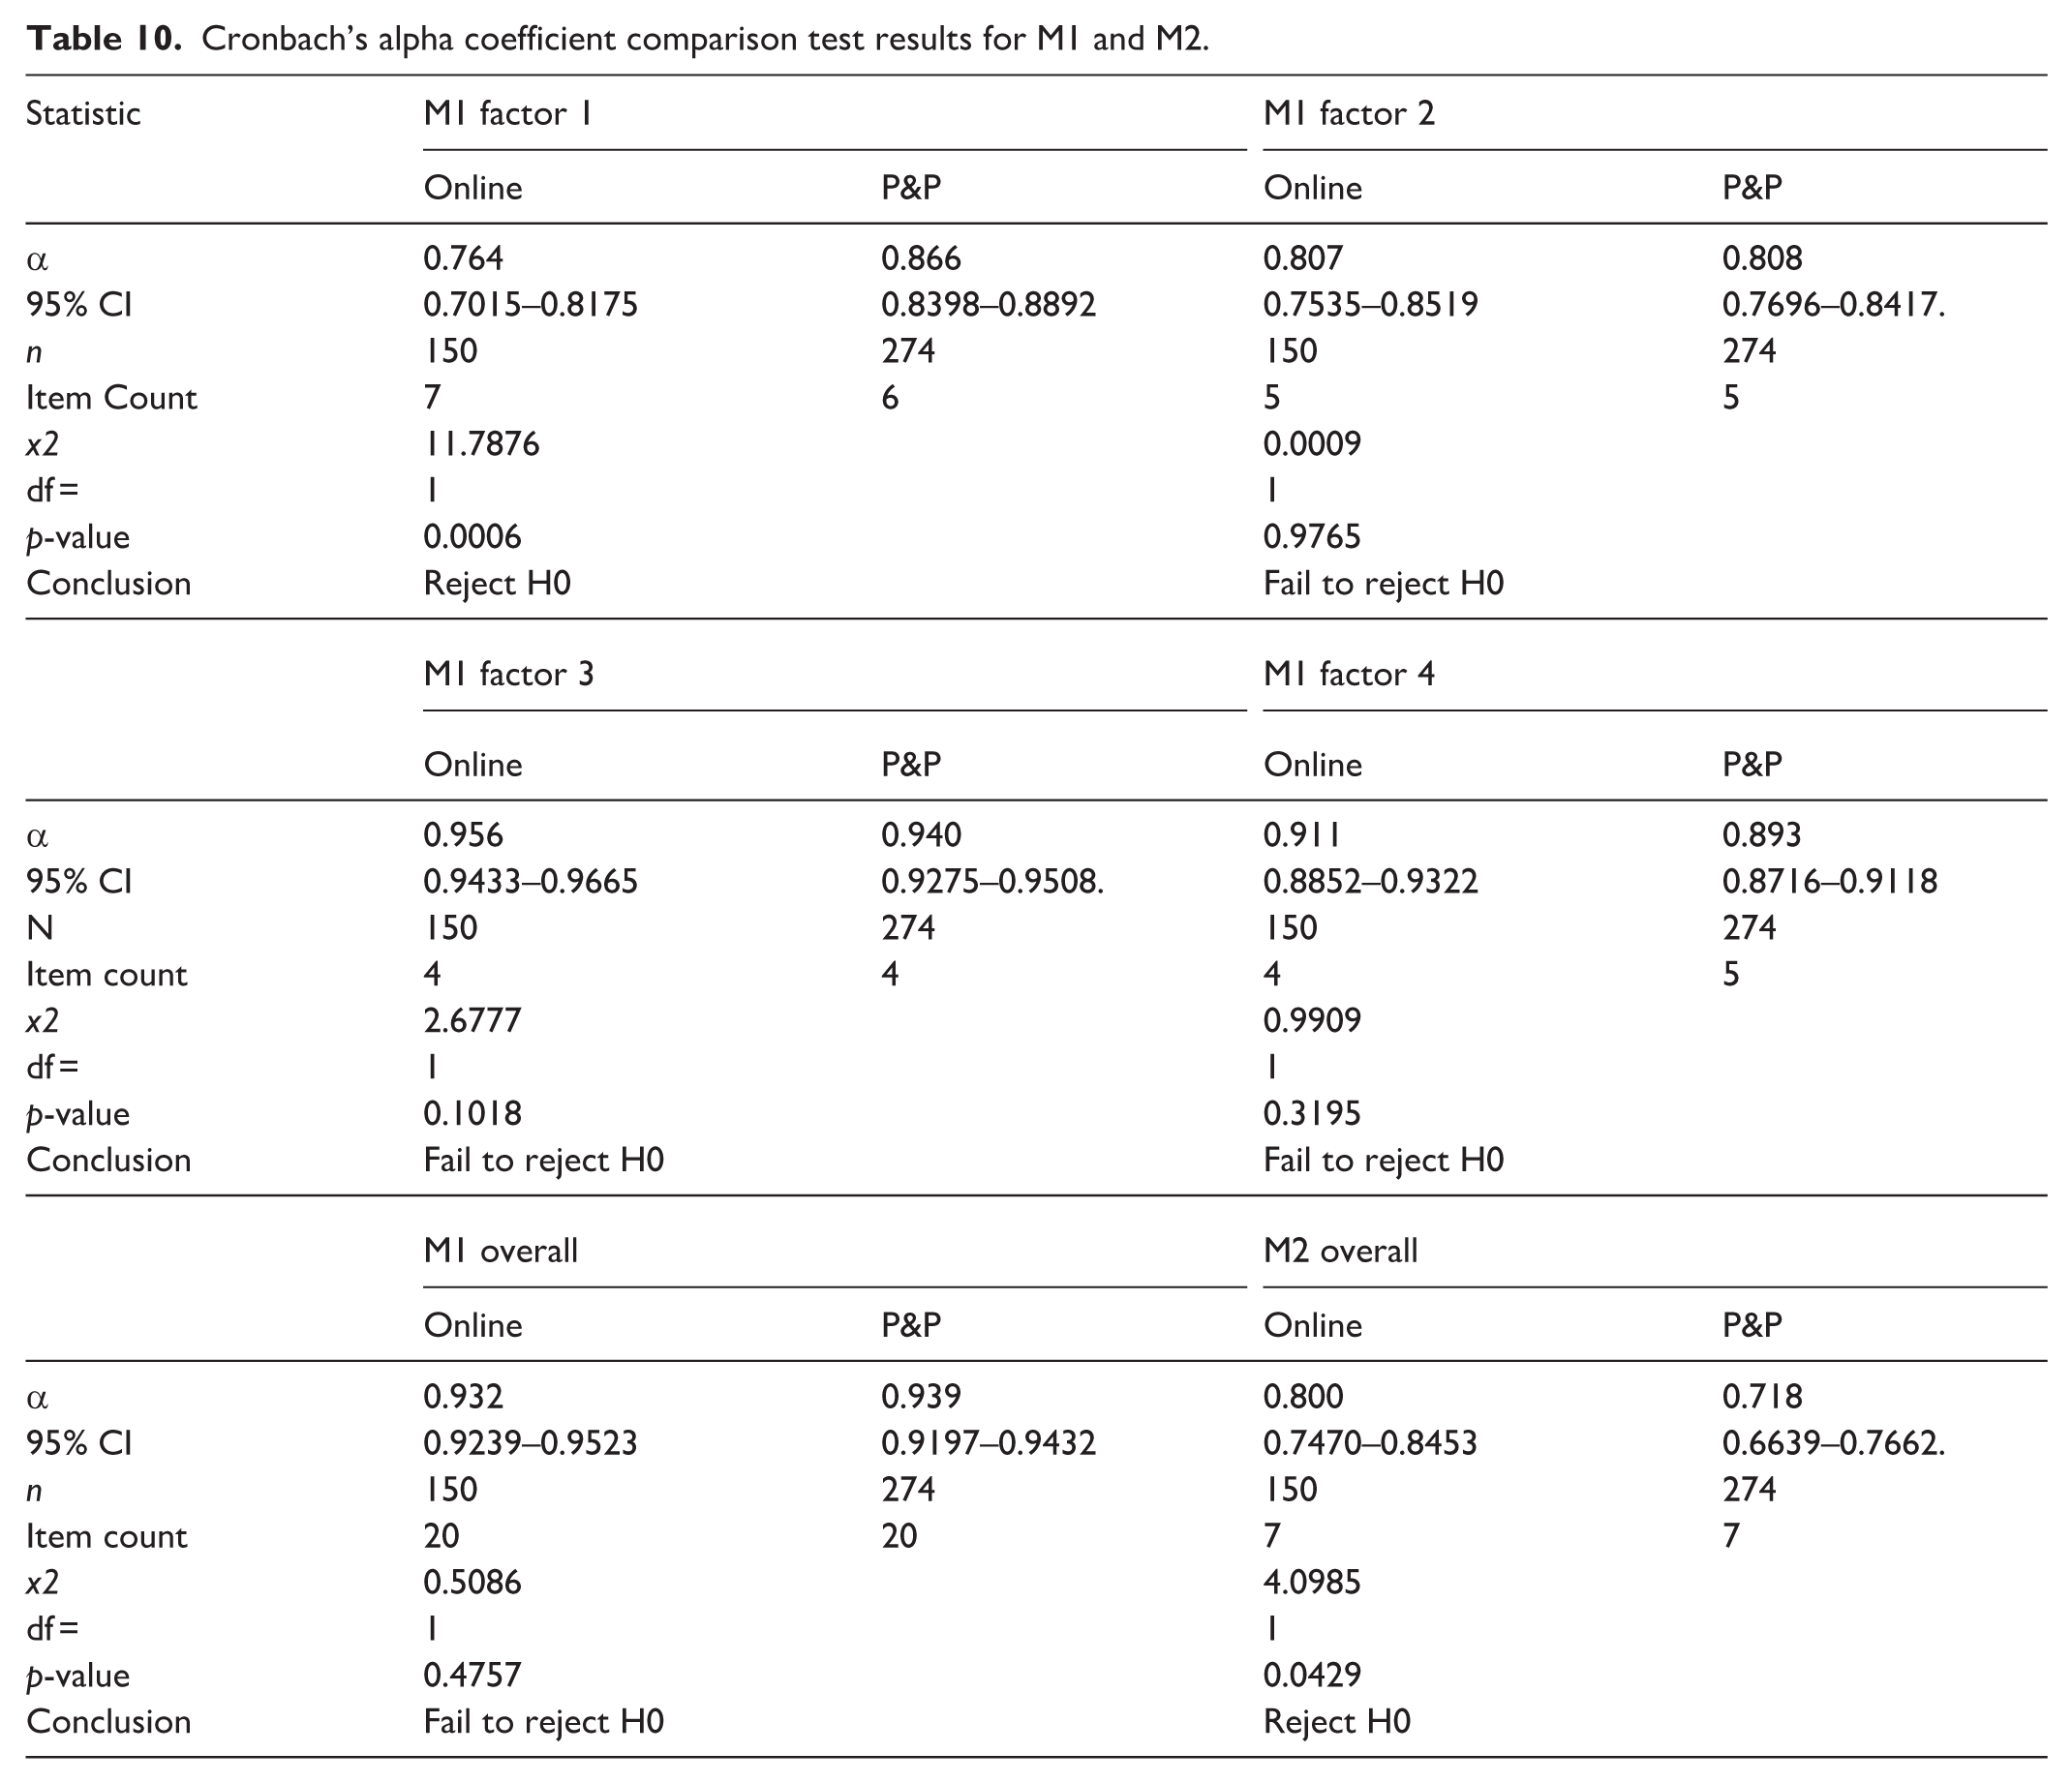
Importantly, overall internal consistency for M1 did not differ significantly between administration modes (Online: α = 0.932; P&P: α = 0.939; χ2 = 0.51, p = 0.4757), providing further support for qualitative equivalence of the primary scale.
Auxiliary equivalency
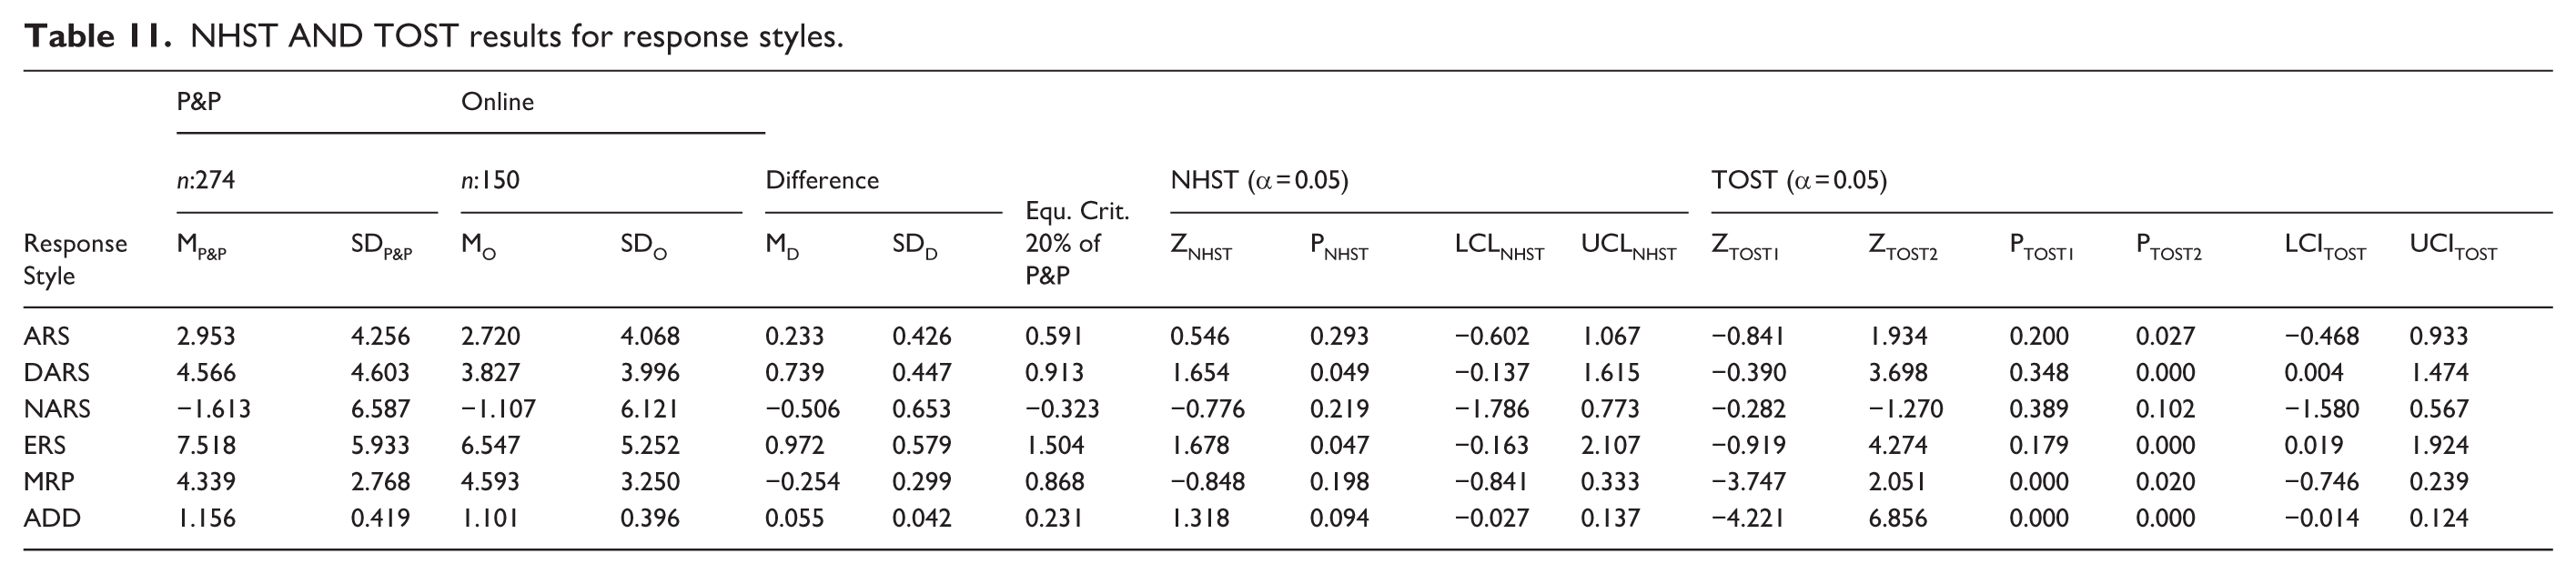
Auxiliary equivalence was examined by comparing response style patterns across online and P&P administration modes. Both traditional NHST and equivalence testing using the TOST procedure were applied. Descriptive statistics, mean differences, and test results for all response style indicators are presented in Table 11.
NHST AND TOST results for response styles.
Response styles were computed following the formulations proposed by Baumgartner and Steenkamp (2001), with the “Absolute Difference Between Consecutive Items” (ADD) calculated according to Weathers and Bardakcı (2015).
Mean differences between administration modes were first evaluated using independent-samples t-tests (α = 0.05). Equivalence was assessed using the TOST procedure.
The results revealed three of the four possible NHST–TOST outcome patterns. For ARS and NARS, neither NHST nor TOST provided evidence of statistically significant differences or equivalence. Although observed mean differences were small (ARS: MD = 0.233; NARS: MD = −0.506), confidence intervals extended beyond the predefined equivalence bounds (ARS: −0.468 to 0.933; NARS: −1.580 to 0.567), indicating a “neither statistically different nor statistically equivalent” outcome pattern.
In contrast, MRP and ADD demonstrated statistical equivalence. For both constructs, NHST indicated no statistically significant differences (MRP: p = .198; ADD: p = .094), while TOST supported equivalence, with confidence intervals fully contained within the equivalence bounds (MRP: −0.746 to 0.239; ADD: −0.014 to 0.124). These findings correspond to the “not statistically different but statistically equivalent” outcome pattern, indicating comparable response tendencies across administration modes.
A different pattern emerged for DARS and ERS. For both constructs, NHST indicated statistically significant differences between administration modes (DARS: p = .049; ERS: p = .047), whereas TOST failed to support equivalence as confidence intervals exceeded the equivalence bounds (DARS: 0.004 to 1.474; ERS: 0.019 to 1.924). These findings correspond to the “statistically different and not statistically equivalent” outcome pattern, suggesting sensitivity of these response styles to administration mode effects.
Overall, the auxiliary equivalence analysis indicated partial support for equivalence between online and P&P administrations across response style dimensions. Evidence of statistical equivalence was observed for MRP and ADD, whereas ARS and NARS showed neither statistically significant differences nor equivalence. In contrast, DARS and ERS exhibited statistically significant differences outside the equivalence bounds, indicating a lack of equivalence for these constructs. Taken together, these findings suggest that response behaviors were largely comparable across administration modes, although equivalence was construct-dependent rather than uniform across all measures.
Discussion
Context and relation to the literature
The digital transformation of research methodologies has fundamentally altered data collection practices within the scientific community (Askitas and Zimmermann, 2015). This shift was further accelerated by the COVID-19 pandemic, which rendered online survey administration not merely convenient but, in many cases, essential for the continuation of empirical research (De’ et al., 2020; Dow-Fleisner et al., 2022). Despite the widespread adoption of online surveys, concerns remain regarding the psychometric equivalence of data obtained through online versus P&P administration methods (Weigold et al., 2016).
The literature on online–P&P equivalence presents a mixed and sometimes inconsistent pattern of findings. While several studies report strong equivalence across administration modes (Beuckelaer and Lievens, 2009; Davis, 1999; Lewis et al., 2009; Stanton, 1998), others identify statistically and practically meaningful differences attributable to methodological effects (Bardakcı et al., 2017; Carini et al., 2003; McCoy et al., 2004; Wang et al., 2013). More recent research continues this divergence, with evidence of equivalence in specific contexts (Bolzani et al., 2023; Li et al., 2024) alongside findings of mode-related discrepancies, particularly in heterogeneous samples or more sensitive measurement contexts (Ceccato et al., 2024; Ternovski and Orr, 2023).
The present study contributes to this debate by applying a structured equivalence testing framework integrating both NHST and TOST procedures. The findings indicate that most response style indicators demonstrated statistical equivalence across administration modes, suggesting a high degree of methodological comparability between online and P&P data collection. This pattern is consistent with prior studies reporting strong equivalence in relatively homogeneous and digitally literate samples (Ahlberg et al., 2024; Li et al., 2024). At the same time, the presence of construct-specific discrepancies indicates that not all response styles are equally robust to administration mode effects. In particular, certain response tendencies appear more sensitive to mode variation, aligning with prior evidence highlighting differential susceptibility across psychological constructs (Ceccato et al., 2024; Todo and Umegaki, 2021).
Summary of findings and contributions
This study offers both methodological and empirical contributions to the literature on survey mode equivalence. Methodologically, it adopts the TOST procedure to assess quantitative equivalence, providing a statistically rigorous alternative to sole reliance on NHST. In addition, the study extends the concept of auxiliary equivalence by incorporating response style analysis, operationalizing established response style frameworks (Baumgartner and Steenkamp, 2001; Weathers and Bardakcı, 2015) within an equivalence testing framework.
Empirically, the results demonstrate a high degree of equivalence between online and P&P administration across multiple dimensions. First, quantitative equivalence was largely supported, with only a small number of items showing evidence of exceeding predefined equivalence bounds. Second, qualitative equivalence was indicated by comparable inter-item correlations, stable factor structures across administration modes, and acceptable model fit in confirmatory factor analyses. Third, auxiliary equivalence analyses revealed nuanced response style patterns: midpoint responding and within-person response variability demonstrated equivalence across modes, while extreme response tendencies showed a statistically detectable but limited method effect.
Taken together, these findings suggest that, within a homogeneous undergraduate sample, online and P&P survey administrations yield largely comparable psychometric results across multiple analytical dimensions. Notably, although extreme response tendencies exhibited a statistically detectable mode effect, this did not translate into substantial shifts in overall response levels. This pattern suggests that changes in extreme response behavior may be counterbalanced by concurrent variations in other response styles, such as disacquiescent responding and item-level response dispersion, resulting in overall stability at the aggregate level.
Limitations, future research, and practical implications
Several limitations should be considered when interpreting the findings. First, the use of a homogeneous undergraduate sample, while advantageous for minimizing extraneous variability, limits the generalizability of the results to more diverse populations. Second, the scope of the findings is limited to comparisons between self-administered survey modes (online and P&P). Although both modes reduce interviewer effects, the findings may not generalize to survey contexts involving interviewer administration (e.g., face-to-face interviews), where different forms of mode-related bias may emerge. Third, the between-subjects design, although practical, provides less rigorous evidence of equivalence than randomized crossover designs (Bolzani et al., 2023).
Future research should address these limitations by examining equivalence across more heterogeneous samples differing in age, educational background, and digital literacy; and by employing randomized crossover designs to strengthen causal inferences regarding administration mode effects. Additionally, future studies may explore cultural and contextual moderators of online–P&P equivalence across different national and linguistic settings.
From a practical perspective, the findings offer several implications for researchers. Online survey administration appears particularly suitable for homogeneous and digitally literate populations similar to the sample examined in this study. Nevertheless, when transitioning established scales to online formats, researchers are advised to verify factor structures, reliability coefficients, and potential item-level vulnerabilities. Incorporating response style analyses may further enhance the detection of subtle method-induced biases, especially with respect to extreme response tendencies. Finally, the combined use of traditional significance testing and equivalence testing procedures provides a more comprehensive assessment of methodological comparability than either approach alone.
Conclusion
This study provides evidence supporting the general equivalence of online and P&P survey methods within a homogeneous, digitally literate undergraduate population. High levels of quantitative, qualitative, and auxiliary equivalence indicate that online administration can be appropriately used in similar research contexts without compromising overall psychometric integrity. At the same time, the findings also show that equivalence is not uniform across all indicators, as a small number of items and response style measures exhibited modest mode-related differences. This pattern suggests that while psychometric properties are largely preserved across administration modes, limited mode effects may still emerge at the construct or item level.
As online data collection continues to expand, further research is needed to examine administration mode effects across more diverse populations and measurement contexts to better understand the conditions under which equivalence holds or may be violated.
Footnotes
Appendix
Acknowledgements
The authors would like to thank the participants for their voluntary involvement in this study.

Ethical considerations
Ethical approval for data collection was obtained from the Ethics Committee of Zonguldak Bülent Ecevit University (Approval No. 769, dated 12 March 2020).
Funding
The authors received no financial support for the research, authorship, and/or publication of this article.
Declaration of conflicting interests
The authors declared no potential conflicts of interest with respect to the research, authorship, and/or publication of this article.
Data availability statement
The data used in this research were also utilized in a previous study by Gökbulut, B. (2022), titled “An Analysis of University Students’ Fear of Mobile Phone Deprivation (Nomophobia) and Levels of Happiness,” published in the Kastamonu Education Journal. 30(2), 331-340.