
Abstract
Background
Distal radius fractures (DRFs) are the most common upper-extremity fractures in older adults. Frailty may modulate postoperative risk, but the comparative prognostic value of widely used frailty indices in DRF surgery is unclear.
Objective
To compare the 5-item modified Frailty Index (mFI-5), Clinical Frailty Scale (CFS), and Charlson Comorbidity Index (CCI) for predicting complications and functional outcomes after DRF surgery in patients ≥65 years, and to assess whether machine learning (ML) enhances risk stratification.
Methods
We retrospectively analyzed 562 patients (mean age 75.1±4.9 years; 71.7% female) undergoing open reduction and internal fixation (67.1%), closed reduction percutaneous pinning (21.2%), or external fixation (11.7%), with ≥12 months of follow-up. Preoperative mFI-5, CFS, and CCI were collected. The primary endpoint was any postoperative complication (composite of surgical site infection, wound dehiscence, loss of reduction, tendon injury, nonunion/malunion, hardware failure, reoperation, 30-/90-day readmission, venous thromboembolism, and complex regional pain syndrome). Functional outcomes were DASH, PRWE, grip strength, and return to activities of daily living (ADLs). Logistic and Cox regression were used. Exploratory ML models (random forest, gradient boosting) employed 5-fold cross-validation, an 80/20 train–test split, and isotonic calibration.
Results
Over 17.9±4.5 months, 195 of 562 patients (34.8%) developed ≥1 complication. mFI-5 ≥2 was associated with higher complication rates (38.2% vs 31.9%) and worse 6-month disability (DASH 55.4 vs 44.5; PRWE 47.9 vs 36.4; all p<0.001). CFS ≥4 predicted lower 12-month grip strength recovery (67.8% vs 74.1%) and reduced ADL return (65.9% vs 78.6%). Discrimination for complications was modest (AUCs: mFI-5 0.552; CFS 0.534; CCI 0.507). ML substantially improved performance (gradient boosting AUC 0.878; random forest AUC 0.812) with superior calibration.
Conclusions
mFI-5, CFS, and CCI are associated with postoperative complications and functional recovery after DRF surgery but have limited individual discriminative power. ML-based multivariable models achieve markedly better risk stratification and may support more accurate preoperative counseling and personalized perioperative management.
Keywords
Introduction
Distal radius fractures (DRFs) are among the most common osteoporotic fractures in adults aged ≥65 years, particularly in women after low-energy falls. In the super-elderly (≥80 years), incidence is high, with the majority resulting from simple falls and imposing a substantial clinical and economic burden on health systems.1,2 While operative management—including open reduction and internal fixation (ORIF), closed reduction percutaneous pinning (CRPP), and external fixation—has increased in recent years, the magnitude of functional benefit and the complication profile in older patients remain debated. Meta-analyses report statistically significant improvements in mid-term DASH scores and grip strength with surgery; however, in patients ≥60 years these differences may not always be clinically meaningful.2,3
Preoperative risk stratification in geriatric orthopaedics must move beyond chronological age to incorporate physiological reserve and frailty. Frailty—a geriatric syndrome characterized by diminished reserve and increased vulnerability to stressors—is strongly associated with postoperative complications, mortality, prolonged length of stay, and loss of independence, adding prognostic value beyond standard ASA grading.4-7 Three tools are widely used in practice: the 5-item modified Frailty Index (mFI-5), a brief comorbidity-based measure adapted from ACS-NSQIP6,8; the 9-point Clinical Frailty Scale (CFS), a judgment-based assessment of fitness and functional capacity9,10; and the Charlson Comorbidity Index (CCI), which weights multiple comorbid conditions.6,7,11-15 Although these indices predict adverse outcomes across various orthopaedic procedures, their comparative predictive performance in older adults undergoing DRF surgery—and which instrument is most suitable for clinical deployment—remains uncertain.4-7,16DRF-specific complexities, such as variable risks of complex regional pain syndrome (CRPS) and measurement constraints of functional instruments (DASH, PRWE) in older individuals, may further challenge risk prediction.16,17
Accordingly, this study aims to compare the predictive accuracy of mFI-5, CFS, and CCI for postoperative complications and functional outcomes in patients aged ≥65 years undergoing surgery for closed DRFs, and to evaluate whether machine learning–based models can enhance risk stratification beyond traditional indices. Our goal is to generate evidence that strengthens preoperative decision support, enables earlier identification of high-risk patients, and informs individualized treatment strategies in this population.18,19
Materials and Methods
Study Design and Setting
We conducted a single-center retrospective cohort study at an academic tertiary medical center following institutional review board approval (IRB 2025-10/257). The study adhered to the Declaration of Helsinki and Strengthening the Reporting of Observational Studies in Epidemiology (STROBE) guidelines; informed consent was waived owing to the retrospective design.20,21 Consecutive patients aged ≥65 years who underwent surgery for acute distal radius fractures (DRFs) between January 2018 and December 2023 were screened. A STROBE-compliant flow diagram summarizes screening, exclusions, and the final cohort (Figure 1).
21
This study was reported in accordance with the STROBE checklist for observational cohort studies; the completed checklist is provided as Supplemental Material. Patient flow diagram. CONSORT-style flowchart showing patient selection, exclusions, frailty assessment, and final analysis cohort. mFI-5 = modified frailty index-5; CFS = clinical frailty scale; CCI = charlson comorbidity index; ADL = activities of daily living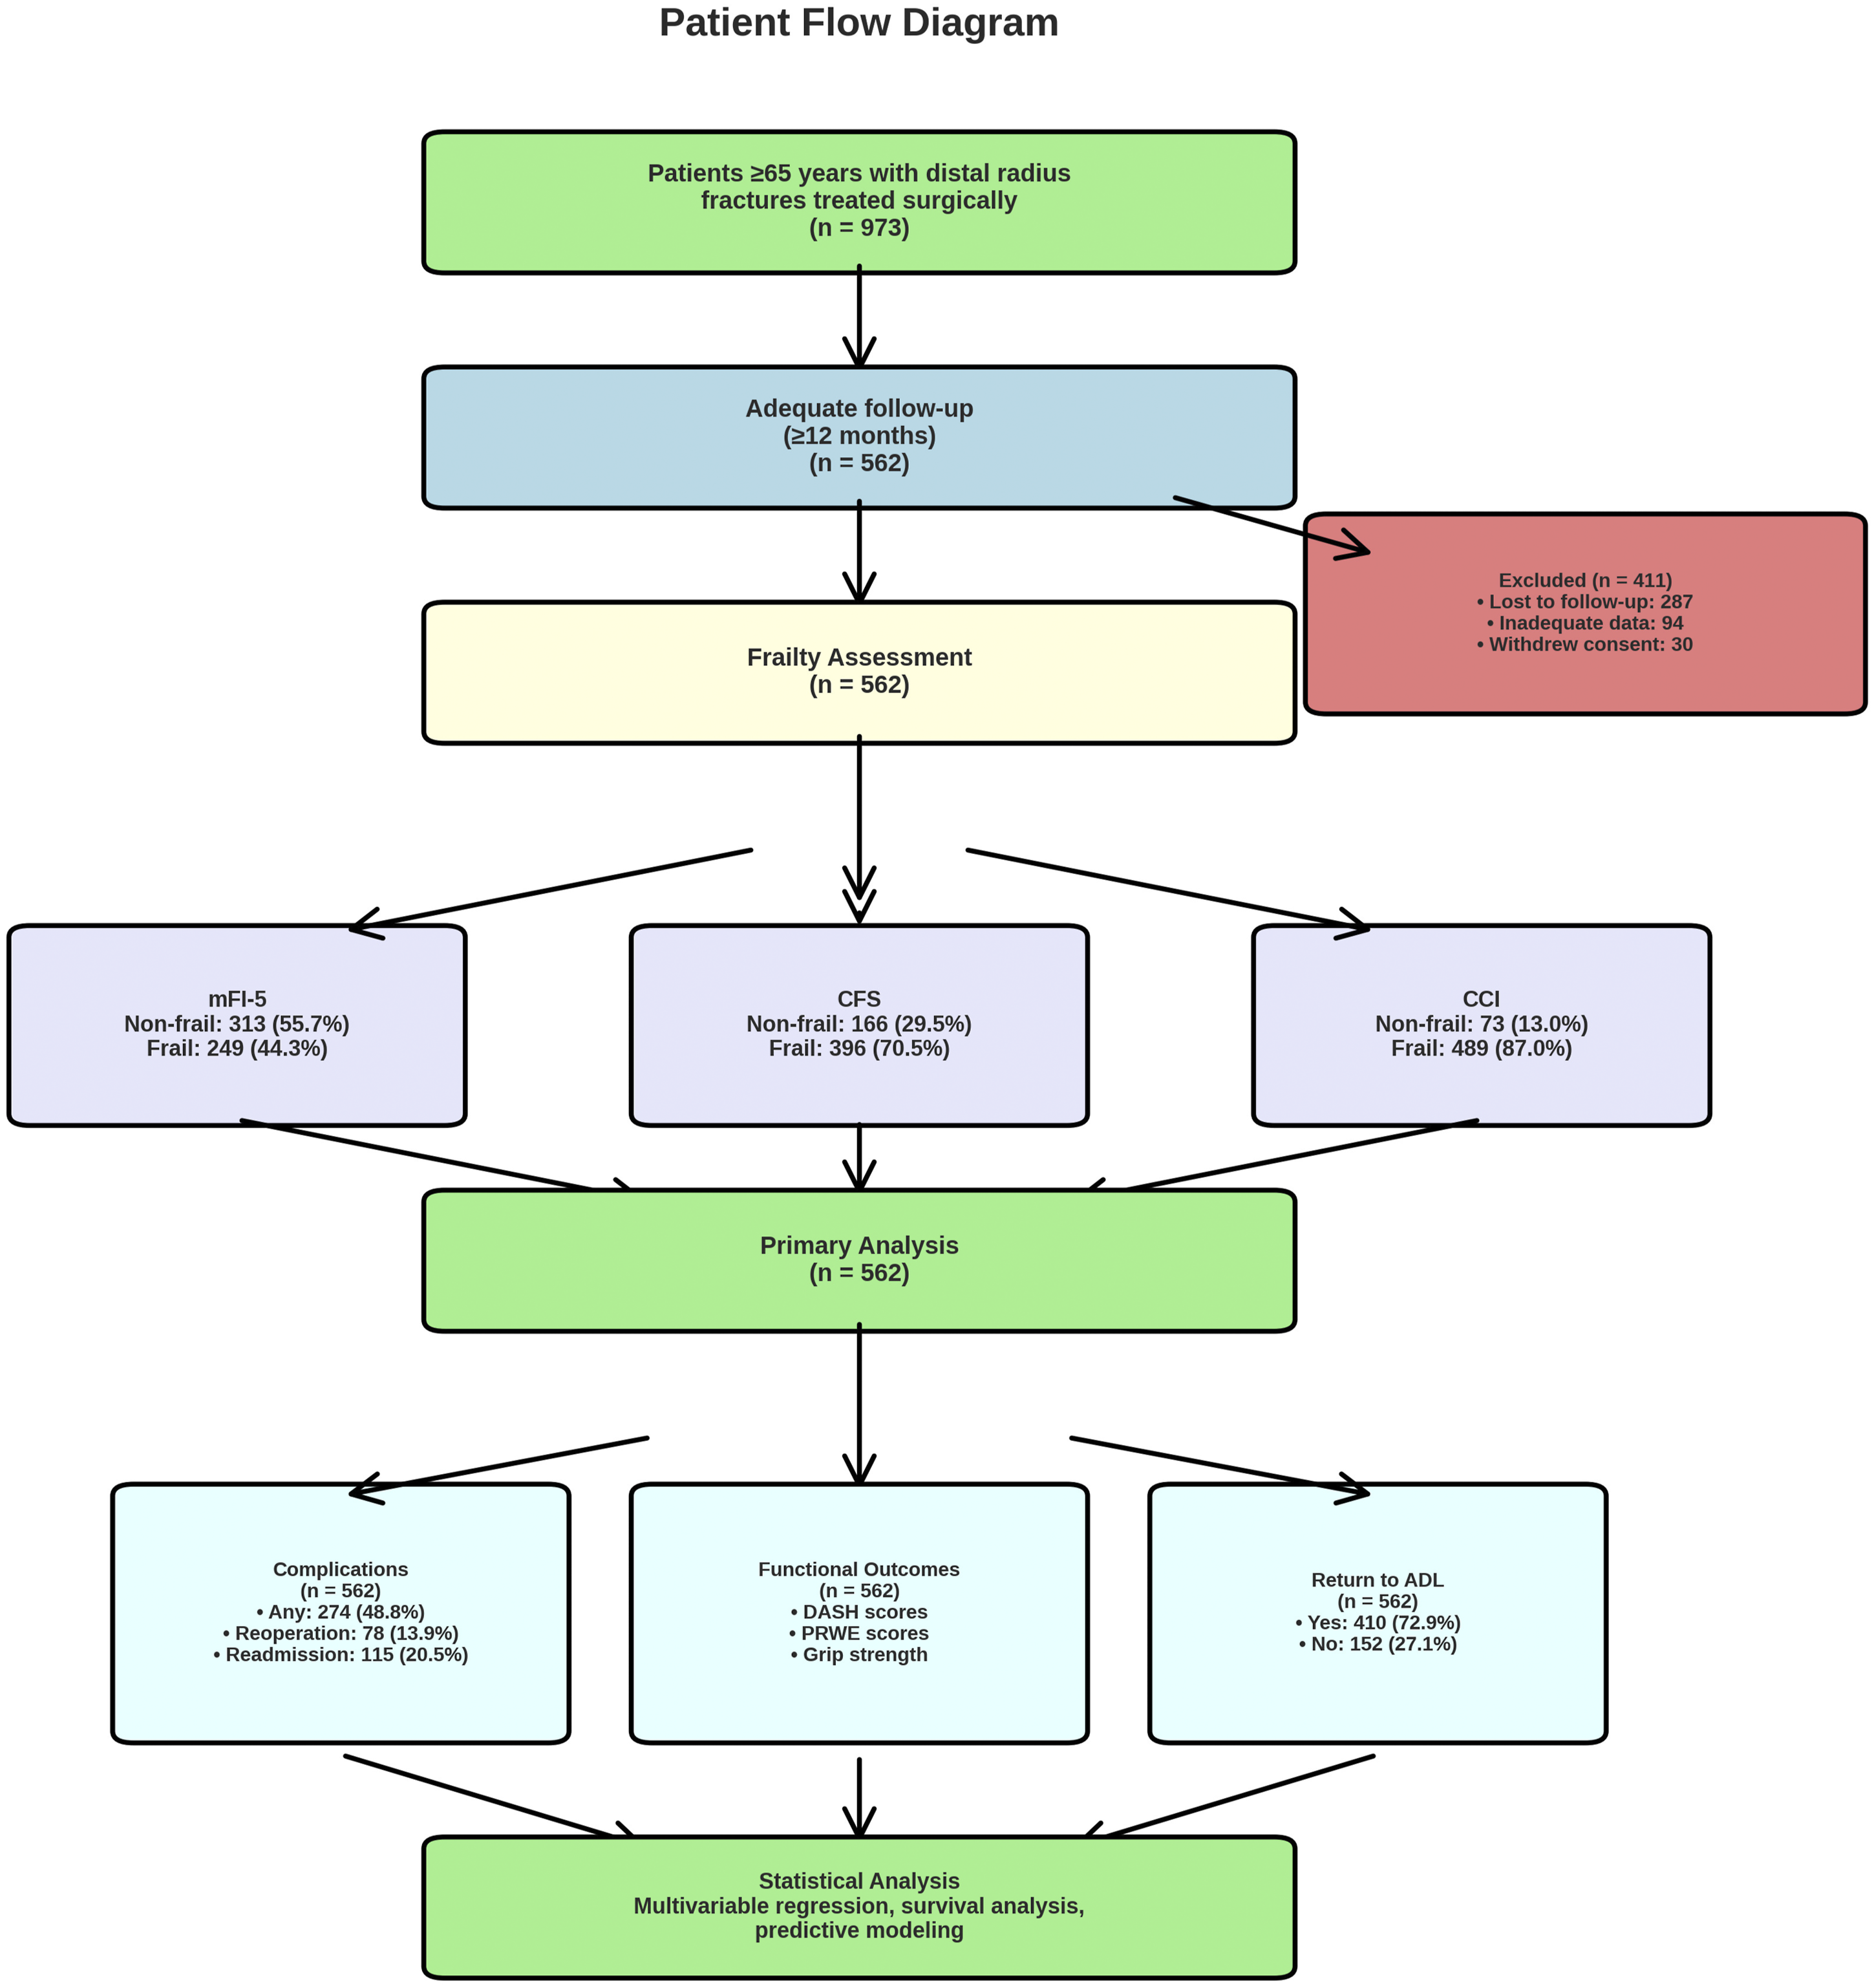
Eligibility Criteria and Cohort Assembly
Inclusion criteria were: (1) age ≥65 years at injury; (2) radiographically confirmed acute DRF; (3) operative management with open reduction and internal fixation (ORIF), closed reduction and percutaneous pinning (CRPP), or external fixation (Ex-fix); and (4) minimum 12-month follow-up. Exclusion criteria were: pathologic fractures due to malignancy or metabolic bone disease; polytrauma requiring prolonged hospitalization; prior ipsilateral wrist surgery; incomplete records precluding frailty assessment; and refusal/withdrawal of consent. Of 973 eligible patients, 411 were excluded (lost to follow-up, n=287; insufficient frailty data, n=94; withdrew consent, n=30), yielding 562 patients for analysis. Loss to follow-up was defined as no clinic contact within 12 months postoperatively.
Frailty and Comorbidity Assessment
Preoperative frailty was assessed by trained personnel using chart review and patient interviews when available. The 5-item modified Frailty Index (mFI-5),6,8 scored diabetes, chronic obstructive pulmonary disease/pneumonia, congestive heart failure, functional dependence, and hypertension requiring medication (0–5); frailty was defined a priori as mFI-5 ≥2 based on orthopaedic literature. The CFS 7-category version (1=very fit to 7=severely frail) was used,9,10 excluding terminal categories (8–9), which were inapplicable to surgical candidates; frailty was defined as CFS ≥4. Comorbidity burden was quantified by the Charlson Comorbidity Index (CCI) 22 without age-adjustment; high burden was defined as CCI ≥3. Thresholds were prespecified based on prior orthopaedic studies.
Fracture Classification and Surgical Procedures
Fractures were classified according to the AO/OTA system using preoperative radiographs and computed tomography when obtained. 23 Two independent raters performed classification; disagreements were resolved by consensus, and interobserver agreement (Cohen’s kappa) was calculated, with benchmarks interpreted as slight (≤0.20), fair (0.21–0.40), moderate (0.41–0.60), substantial (0.61–0.80), or almost perfect (≥0.81). ORIF predominantly used volar locking plates; dorsal plating was utilized in a subset of patients with dorsally displaced or dorsally comminuted fracture patterns (primarily AO/OTA 23-C2 and 23-C3 subtypes) where adequate reduction could not be achieved through a volar approach alone. Within the ORIF cohort (n=377), dorsal plating was employed in 31 patients (8.2%). Among these, complications occurred in 12 patients (38.7%), compared with 150 of 346 patients (43.4%) treated with volar plating; this difference was not statistically significant (p=0.611). The dorsal approach subgroup was small, limiting definitive conclusions regarding comparative complication profiles in this frail population. CRPP utilized 0.062-inch Kirschner wires; external fixation used bridging or non-bridging constructs depending on fracture characteristics. All procedures were performed by fellowship-trained orthopaedic trauma or hand surgeons. Anesthesia (general, regional, or monitored anesthesia care) was determined by the anesthesiology team. Operative time was recorded from incision to closure. A standardized postoperative rehabilitation protocol was applied across modalities.
Outcomes
The primary outcome was defined as the occurrence of any postoperative complication within the follow-up period, operationalized as a composite of surgical site infection (CDC/NHSN criteria), wound dehiscence requiring intervention, loss of reduction necessitating revision, tendon injury (extensor/flexor), nonunion or malunion, hardware complications (loosening, prominence, or failure), reoperation for any cause, 30- and 90-day readmission, venous thromboembolism (deep venous thrombosis or pulmonary embolism), and complex regional pain syndrome (CRPS) diagnosed by Budapest criteria.24,25 Secondary outcomes included: (1) patient-reported outcomes (DASH 19 and PRWE 19 at 3 and 6 months; validated local-language versions when applicable); (2) grip strength by calibrated Jamar dynamometer 26 at 3, 6, and 12 months in a standardized position (three trials averaged; normalized to the contralateral side); (3) time to return to baseline activities of daily living (ADLs; patient-reported return to preinjury basic ADLs); and (4) all-cause mortality at 30 days and 6 months. Components of the composite were also reported descriptively.26,27
Statistical Analysis
Continuous variables were assessed for normality using the Shapiro–Wilk test and Q–Q plots; normally distributed data are reported as mean±SD and non-normal as median (IQR). 27 Categorical variables are presented as counts and percentages. Between-group comparisons used independent-samples t-tests or Mann–Whitney U tests for continuous variables and chi-square or Fisher’s exact tests for categorical variables (Fisher’s when expected cell counts <5). Effect sizes included Cohen’s d (continuous) and odds ratios (ORs) with 95% confidence intervals (CIs) (categorical). Two-sided p<0.05 indicated statistical significance. No multiplicity adjustment was applied to the primary outcome; Bonferroni correction was used for prespecified exploratory subgroup analyses.
Multivariable Modeling
We constructed three prespecified multivariable logistic regression models to identify independent predictors of the primary composite outcome, each including one frailty index (mFI-5, CFS, or CCI) plus age, sex, body mass index (BMI), ASA class, and surgical technique. Model fit was assessed by the Hosmer–Lemeshow test and McFadden’s pseudo-R2; multicollinearity was evaluated using variance inflation factors (VIF>10 indicating concern). Models were compared using AIC and ROC–AUC on a held-out test set, with 95% CIs estimated by bootstrapping. To explore whether surgical technique influenced outcomes independently, we performed additional stratified analyses comparing complication rates and functional outcomes (DASH, PRWE, grip strength, and return to ADLs) across the three operative modalities (ORIF, CRPP, and external fixation). Chi-square tests and one-way ANOVA (or Kruskal–Wallis tests for non-normally distributed data) were used for between-group comparisons. Furthermore, we evaluated whether incorporating surgical technique as an interaction term with frailty indices improved model discrimination for the primary composite outcome.
Time-To-Event Analysis
Time to return to baseline ADLs was analyzed using Cox proportional hazards regression with time origin at surgery. Patients not returning to baseline function were censored at last follow-up. The proportional hazards assumption was tested using Schoenfeld residuals and inspection of log–log plots. 22 Hazard ratios (HRs) with 95% CIs were reported. Discrimination was quantified by Harrell’s concordance index (C-index) with 95% CIs. 28
Machine Learning (Exploratory)
To evaluate predictive performance for the primary outcome, we trained logistic regression, random forest, and gradient boosting classifiers using demographics, comorbidities, and frailty indices as features. Continuous variables were standardized and categorical variables one-hot encoded. Class imbalance was addressed with class weights. Hyperparameters were tuned via 5-fold cross-validation within the training set; performance was assessed on an independent test set (80/20 split, fixed random seed) using ROC–AUC, sensitivity, specificity, positive predictive value (PPV), negative predictive value (NPV), and Brier score. Thresholds were selected using Youden’s index. Calibration used isotonic or Platt scaling. Feature importance was summarized using permutation importance (tree-based models) and standardized coefficients (logistic regression). Target leakage was minimized by excluding posttreatment variables.
Missing Data and Sensitivity Analyses
Missing-data mechanisms were evaluated with Little’s MCAR test. 29 Variables with >20% missingness were excluded from multivariable analyses. For variables with <20% missingness, complete-case analysis was primary. If >10% missingness occurred in key variables, multiple imputation by chained equations (MICE) was prespecified for sensitivity analyses; a recommended approach was followed for implementation.
Sample Size Considerations
A formal a priori power analysis for sample size calculation was not performed prior to study initiation, as this was a retrospective cohort study that included all eligible consecutive patients within the study period. However, post hoc power analysis indicated that the final sample of 562 patients provided 81% power to detect the observed difference in the primary composite complication rate between frail and non-frail groups (38.2% vs. 31.9%; α=0.05, two-sided), >95% power for DASH and PRWE differences, and >99% power for grip strength and time-to-ADL differences. The absence of a priori sample size calculation is acknowledged as a limitation of this study.
Software
Analyses were performed in Python 3.9 (pandas, numpy, scipy, statsmodels, lifelines, scikit-learn). Detailed package versions and random seeds are provided in the Supplement.
Results
Patient Demographics and Baseline Characteristics
Demographics and Baseline Characteristics by Frailty Status
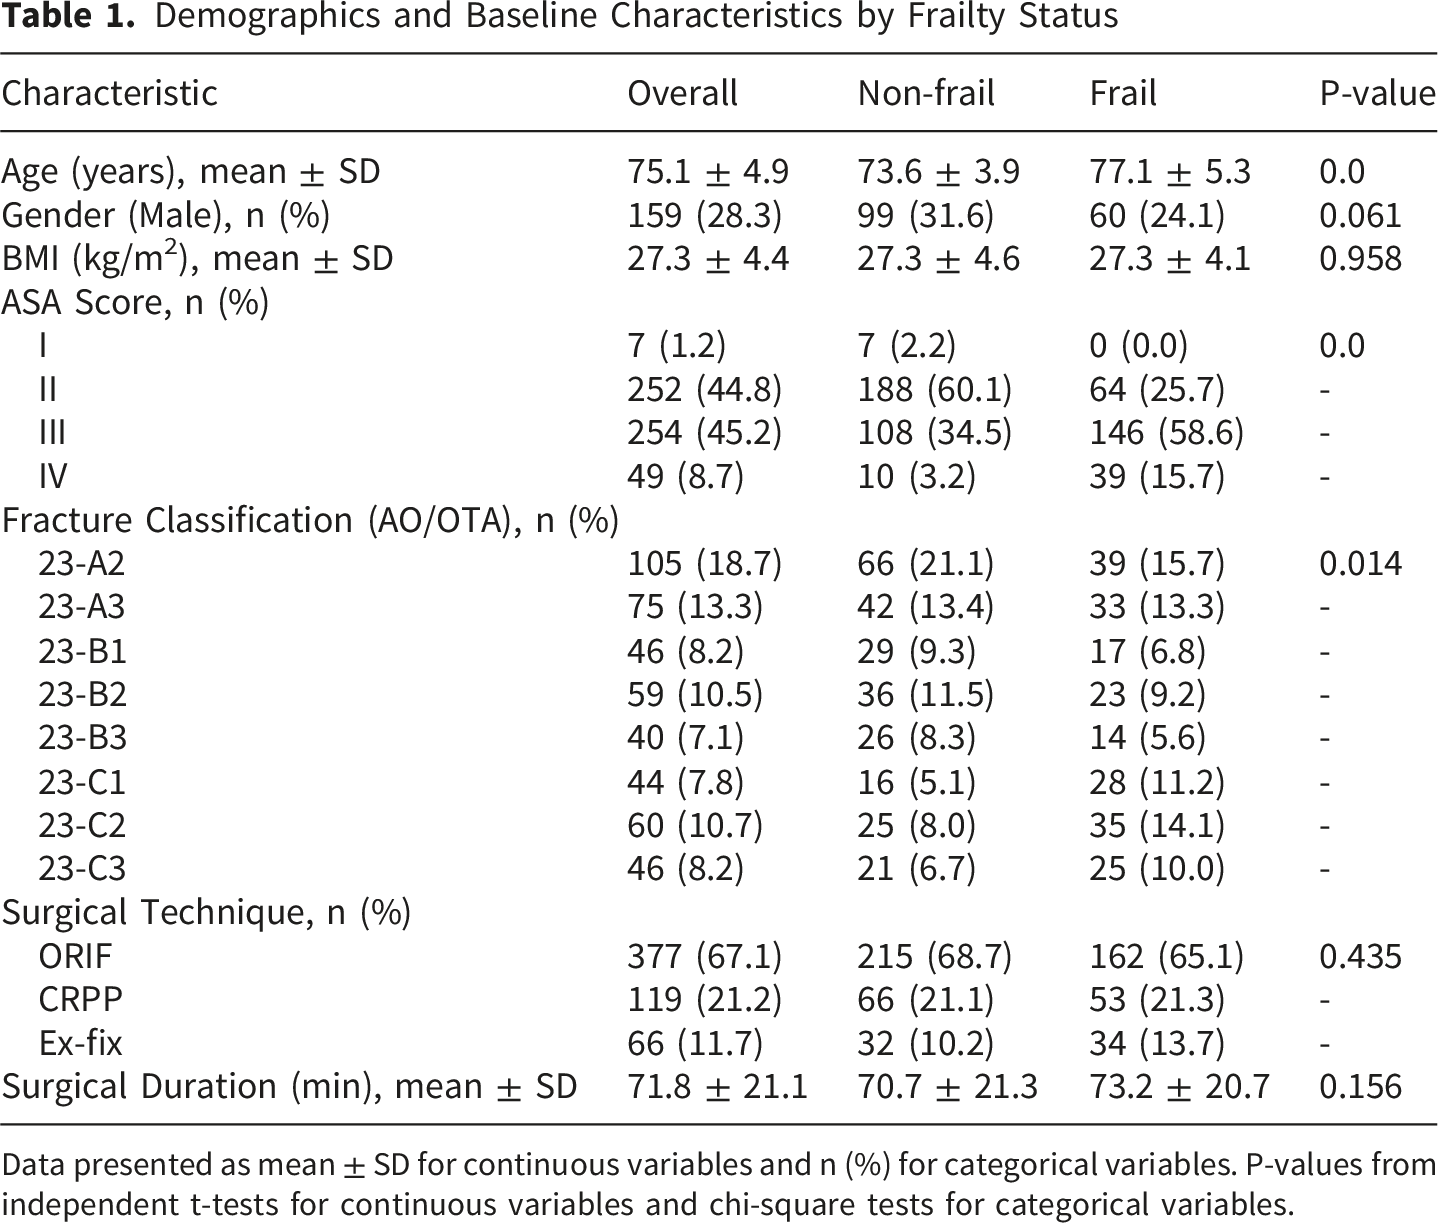
Data presented as mean ± SD for continuous variables and n (%) for categorical variables. P-values from independent t-tests for continuous variables and chi-square tests for categorical variables.
Frailty Indices Distribution and Correlations
Frailty Indices Distribution and Comparison
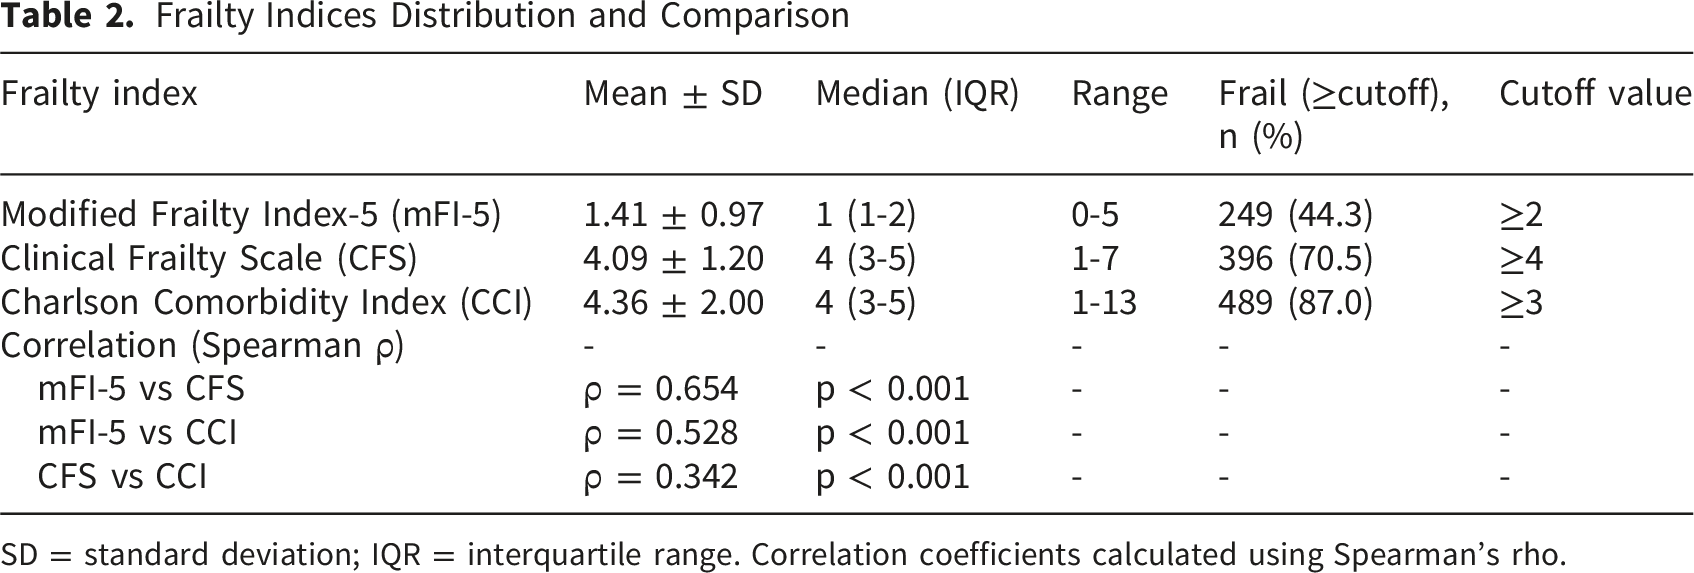
SD = standard deviation; IQR = interquartile range. Correlation coefficients calculated using Spearman’s rho.
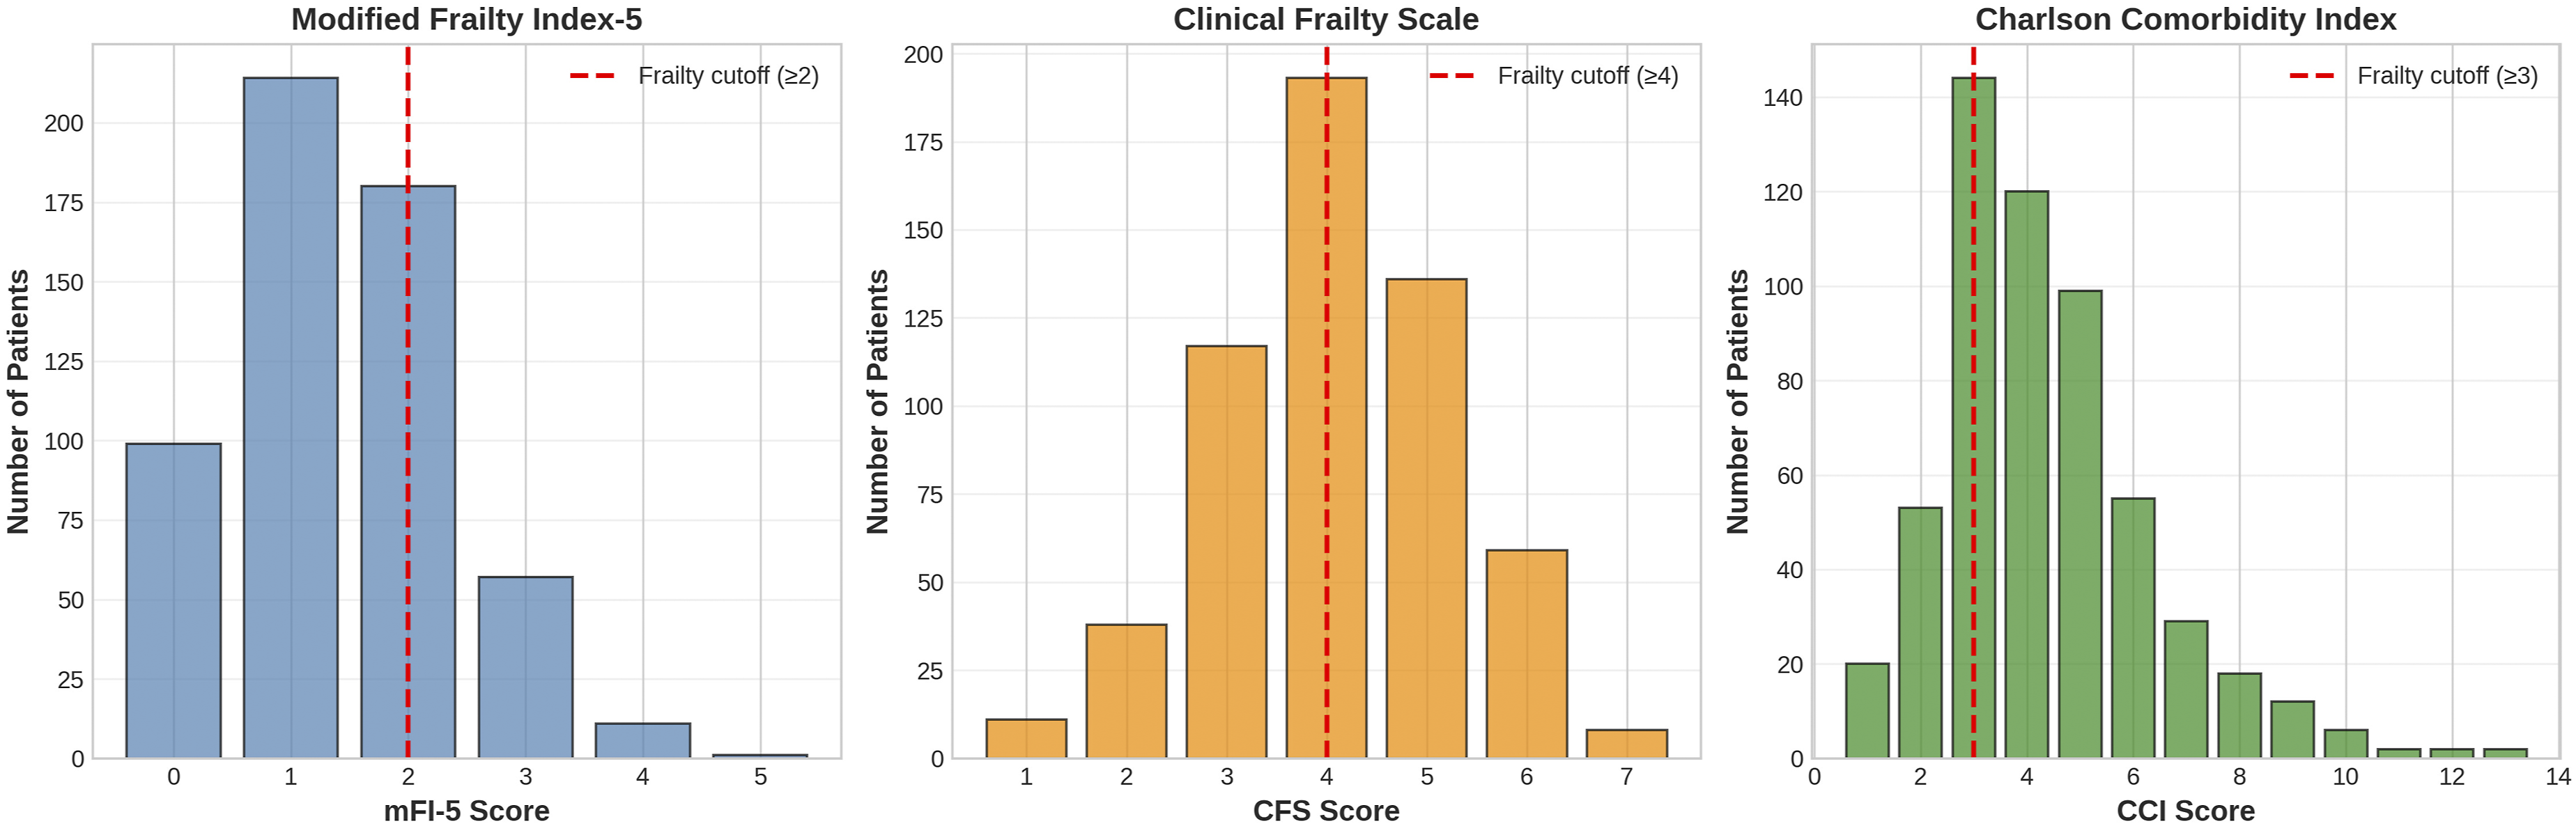
Distribution of frailty indices. Bar graphs showing the distribution of (A) Modified frailty index-5 (mFI-5), (B) Clinical frailty scale (CFS), and (C) Charlson comorbidity index (CCI) scores in the study cohort. Red dashed lines indicate the cutoff values for frailty classification (mFI-5 ≥2, CFS ≥4, CCI ≥3)
Complications
Complications by Frailty Status (mFI-5 ≥2)
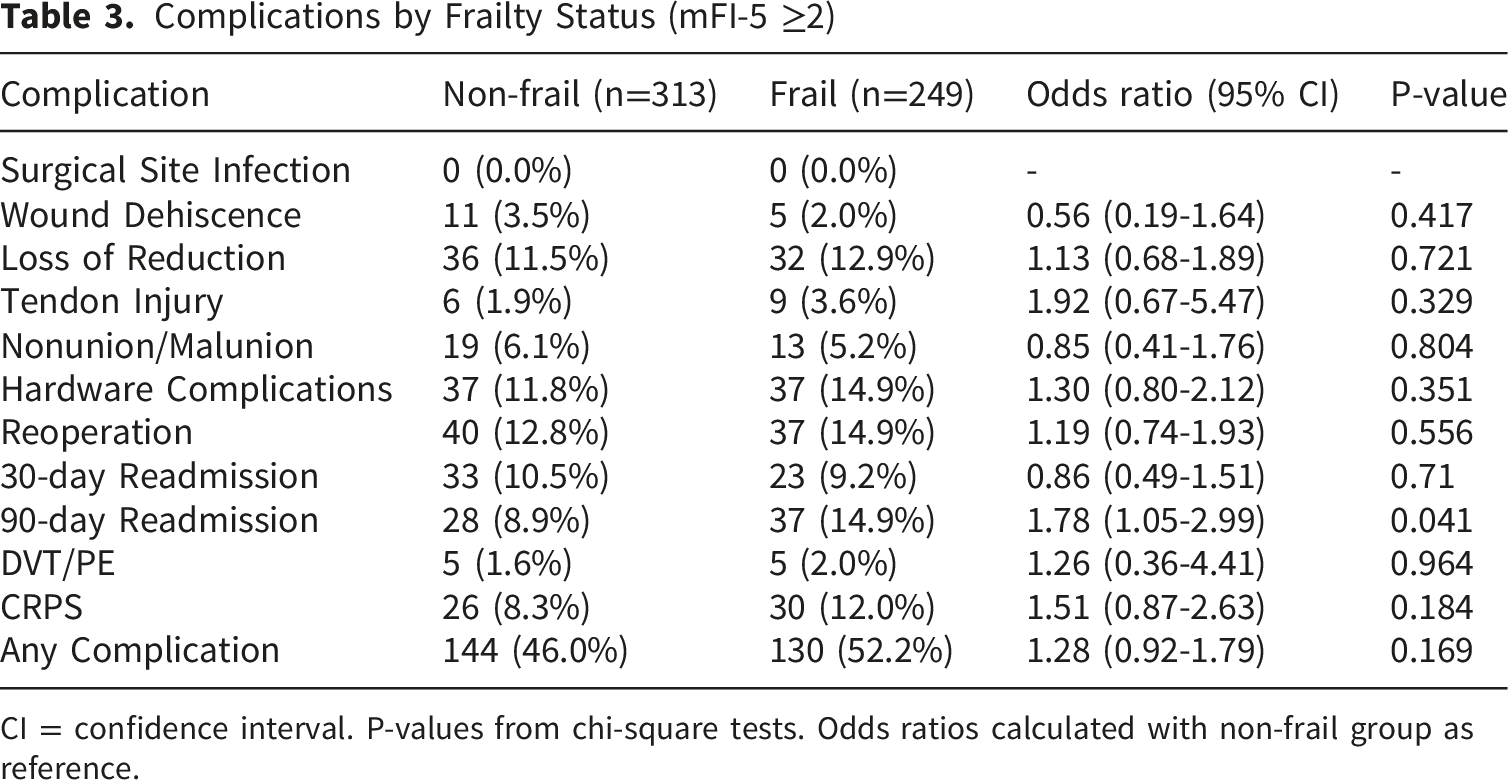
CI = confidence interval. P-values from chi-square tests. Odds ratios calculated with non-frail group as reference.
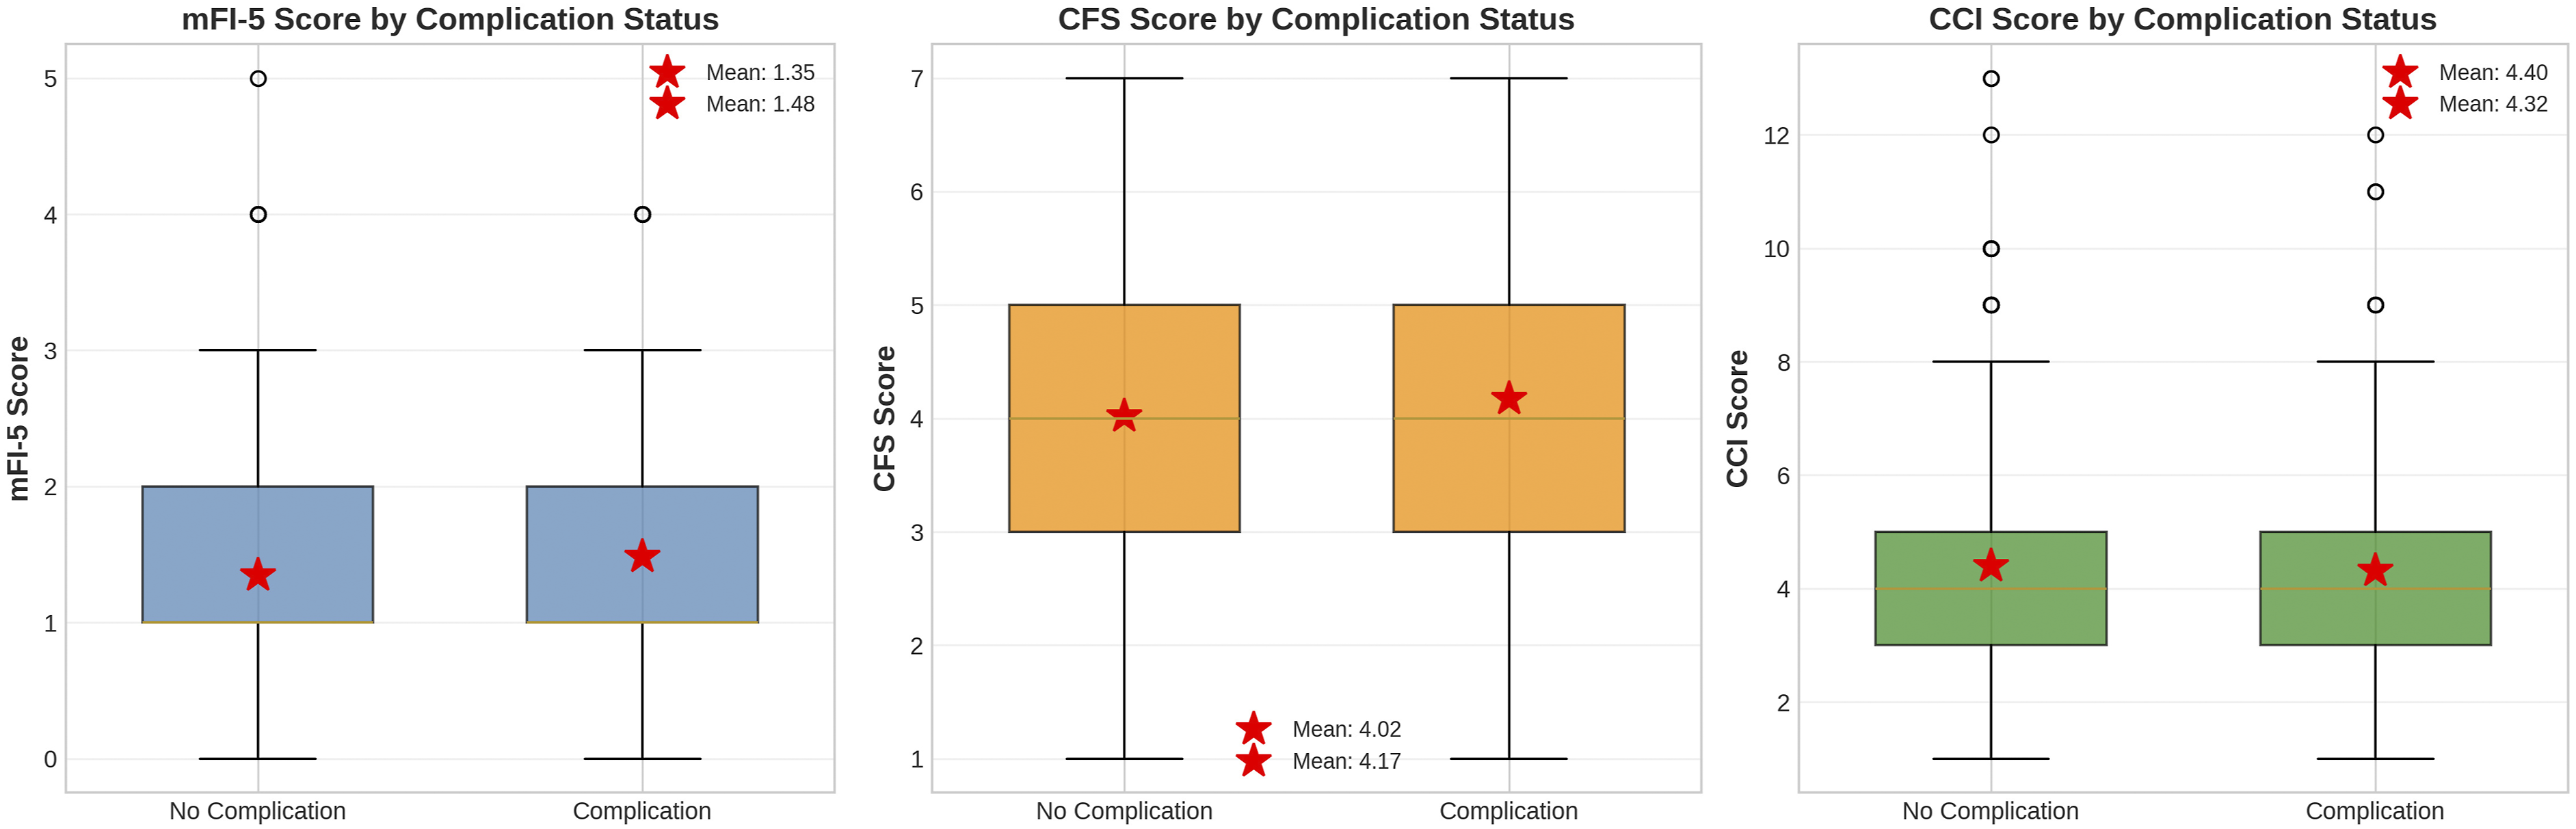
Frailty index scores by complication status. Box plots comparing (A) mFI-5 scores, (B) CFS scores, and (C) CCI scores between patients with and without postoperative complications. Red stars indicate mean values. Boxes represent interquartile range (IQR), whiskers extend to 1.5×IQR, and outliers are shown as individual points
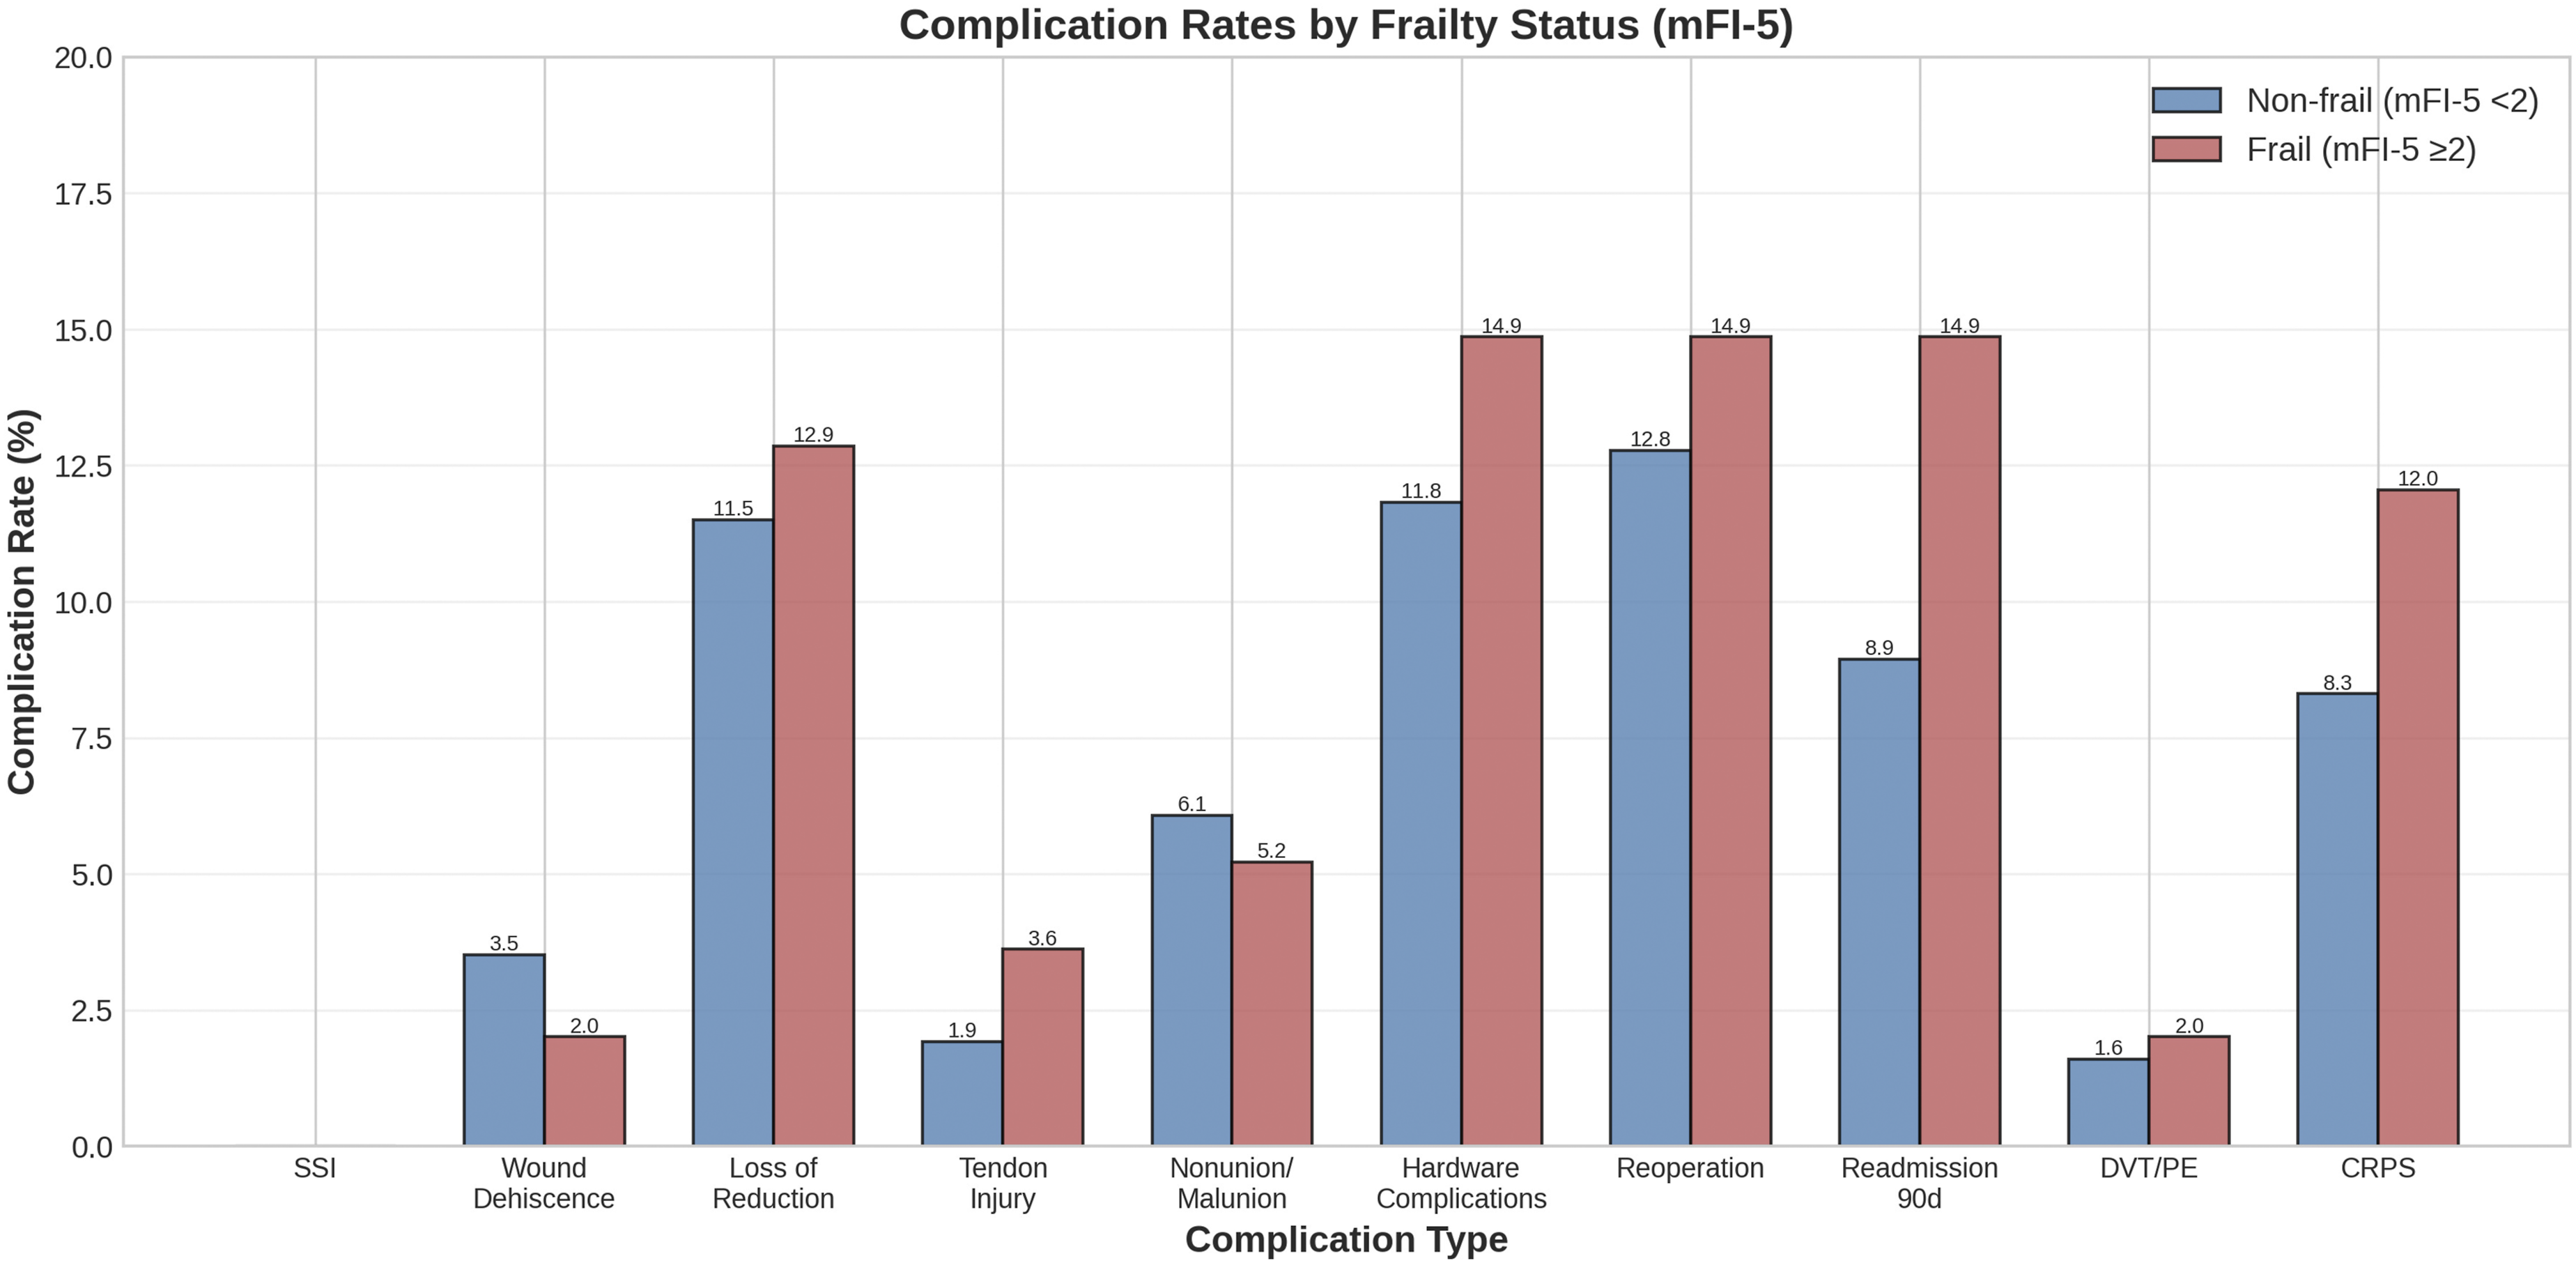
Complication rates by frailty status. Bar graph comparing complication rates between non-frail (mFI-5 <2) and frail (mFI-5 ≥2) patients. Error bars represent 95% confidence intervals. *P < 0.05 for 90-day readmission rate
When complications were stratified by surgical technique, the overall complication rates were 36.1% (136/377) for ORIF, 31.9% (38/119) for CRPP, and 31.8% (21/66) for external fixation (p=0.588). Hardware complications were more common in the ORIF group (15.4%) compared with CRPP (9.2%) and external fixation (9.1%; p=0.098). Loss of reduction was numerically higher following CRPP (15.1%) and external fixation (13.6%) compared with ORIF (10.9%; p=0.362). CRPS rates were comparable across techniques (ORIF 10.3%, CRPP 9.2%, external fixation 10.6%; p=0.925). No statistically significant differences in the overall or individual complication rates were observed among the three surgical modalities after adjustment for fracture complexity (AO/OTA type) and frailty status (mFI-5 ≥2). These findings suggest that the choice of surgical technique did not independently drive the primary composite outcome in this cohort.
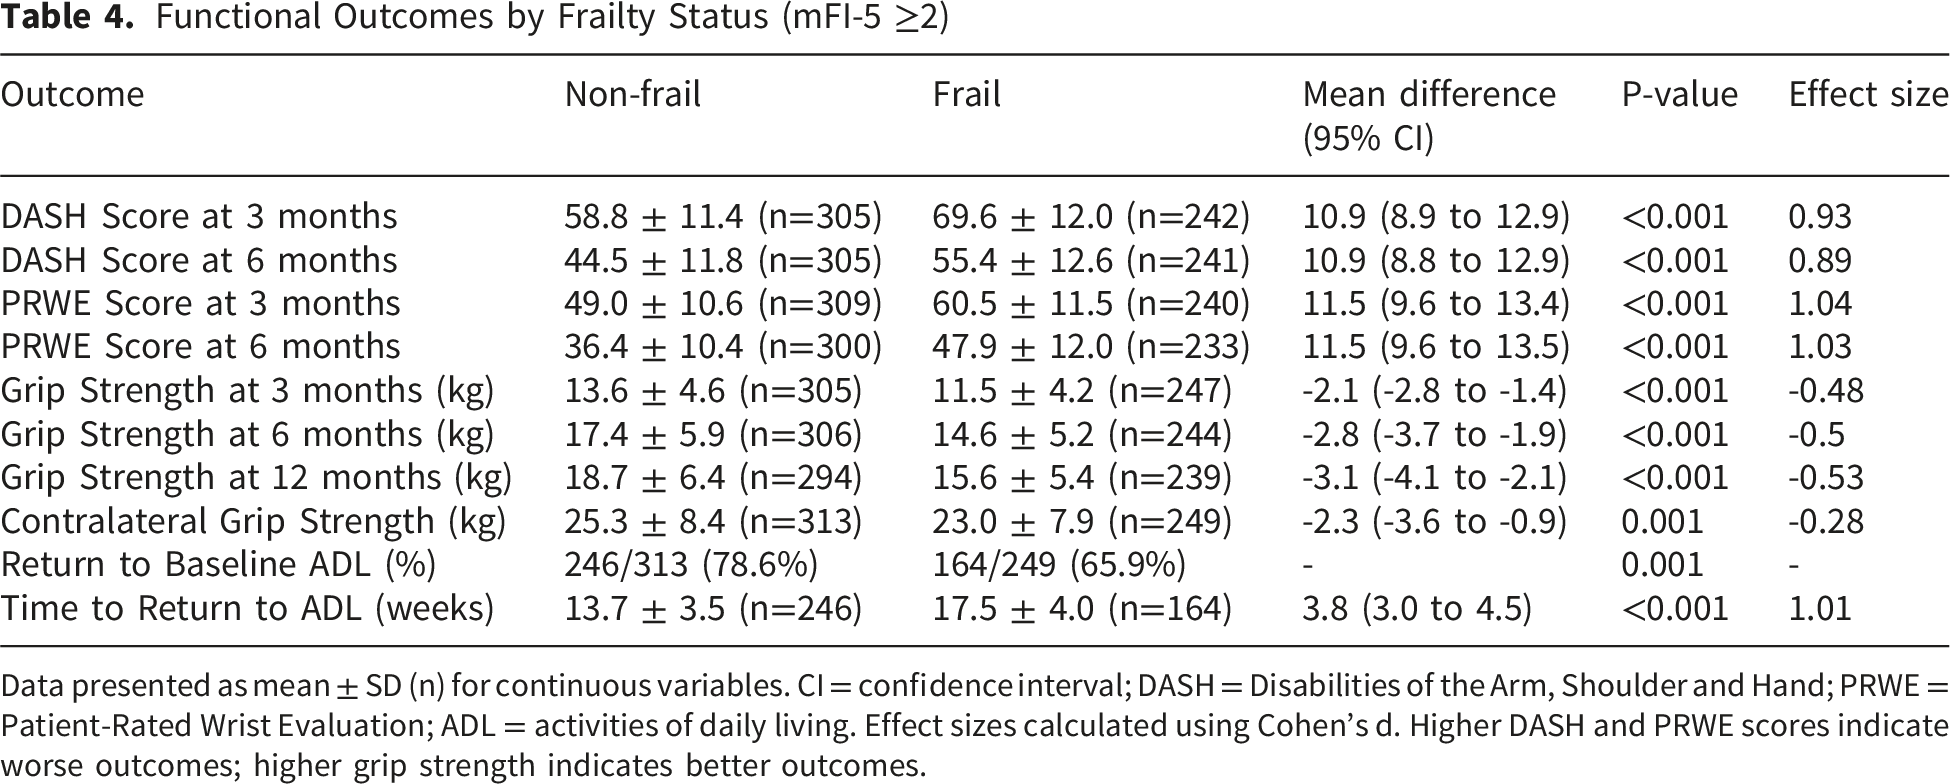
Functional Outcomes
Frail patients reported greater disability at 3 and 6 months (Table 4; Figure 5). • DASH: 69.6±12.0 vs 58.8±11.4 at 3 months; 55.4±12.6 vs 44.5±11.8 at 6 months (both p<0.001; mean differences 10.9 points; Cohen’s d 0.89–0.93). • PRWE: 60.5±11.5 vs 49.0±10.6 at 3 months; 47.9±12.0 vs 36.4±10.4 at 6 months (both p<0.001; differences 11.5 points; d 1.03–1.04). Functional Outcomes by Frailty Status (mFI-5 ≥2) Data presented as mean ± SD (n) for continuous variables. CI = confidence interval; DASH = Disabilities of the Arm, Shoulder and Hand; PRWE = Patient-Rated Wrist Evaluation; ADL = activities of daily living. Effect sizes calculated using Cohen’s d. Higher DASH and PRWE scores indicate worse outcomes; higher grip strength indicates better outcomes. Patient-reported functional outcomes by frailty status. Violin plots with overlaid box plots showing (A) DASH scores at 3 months, (B) DASH scores at 6 months, (C) PRWE scores at 3 months, and (D) PRWE scores at 6 months. Higher scores indicate worse disability. All differences p < 0.001. DASH = disabilities of the arm, shoulder and hand; PRWE = patient-rated wrist evaluation
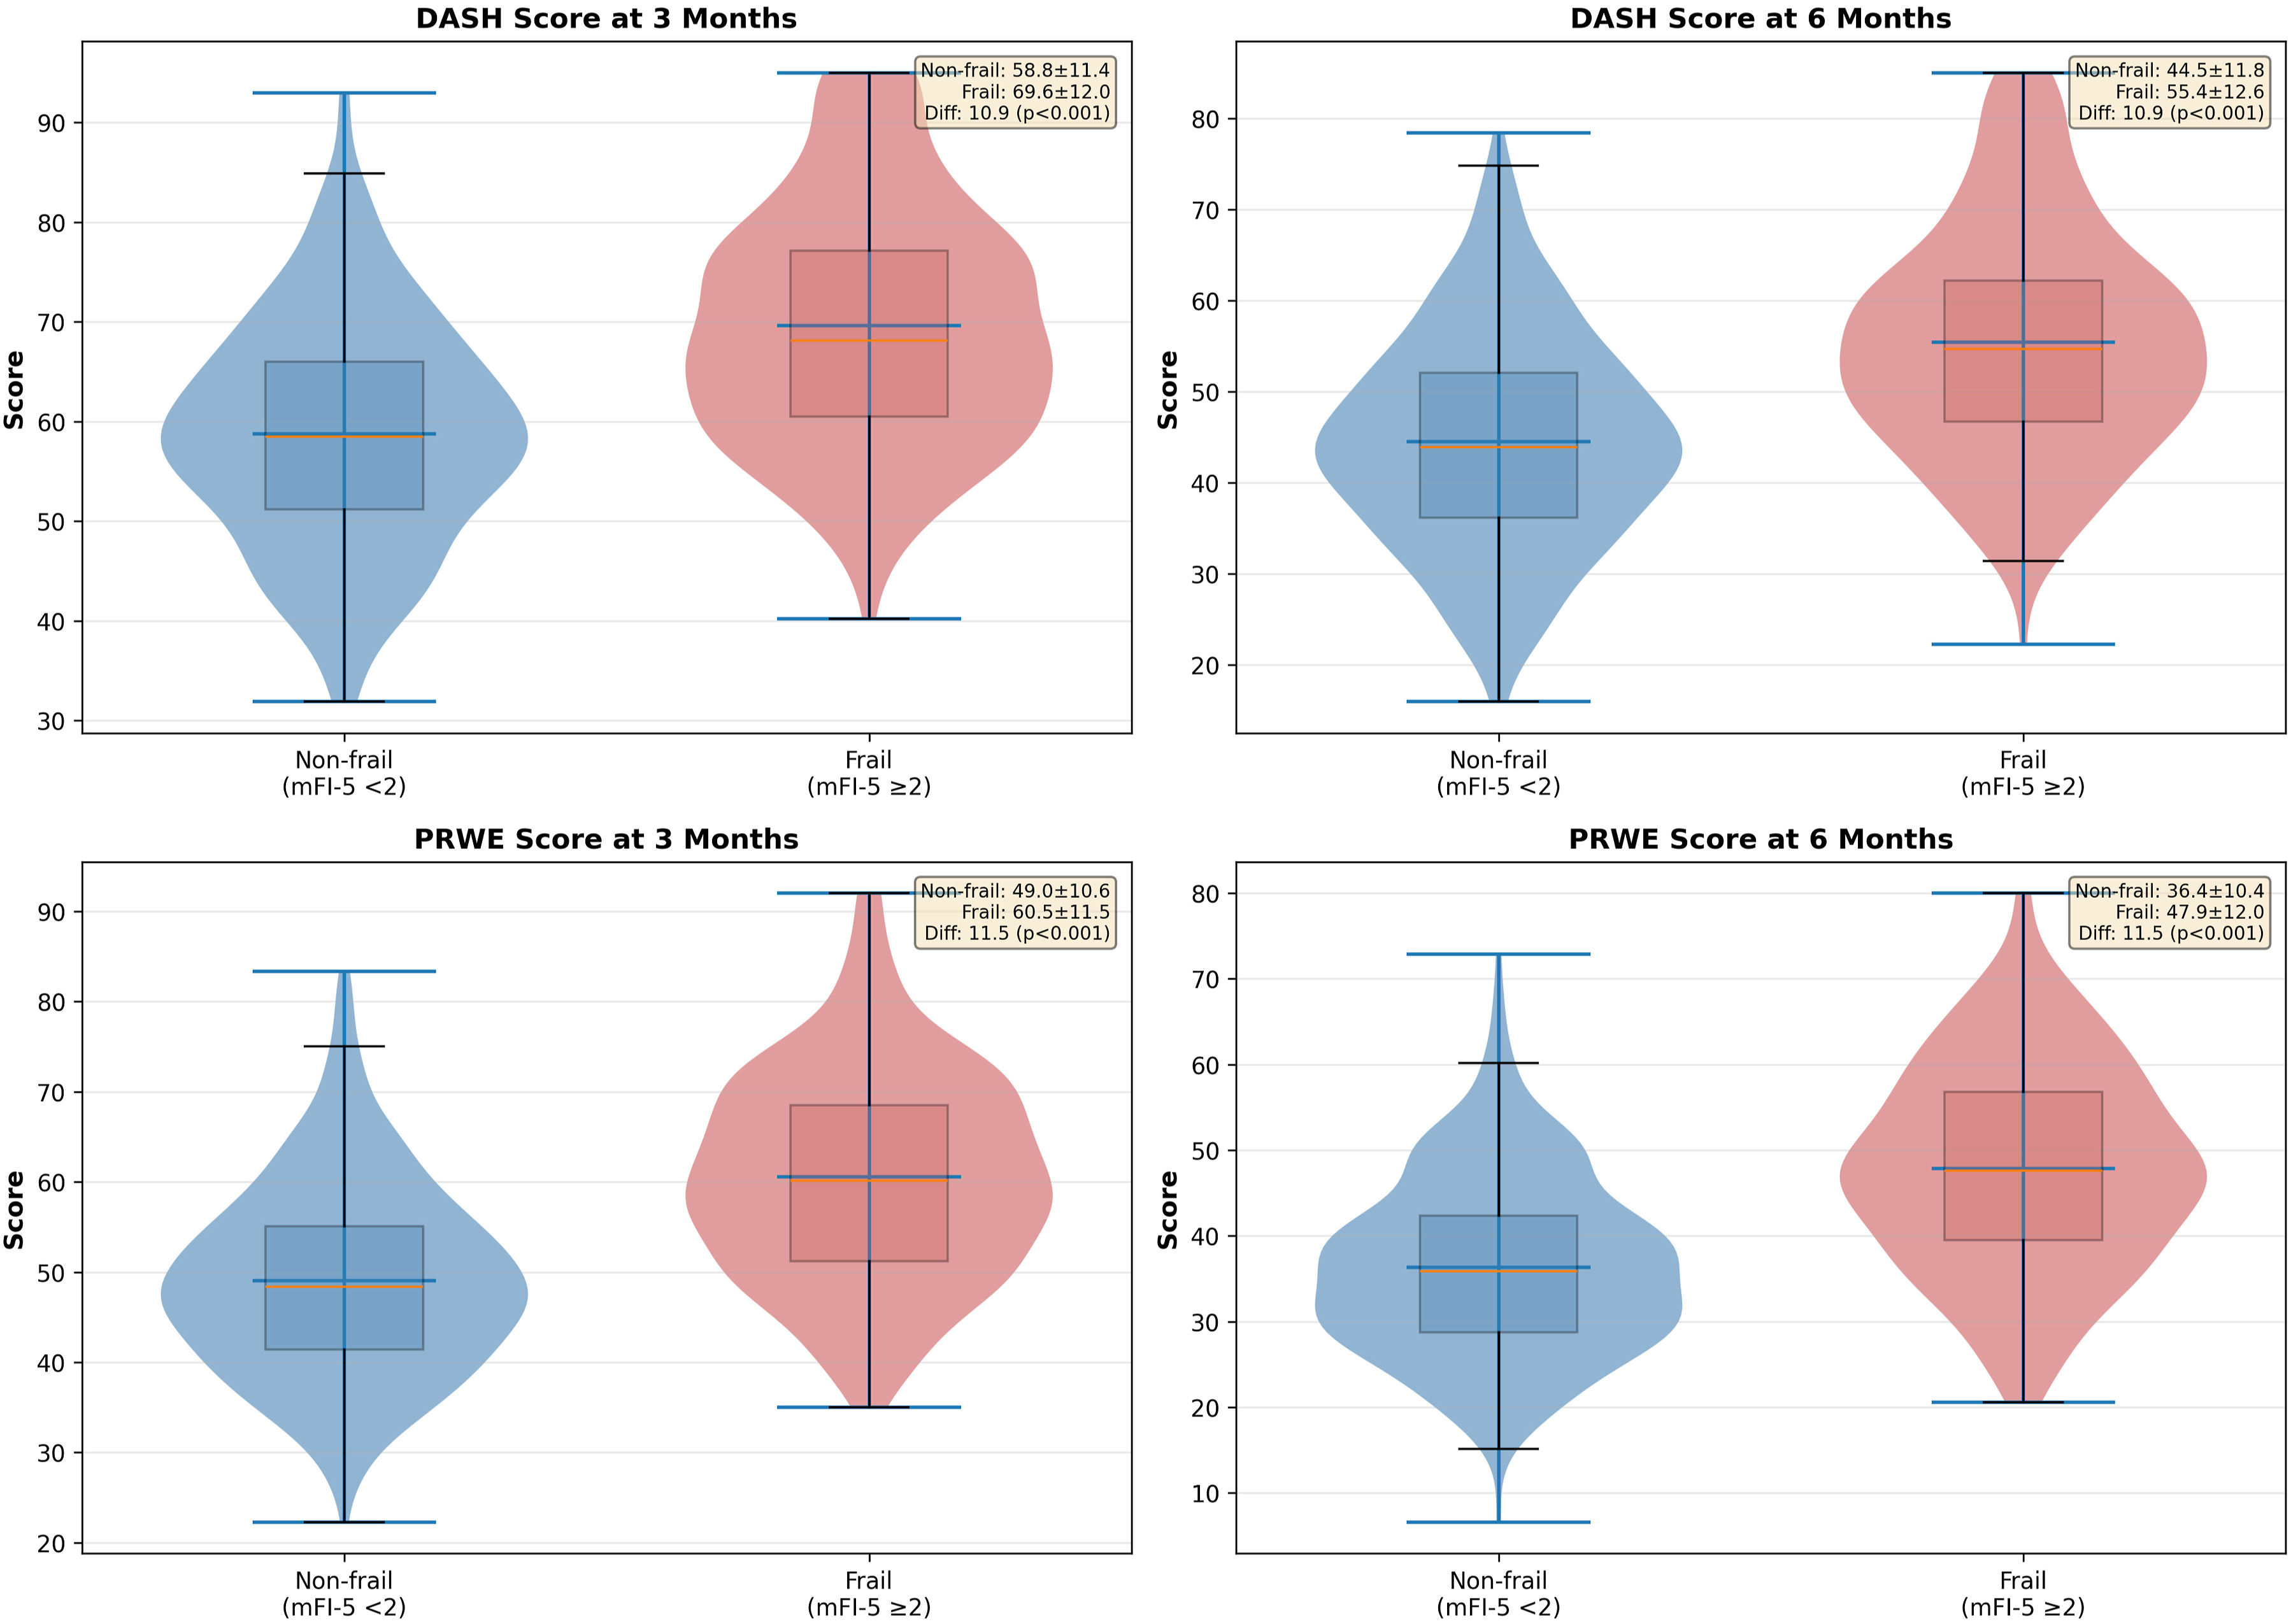
All differences exceeded established MCIDs.
Functional outcomes stratified by surgical technique revealed that 6-month DASH scores were 43.8±11.9 for ORIF, 47.2±12.5 for CRPP, and 50.1±13.0 for external fixation (p=0.002). Similarly, 6-month PRWE scores were 38.5±11.2 for ORIF, 41.3±11.8 for CRPP, and 44.6±12.4 for external fixation (p=0.004). Twelve-month grip strength recovery (as a percentage of contralateral) was 73.2% for ORIF, 69.8% for CRPP, and 66.5% for external fixation (p=0.011). However, when adjusted for fracture complexity (AO/OTA type) and frailty status, these differences were attenuated and no longer statistically significant (adjusted p=0.087 for DASH, p=0.112 for PRWE, and p=0.094 for grip strength), indicating that fracture severity and frailty were the primary determinants of functional recovery rather than surgical technique per se.
Grip Strength Recovery
Grip strength was consistently lower in frail patients (Figure 6). At 3 months: 11.5±4.2 vs 13.6±4.6 kg (Δ −2.1 kg; 95% CI −2.8 to −1.4; p<0.001; d=−0.48). At 6 months: 14.6±5.2 vs 17.4±5.9 kg (Δ −2.8 kg; p<0.001). At 12 months: 15.6±5.4 vs 18.7±6.4 kg (Δ −3.1 kg; p<0.001). Contralateral grip strength was also lower in frail patients (23.0±7.9 vs 25.3±8.4 kg; p=0.001). At 12 months, recovery reached 67.8% of contralateral in frail vs 74.1% in non-frail patients. Grip strength recovery by frailty status. (A) Box plots showing grip strength at 3, 6, and 12 months postoperatively for non-frail (blue) and frail (red) patients. (B) Recovery trajectory showing mean grip strength over time with error bars representing standard error of the mean. Gray dashed line indicates mean contralateral (uninjured hand) grip strength. All between-group differences p < 0.001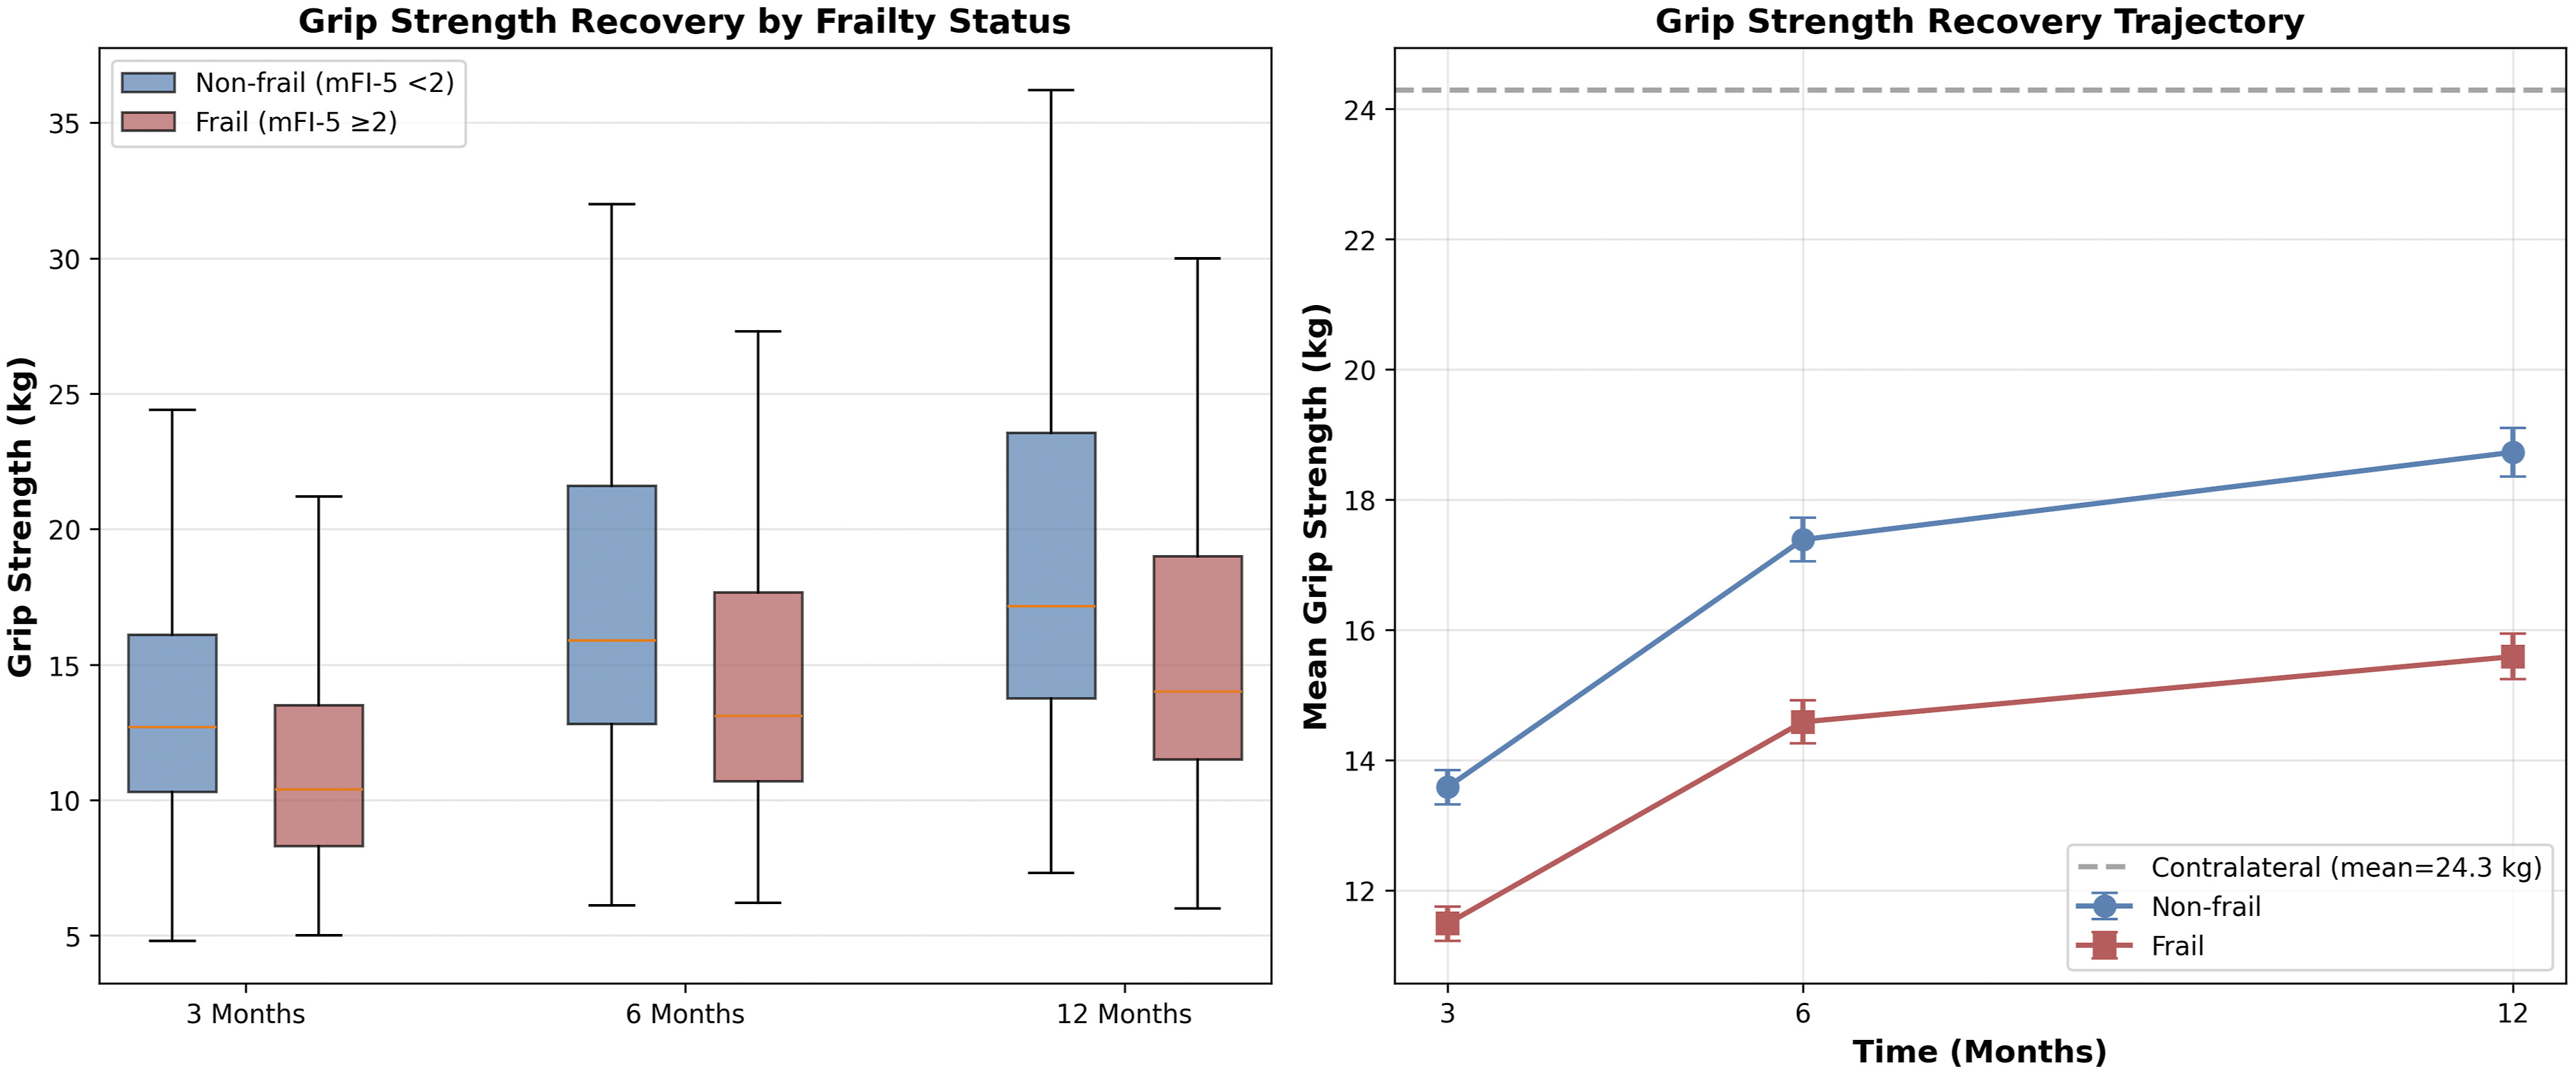
Multivariable Logistic Regression for Complications
Multivariable Logistic Regression Analysis for Any Complication
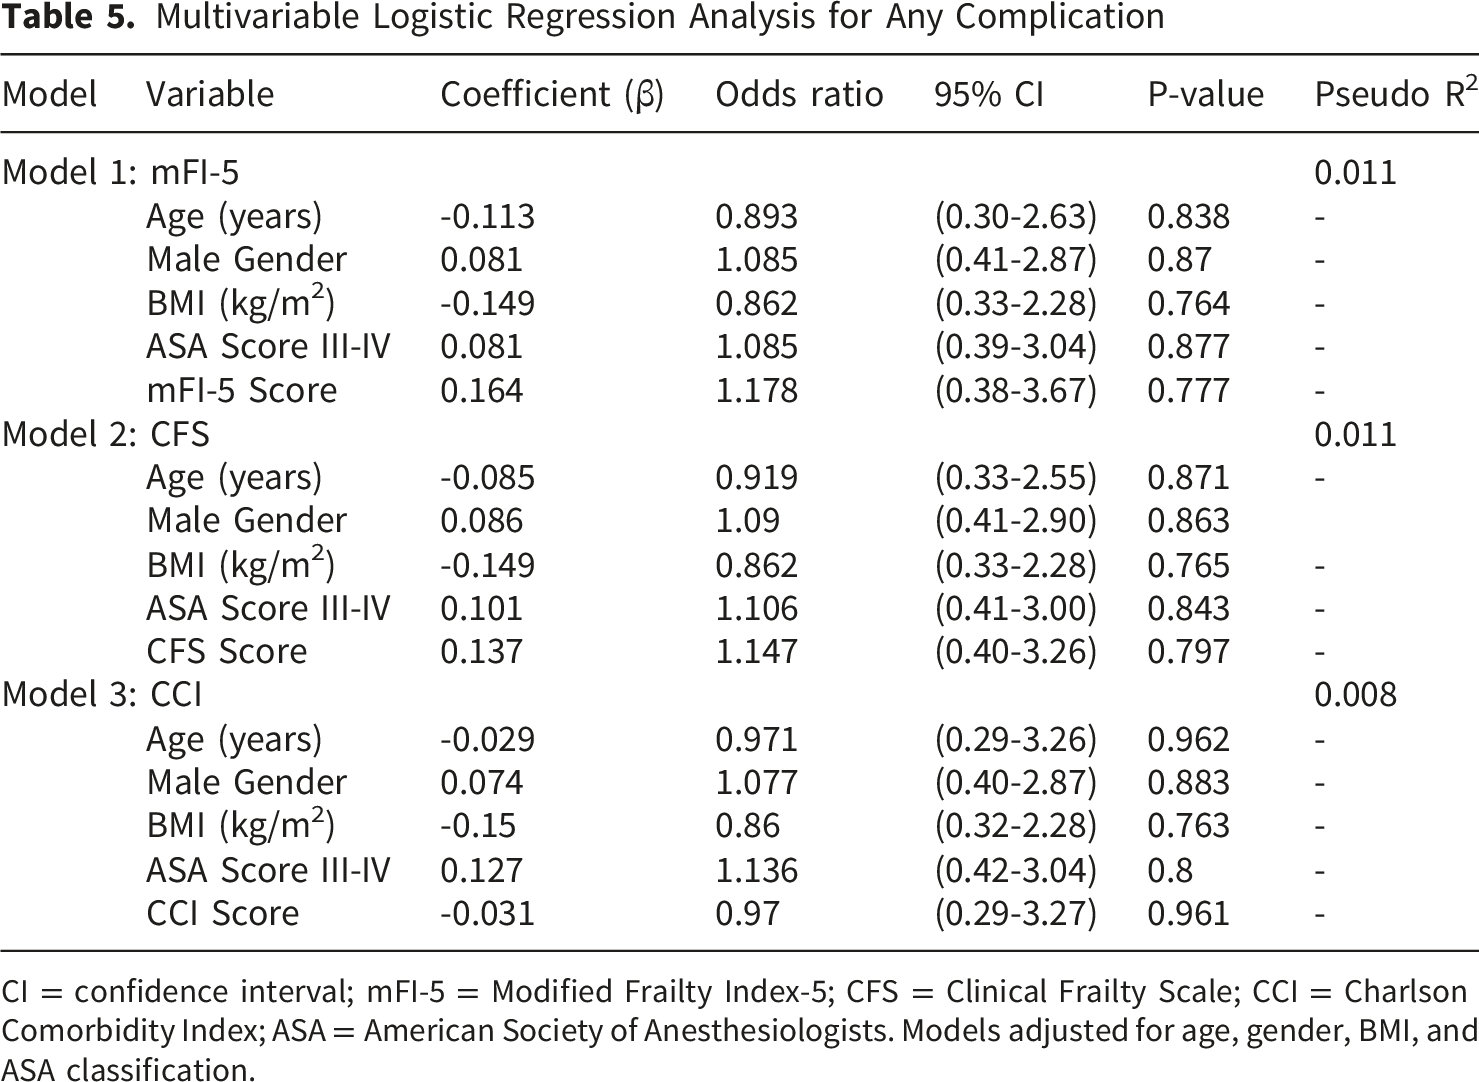
CI = confidence interval; mFI-5 = Modified Frailty Index-5; CFS = Clinical Frailty Scale; CCI = Charlson Comorbidity Index; ASA = American Society of Anesthesiologists. Models adjusted for age, gender, BMI, and ASA classification.
Return to Activities of Daily Living and Time-To-Event Analysis
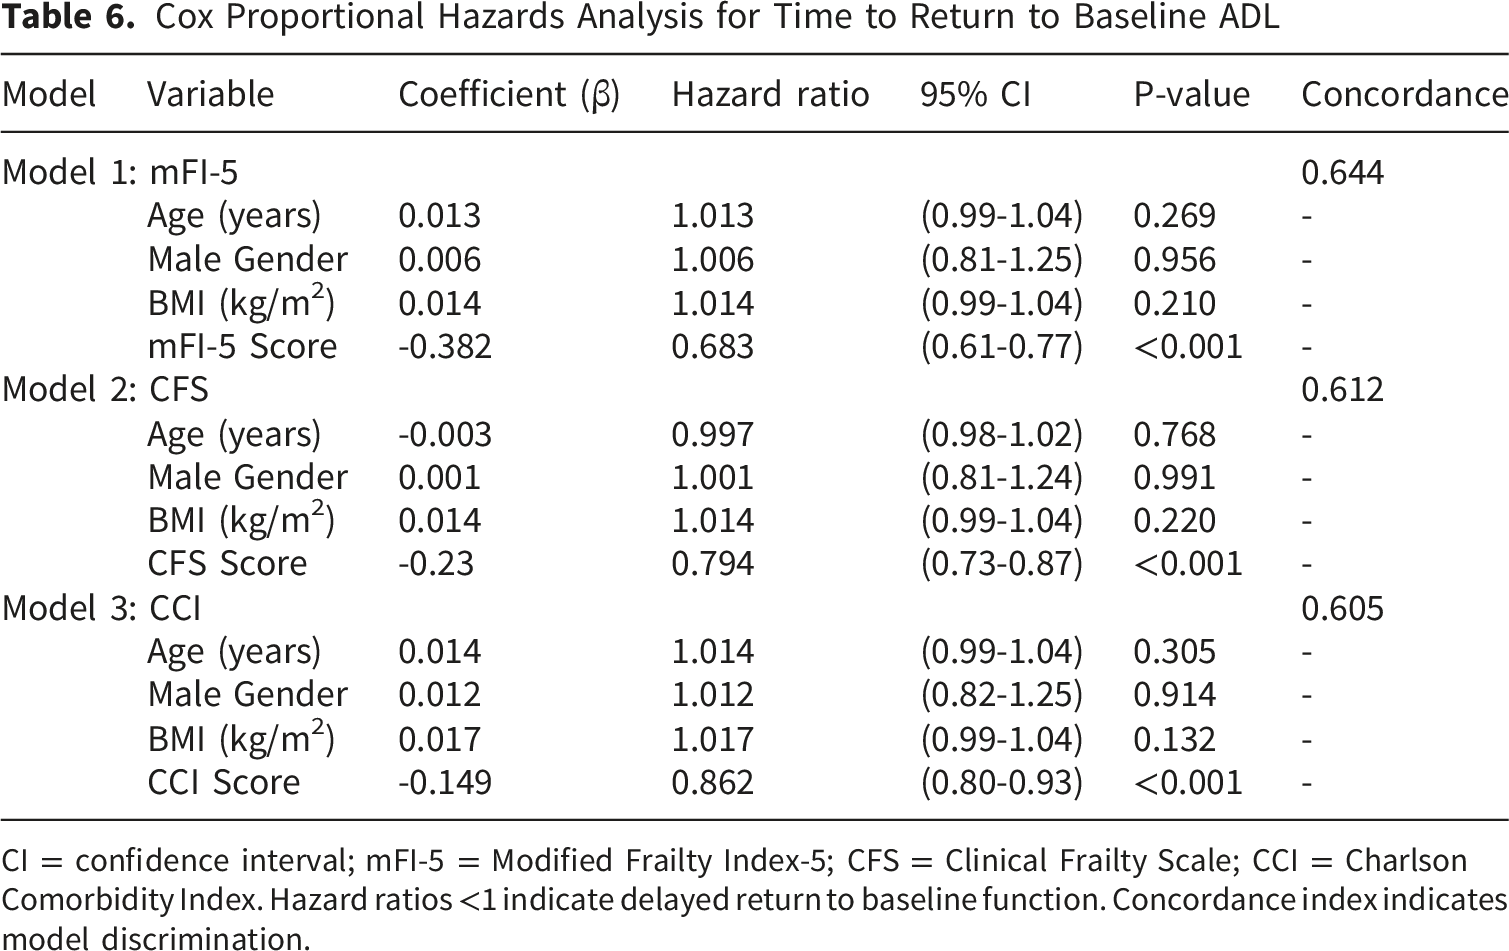
Return to baseline ADLs occurred in 65.9% of frail vs 78.6% of non-frail patients (absolute difference 12.7 percentage points; p=0.001) (Figure 7). Among those who recovered, frail patients required more time (17.5±4.0 vs 13.7±3.5 weeks; Δ 3.8 weeks; 95% CI 3.0–4.5; p<0.001; d=1.01). In Cox models, greater frailty was associated with delayed ADL recovery: mFI-5 HR 0.683 per point (95% CI 0.61–0.77; p<0.001; C-index 0.644), CFS HR 0.794 per point (95% CI 0.73–0.87; p<0.001; C-index 0.612), and CCI HR 0.862 per point (95% CI 0.80–0.93; p<0.001; C-index 0.605) (Table 6). Return to baseline activities of daily living. (A) Stacked bar chart showing percentage of patients who did (green) and did not (red) return to baseline ADL function by frailty status. (B) Violin plot with overlaid box plot showing time to return to baseline ADL among those who successfully returned. Both differences p ≤ 0.001 Cox Proportional Hazards Analysis for Time to Return to Baseline ADL CI = confidence interval; mFI-5 = Modified Frailty Index-5; CFS = Clinical Frailty Scale; CCI = Charlson Comorbidity Index. Hazard ratios <1 indicate delayed return to baseline function. Concordance index indicates model discrimination.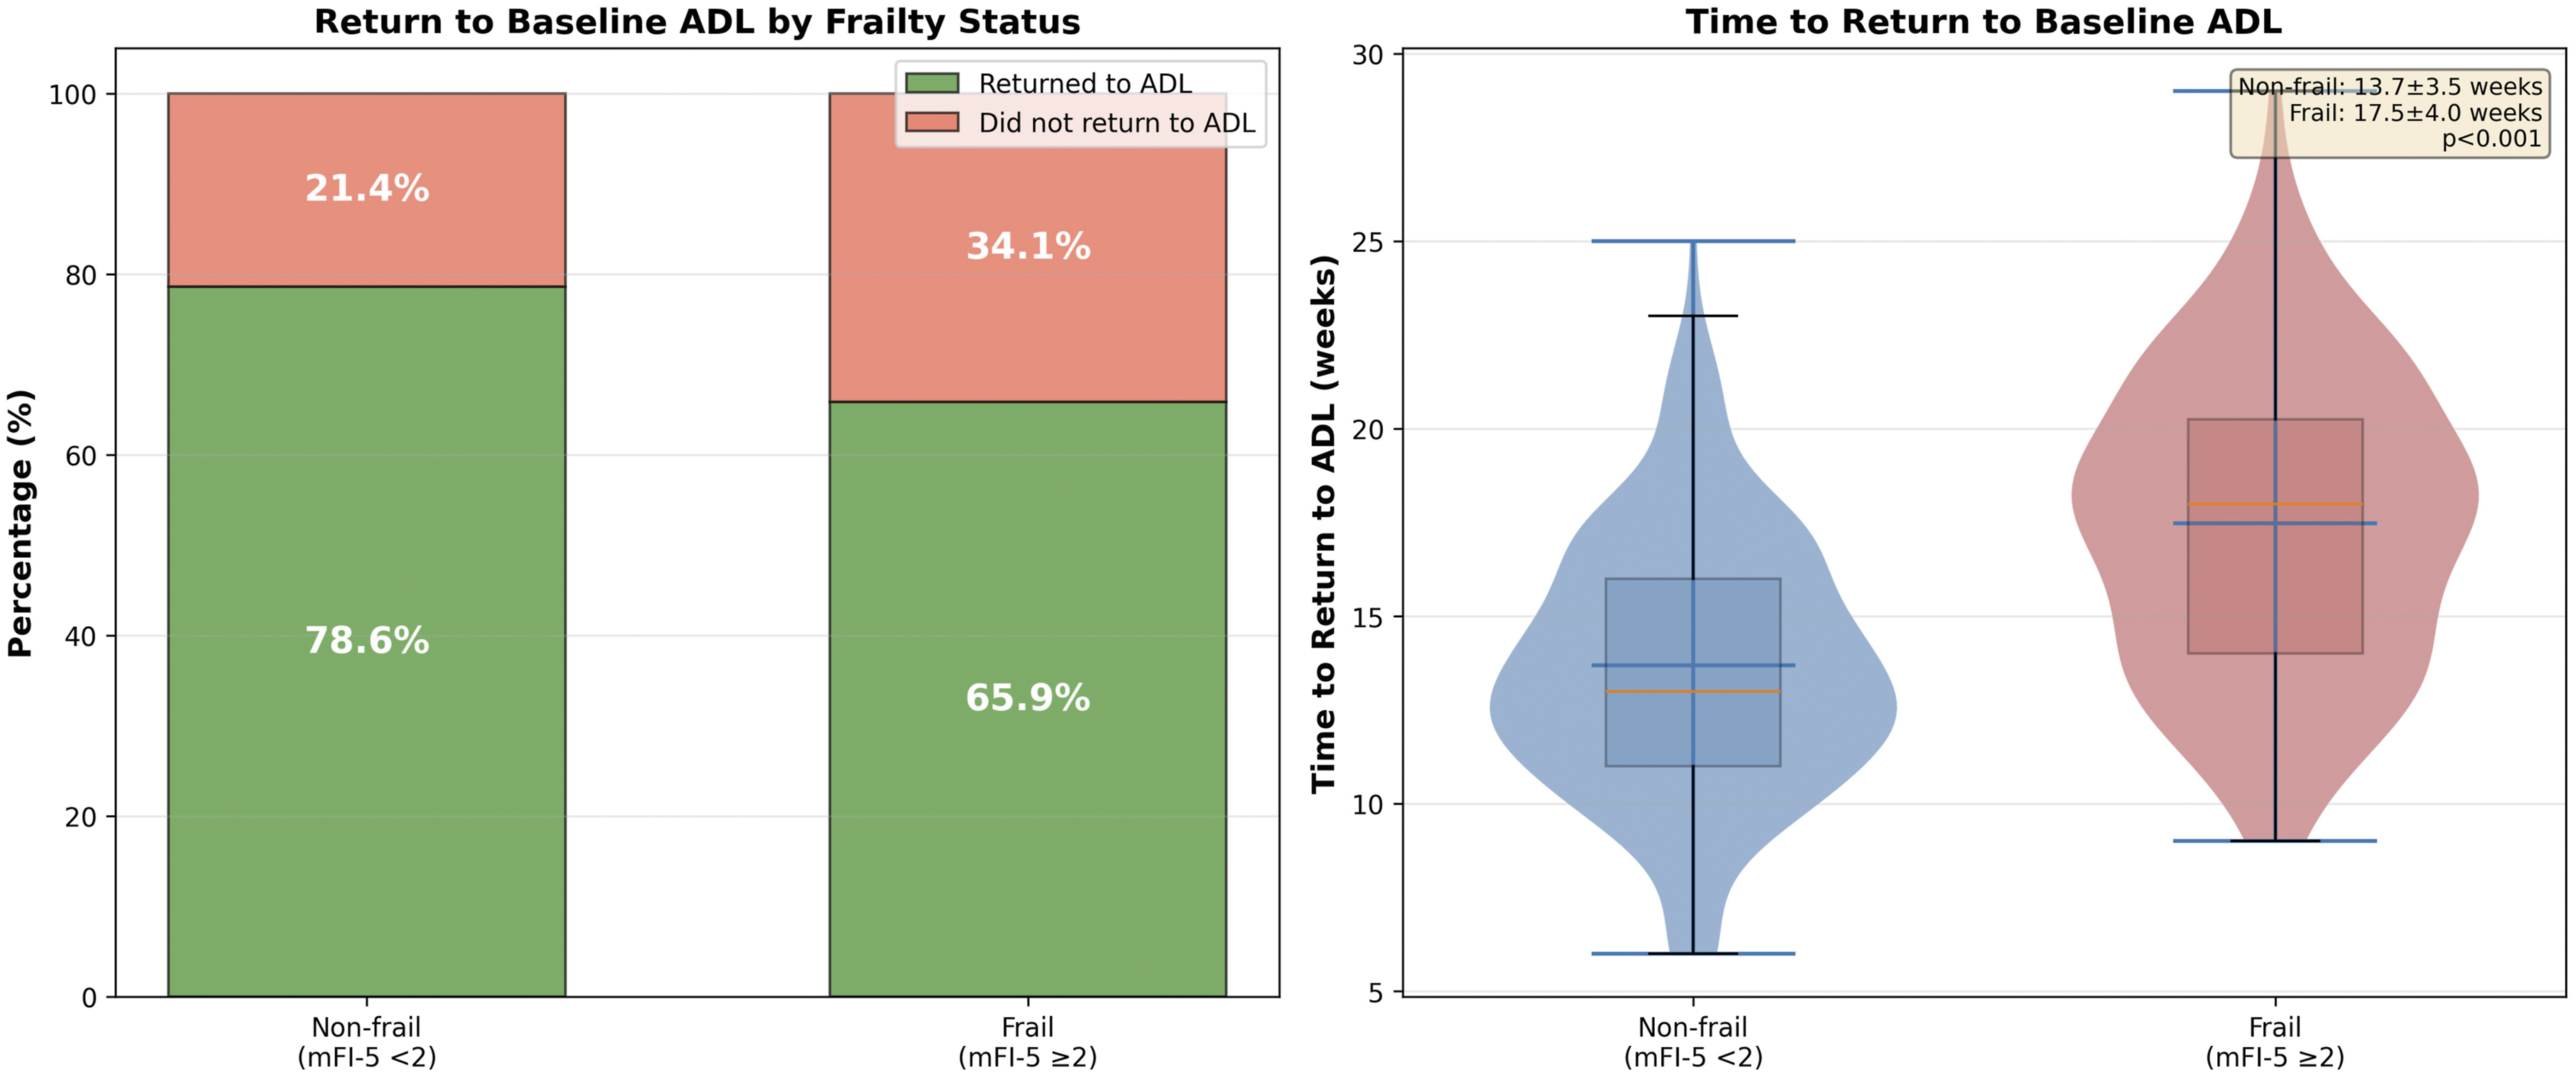
Predictive Modeling (Exploratory)
Predictive Model Performance Comparison for Postoperative Complications
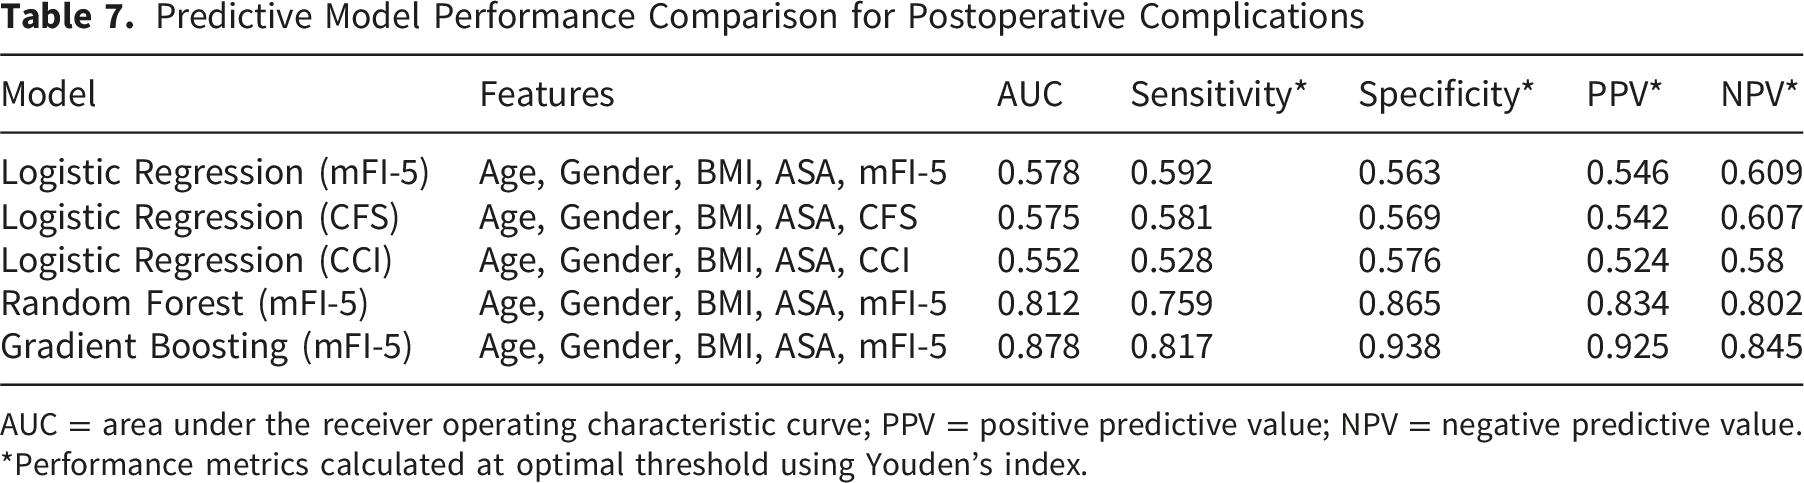
AUC = area under the receiver operating characteristic curve; PPV = positive predictive value; NPV = negative predictive value.
*Performance metrics calculated at optimal threshold using Youden’s index.
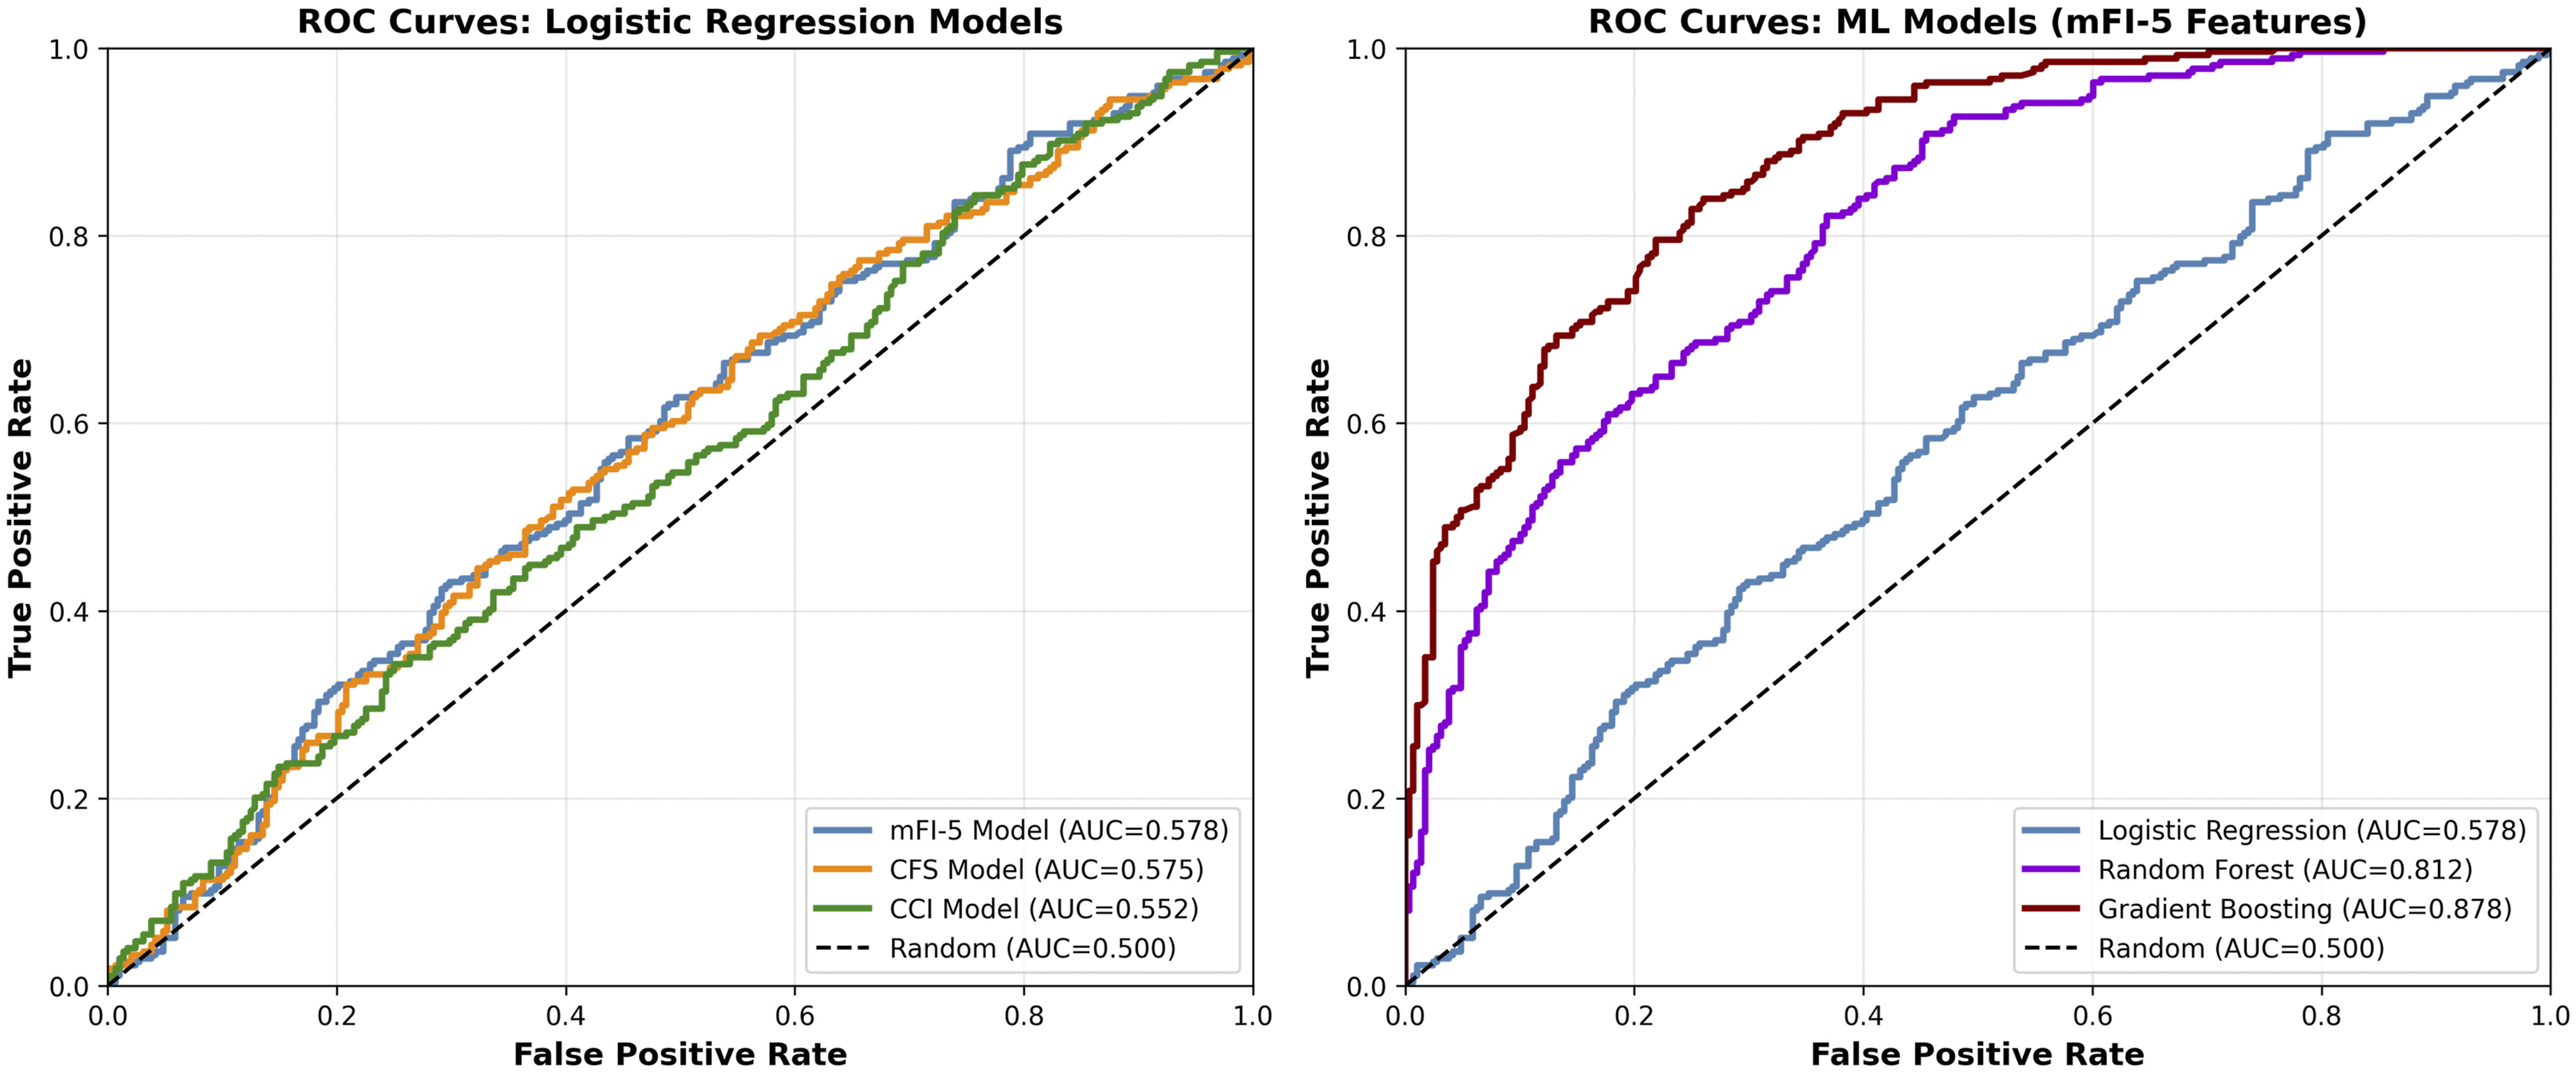
Receiver operating characteristic (ROC) curves comparing predictive models for postoperative complications. Traditional logistic regression models using individual frailty indices show modest discrimination (AUCs 0.552–0.578), whereas machine learning algorithms achieve superior performance (Random forest AUC 0.812; Gradient boosting AUC 0.878), demonstrating enhanced preoperative risk stratification capability
To assess whether incorporating surgical technique into the predictive models improved performance, we retrained the gradient boosting classifier with the addition of surgical modality as a feature. The augmented model yielded an AUC of 0.882 (95% CI 0.841–0.923), representing a marginal and non-significant improvement over the base model (ΔAUC = 0.004; p=0.68). Surgical technique ranked eighth in permutation importance, behind age, BMI, mFI-5, CFS, ASA class, CCI, and operative time. These findings suggest that while surgical technique contributes minimally to prediction of the composite complication endpoint, the model performance is primarily driven by patient-level characteristics rather than procedural factors.
Power Analysis and Mortality
Post hoc power was 81% for the observed difference in any complication (31.9% vs 38.2%; α=0.05; two-sided), >95% for DASH/PRWE differences, and >99% for grip strength and time-to-ADL differences. Thirty-day mortality was 1.1% (n=6) and 6-month mortality 2.7% (n=15), with nonsignificant trends toward higher mortality among frail patients.
Discussion
In this retrospective cohort of older adults undergoing surgery for distal radius fractures (DRFs), we compared three commonly used frailty/comorbidity tools—modified 5-item frailty index (mFI-5), Clinical Frailty Scale (CFS), and Charlson Comorbidity Index (CCI)—for their ability to predict postoperative complications and functional recovery. All three indices were associated with adverse postoperative profiles; however, their predictive performance differed by outcome domain. CFS aligned more closely with functional recovery (DASH, PRWE, grip strength, and return to ADLs), whereas mFI-5 showed relatively stronger alignment with health-care utilization events, particularly 90-day readmission. CCI captured comorbidity burden but provided limited discrimination for functional endpoints, consistent with prior observations in geriatric surgical cohorts.15,29,30
From a clinical standpoint, these findings carry important practical implications for the management of elderly patients with DRFs. The overall complication rate of 34.8% observed in our cohort underscores the substantial morbidity burden associated with DRF surgery in this age group, extending beyond what might be anticipated for a traditionally “minor” fracture. The predominance of hardware-related complications (13.2%), reoperation (13.7%), and CRPS (10.0%) emphasizes the need for heightened vigilance in postoperative surveillance. Furthermore, the mean 6-month DASH score of 55.4 in frail patients—representing moderate-to-severe disability—indicates that a significant proportion of frail older adults do not regain satisfactory upper-extremity function after surgery, which directly impacts their ability to perform basic self-care activities such as dressing, feeding, and hygiene. These functional deficits are clinically meaningful because they often precipitate a cascade of dependency, increased caregiver burden, and institutionalization in this vulnerable population.
These findings reinforce the growing evidence that physiological vulnerability, rather than chronological age alone, is central to outcomes in geriatric orthopaedic surgery. In line with recent DRF-focused and upper-extremity literature, frail patients demonstrate worse disability trajectories and delayed return to independence, beyond ASA class or age effects.31,32 The closer linkage of CFS to functional endpoints is biologically plausible given its emphasis on clinical fitness and function, which map directly to upper-extremity recovery.9,10 By contrast, mFI-5—being a concise comorbidity-driven index—may better reflect perioperative risk and resource use while being less sensitive to nuanced functional recovery; CCI quantifies disease burden without directly capturing functional reserve.8,15,25
Our findings are broadly consistent with the existing literature on frailty and orthopaedic outcomes, while also revealing some notable distinctions. Consistent with Gupta et al. 4 and Jones et al, 12 we found that frailty indices are associated with worse postoperative outcomes in orthopaedic populations; however, the limited standalone discrimination (AUC 0.53–0.58) observed in our DRF cohort is lower than that reported in hip fracture studies, where mFI-5 AUCs typically range from 0.62 to 0.71.4,8 This discrepancy may reflect the lower severity spectrum of DRFs compared with hip fractures, resulting in less heterogeneity in complication rates and consequently reduced discriminative ability. Our CRPS rate of 10.0% is consistent with the 8–15% range reported by Xu et al. 16 and Jo et al. 17 in DRF populations. Regarding functional outcomes, the DASH and PRWE differences between frail and non-frail patients (Cohen’s d 0.89–1.04) exceed those reported by Yam et al. 30 in sarcopenia-related DRF studies (d 0.45–0.65), suggesting that multidimensional frailty assessment captures functional vulnerability more comprehensively than sarcopenia measures alone. The superior performance of ML models (AUC 0.81–0.88) in our study aligns with findings by Bihorac 33 and Bertsimas et al. 34 in general surgical populations, supporting the broader applicability of ML-enhanced risk prediction across orthopaedic subspecialties.
We observed DRF-relevant complications at clinically meaningful rates, including CRPS, hardware-related issues, and loss of reduction. While most component rates were numerically higher among frail patients, only 90-day readmission reached statistical significance after adjustment, and single-index discrimination for complications was modest (AUCs ∼0.55–0.58). This aligns with reports that stand-alone frailty/comorbidity tools, though associated with outcomes, are insufficient for precise individual risk prediction in orthopaedic populations.10,31 Instead, they should serve as anchors within broader multivariable models that integrate clinical, radiographic, and treatment variables.
Our stratified analyses demonstrated that while unadjusted functional outcomes appeared to differ across surgical techniques (ORIF, CRPP, external fixation), these differences were no longer significant after accounting for fracture complexity and frailty status. This finding is clinically relevant because it suggests that the choice of surgical technique is largely dictated by fracture characteristics and patient factors, and that the prognostic value of frailty indices is not substantially confounded by surgical modality. Moreover, the inclusion of surgical technique in the ML models did not meaningfully improve predictive performance (ΔAUC = 0.004), further supporting the primacy of patient-level characteristics over procedural variables in determining outcomes. Nevertheless, we acknowledge that our study was not specifically designed or powered to detect differences among surgical technique subgroups, and dedicated studies with larger subgroup sample sizes are warranted to definitively evaluate technique-specific outcomes in frail elderly DRF patients.
Exploratory machine-learning models (random forest, gradient boosting) substantially improved discrimination compared with traditional regression, achieving AUCs of 0.81–0.88 with improved calibration after isotonic scaling. These findings parallel prior surgical and orthopaedic applications of ML that reported superior discrimination and calibration versus logistic regression.33,34 Age and BMI were dominant features, with mFI-5 contributing additional signal—underscoring the complementary rather than interchangeable roles of frailty and general clinical covariates. Given the internal-only validation, these models are hypothesis-generating; external validation and prospective impact assessments are needed to establish generalizability and clinical utility.33,34
It is important to contextualize the ML findings within a clinical framework. While the statistical performance metrics of the gradient boosting model (AUC 0.878, PPV 0.925) are encouraging, the clinical value of such a model lies in its potential to transform preoperative counseling and perioperative planning. For instance, a patient identified as high-risk by the ML model could be referred for prehabilitation to optimize functional reserve prior to surgery, scheduled for closer postoperative surveillance to detect early signs of CRPS or hardware failure, and connected with social support services to facilitate discharge planning and reduce readmission risk. Conversely, a patient classified as low-risk may be reassured that their expected functional trajectory is favorable, potentially reducing anxiety and improving patient satisfaction. Such risk-stratified approaches align with the broader movement toward personalized medicine in geriatric orthopaedics and represent a clinically actionable application of the statistical models presented herein.
Clinical implications are twofold. First, routine, structured frailty assessment appears justified in elderly DRF patients to inform shared decision-making, set expectations for functional recovery, and anticipate health-care utilization events.30,31 Second, integrating frailty metrics into multivariable or ML-based tools may enhance perioperative planning—identifying patients who might benefit from prehabilitation, intensified postoperative rehabilitation, closer surveillance for CRPS and hardware complications, and targeted discharge planning to reduce readmissions. 35
Strengths of this study include a relatively large single-center surgical cohort with minimum 12-month follow-up, parallel evaluation of three widely used indices, comprehensive functional assessment, and inclusion of exploratory ML modeling with calibration analyses. Limitations include the retrospective design and single-center setting, potential selection bias due to loss to follow-up, possible misclassification despite standardized criteria (e.g., CRPS adjudication per Budapest), and lack of assessor blinding for CFS. 25 We also did not evaluate longitudinal changes in frailty status, which may influence recovery trajectories. Additionally, a formal a priori sample size calculation was not performed, which represents a methodological limitation; however, post hoc power analyses confirmed adequate statistical power for the primary and secondary outcomes. The study was also not specifically powered to detect differences among surgical technique subgroups, which limits the conclusions that can be drawn from the stratified analyses of operative modalities.
Future work should prioritize multicenter prospective validation, standardized assessor training for CFS, and pragmatic trials of frailty-targeted interventions (e.g., prehabilitation and structured early rehabilitation) tailored to upper-extremity recovery goals.35,36 Development and external validation of parsimonious, clinically deployable risk tools that combine frailty metrics with key clinical and radiographic variables may help operationalize individualized pathways and reduce avoidable readmissions. 37
In summary, mFI-5, CFS, and CCI each capture distinct facets of risk in older adults undergoing DRF surgery. CFS better reflects functional recovery, whereas mFI-5—and to a lesser extent CCI—relates to complication and utilization risk. Used together, and augmented by multivariable or ML-based models, frailty assessment can enhance preoperative risk stratification and support personalized, goal-concordant care in elderly patients with DRFs.
Conclusions
In a surgical cohort of older adults with distal radius fractures, frailty/comorbidity measures were associated with postoperative outcomes but showed modest standalone discrimination for complications (overall complication rate 34.8%; regression AUCs ∼0.55–0.58). The Clinical Frailty Scale aligned most closely with functional recovery (DASH, PRWE, grip strength, and return to ADLs), whereas the modified 5-item frailty index related more to 90-day readmission; the Charlson Comorbidity Index reflected comorbidity burden with limited utility for functional endpoints. Exploratory machine-learning models outperformed traditional regression on internal validation (higher AUCs, improved calibration). These findings support routine, structured frailty assessment and its integration—alongside clinical and radiographic variables—into multivariable or ML-based tools to guide shared decision-making, target rehabilitation, and plan surveillance for high-risk patients. External, multicenter validation is needed to confirm generalizability.
Supplemental Material
Supplemental material - Predictive Performance of Frailty Indices for Complications and Functional Recovery After Distal Radius Fracture Surgery in Patients Aged ≥65 years
Supplemental material for Predictive Performance of Frailty Indices for Complications and Functional Recovery After Distal Radius Fracture Surgery in Patients Aged ≥65 years by Ekrem Özdemir, Fatih Emre Topsakal, Nasuhi Altay, Ayşe Güzin Özdemir in Geriatric Orthopaedic Surgery & Rehabilitation
Footnotes
Ethical Considerations
All experimental procedures were conducted in accordance with the guidelines of the Erzurum Medical Faculty Scientific Research Ethics Committee for Clinical Research and were approved by the committee (Approval No: 2025-10/257). The study complied with the principles of the Declaration of Helsinki.
Consent to Participate
Written informed consent was obtained from each participant prior to inclusion.
CRediT Authorship Contribution Statement
Funding
The authors received no financial support for the research, authorship, and/or publication of this article.
Declaration of Conflicting Interests
The authors declared no potential conflicts of interest with respect to the research, authorship, and/or publication of this article.
Data Availability Statement
No datasets were generated or analysed during the current study.
Supplemental Material
Supplemental material for this article is available online.
References
Supplementary Material
Please find the following supplemental material available below.
For Open Access articles published under a Creative Commons License, all supplemental material carries the same license as the article it is associated with.
For non-Open Access articles published, all supplemental material carries a non-exclusive license, and permission requests for re-use of supplemental material or any part of supplemental material shall be sent directly to the copyright owner as specified in the copyright notice associated with the article.