
Abstract
Background:
There is a pressing need to understand developmental patterns of adiposity as well as factors that influence it. Group-based trajectories, usually based on body mass index (BMI), have been used in adults and children to investigate adiposity trajectories. The objectives of this study were to identify sex-specific groups with similar longitudinal trajectories for fat mass index (FMI) and to compare sex-specific longitudinal trajectory groups on demographic and behavioral characteristics.
Methods:
This study employed a longitudinal design to examine patterns of age-related change in FMI-assessed adiposity in children transitioning from elementary to high school. FMI, moderate-to-vigorous physical activity (MVPA), sedentary behavior, and diet quality were measured at 5th, 6th,7th, 9th, and 11th grades when the children were 10–16 years of age. Sex-specific group-based trajectory analyses were conducted for FMI, and repeated ANOVAs were used to compare behaviors between trajectories.
Results:
Both boys’ (n = 320) and girls’ (n = 389) group-based trajectory analysis resulted in three groups, each with a low FMI and stable trajectory. In girls, two trajectories increased from 10 to 16 years of age, while in boys, one trajectory increased, and one decreased over time. In girls only, the groups differed by race and parent education. There were also group differences in MVPA for boys and in diet quality for girls.
Conclusions:
An accurate assessment of adiposity, FMI, was used to establish the trajectories in this study. The characteristics of the groups provide valuable information about when and for whom to target obesity prevention efforts.
Introduction
Overweight and obesity are associated with adverse health outcomes in adults1,2 and youth.3,4 Risk factors for overweight and obesity can appear during childhood,4,5 and childhood obesity can track into adulthood.6,7 The increased prevalence of overweight and obesity in all age groups in recent decades8,9 has created a pressing need to understand developmental patterns of adiposity and the factors that influence it.10,11
The prevalence of obesity in children varies by age, race/ethnicity, and family income. 12 Cross-sectional surveillance studies have shown that the prevalence of overweight and obesity increases with age during childhood and adolescence.12,13 However, longitudinal studies have observed high levels of inter-child variability in age-related change in weight status and adiposity.14,15 Group-based trajectory modeling has been used to identify population subgroups for adiposity in youth and adults.16,17 However, few studies have compared groups of children following similar developmental patterns on demographic and behavioral characteristics. Interventions to prevent overweight and obesity would be enhanced by understanding which young people are most likely to gain excessive weight and adiposity and how they differ behaviorally from other children. Specifically, information about how diet, physical activity, and sedentary behaviors differ between groups over time could help plan more effective obesity prevention interventions. 18
Longitudinal studies of weight status have typically examined body mass index (BMI).16,17,19 While BMI is a practical and useful metric in cross-sectional surveillance studies, it is less useful in longitudinal research aimed at understanding factors that influence change in adiposity. 20 BMI is a measure of weight adjusted for height and is not a measure of adiposity.21,22 Fat mass index (FMI, fat mass/height2) is a better measure of adiposity21,22 particularly for application in longitudinal studies, 20 but it is seldom used to create trajectories, although some studies have examined FMI as an outcome.23,24 Accordingly, the objectives of this study were to: 1) identify sex-specific groups with similar longitudinal trajectories for FMI in children transitioning from elementary to high school and 2) compare sex-specific longitudinal trajectory groups in terms of demographic and behavioral characteristics.
Methods
Study Design
This study employed a longitudinal design to examine patterns of age-related change in FMI-assessed adiposity in children transitioning from elementary to high school. Analyses were conducted separately for boys and girls since FMI trajectories differ by sex.25,26
Participants and Setting
Participants were from the Transitions and Activity Changes in Kids (TRACK) study, which followed children from elementary school (2010) to high school (2017).27–29 Fifth grade participants were enrolled in TRACK from 21 elementary schools in two school districts in South Carolina. Informed consent packets were sent home with the children for parents to read, complete, and return. Parents provided written consent in 5th grade (for 5th–7th grades) and 9th (for 9th–11th grades), and children provided verbal assent. Assessments were completed at 5th, 6th, 7th, 9th and 11th grades, with children ranging from 10–16 years of age. The Institutional Review Board at the University of South Carolina approved all study protocols.
Students self-reported age and sex, race (American Indian or Alaskan Native, Asian, Black or African American, Native Hawaiian or Pacific Islander, White, or Other) and ethnicity (Hispanic or Latino). In 5th grade, 1083 children (502 boys and 581 girls) were recruited into the TRACK study. Approximately 35% of the children were Black, 36% White, 11% Hispanic, and 17% other race/ethnicity. Mean age at 5th grade was 10.6 ± 0.6 years and mean BMI was 21.2 ± 4.9 kg/m2. FMI was available for 921 children in 5th grade. Students were excluded from the analyses due to not having two or more measures from 6th, 7th, 9th and 11th grade (n = 140), missing parent education (n = 25), missing race/ethnicity (n = 1), or missing 5th grade MVPA (n = 62). The analytic sample (n = 709) did not differ from those who were excluded (n = 211) by sex or parent education but had a higher percentage of Black and White participants than those excluded (Supplementary Table).
Measures
Fat mass index
Adiposity was operationally defined as FMI, which provides an accurate assessment of adiposity in children and adolescents.21,22 Beginning at 5th grade and for each subsequent measure, total body bioelectrical impedance (RJL Quantum II BIA systems; Clinton Township, MI) was measured according to the manufacturer’s standard protocol on the right side (hand to foot). Fat-free mass (FFM) was calculated using the following equation: FFM = [3.474 + (0.459 × Height2/Resistance) + (0.064 × Weight)]/(0.769 − (0.009 × Age) − 0.016 × Sex), where 1 = boys, 0 = girls. 30 Fat mass was determined by subtracting FFM from body weight, and FMI was calculated by dividing fat mass by height (m2). Height and weight were measured by trained staff after participants removed heavy clothing and shoes. Children’s standing and seated heights were measured to the nearest 0.1 cm using a portable stadiometer (Seca, Hamburg, Germany). Weight was measured to the nearest 0.1 kg using an electronic scale (Model 770; Seca, Hamburg, Germany). BMI was calculated using the standard equation (kg/m2).
Physical activity and sedentary behaviors
At each time point, children wore an accelerometer (ActiGraph GT1M and GT3X models, Pensacola, FL) on the right hip for seven consecutive days during waking hours. Data were collected and stored in 60-second epochs. Any period of 60 or more minutes of consecutive zeros was considered non-wear time and recoded to missing. Moderate-to-vigorous physical activity (MVPA) was calculated using an age-specific prediction equation 31 generalized to the mean age of the TRACK cohort. The threshold for MVPA was 2200 counts/minute, corresponding to 4.0 metabolic equivalents (METs, 1 MET = 3.5 mL O2 kg−1 min−1). Counts < 100/minute were considered sedentary. Data for Sundays were excluded due to low wear time. Eighty percent of the 5th grade sample and 87% of the 11th grade sample met accelerometer data inclusion criteria. Missing values were imputed using a sex-specific multiple imputation method via PROC MI in SAS (Version 9.4; SAS Institute, Inc., Cary, NC, USA) for each year using children with ≥8 hours on ≥2 days. MVPA and sedentary time per day were divided by minutes of wear time to produce minutes per hour to adjust for inter-individual differences in accelerator wear time.
Diet quality
At each time point, dietary intake was assessed by the Block Food Screener for Kids, previously validated with 24-hour recalls in 10–17-year-olds. 32 The screener asks whether 41 specific food items were consumed in the last week. If a child responded yes to a food item, he/she was asked on how many days the item was consumed and the usual amount eaten (e.g., a little, some, a lot). For the present study, a measure of diet quality using information from the food screener was created based on a protocol from the Healthy Eating Index (HE-2010). 33 Briefly, specific components were chosen to reflect healthy dietary patterns, including total vegetables, total fruit, whole grains, dairy, and total protein. The overall score was calculated on a per calorie basis and adjusted for energy intake. Values >5000 kcal/day and <50 kcal/day were considered implausible, and those children were excluded from the analysis for that measurement period. 34 Higher scores indicated better diet quality, with each component having a maximum score of 10 points, for a total maximum score of 50 points.
Maturity offset
Maturity offset was calculated using sex-specific equations.35,36 This noninvasive method predicts peak velocity using anthropometric variables. A negative maturity offset represents the number of years the child is from reaching peak height velocity, while a positive maturity offset represents the number of years a child is beyond peak height velocity. Maturity offset at 5th grade was included as a covariate in analyses.
Statistical Analysis
Descriptive statistics were calculated by sex. Chi-square analyses and t-tests were used to assess differences between boys and girls in demographic variables, 5th grade maturity offset, MVPA, sedentary behavior, and diet quality. T-tests were also used to determine if differences between boys and girls existed for FMI.
To identify patterns of trajectories of the five FMI measurements by child’s age, group-based trajectory analyses with PROC TRAJ 37 in SAS (version 9.4) were conducted by sex, using the CNORM distribution for continuous data. Both linear and quadratic trajectories for 1, 2, 3, and 4 groups were tested. The final number of groups was determined by Bayesian Information Criterion (BIC), the proportion of participants in the group, and the change in BIC between models (estimate of logged Bayes factor-2ΔBIC). 37 A 10-fold difference in Bayes factor is considered a meaningful difference. As confirmation for the number of groups chosen, posterior probabilities and odds of correct classification (OCC) were calculated.38,39 After the number of groups was determined, models were rerun eliminating nonsignificant quadratic terms, and analyses examined differences in demographic variables among the groups. Using the same methods, trajectories were also examined by grades 5–11.
To examine differences between the FMI groups for MVPA, sedentary behaviors, and diet quality, two-way repeated measure ANOVA (FMI group = 3 by grade = 5) was conducted in Proc Mixed by sex. Least-square means for the behavioral outcomes MVPA, sedentary behavior, and diet quality were examined for FMI groups by grade after adjustment for race, parent education, and 5th grade maturity offset.
Results
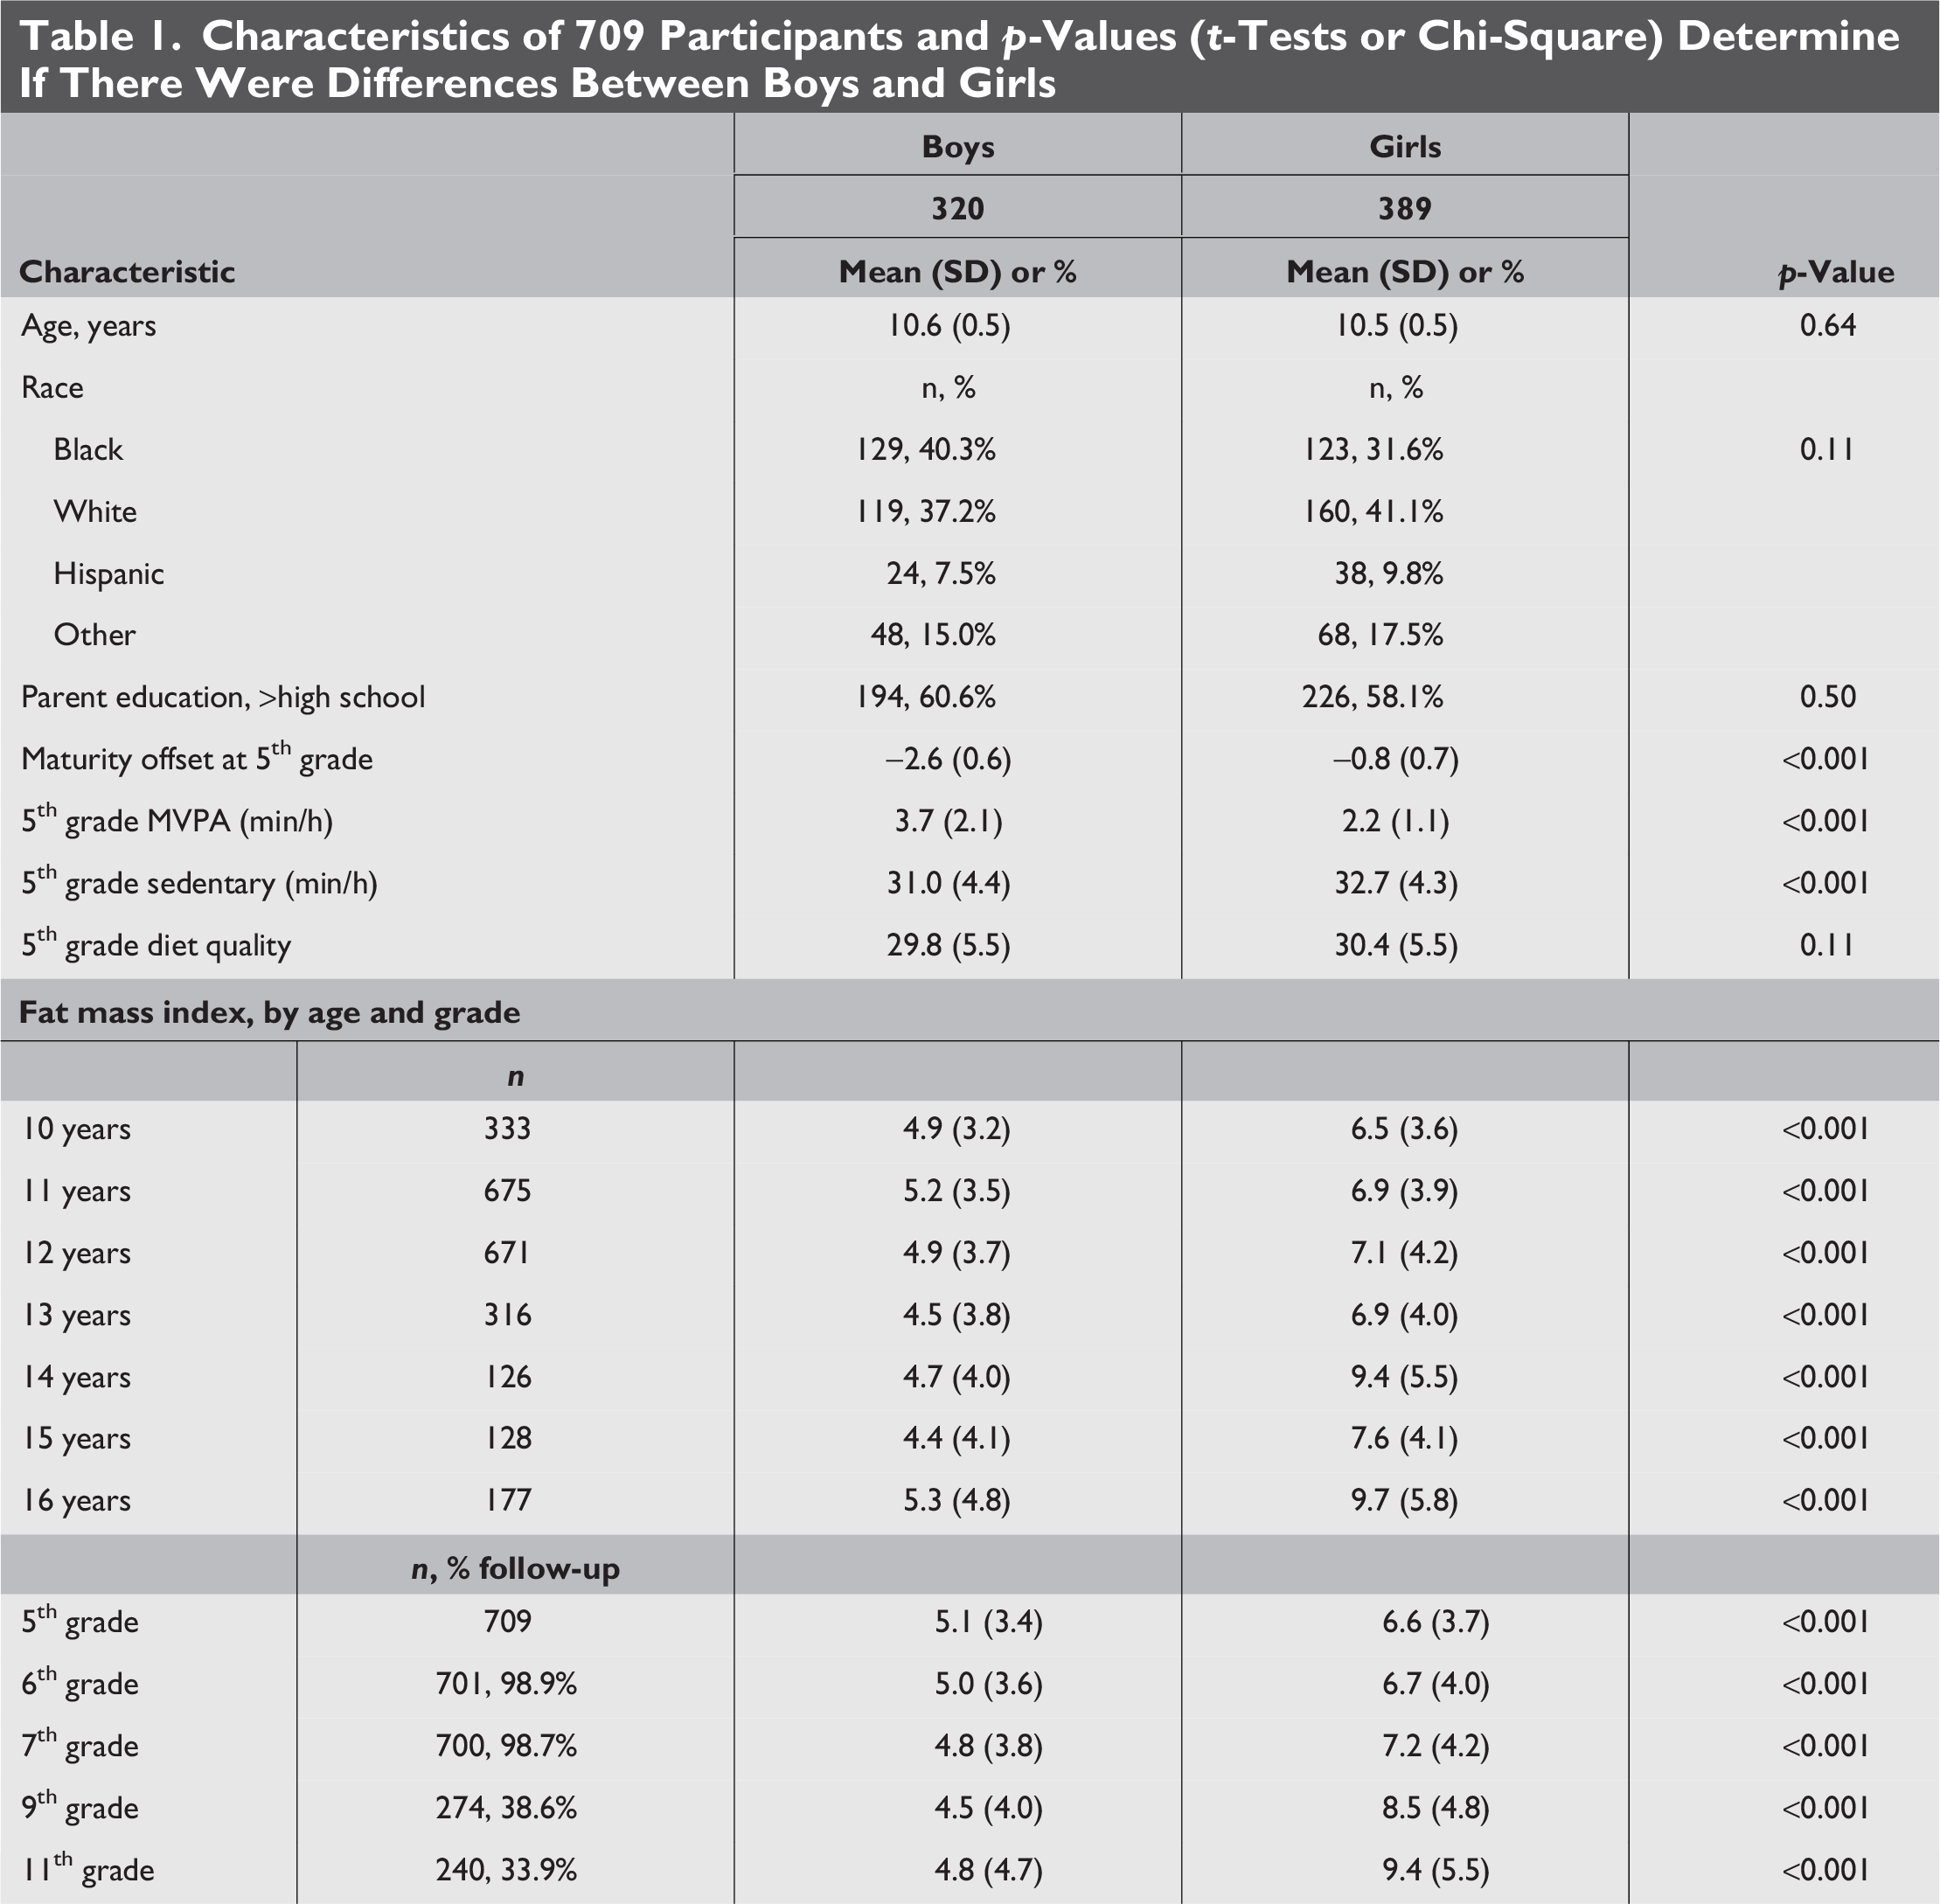
Of the 709 participants, 45% were boys (Table 1), ∼36% were Black, 39% White, 9% Hispanic, and 16% other race/ethnicities. Fifty-nine percent of the children had one or more parents with higher than a high school education. At baseline, boys had lower physical maturity, lower sedentary behavior, lower FMI, and higher MVPA compared with 5th grade girls (p < 0.001). The trajectory of FMI declined from 10 to 16 years of age in boys but increased in girls. Consistent with findings from others,40–42 we found that weight gain was greatest in the subgroup of children who were heaviest at baseline.
Characteristics of 709 Participants and p-Values (t-Tests or Chi-Square) Determine If There Were Differences Between Boys and Girls
Three FMI trajectories were identified separately for boys and girls (Table 2) using BIC, 2Δ BIC, and consideration of group size and were supported by the posterior probability and OCC. In boys (Fig. 1), FMI in Group 1 declined over time, in Group 2 remained constant, and in Group 3, increased from age 10 to age 16. In girls (Fig. 2), FMI in Group 1 remained constant, while FMI increased in Groups 2 and 3. Analyses using grade are similar to age trajectories (See Supplementary Figs.).

FMI trajectory groups (solid lines with 95% confidence intervals) in boys ages 10–16 years. Group 2, Lower, n = 183, 57%  Group 1, Mid, n = 95, 30%
  Group 3, Upper, n = 42, 13%.
FMI trajectory groups (solid lines with 95% confidence intervals) in girls ages 10–16 years. Group 1, Lower, n = 230, 59% Group 2, Mid, n = 115, 30% Group 3, Upper, n = 44, 11%.
Determining Number of Groups for Boys and Girls and Assignment Accuracy (Posterior Probability and OCC)
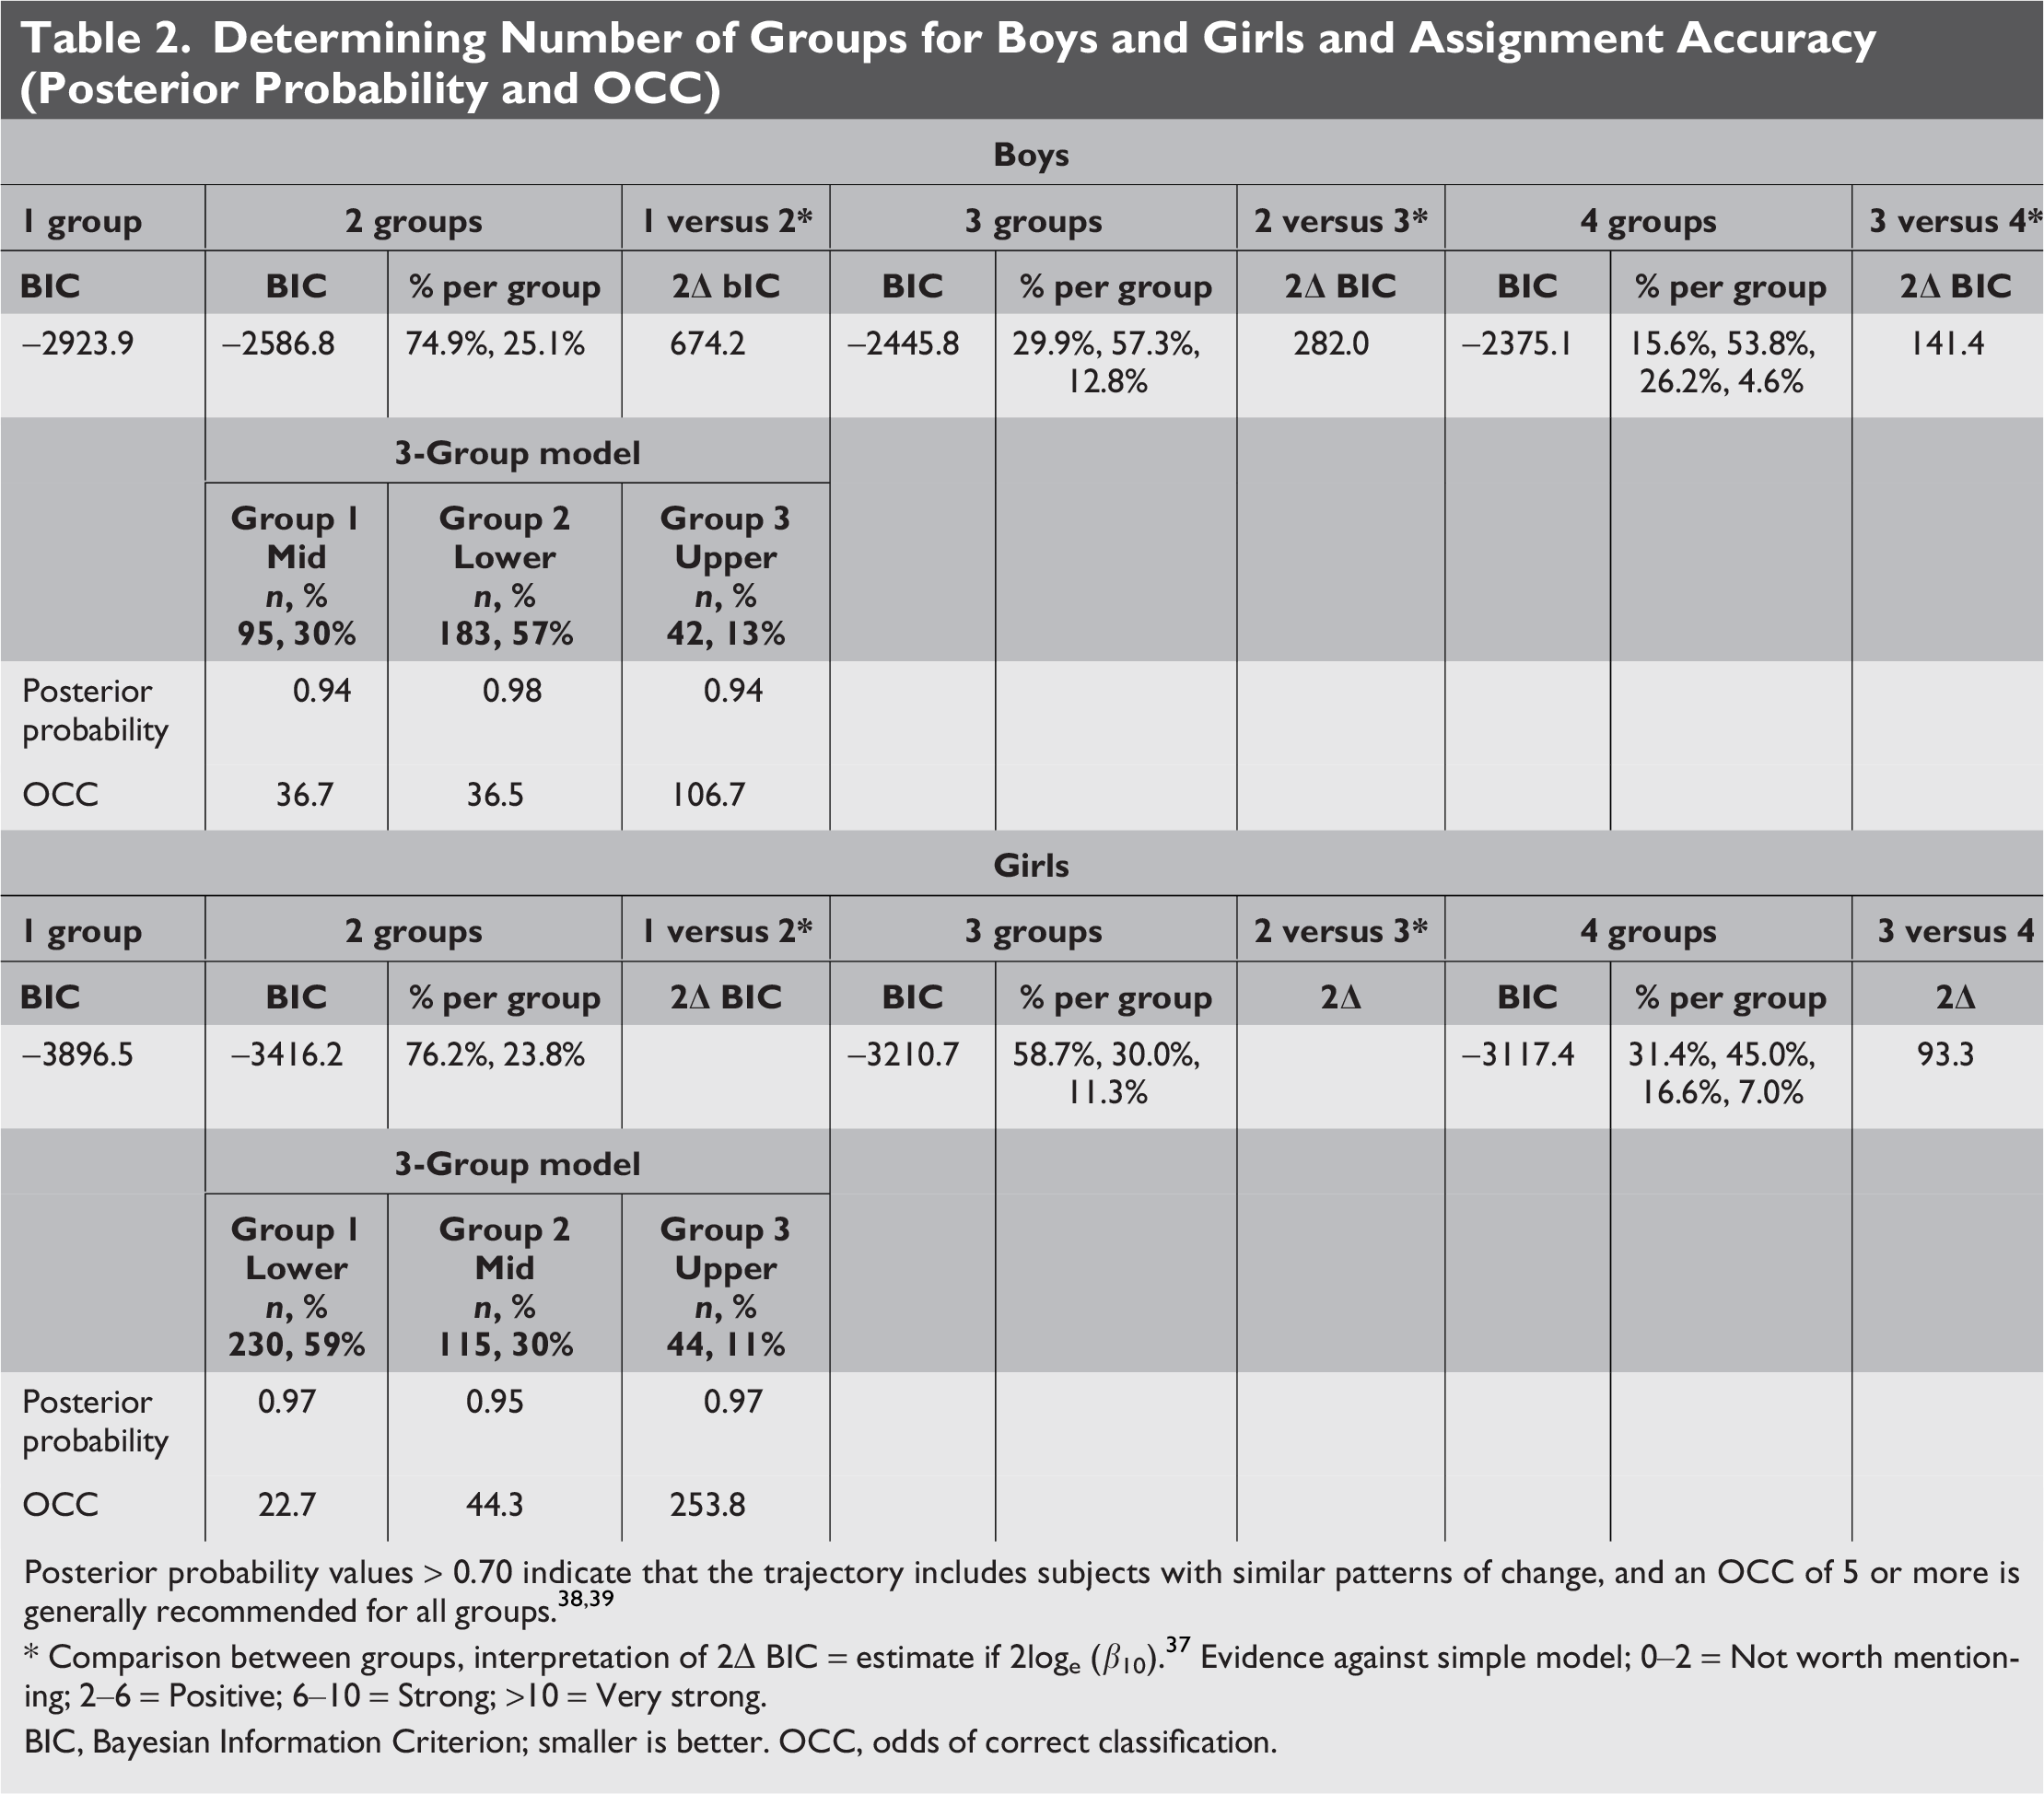
Posterior probability values > 0.70 indicate that the trajectory includes subjects with similar patterns of change, and an OCC of 5 or more is generally recommended for all groups.38,39
* Comparison between groups, interpretation of 2Δ BIC = estimate if 2loge (β10). 37 Evidence against simple model; 0–2 = Not worth mentioning; 2–6 = Positive; 6–10 = Strong; >10 = Very strong.
BIC, Bayesian Information Criterion; smaller is better. OCC, odds of correct classification.
Characteristics of the 3 groups by sex are presented in Table 3. For boys, the lower trajectory (Group 2) was the largest (n = 183) and was the least physically mature. The mid trajectory (Group 1) was midway between Groups 2 and 3. The upper trajectory (Group 3) was the smallest group (n = 42) . In girls, the lower trajectory (Group 1) was the largest (n = 230), had the largest percentage of parents with greater than a high school education, and was the least physically mature at 5th grade. The mid trajectory (Group 2), had the highest proportion of White children. The upper trajectory (Group 3) was the smallest n = 44), had the lowest percentage of parents with greater than a college education, and was predominantly Black.
Characteristics of the FMI Trajectory Groups by Sex
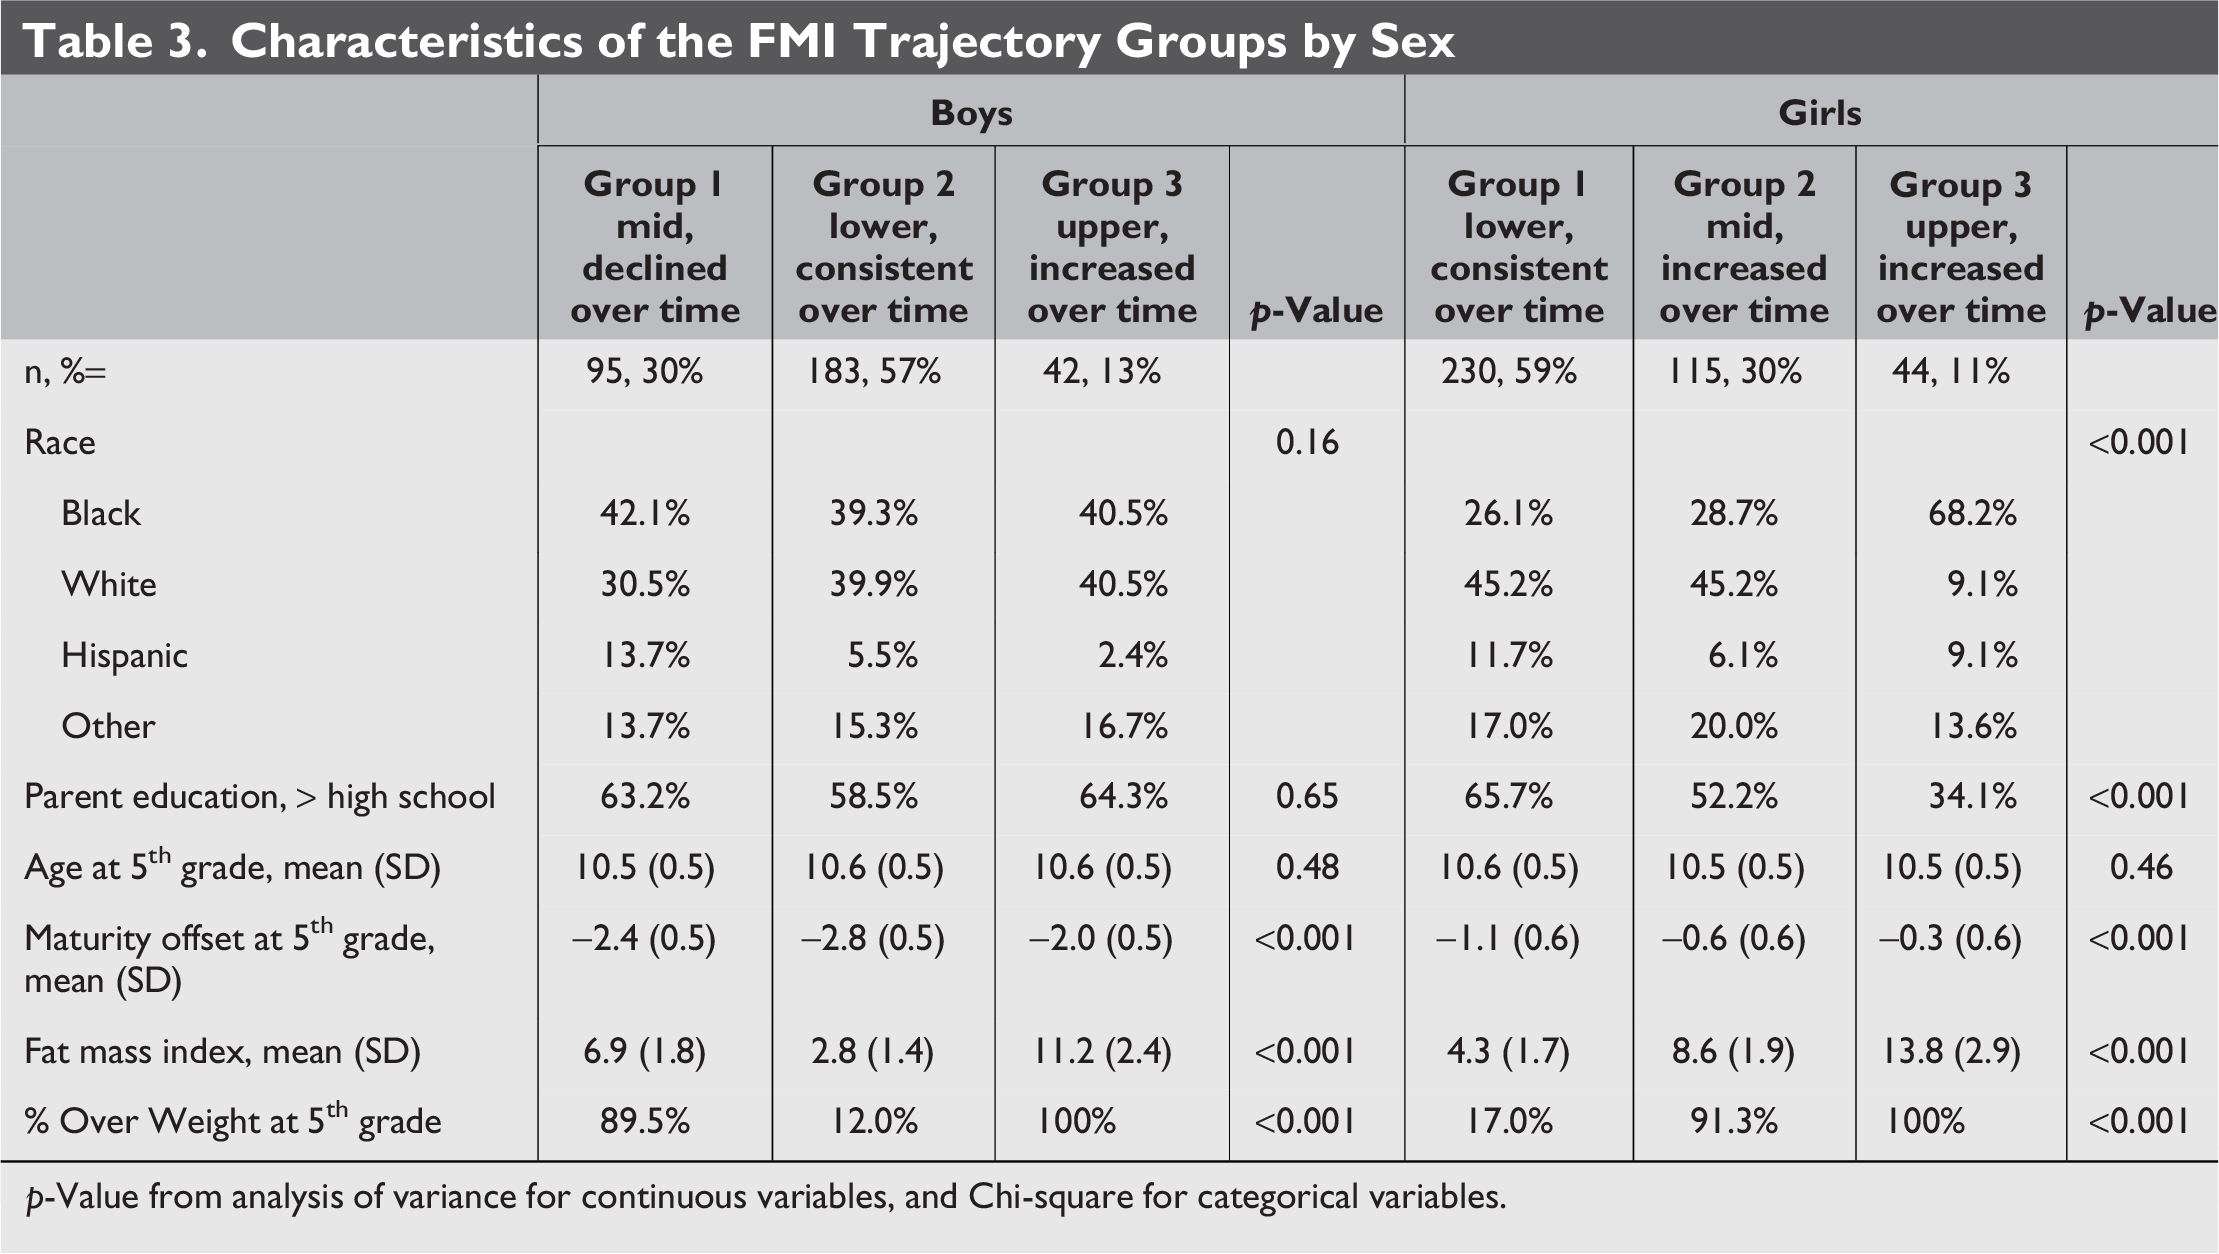
p-Value from analysis of variance for continuous variables, and Chi-square for categorical variables.
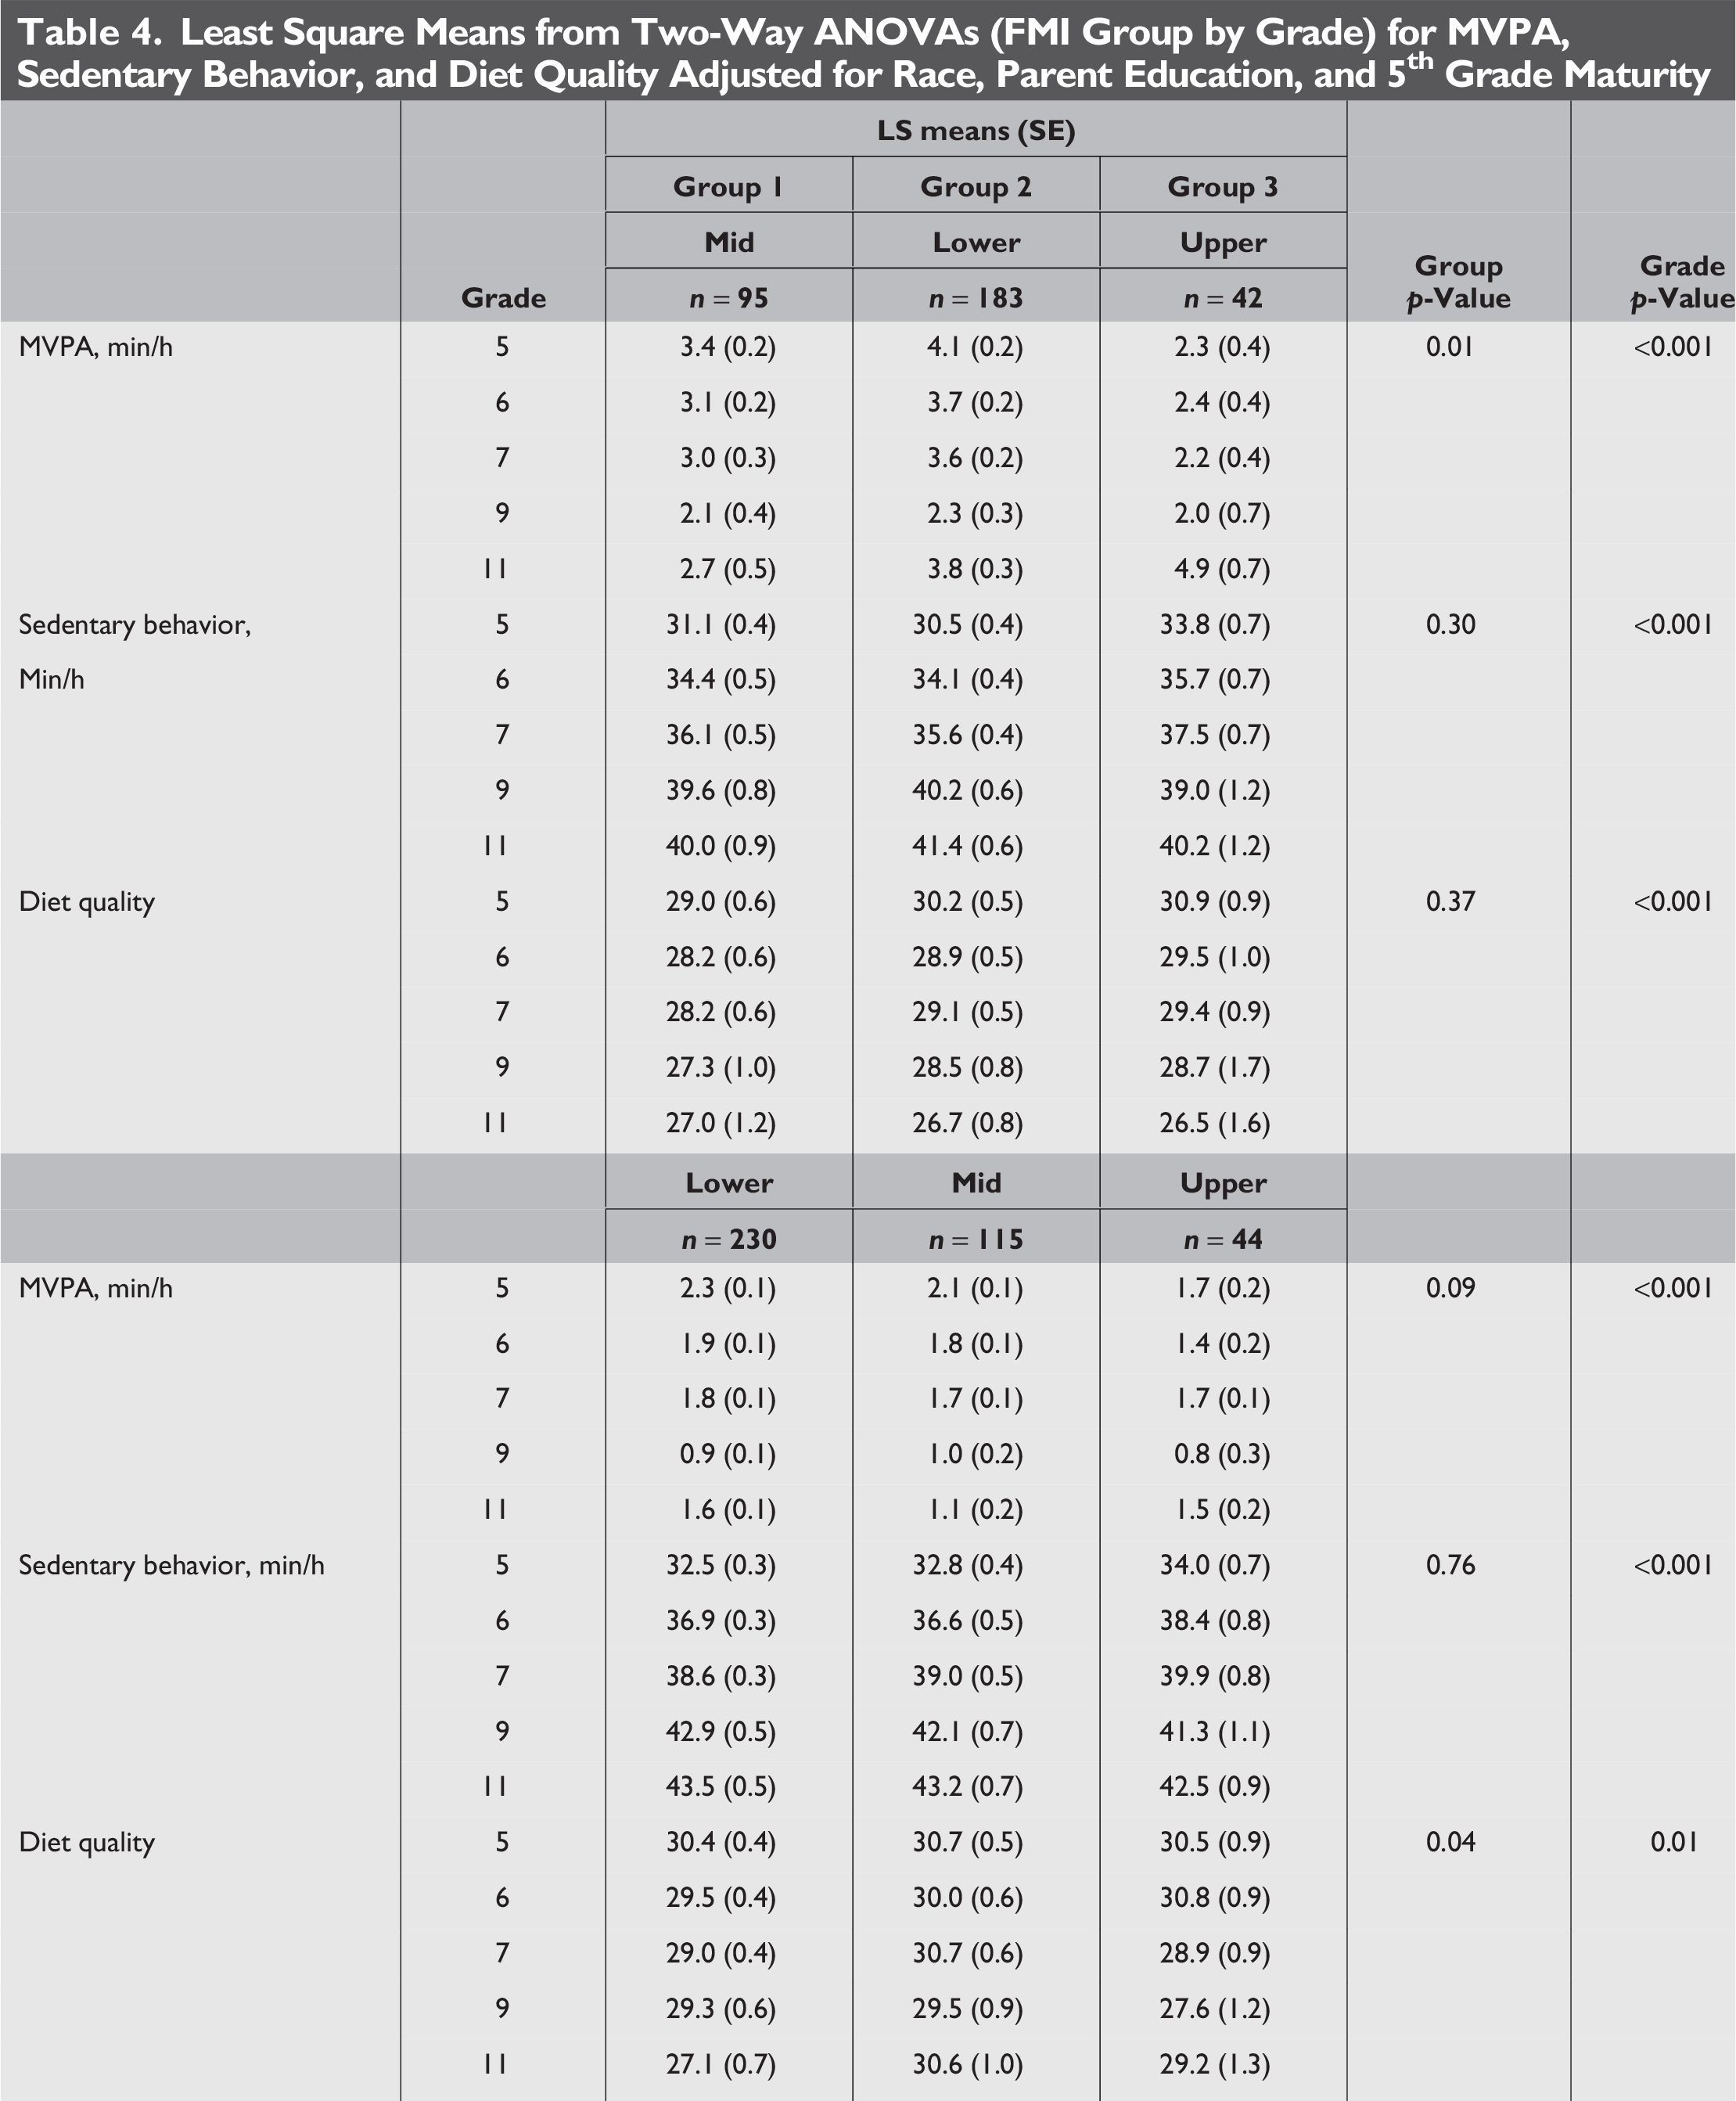
The results of the two-way (FMI Group by Grade) analyses for diet quality, sedentary behavior, and MVPA are presented in Table 4 by sex. In boys, sedentary behavior increased and diet quality declined from 5th to 11th grade (p < 0.001). There were group differences for MVPA (p < 0.01), with the lower trajectory group (Group 2), having the highest MVPA compared with the other groups, but this difference disappeared by 9th grade. In girls, MVPA declined and sedentary behavior increased from grade 5–11 (p < 0.001). There were group differences (p = 0.04) for diet quality with declines in Groups 1 and 3, but Group 2 (mid trajectory) remained stable over time.
Least Square Means from Two-Way ANOVAs (FMI Group by Grade) for MVPA, Sedentary Behavior, and Diet Quality Adjusted for Race, Parent Education, and 5th Grade Maturity
Discussion
This study identified three FMI trajectory groups in both boys and girls, although the shapes of the FMI trajectories differed by sex. In girls, the upper and mid trajectories increased over time, while in boys, the upper trajectory declined and the upper trajectory increased over time. In both girls and boys, one trajectory group maintained a low FMI. These findings identify sub-groups of youth that tend to gain FMI over time and are at risk of overweight or obesity, which could lead to targeting obesity prevention programs more effectively.
The FMI trajectory groups did not differ by race or parent education in boys. Kim et al., 43 using BMI group trajectories, found race and parent education differences among boys < 11 years of age. Another study 44 that used growth curve analysis, reported that non-Black boys had higher FMI at age 8 than Black boys, but by age 14, there were no differences. The present study found differences by race and by parent education between the trajectory groups in girls. Most girls in the lower FMI trajectory group were White and had parents with greater than a high school education, whereas most girls in the high trajectory group were Black and had a low percentage of parents with greater than a high school education. Similarly, Kim et al. 43 reported that the upper trajectory of girls was composed of Black girls and the lower trajectory of White girls.
We observed differences across FMI trajectory groups in behaviors known to influence adiposity. Both boys and girls in the lower FMI trajectory group had the highest MVPA compared with the other groups in 5th grade. Sedentary behaviors increased over time for both boys and girls. Others have also found negative relationships between adiposity and MVPA45,46 and positive relationships between sedentary behavior and adiposity.19,47,48 Very little has been reported using group trajectories and behavioral factors, such as accelerometer-assessed MVPA and sedentary behavior. Lin et al. 40 reported that boys in the persistently obese BMI trajectory had low levels of afterschool exercise, and girls in the persistently obese BMI trajectory frequently watched television or used computers. Kwon et al., 23 using percent body fat group trajectories, reported that the consistently inactive group was more likely to be in the trajectory group that was becoming obese, compared with the other active group. In boys, diet quality declined over time, but with less decline in the FMI trajectory group that declined from 5th to 11th grade. Girls in the mid trajectory maintained diet quality from 5th to 11th grade, while diet quality declined for girls in the lower and upper trajectories. Other studies have found that maintaining a healthy body weight was related to a healthy diet.48–50 Kwon et al. 51 reported no difference for energy intake among group-based percent body fat trajectory groups. Similarly, growth curve analyses revealed no relationship between FMI and energy intake. The present study suggests that interventions to promote physical activity after 5th grade may help to prevent further increases in FMI.
This study was unique in forming FMI-based trajectory groups, which is a more accurate assessment of adiposity in children and adolescents than BMI, and comparing these groups on MVPA, sedentary behavior, and diet quality, rather than on early life factors or health outcomes. Furthermore, trajectory groups were formed for boys and girls separately in a racially diverse cohort that was followed from 5th to 11th grade. Knowing how MVPA, sedentary behavior, and diet quality differ over time may help to determine when to promote healthy eating and physical activity in divergent weight groups in boys and girls.
Using BMI with group trajectory analysis usually manifests with one stable group, 17 with other trajectory groups increasing over time in both boys and girls,40,42 but in the current study, the shapes of the trajectories differed between boys and girls. Marshall et al. 42 compared trajectories using BMI, FMI, and percent body fat in boys and girls using cluster analysis. They reported three trajectories that increased in both boys and girls but, as in the present study, boys and girls differed in trajectories based on percent body fat and FMI. Differences between FMI and BMI trajectories have also been found using growth curve analyses. Both FMI- and percent body fat-based trajectories decreased among boys over time, but increased among girls, while BMI increased in both boys and girls. 26 Fulton et al. 25 reported declines in FMI and increases in BMI using growth curve analysis when samples contained both boys and girls.
Strengths of this study include assessment at five time-points from 5th to 11th grade, spanning the transition from elementary to middle school and high school. An accurate assessment of adiposity, FMI, was used to establish the trajectories, and students were diverse in race/ethnicity, had parents with different educational backgrounds, and included both boys and girls. Physical activity and sedentary behavior were measured using accelerometry, and diet quality was derived from an instrument with established measurement properties. 32 Limitations include that the children were from only two school districts in one state, lower sample size in 9th and 11th grades, which limits generalizability, and that many of children were already overweight or obese (48%) when they entered the study. The diet screener, while validated, provides limited insight into nutrient intake and may limit interpretation. Also, other factors such as school environment or public health infrastructure may influence adiposity.
Conclusions
This study applied a trajectory analysis to longitudinal adiposity data in children who were transitioning from 5th to 11th grade. The primary purpose was to identify, separately for boys and girls, subgroups of the samples that demonstrated similar patterns for longitudinal change in adiposity as assessed by FMI. These findings support tailored interventions for groups of youth considering sex, race, socioeconomic status, and behavioral status well before the 5th grade. Health care providers could provide physical activity and diet advice to parents of children in need of attention (i.e., those with higher weight status; high sedentary behavior, low physical activity, and/or poor diet; and lower socioeconomic status). To support the health care providers/family interventions, schools should improve opportunities for physical activity and diet quality. Community programs for youth should involve families to improve diet and physical activity and to limit sedentary behaviors. These measures should continue throughout the school years to prevent declines in physical activity and diet quality.
Impact Statement
Group-based trajectory modeling of fat mass index (FMI), which accurately assesses adiposity, established three subgroups of boys and three of girls ages 10–16. Groups of girls differed by race, parent education, and diet quality. Groups of boys differed by moderate-to-vigorous physical activity. These results suggest different prevention strategies in FMI subgroups.
Authors’ Contributions
M.D. and R.R.P. were responsible for designing the study. M.D. managed the data and performed analysis and original article drafting. R.P.S. and R.R.P. were involved in writing, review, and editing.
Footnotes
Acknowledgments
The authors wish to thank all the parents and children who participated, the data collection staff, and Gaye Groover Christmas, MPH, who provided editorial assistance in the preparation of the article.
Author Disclosure Statement
No competing financial interests exist.
Funding Information
This study was funded by the National Heart, Lung, and Blook Institute (R01HL091002-1 A1: PI: R.R.P.).
Supplemental Material
Supplemental Material
References
Supplementary Material
Please find the following supplemental material available below.
For Open Access articles published under a Creative Commons License, all supplemental material carries the same license as the article it is associated with.
For non-Open Access articles published, all supplemental material carries a non-exclusive license, and permission requests for re-use of supplemental material or any part of supplemental material shall be sent directly to the copyright owner as specified in the copyright notice associated with the article.