
Abstract
This article addresses school counselor evidence-based accountability practice by summarizing the findings of a hands-on evaluation of readily accessible, free online accountability software that can be used for data collection, management and analysis, and presentations. Using germane school data, four preservice counselors individually rated these tools and commented on their advantages and disadvantages for accountability work. We provide recommendations for data-based practice and improved training.
The accountability movement dates to the 1950s, when various counselor educators challenged the prevailing supposition that most guidance counselors positively contributed to student learning and development (e.g., Mahoney, 1950; Moser, 1949). Implicitly, authors cautioned against generalizing about counselors’ skill levels and impact on student outcomes in the absence of empirical data. To determine the value and quality of counselors’ work, practitioners were encouraged to conduct program evaluations that included rigorous methods of data collection, management and analysis, and reporting. Even as gradual improvements in this regard have been made in the field, school counselor accountability remains a major focus of discussion and promotion among counseling researchers, policy makers, and counselors (e.g., Atkinson, Furlong, & Janoff, 1979; Carey, 1971; Gysbers, 2001; Krumboltz, 1974; Myrick, 1987; Sink, 2009; Stone & Dahir, 2011; Zyromski & Mariani, 2016).
Currently, the American School
Counselor Association (ASCA; n.d., 2012, 2018) encourages school counselors to develop
the basic research-based and data-driven skills needed to establish and evaluate their
program services (e.g., ASCA National Model, 2012). They must also meaningfully address
ongoing calls for evidence-based research and practices that improve the profession and
support accountability. If school counselors are to accomplish these goals successfully
and efficiently, they need vetted online tools to draw from. Although school counselors
may exhibit some knowledge of and access to online resources and software applications
to support their evidence-based practices, information is limited about which of the
current options are the most serviceable. To help fill this gap in the literature, this
article summarizes a practitioner-focused evaluation study of online software that can
support school counselors’ program evaluation and related accountability efforts. Based
on the results, we provide implications for school counselor accountability practices
and training.
Although school counselors may exhibit some knowledge of and access to
online resources and software applications to support their evidence-based
practices, information is limited about which of the current options are the
most serviceable.
The following question guided the evaluation: Of the easily accessible, online applications related to survey development/data collection, data management and analysis, and results presentation, which are the most useful to school counselors? Prior to reporting on the exploratory study’s findings and the implications for real-world data practice, we provide further context for the accountability movement in terms of its major contributory influences. We also briefly discuss the need for manageable accountability tools.
Major Influences on the Accountability Movement
Although the accountability movement began decades ago, three major developments have provided further impetus for school counselors to implement results-based programming and services. First, sweeping state and federal legislation has mandated that public schools utilize evidence-based research and practices and provide meaningful student outcome data to stakeholders. For example, with the passage the Individuals with Disabilities Education Act in 1990, school personnel, including school counselors, are required to set achievable goals and document outcomes for students in special education (Katsiyannis, Yell, & Bradley, 2001; Kauffman, Hallahan, Pullen, & Badar, 2018). Subsequently, the No Child Left Behind Act of 2001 and various revisions (e.g., Race to the Top Program; U.S. Department of Education, 2009) mandated documentation of student learning in regular education classrooms. “Failing” schools must develop a school improvement plan, reinforcing the need for counselors to be involved with pertinent student data collection and analysis (Cleveland & Sink, 2018; Sabens & Zyromski, 2009).
Second, professional counseling organizations lent their support for this movement. For instance, the American Personnel and Guidance Association, a precursor to the American Counseling Association (ACA) and later to ASCA, published its ethical standards in 1961, indicating that research and evaluation were part of a counselor’s responsibilities. Current counseling-related ethical codes and standards (ACA, 2014, see Section E; ASCA, 2016, sections A.3, A.7.g, and A.13) have expanded on these original standards. Professionals must develop and utilize relevant assessments and appropriately interpret results, conduct program evaluations, and present their findings to stakeholders in a comprehensible format. Moreover, accreditation standards for university counselor education programs (e.g., Council for Accreditation of Counseling & Related Educational Programs, 2016) and state-level school counselor credentialing/certification standards mandate that preservice school counselors develop competencies in implementing evidence-based services and evaluating their program practices.
Perhaps the most important factor driving school counselor accountability, as alluded to above, began in the late 1970s with the advent of comprehensive school counseling programs (e.g., ASCA National Model; ASCA, 2003, 2012). From the outset, framers encouraged counselors to utilize evidence-based research and practices and to evaluate program components as well as their own effectiveness (Gysbers & Henderson, 2012). Thus, by the 1990s, comprehensive programs became the standard of practice. Subsequent research investigating the efficacy of comprehensive school counseling programs indicates that, when school counselors closely attend to accountability issues within the context of program implementation and management, positive outcomes accrue for students and families (Carey, Harrington, Martin, & Hoffman, 2012; Carey, Harrington, Martin, & Stevenson, 2012; Gysbers & Henderson, 2012; Lapan, Gysbers, & Sun, 1997; Sink, Akos, Turnbull, & Mvududu, 2008; Sink, Cooney, & Adkins, 2017). In fact, the latest version of the ASCA National Model (ASCA, 2012) is a well-defined operational framework to establish accountability practices (e.g., Salina et al., 2013). The framework’s service delivery component was designed to increase students’ academic, social/emotional, and career-oriented outcomes through effective systems leadership and advocacy, use of data-driven practices and program evaluation, and stakeholder collaboration (ASCA, 2012; Dahir & Stone, 2009; Stone & Dahir, 2011; Zyromski & Mariani, 2016).
Need for Practitioner-Friendly Accountability Tools
Despite these substantial impetuses to update accountability skills and practices, and generally positive reports by school counselors who have done so (Paolini, 2012; Topdemir, 2013), widespread change across the profession is, at best, measured. In fact, only a minority of counselors regularly implement evidence-based practices and evaluate student and family outcomes (Edwards, 2009; Paolini, 2015; Topdemir, 2013). Paolini (2015) found that only 37.6% of school counselors nationwide “sometimes” utilized accountability measures (collecting and obtaining data). Curiously, recommendations for comprehensive school counselor training often fail to mention the need for well-developed computer literacy and technology skills (e.g., Kozlowski & Huss, 2013).
Multiple factors contribute to the relatively slow growth in school counselor accountability and related technology practices. Several statewide studies of comprehensive school counseling programs implicated, in part, scarcity of accountability resources and high-quality training for school counselors. For example, Carey and his colleagues, after examining trends in student and family outcomes tied to comprehensive program implementation in Nebraska (Carey, Harrington, Martin, & Hoffman, 2012) and Utah (Carey, Harrington, Martin, & Stevenson, 2012), found that quality standardized data collection tools were needed to evaluate services and programs. These investigators also reported that the research and evaluation methods applied by counselors were haphazard and inadequate for various accountability tasks. Other researchers surveying Wisconsin school counselors concluded that training for comprehensive school counseling programs must further emphasize the importance of counselor accountability and appropriate ways to conduct program evaluations (Burkard, Gillen, Martinez, & Skytte, 2012). Another survey study found that, while counselors generally comprehend the importance of data-driven practices, they appear to lack confidence or research self-efficacy and skills to evaluate interventions and services (Astramovich, 2017; Milsom & McCormick, 2015; Paolini, 2012, 2015). To remedy the lack of knowledge, experience, and good program evaluation skills, supplementary professional development training is needed for practicing counselors (Astramovich, 2017), and this effort should include preparation on effective use of online technology (Miller, 2010).
Several publications address counselor-related technology competencies without providing specific recommendations for survey, analytical, and presentation tools (e.g., Dahir & Stone, 2009; Gysbers & Henderson, 2012). For instance, drawing from the Technical Competencies for Counselor Education developed by the Association for Counselor Education and Supervision (ACES, 2007) Technology Interest Network, Sabella, Poynton, and Isaacs (2010) recommended various competencies that can benefit school counselor accountability practices and are relevant to the current study. They highlighted that master’s-level counselors should “be able to use the productivity software to develop web pages, word processing documents (letters, reports), basic databases, spreadsheets, and other forms of documentation or materials applicable to practice” (ACES, 2007, p. 3) and “be able to use statistical software to organize and analyze data” (ACES, 2007, p. 4).
In summary, even as the accountability mandate is well-documented, the school counseling research and evaluation literature is sparse at best when it comes to discussing practitioner-vetted online research tools, particularly those related to data collection, management and analysis, and stakeholder presentation software. The applications discussed in this article will provide counselors with needed resources to attain some technology-related competencies and meet the accountability demands of their schools.
Method
Software Evaluation Approach
We adapted Creswell and Creswell’s (2018) pragmatic research design for this evaluation project. In this approach, the focus of analysis is guided by the intended use of the study’s findings. The goal for the current investigation was to offer pre- and in-service school counselors a realistic appraisal of data-related online applications that support their evidence-based research and practices. After reviewing pertinent literature, we considered five general strategies for technical software evaluation (e.g., Hartson, Andre, & Williges, 2001; Henderson, Podd, Smith, & Varela-Alverez, 1995). Of these, we opted for a modified software usability study as the most suitable approach to operationalize the research aim (Henderson et al., 1995).
Participants and Procedures
Four female preservice counselors who were in their school counseling practicum or internship volunteered to participate in the software review over a 3-month period in late 2017 and early 2018. To maintain their anonymity, we have omitted specific background characteristics. They received no remuneration for their participation and had previously assisted the lead author on other projects. Each reported low to moderate familiarity with some online data-related applications. Their ages ranged from approximately mid-20s to 30s. Two reviewers were ethnic minorities and two were White.
The software evaluation process occurred in three phases. First, the project team determined inclusion criteria for the software review in consultation with a school counselor educator who is knowledgeable about current technology. To be reviewed, an application had to be (a) appropriate for survey development/data collection, data management (i.e., storing and processing data) and analysis (i.e., finding and summarizing trends), or presentation of data/findings; (b) readily accessible online; (c) available for free; and (d) germane to school counselor accountability work.
Second, we conducted a review of the counseling literature and other related resources addressing software/technology issues, noting any recommended software related to data and accountability practices. Of the numerous program options available, these questionnaire development/data gathering tools appeared to best meet the above criteria: SurveyGizmo, SurveyMonkey, Google Forms, and Qualtrics. The team rated four online analytical/data management analysis applications: Excel with and without EzAnalyze add-in, Google Sheets with and without Google Fusion Tables, Venngage’s Infographics, and Tableau Public. The most suitable options for school counselor data presentations appeared to be Google Slides, PowerPoint, PowToon, and Prezi. The applications are briefly described in the next section.
The software review process (Phase 3) was accomplished in a university office setting that included a semiprivate area with a desktop computer (Dell PC or Apple Mac; evaluators had their choice) and fast Internet access. Participants independently scheduled a time to do the online evaluation tasks at their own pace. Before starting, the project team briefly educated participants on the purpose of the project, oriented them to the computer and its operations, and answered any questions about the study. We then asked participants to complete three specific tasks: (a) create a Likert-type questionnaire in each survey application using a Microsoft Word document with 10 needs-assessment items, (b) use each of the four data analysis programs to generate a frequency table and bar chart using basic school information from a district website, and (c) develop a short onscreen presentation (two slides) related to their data results using each of the presentation tools. All results were saved on the computer being used.
To complete the review process, we created a software evaluation rubric that included the categories user friendliness (ease of use, intuitive, good help options), visual appeal (engaging display), shareability (ease of distribution to potential viewers), orientation time (time needed to orient and use the application), and overall rating (aggregated median ranking based on first three categories). Each category was rated on a 3-point scale (1 = low, 2 = moderate, 3 = strong). Each rater kept track of the time they required to get oriented and use each of the software programs (reported as an aggregate mean). Participants also indicated whether each application could be utilized at pre-K, elementary, and/or secondary school settings. Upon completion of the tasks, we conducted a short, informal interview with each participant to clarify their ratings and obtain any additional comments.
Description of Reviewed Software
The following application descriptions were drawn from information presented on each developer’s website as of July 2018. They are organized below based on the software’s main purpose, whether it is best utilized for data (a) collection (survey/questionnaire design), (b) analysis and management, or (c) presentation or reporting of findings.
Survey development and data collection
SurveyGizmo (https://www.surveygizmo.com/) is an advanced questionnaire development tool accessible online at the company website. The free consumer version is called a “Scout” account. Basic features allow users to devise, for example, professional-looking surveys, polls, forms, and data summary reports. Users can distribute a survey to potential respondents by a link, which also provides simple automatic response tracking. Help tools and instructions should make sense to most users.
SurveyMonkey (https://www.surveymonkey.com/), like the previous option, allows users to generate nicely formatted questionnaires. Although the free version is limited in its functionality and features, it is suitable for uncomplicated survey writing and data collection. The program offers self-design options and premade questionnaire templates and survey items. With this application, users can send surveys via the web, e-mail, and social media. SurveyMonkey automatically scores responses and finds trends in the results. Users can download data and export it in various statistical programs (e.g., IBM SPSS). Instructions/help menus are viable for even nascent users.
Google Forms (https://www.google.com/forms/about/) is part of the integrated suite of data-related tools (e.g., Google Docs, Sheets) available to operators at no cost and accessed through their Gmail accounts. Users can start from a blank form with several color options or begin with numerous premade forms that include template categories such as educational, personal, and work. Formats for questions include short answer, paragraph, multiple choice, check boxes, drop-down, linear scale, and multiple-choice grid. The surveys are distributed to potential respondents by e-mail or a web link. Created measures will automatically be saved to the user’s Gmail account. Google Forms may be a less desirable option if users aim to design automatically scored surveys or a versatile tool. Finally, users can analyze data within Google Forms or import it into spreadsheet applications like Google Sheets and Microsoft Excel. Google Forms provides consumers with extensive assistance, including a step-by-step guide.
Qualtrics (https://www.qualtrics.com) is another convenient survey builder program that allows for automatic scoring and data analysis. For the purposes of school counseling accountability, the no-cost version is sufficient. One of Qualtrics’ special features is the premade surveys and templates. Some template categories include education, K–12 education, demographics, and personal. Each grouping provides users with a list of various surveys that relate to the topic. As an example, under the “K–12 education” set of templates, one finds premade student–teacher, student well-being, and school safety questionnaires. Users can also choose to start from a blank template to create their own survey. With the Library tab, counselors can add graphics and choose from a variety of response options such as matrix table, rank order, multiple choice, text entry, side to side, and slider. Other editing options include colors, fonts, enabling the back button, open access, by invitation only, and password protection. The Results tab allows users to see how many individuals have completed the survey and collect the survey results. Qualtrics provides users with a survey link, so that respondents have easy access to their online survey. Other share options include e-mail and social media sites (e.g., Twitter, Facebook, Google+). Help resources are more than adequate.
Data management and analysis
Microsoft’s Excel Online (https://www.office.com/launch/excel?ui=en-US&rs=US&auth=2) is a multipurpose spreadsheet program with substantial capabilities, from sophisticated data management (e.g., information storage, analysis) to high-quality data representation. It has relatively simple tools and templates that are handy for school counselors, such as tracking of tasks, making schedules and time sheets, and so on. Spreadsheets can be easily shared with and uploaded by collaborators. Excel Online works seamlessly with OneDrive, Microsoft’s cloud/data storage system. Because Excel is complex, training is helpful to become a proficient user. The application does provide numerous support tutorials and a help menu.
For occasional spreadsheet users who want to stay with Excel, EzAnalyze (http://www.ezanalyze.com/) can be a beneficial add-in software application. It is designed to transform complicated Excel operations (e.g., data analyses and table design), so that they are simpler and faster to perform. Specifically, the tool adds a tab to the Excel menu, providing operators with point-and-click functionality for statistically analyzing data and for making graphs and tables. However, with newer and different operating systems (OS; Mac and PC Windows) and versions of Excel, installation is not straightforward and may be unworkable. Documentation is limited about how to use the program effectively and remedy compatibility issues. Thus, for school counselors who have tech support and computers that are running older Windows OS and Excel versions (e.g., 2007 version of Excel), the add-in application could be a time saver. For the purposes of this review, we attempted several times but were not able to load the application on an up-to-date Windows-based PC running the 2013 version of Excel. Consequently, the tool could not be rated. Beta versions of EzAnalyze are available for Excel 2013 and 2016 from the software developer (Poynton, n.d.).
Google Sheets (https://docs.google.com/spreadsheets/) and Google Fusion Tables (https://sites.google.com/site/fusiontablestalks/home) are web-based applications to collect, analyze, visualize, and share data. Although somewhat limited in capabilities, Google Sheets is a relatively easy-to-use spreadsheet program that works well with most school counselor-related data analysis and display tasks. Information can be depicted in multiple formats such basic charts and frequency tables. With further training, users who are not technologically oriented can run statistical analyses (e.g., frequencies, descriptive statistics, correlations, group comparisons). The program works well with Google’s word processing program, Google Docs, and Google Fusion Tables.
Google Fusion Tables is particularly convenient when school counselors have very large quantities of data from various sources that need to be examined and presented in charts, maps, network graphs (infographics), or custom layouts. For example, counselors could use this application to create custom intensity maps based on common trends of family ethnicities, stakeholder socioeconomic levels, career options, or mental health resources nearby. Google Fusion Tables also allows individuals to find public data by searching public Fusion Tables or importable public tables found online. Users can upload and export their own data tables from Google Sheets and other spreadsheet programs. Further, Google Fusion Tables allows individuals to embed and publish their data visualization on other web applications or send it as an e-mail link. In brief, this application is a sophisticated and powerful tool with informative help options, but the initial learning curve can be steep.
Venngage’s Infographics (https://venngage.com/) tool has a free option for data analytics, several different colorful designs, and editing options. The Infographics library allows users to save all their created charts and displays. Infographics has a large assortment of analytical charts (e.g., bar graphs, pie charts, tables, line graphs) so users can analyze their data and gain a clearer, more concise picture of data patterns. Although the export options (shareability) are quite limited with the free version, school counselors can publish their work online and share a link with potential stakeholders. The help menu is thorough and has informative how-to videos.
Tableau Public (https://public.tableau.com/en-us/s/) mirrors the features present in Google Fusion Tables while adding additional ones. It allows users to merge data analysis and data presentation into one program profile. This versatile application includes numerous options such as visual analytic features, color, languages, locations, and more. It offers menus to help users conduct analyses and create data visualizations. Tableau Public Free has multiple sharing options (e.g., e-mail, social media) and is compatible with other applications such as Microsoft Excel. Support menus are plentiful and comprehensible.
Reporting data and presentation
Microsoft’s PowerPoint Online (https://www.office.com/launch/powerpoint?ui=en-US&rs=US&auth=2) works almost effortlessly with Microsoft’s Excel and Word. It is a relatively uncomplicated presentation tool with a multiplicity of background choices (templates) and other formatting options to start with. Since slide formatting lacks the pizzazz of other presentation tools described below, users seeking more creative options may find this application somewhat limiting. However, Microsoft’s online resources can assist in adding engaging elements to the slide deck. For example, one can quickly insert tables, charts, photos, animations, transitions, sounds, and clip art. Slide presentations are easily shared with others using a variety of formats including social media. Online help is abundant and easy to navigate.
Google Slides (https://docs.google.com/presentation/) is a simple-to-use presentation tool accessed through the user’s Gmail account. It mirrors what PowerPoint can do in many ways but appears to be more limited in functionality. Presentations are automatically saved in Google Drive, a cloud storage system. The number of templates and design options available is relatively modest. Presentation sharing options allow colleagues to easily collaborate and edit their work. Online support is abundant and understandable for beginners. Overall, for counselors and other professionals who want to create a useful and quick presentation to report on their accountability work, this application is more than sufficient.
PowToon (https://powtoon.com/) is reminiscent of the previous two presentation applications; however, it is far more versatile, visual, and engaging. This online program capitalizes on using vivid media (e.g., videos, voice-overs, artwork, photos) to make “attention-grabbing” presentations and videos. One can start with a blank PowToon or a wide variety of templates for work, education, or personal use, including teacher and student templates. If users begin with a blank PowToon, the program offers a host of options to make the presentation creative and distinctive. For example, users can design a presentation so that it has an edgy, modern style or resembles a whiteboard drawing or a cartoon. Counselors can also use the infographics template to display data in attractive and visually compelling ways. Each PowToon is automatically saved online and easily accessed later. Tutorials are plentiful and workable. With the free version, presentations have limited capabilities and shareability. Online distribution can be accomplished, however, using YouTube. As an added feature, presentations can be downloaded as a pdf or as a viewable online PowerPoint presentation.
Prezi (https://prezi.com/) is an innovative and flexible presentation tool that moves away from the more standardized approach to summarizing and displaying information (e.g., Google Slides and PowerPoint). Specifically, Prezi is designed to engage audiences by visually and creatively appealing to their aesthetics using a nonlinear presentation format. As a communication tool, it accepts different types of media files (i.e., image, audio, and video). Users can create their own presentation or access numerous premade templates. Prezi also has a large reservoir of unrestricted public presentations that address many topics relevant to school counseling. For example, counselors can view free public presentations on coping strategies, interventions, and so on, and infuse them into guidance lessons and student activities. This software can be challenging to use at first, given its innovative design and functionality. At the time of the software evaluation, Prezi had a free version retrieved through the creation of an account online.
Results
Each application was rated by the participants, with the findings summarized in Table 1 and further explicated below.
Counselor Evaluation of Online Software for Evidence-Based Research and Practices.

Note. Ratings: 1
aMedian ranking based on first three rating categories. bExcel with EzAnalyze add-in did not function properly with newer PCs or Macs and Excel 2013, thus it was not rated.
Data Collection Software
Of the four online data collection/survey design tools, SurveyGizmo and Google Forms were rated as highly user-friendly and shareable (strong). All but Qualtrics received a moderate rating (2) for visual appeal. Each application could be “learned” within 20 min, with Google Forms and SurveyGizmo requiring, on average, about 10 min of orientation time. Target audiences could range from pre-K to high school levels. Overall, SurveyGizmo received the highest rating (Mdn = 3), with the other three options receiving moderate (Mdn = 2) scores. Rater comments suggested that Google Forms was generally seen as convenient and easy to learn, but its design and sharing options were somewhat limited in comparison with SurveyMonkey. Moreover, surveys generated by Google Forms must be scored manually unless one has significant knowledge and can figure out ways to do this automatically. In summary, each of the tools is comparable in serviceability for school counselor-related survey creation, data collection, and management.
Data Analysis Software
Perhaps the most difficult of the programs to navigate were the data analysis tools. Excel with the EzAnalyze add-in (Poynton, n.d.) and Google Fusion Tables were assigned low user-friendly ratings. Not surprisingly, given the list of functional caveats on the website, EzAnalyze failed to load properly with newer PC or Mac OS and the 2013 version of Excel. The options that are lesser known in the counseling field, Infographics and Tableau Public, were assessed as moderately user-friendly. These two programs also received at least moderate ratings in visual appeal. Shareability was less than ideal with each of these applications, with Google Fusion Tables receiving the lowest rating. This application required on average 20 min to get up and running, whereas the other options required about 10 min to become oriented. Only Google Fusion Tables seemed inappropriate for K–12 settings. Overall program ratings suggested that running EzAnalyze on newer OS (PC or Mac) and newer versions of Excel should be avoided. Google Fusion Tables, while powerful for large datasets, is less suitable for beginning or moderately skilled users. With some training on Excel or Google Sheets, school counselors will find these applications the most useful for simple data analytics. To obtain interesting and nuanced data trends, we recommend Tableau Public or Infographics.
Data Presentation/Reporting
Each data presentation application received at least moderate to strong ratings for the overall and visual appeal evaluation categories. Google Slides and PowerPoint were rated as very user-friendly (Mdn = 3), whereas PowToon and Prezi were given a low rating in this category. Each program could be deployed in K–12 settings. PowToon took up to 30 min on average for users to become oriented to the program. The other options (Google Slides, PowerPoint, and Prezi) required 10 min or less. Prezi was found to be a bit more challenging to use. Of the four presentation options, Google Slides and PowerPoint garnered the highest overall ratings. Comments by reviewers suggested that PowToon is an innovative and excellent presentation tool especially for students. Its highly engaging options (e.g., whiteboard and cartooning) are innovative and “fun” for users and audiences. Again, the start-up time needed may be a deterrent for counselors. Prezi is the next best option if counselors want to make creative and engaging presentations.
Summary of Findings and Implications for Accountability Practice and Training
To reiterate, this software evaluation focused on those readily available and free
applications that K–12 school counselors could use for evidence-based research and
practices, particularly in the areas of data collection/survey design, analysis, and
results presentation/reporting. In general, the findings suggest that school
counselors with minimal technology skills can use any of the applications in pre-K
to 12 settings. However, extra practice and training is required if counselors want
to maximize each program’s capabilities. More specifically, to create questionnaires
for data collection and subsequent analysis, SurveyGizmo, SurveyMonkey, or Google
Forms is a convenient alternative. The free version of Qualtrics is a reasonable
option; it is user-friendly and offers different editing, template, sharing, and
survey design options. If the district has sufficient funding to subscribe to the
advanced version of Qualtrics, this tool can be used K–12 for multiple aspects of
accountability efforts.
This software evaluation focused on those readily available and free
applications that K–12 school counselors could use for…data
collection/survey design, analysis, and results
presentation/reporting.
To analyze survey data, we recommend Infographics or Tableau Public for the most interesting and appealing way to understand data trends. Should these applications no longer offer a free version, Excel (used without EzAnalyze) and Google Sheets are more than serviceable options. The latter alternatives are easier to learn and implement. With all tools, we recommend that school counselors receive training to maximize their functionality.
Finally, to present the data analysis findings to stakeholders without much visual flourish, we recommend Google Slides or PowerPoint. However, with some training and practice, PowToon is quite engaging to students and perhaps to other audiences. If one desires an inviting and less conventional approach to presenting information—one requiring some minimal practice before deployment—Prezi is a more than serviceable choice. Ultimately, when selecting the preferred alternative, users should (a) have a good sense of their computer literacy skills, (b) consider the time needed to get up and running on the application, (c) decide whether the free option is sufficient for their purposes, and (d) ensure that the option suits the target audience. Shareability is another issue to consider, particularly if counselors want to provide access to the information to the broadest audience possible. In our view, each application had enough sharing options to allow stakeholders to obtain the information.
Using Data-Related Software Within the School Counseling Accountability Cycle
All software for evidence-based research and practices must be deployed
appropriately, intentionally, and with fidelity. Each tool should be relevant to
and feasible within one’s overall accountability plan. Expanding on Young and Kaffenberger’s
(2013) action research approach, Figure 1 displays seven steps associated
with comprehensive school counseling program accountability practices. This
model can be viewed as a circular decision-making/action-planning process. To
supplement the steps, the figure includes data-related software recommendations
described above. At Step 1, school counseling program accountability teams
develop and set program and student goals, referring to the ASCA Mindsets &
Behaviors for Student Success (ASCA, 2014) as a starting point. For
these goals to be effectively assessed later, counselors should rephrase them
into SMART (specific, measurable, achievable, realistic/relevant, and
tangible/time-bound) goals. Step 2 involves locating evidence-based program and
student interventions and services that specifically address these goals and
objectives. Interventions should have solid research supporting their use with
K–12 students. Steps 3 and 4 are activated almost concurrently: School
counselors implement evidence-based practices and collect outcome data related
to their effectiveness with the target audiences. Counselors can develop pre-
and posttest surveys/questionnaires using any of the recommended online tools
(e.g., SurveyGizmo, SurveyMonkey, Google Forms). At Step 5, accountability data
are shown to intended audiences in an understandable and engaging manner. For
simple yet professional data reporting, we recommended Google Slides or
Microsoft’s PowerPoint. For those counselors who want to display their findings
in more visually interesting ways, Prezi or PowToon can be fitting applications.
Finally, stakeholders are asked to react to the findings and provide feedback
(Step 7). With this ongoing input, counselors revisit their program goals and
objectives and revise them as needed.
All software for evidence-based research and practices must be
deployed appropriately, intentionally, and with fidelity. Each tool
should be relevant to and feasible within one’s overall
accountability plan.
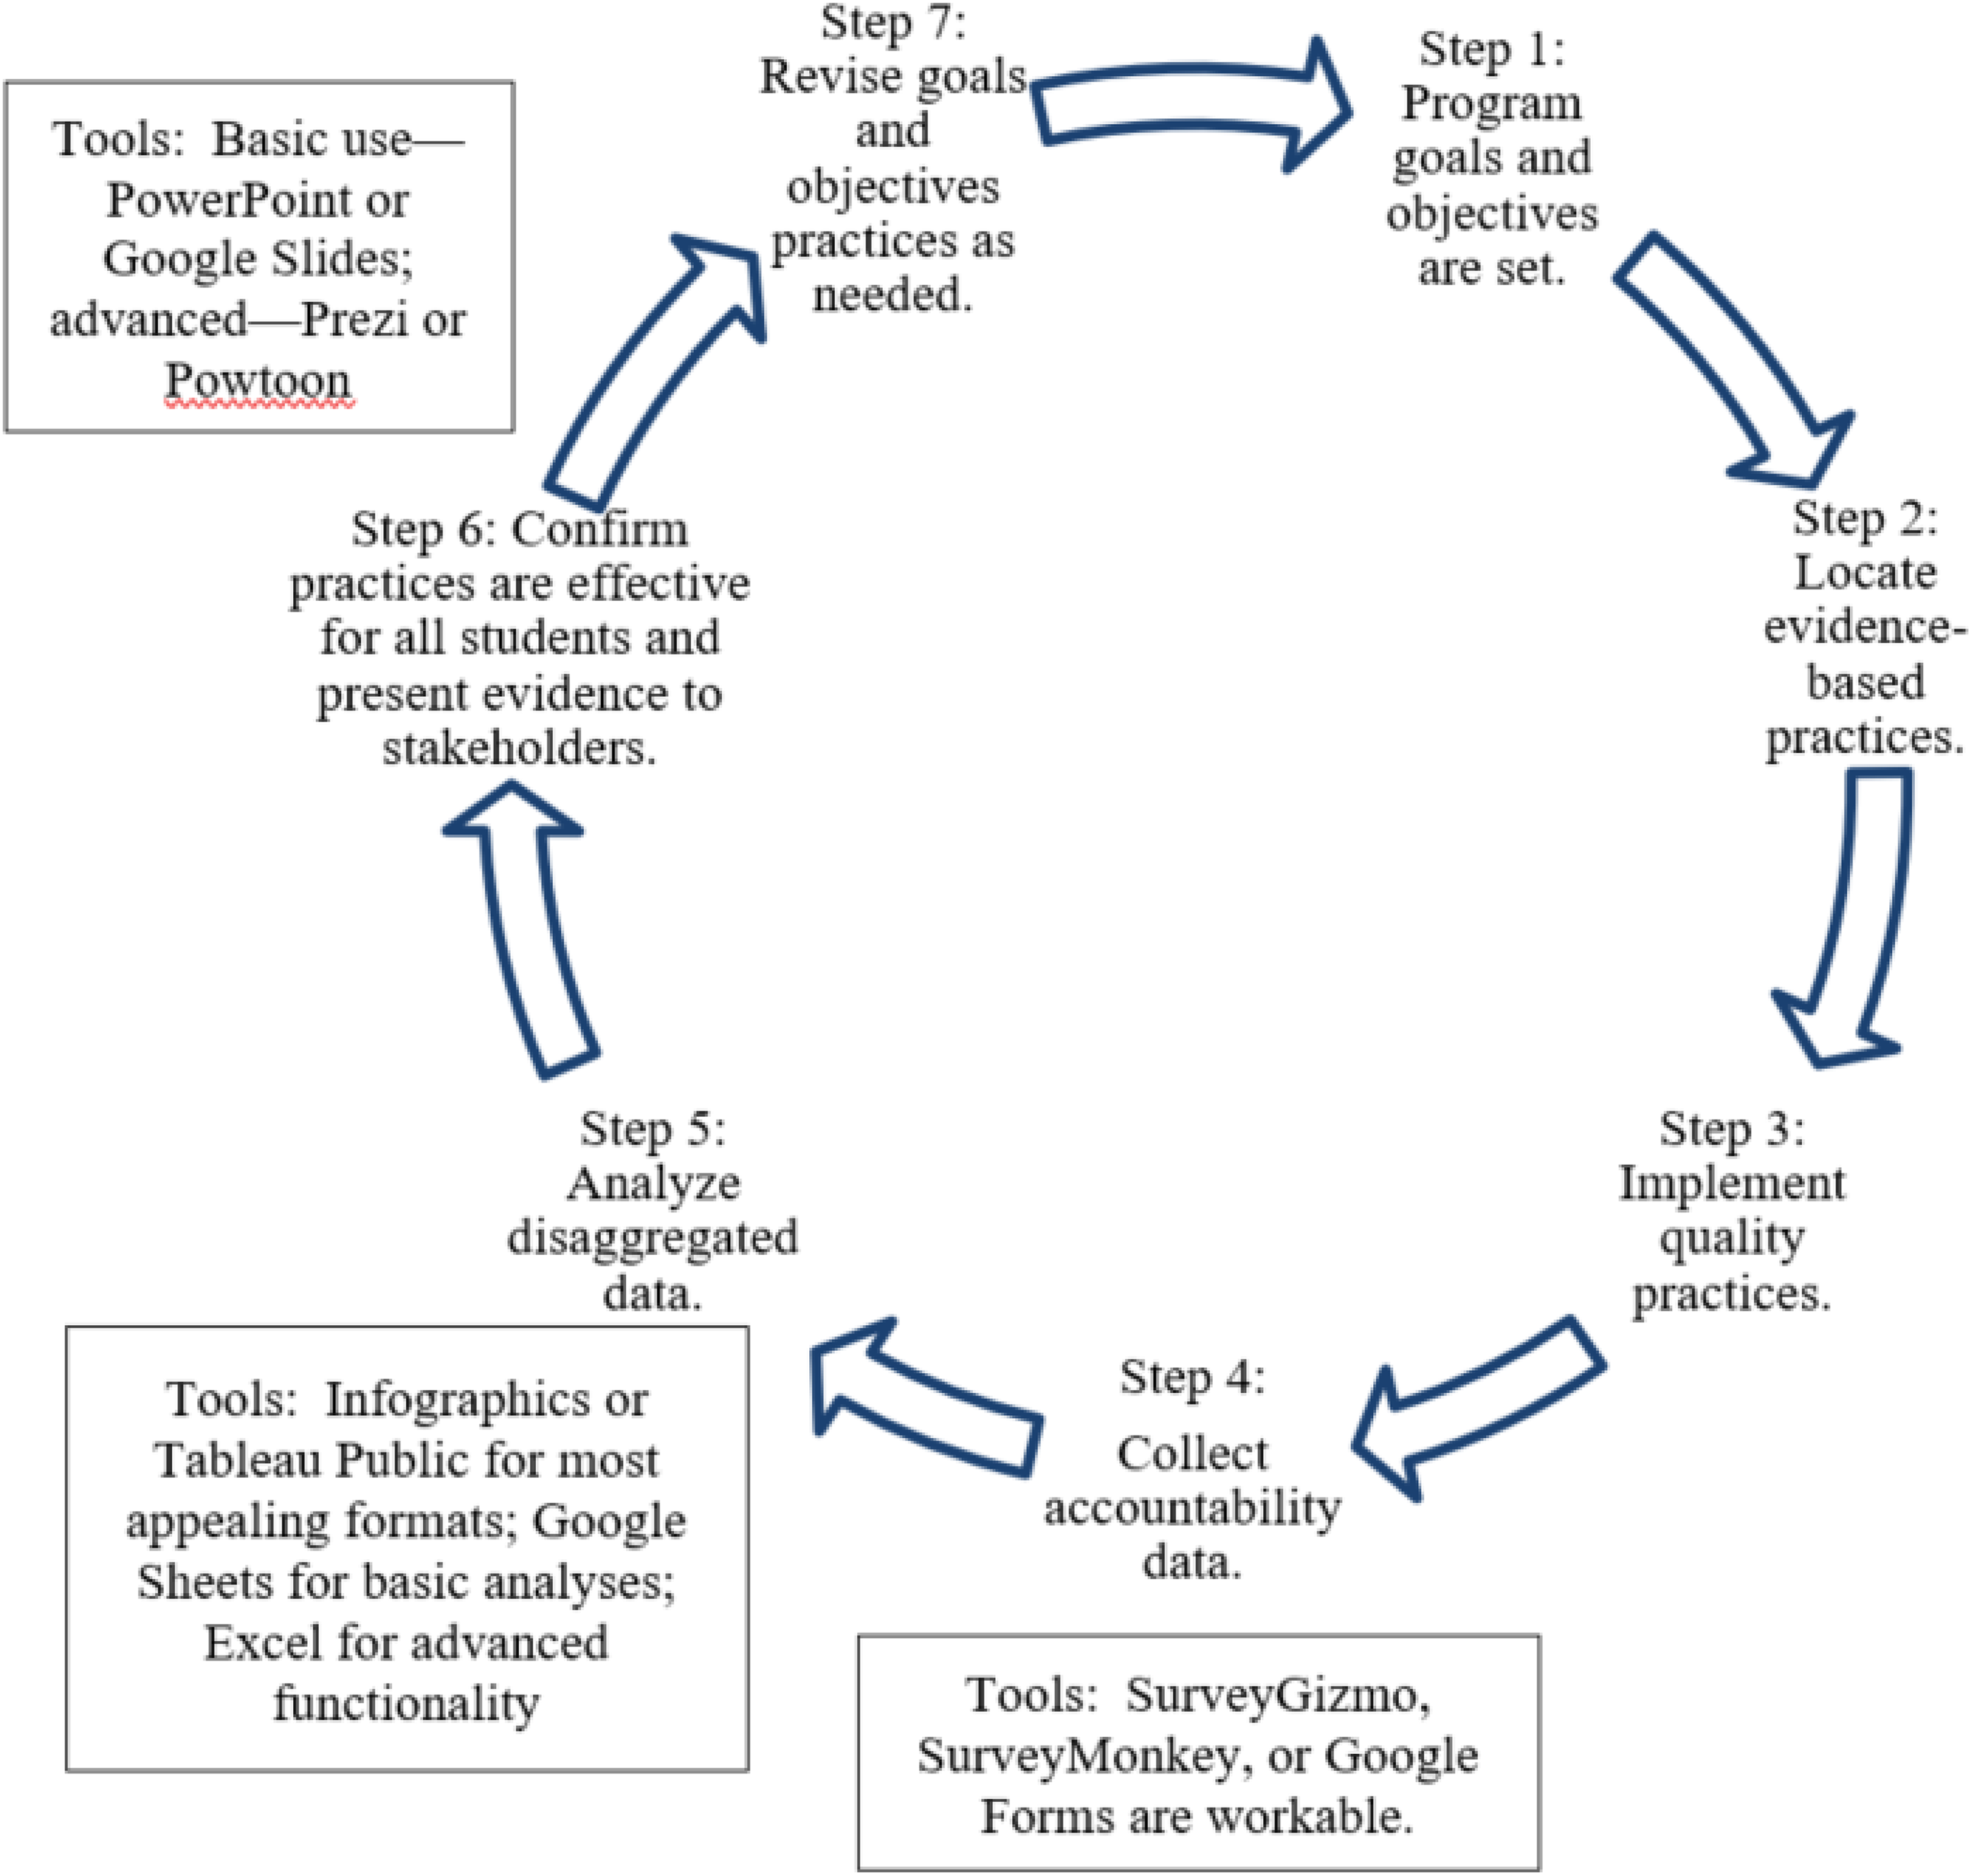
CSCP (comprehensive school counseling program) accountability cycle integrated with appropriate software.
Recommendations for Enhanced Software Training
Drawing from the school counseling literature addressing computer literacy issues
(Sabella, Poynton, &
Isaacs, 2010) and from the findings and comments of participants in
this software review, we suggest that the school counseling community redouble
its efforts to provide basic and advanced training on software-related skills
that are indispensable for evidence-based research and practices. Specifically,
we suggest that high-quality trainings on the topics described below be
regularly offered in preservice school counseling graduate programs and at
professional counseling conferences. Ideally, school districts also would offer
related computer and software literacy sessions.
We suggest that the school counseling community redouble its
efforts to provide basic and advanced training on software-related
skills.…Trainings should include nonthreatening assessments of
participant attitudes, knowledge, experience, and skill
levels.
First, instructional content should include key computer literacy issues and
data-related applications. School counselors should be able to demonstrate an
understanding of PC Windows and Mac OS, Internet use and pertinent search options (e.g., Google
Scholar), word processing tools (e.g., Microsoft’s Word for Windows or
Goggle Docs), “Cloud” data storage options (e.g., Box or Dropbox) to retain
and share users’ information, data collection tools (i.e., questionnaire/survey design
software), database management and analysis software, and data reporting/presentation applications.
We provided specific software recommendations for the last three data-related items above.
Second, trainings should include nonthreatening assessments of participant attitudes, knowledge, experience, and skill levels. Starting by appraising counselors’ attitudes/perceptions related to technology and software usage and literacy is helpful. To obtain a reading on participant attitudes toward evidence-based research and practices, counselors can complete a self-report confidence questionnaire (see Table 2 for an example). Once the training is finished, this questionnaire can be readministered, adding specific data-related software to gauge participants’ comfort level with those programs. With training, participants’ level of confidence should increase over time. Informal questionnaires measuring participant reflections on their training experiences and their knowledge and skill attainment also can be developed and administered. Short, ready-to-use computer and software literacy questionnaires and recommendations are readily available online (e.g., Kontos, 2007; Wilkinson, Roberts, & While, 2010). In summary, training facilitators should obtain self-report feedback from participants to determine whether the experience was helpful and identify ways to refine the process.
Software Training Assessment—Confidence Questionnaire (Sample Items).

Note. Use confidence questionnaire as a pre- and posttraining participant assessment tool. For the posttest, add specific software related to each area for evidence-based research and practice (e.g., data collection—Qualtrics, Google Forms). Comments can be summarized as overall trends.
Third, to maximize the benefit of the training for busy school counselors, it should be highly engaging and directly relatable to the implementation, management, and evaluation of components, services, and activities of comprehensive school counseling programs (ASCA, 2012). All sessions should include hands-on activities that involve publicly available school district data sets. Again, instruction and practice times should stress how these tools relate to school counseling program accountability and evidence-based practices.
Concluding Remarks
School counselors are expected to use appropriate accountability strategies to appraise the effectiveness of their comprehensive programs and their services to students and families and to close opportunity and achievement gaps among student groups (Young & Kaffenberger, 2013; Zyromski & Mariani, 2016). Although most counselors understand the need to be more invested in this important work, they often do not possess the requisite research and evaluation skill set. Numerous accountability resources are in print and, to some extent, available on the websites of professional organizations, but none, as far as we could ascertain, offer research- and counselor-vetted online programs associated with evidence-based research and practices. To address this lack of pertinent information, we reported the findings of a practitioner-focused evaluation of various data collection, analysis, and presentation applications. Based on the findings, we recommended software to assist with evaluation of comprehensive school counseling programs. With these tools, school counselors should be better equipped to navigate and implement the accountability cycle presented in Figure 1. Finally, we suggested that school counselor education programs offer extended trainings for both preservice and in-service counselors on software for evidence-based research and practices and we proffered specific components to include in these sessions.
Footnotes
Declaration of Conflicting Interests
The author(s) declared no potential conflicts of interest with respect to the research, authorship, and/or publication of this article.
Funding
The author(s) received no financial support for the research, authorship, and/or publication of this article.