
Abstract
As in all domains of human activity, economic issues and the increase of people working in scientific research have altered the way scientific production is evaluated as well as the objectives for performing the evaluation. The h index was introduced in 2005 by J. E. Hirsch as an indicator for the measurement of individual scientific output not only in terms of quantity but also in terms of quality, and its use has since spread throughout the world. In 2007, Hirsch proposed its adoption as the best way to predict future scientific achievement and, consequently, as a useful guide for investment in research and for institutions when hiring members for their scientific staff. Since then, several authors have also been using the Thomson ISI Web of Science database to develop their proposals for evaluating research output. Here, using a software we have developed, we analyze more than 100,000 articles and show that a subtle flaw in Web of Science can inflate the results of information collected, therefore compromising the exactness and, consequently, the effectiveness of Hirsch’s proposal and its variations.
Introduction: A Decade of h Index
In 2005, Jorge Hirsch proposed a quantitative evaluation method considering both quantity and quality that could be used by all research fields (Hirsch, 2005, 2007). From that time, we started discussing this indicator with the aim of showing that it is not merely a new mathematical value. It is important to note that it was proposed in the United States and this is an aspect to be taken into account when considering the quest for investing resources in areas that can give good economic results. According to the methodology proposed by Hirsch, to get to the h index, the first step is to organize all the articles published by a scientist in a sequence following a decreasing order of citation received by each article. Then, all the articles will be accounted for, but some will be disregarded. That is, when performing the analysis, we have to decide when to stop counting.
According to Hirsch, we should stop when the number of articles published by a scientist is smaller than the number of citations within this sequence. This methodology is very complex, but as time goes by, researchers would internalize it and it would be possible to attribute a number to all scientists: the h index.
To analyze Hirsch’s evaluation proposal carefully, with the aim of observing its nuances, it is useful to start with the title of his first article: “An Index to Quantify an Individual’s Scientific Research Output.” His proposal is not only an attempt to deal with the issue of how to evaluate scientific research output but also an opportunity to follow the birth of a measure within mathematics. Another point to take into account is that researchers from many different fields of knowledge have been devoting themselves to the discussion of the h index, showing that Scientometrics has been playing an important role for those directly involved, or not, in scientific research.
Hirsch’s proposal has spread throughout the world, and nowadays, a database calculates the h index for researchers who publish the results of their work in scientific journals indexed in the Science Citation Index (SCI). The career of a scientist, taking into account the articles he published and the citations received, can be represented by a hyperbolic function.
Here, the h index is determined when we draw a straight line from the origin to the curve of research output, so that the intersection between the line and the hyperbola is the gold number.
However, we could ask the following question: “how many lines—and consequently intersection points—could be drawn in this graph?” We could say that there are many possibilities, so it is necessary to make a decision about which intersection point we will take from a range of possibilities for the analysis, because there is not yet a criterion to justify which one is the best line for a quantitative evaluation. Therefore, we could consider this the first example that shows that the h index approach is not completely neutral, at least when we try to create indicators to measure scientific productivity.
What is surprising is that the claim for neutrality is, at first, exactly what justifies the wide acceptance and, consequently, the adoption of Hirsch’s proposal. According to it, the h index is able to merge quality and quantity into a single indicator, allowing it to be used to measure research output in any research area (Hirsch, 2005, 2007).
However, in his second article, Hirsch already starts with a question in the title: “Does the h Index Have a Predictive Power?” That is, he extends his initial proposal of the evaluation of a researcher’s career from his past results to the possibility of predicting his future achievement based on the h index (Hirsch, 2007). Furthermore, and of great importance, Hirsch, in his article proposes that the indicator can be a very useful tool in guiding the choice of scientific institutions when hiring staff. The h index would allow the creation of a hierarchy among a group of candidates indicating which of them would give more results throughout the years.
h Index: An Idea That Has Spread Throughout the World
We started our work on this indicator almost immediately after Hirsch’s article was published (Batista, Campiteli, Kinouchi, & Martinez, 2006). In the present work, we focus on two main goals: (a) to draw attention to its use by Thomson ISI, of data collected from papers published since 1945, and (b) to discuss the proposals made by some authors to use bibliometric indicators as a tool to predict the performance of scientists. To reach these goals, we show a counterexample in an attempt to demonstrate that these indicators are still far from the neutrality ideal for many scientists.
First, shown in Figure 1a, is an overview of how the proposal presented by Hirsch has spread throughout the scientific world at an exciting speed. Since 2005, when it appeared for the first time, the article proposing the h index was cited at an increasing rate over the years, reaching almost 300 citations per year in 2013. Thus, the article has already garnered almost 2,500 citations.
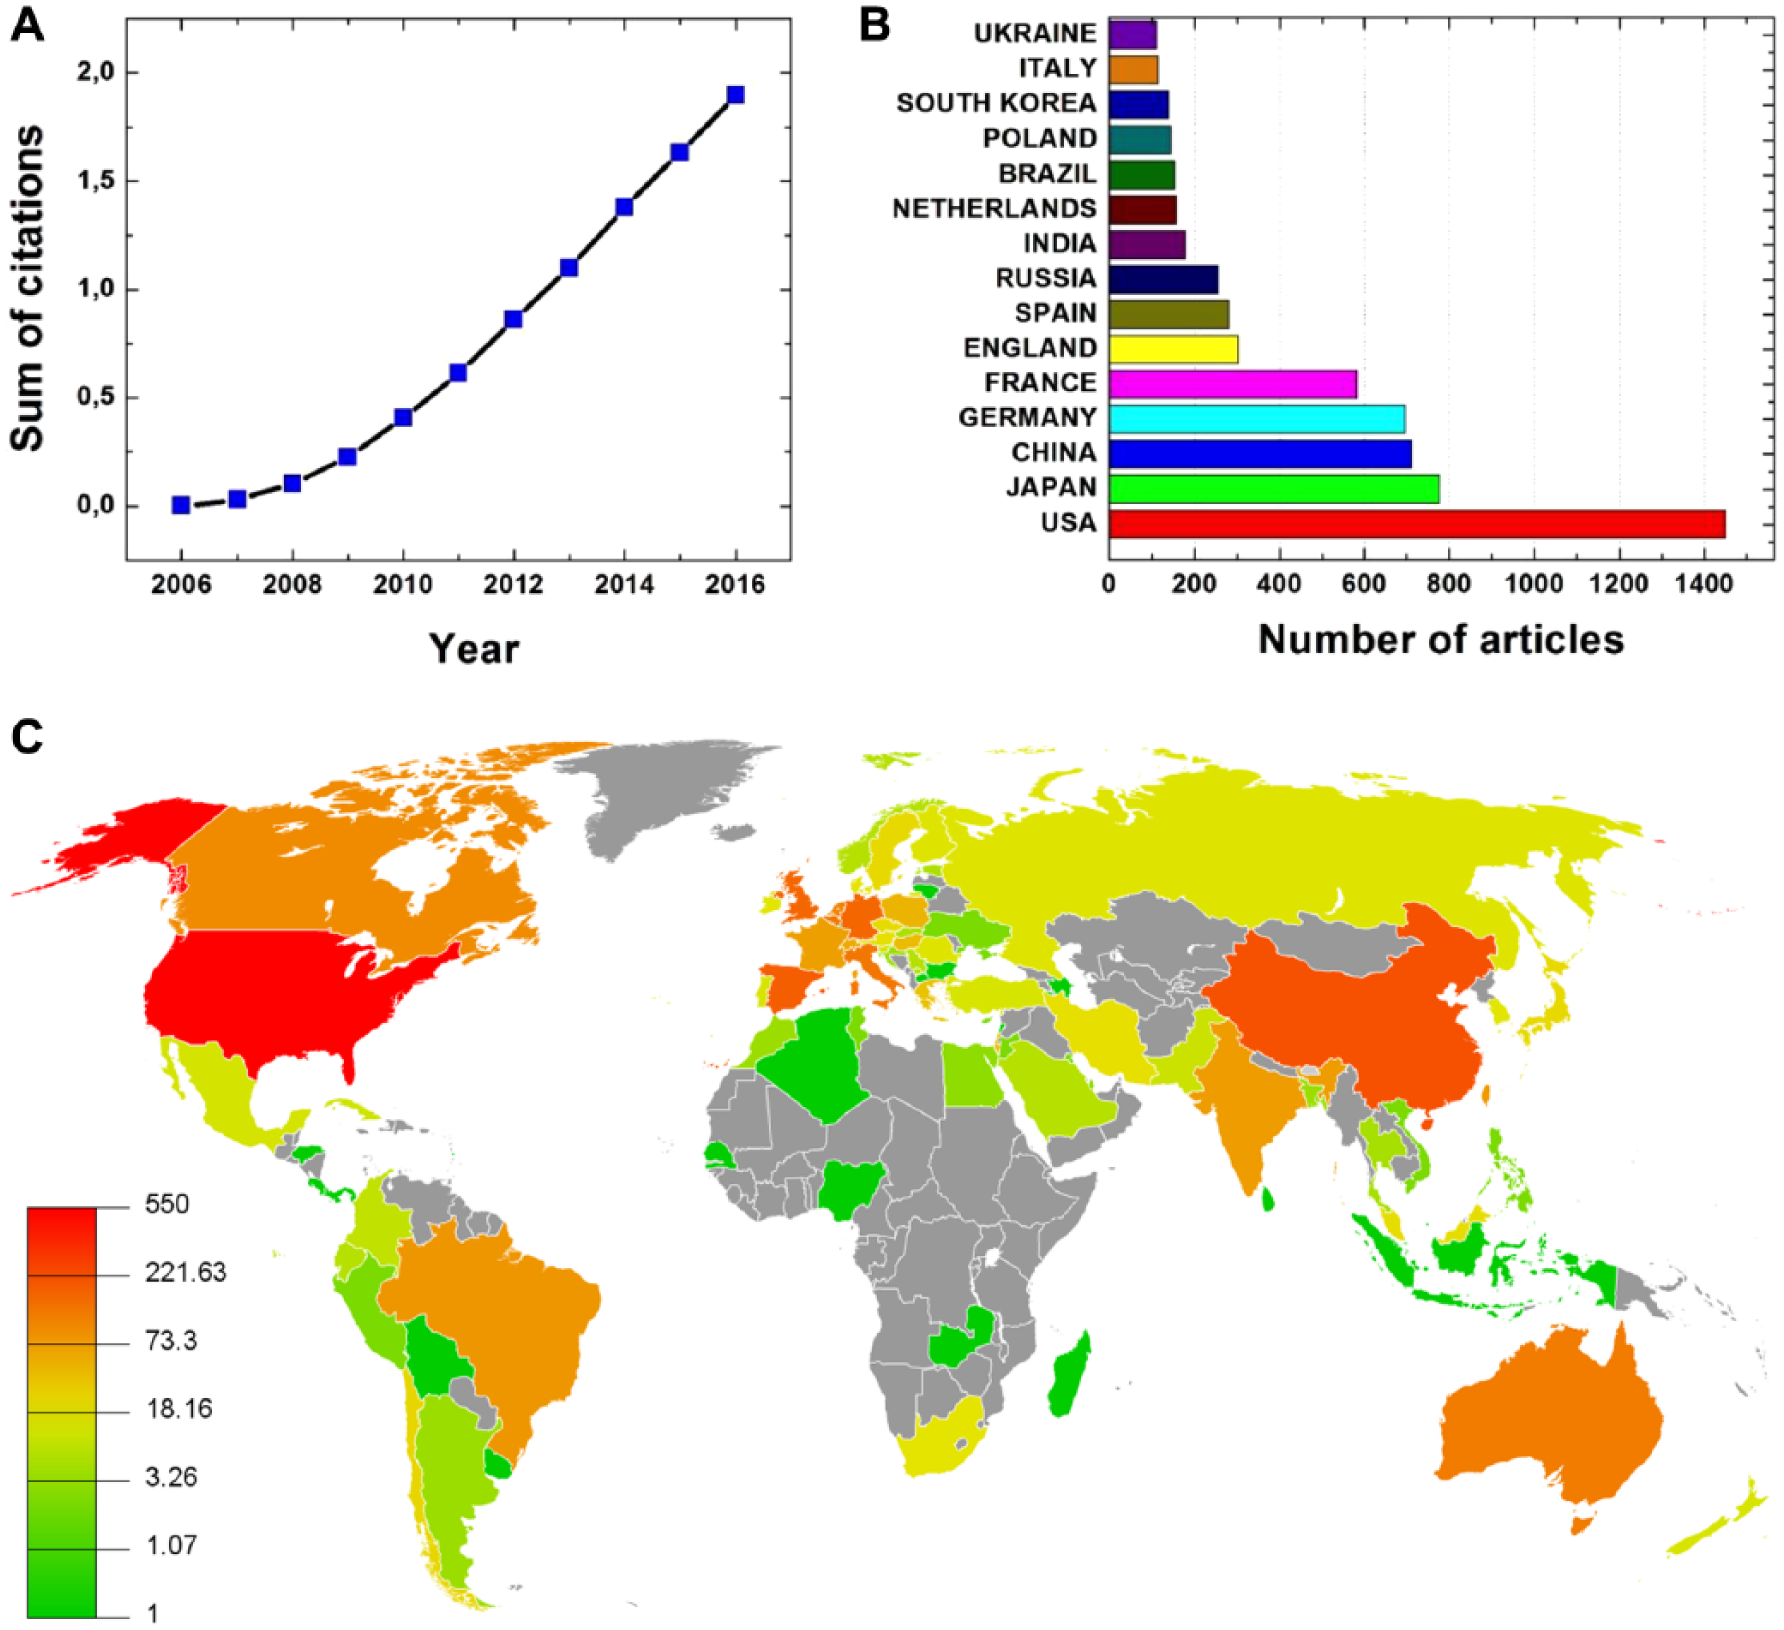
A decade of the h index in the world: (a) number of citations that the first article published by Hirsch received since 2005, (b) number of articles citing the first work of Hirsch focusing on the first 15 countries; and (c) geographical distribution of articles citing the first article by Hirsch on the h index, taken from Arthur Gunn Map 2—Global Chart Tool http://lert.co.nz/map/.
This shows our interest in time and quantitative methods with the aim of assessing scientific output. Figure 1b shows the number of articles published up to now citing the first work by Hirsch focusing on the first 15 countries that contributed to the spread of the h index throughout the scientific community. In addition, Figure 1c shows that these citations came from different parts of the world, as we can see in the geographical distribution map.
h Index: A Temporal Analysis
Eleven years after the publication of J. E. Hirsch’s article proposing the h index as a bibliometric indicator capable of aggregating, in a single number, both the number of papers published and the quality of the research developed by a scientist, the present work performs a brief tour of the Web of Science with the intention of mapping the state of this indicator. We note that the proposed h index brought up a discussion on the possibility of finding indicators that may contribute to the assessment in science. There are different types of discussions on the Hirsch work making it almost impossible for researchers who are not directly involved with the Scientometrics to keep track of all the issues that have arisen in the last 10 years. At the same time, it is important to follow the evaluation proposals because those indicators are being adopted not only as tools for evaluation but also as guides in the decision-making process. Considering this, we would like to focus here on what Hirsch proposes in his second article (Hirsch, 2007).
Hirsch’s first work on the h index appeared in 2005. Although several articles have pointed out its weakness (Batista et al., 2006; Braun, 2010), in a short time, Hirsch wrote three other articles trying to demonstrate its capacity to measure and evaluate research output. Among his articles, the second one is the best, in that, it allows us to identify the relationship between his scientometric proposal and the new order of performing science that began with modernity.
In his second paper, Hirsch proposes to use the indicator not only to classify scientists according to their past results but also as a tool to predict their future scientific performance. Immediately after its publication, we note that several other articles were published, now addressing the possibility of using this indicator as a representative measure able to predict the future achievement of scientists by considering their scientific production only, excluding, therefore, several factors, which are probably not measurable (Daniel, Stefano, & Konrad, 2012; Wang, Song, & Barabási, 2013; Mazloumian, 2012).
Hirsch’s proposal reminds us of what has become known as Laplace’s Demon, especially in his second paper, when he asks a question about the h index: “which measure is better able to predict its [scientific achievement] future values?” (Hirsch, 2007, p. 19193).
According to Laplace’s philosophical propositions on probability, there would be
an intellect which at a certain moment would know all forces that set nature in motion, and all positions of all items of which nature is composed, if this intellect were also vast enough to submit these data to analysis, a single formula . . . , for such an intellect nothing would be uncertain and future, just like the past, would be present before its eyes. (Laplace, 2009, p. 2)
With the aim of analyzing Hirsch’s proposal, we observe that the bibliometric data collected from the Web of Science are not reliable instruments for comparing scientists’ performance because we detected a disregarded subtlety in the database. This flaw concerns the interpretation of how this indicator should be calculated (Hirsch, 2005). To investigate how it can affect scientometric analysis, we have chosen to follow the career of the 2010 winner of the Nobel Prize in Physics, Andre Geim (Geim, 2011; Hancock, 2001). This is not an arbitrary choice, because his example is an interesting one for the two major objectives of this work.
The h Index “Bug” in the Web of Science
We know that, traditionally, the number of articles published and the total number of citations received this way are the bases for many scientific performance indicators that have recently been proposed. For this reason, the first option is to use the Web of Science to obtain the value of this indicator, within a time lag, to restrict the search to a definite time interval of interest. The first step in analyzing the evolution of bibliometric indicators is to search the Web of Science by considering the author’s name. We decided to search for Geim’s results from 1945 to 2016. The Web of Science presents the results allowing you to create a citation report as shown in Figure 2a.
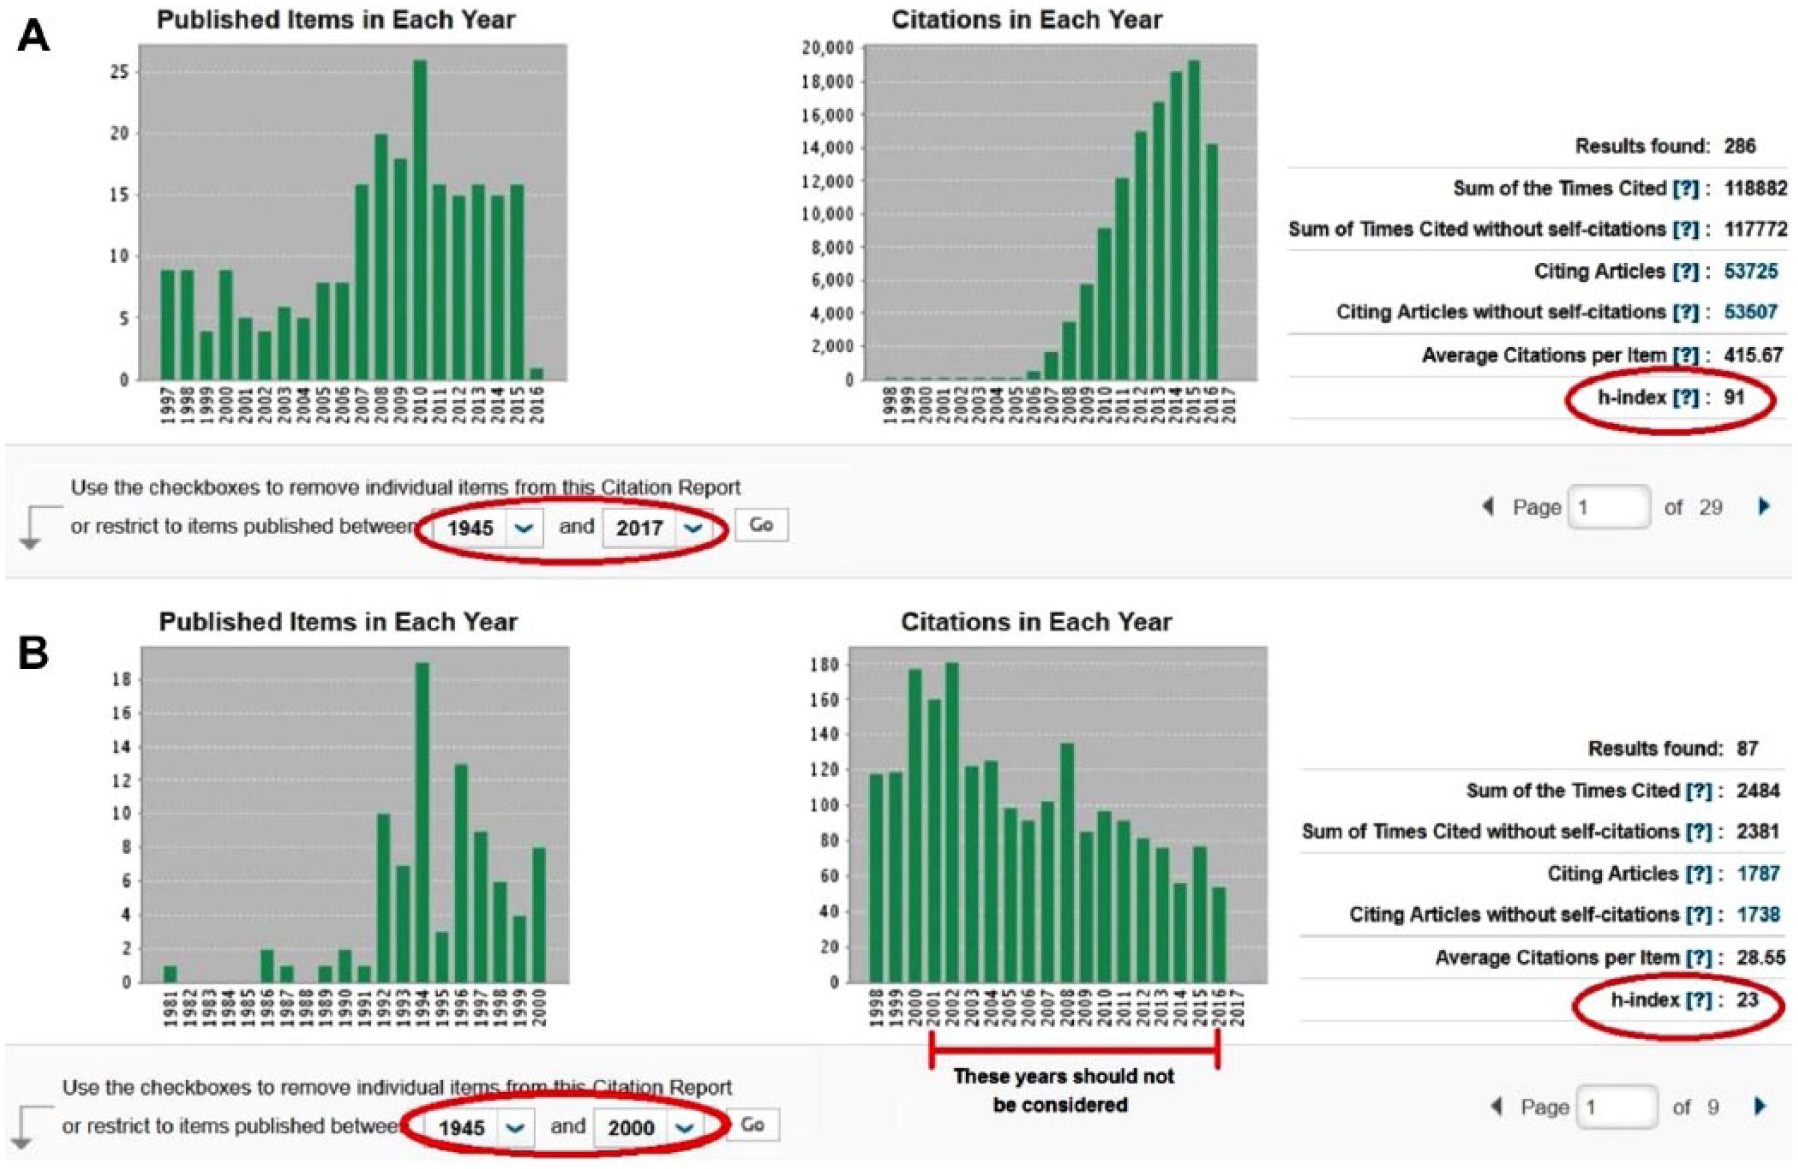
Temporal analysis of the h index using the Web of Science: In (a), we choose a time window between the years 1945 and 2016 obtaining a value of 91 for the h index. Then, to calculate the value of this indicator in 2000, we could simply change the time window as shown in (b), by selecting the years between 1945 and 2000.
The database presents the user with six indicators, including the h index. Just by changing the final year at the TimeSpam option, it would easily be possible to analyze the evolution of these indicators. For example, Figure 2b shows Geim’s h index value in 2000. We first found that the tool correctly restricts the number of articles published within the expected range (see “Published Items in Each Year” in Figure 2b). However, on observation, this does not happen to the accounted citations garnered by the papers, until 2016 (see “Citations in Each Year” in Figure 2b). That is, the results for all the indicators are inflated, because they also include the citations received between 2001 and 2016, therefore compromising the scientometric analysis.
We have developed software able to automatically get pieces of information, taking as input all citations received from all articles by each scientist. In this case, we had to access data usually not available in the Web of Science, in an attempt to question how this tool calculates the h index over the years for each scientist. In other words, it is necessary to access the citations individually, received by each article for each year investigated. The Web of Science only presents the total of citations received for each article. Furthermore, in the Web of Science, the amount of information required to perform this operation is not available to the user in an easily accessible way. For example, for Geim, in particular, more than 100,000 citations are accounted. To perform a temporal analysis of his career, it would be necessary to fix the year of each one of these citations. We can do this by using Web of Science; however, accessing each one of the articles makes the task almost impossible when we investigate a scientist like Geim. The key point of our proposal here is that the software we developed automates the data extraction and processes them in a few minutes and makes it possible for us to analyze more than 100,000 articles in the present work. Figure 3 shows an overview of the software we developed in Python to access Web of Science data.

Flowchart of the software developed in Python to access the database in order to capture recursively the citations received by each article.
The software is able to access all articles of a given scientist in the Web of Science, collecting only the title, year of publication, and all citations received by the article year by year. We discarded the rest of the information of the items and no piece of information was saved. A text file was created for each article, containing the title in the first line, the year of publication of the article in the second line, the index identifier in the third row, and then the year of each citation, one per line. This software was developed to access the Web of Science site autonomously, that is, without human interference. To speed up the process, it runs on individual threads for each page of the list of items, reducing the final implementation time. The Web of Science site contains a security system that requires the cookie generated in the first access to access a second URL, this process is known as “session.” To have access to this website, it was necessary to store the cookie information and reuse it for each request.
Figure 4 shows the results for two scientometric analyses and the evolution of the values for the scientist throughout the years. It is easy to notice that the results show that the database increases an average of 20% of the value of his h index because it does not correctly restrict the number of citations received by each publication according to the user-selected period. This error may be greater or lesser depending on both the year and the scientist analyzed. In addition, the Web of Science should present the correct value of this indicator because this quantity has an exact value considering the journals indexed by the database.

Scientometric analysis of the career of the Physics Nobel Prize winner in 2010: (a) h index and (b) the total number of citations, both throughout time.
Andre Geim: A Point Outside the Curve
In 2000, physicist Andre Geim was awarded the Ig Nobel for his experiments with frog’s levitation (Berry & Geim, 1997). It is important to consider that the Ig Nobel seems to be a kind of joke about scientific activity; however, it is able to provoke profound reflection on many aspects of science. In fact, its motto is “first make people laugh, and then make them think.” Moreover, 10 years later, Geim receives the Nobel Prize in Physics for the isolation of graphene (Novoselov et al., 2004).
Until being awarded the Ig Nobel, Geim’s papers had already a considerable number of citations. However, after publication of the article on the isolation of graphene in 2004, the number of citations started to grow exponentially: It jumped from 9,000 to 90,000 within a very short period of time. The same also happened with his h index that went from 17 to 46 between 2000 and 2010.
Considering this, we would like to analyze the career of this scientist from the point of view of the bibliometric indicators as shown in Figure 4. However, until the isolation of graphene in 2004, we can say that if we were to evaluate the performance of the researcher adopting the proposal made by Hirsch, we could not predict that this indicator would reach a value of 81 in 2015. We could make an analogy here with the fairytale, The Prince Frog—based on a children’s tale by the Grimm Brothers—in which a princess kisses a frog and it turns into a prince: “You have to kiss a lot of frogs before you find your handsome prince.” Geim followed a certain random trajectory in his scientific career. His experiments with frog levitation described in Berry and Geim (1997) can be compared with the princess who kissed many frogs before finding her prince. In Geim’s case, the article on graphene’s isolation (Novoselov et al., 2004) was his prince frog.
It is remarkable that Andre Geim is the only scientist up to now to be awarded the Ig Nobel and the Nobel. In an interview after the Nobel, Geim talks about what he calls “Friday night experiments”: “When you try something very elementary and try to go in one or another direction” (Smith, 2010). No institutions sponsor these experiments, of course. That was what he was working on when he was nominated for the Ig Nobel.
Despite what being awarded the Ig Nobel could represent, Geim went on with his scientific career, and 10 years later, he won the Nobel for the isolation of graphene.
To illustrate this, we compare two scientists. Figure 5 shows the results of scientometric analysis where Andre Geim is compared with a Brazilian scientist (Tsallis, 1988). We chose his example because he was in first position in a ranking we did in 2005. As a starting point, we used Hirsch’s proposal, which proposed h’. This variation takes into account the coauthorship of each article when performing the analysis. For more details, see Batista et al. (2006). It is possible to observe the turning point from 2004 on, considering the results obtained for Geim’s achievement for both indicators. Until 2004, therefore, according to our proposal here, it would not be possible to predict that Geim would surpass Tsallis in 2010 taking into consideration the results of those indicators presented in Figure 5. Nevertheless, as we know, after the publication of the articles on graphene, we note that the growth rate of those indicators for Andre Geim significantly increased.
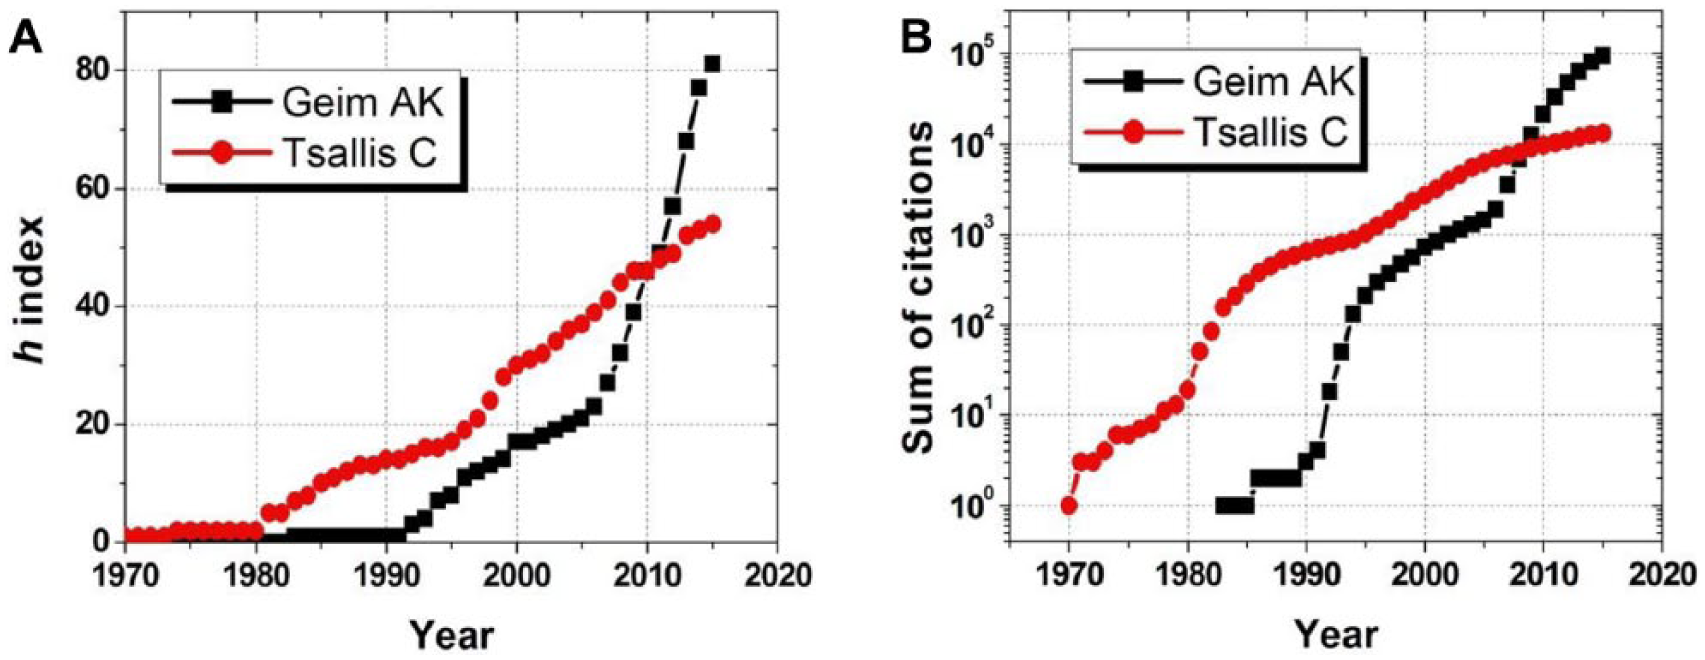
Comparative results for Geim and a Brazilian scientist.
Conclusion
We presented here a subtle flaw detected in the Web of Science database in 2015 during the analysis of the scientific career of the winner of the Nobel Prize in Physics in 2010 in the Scientometrics context (Zarka, 2009). First, we note that the tool does not appropriately restrict the citations received by articles in accordance with the time lag set by the user during the search in the site when creating the Citation Report. Finally, we question the proposal recently made by some authors, to use the h index as a statistical tool able to predict the performance of scientists. To reach this goal, we chose a methodological approach presenting an emblematic counterexample, showing that this proposal would probably fail to predict that A. Geim would achieve the results allowing him to win the Nobel Prize. It would also probably fail to predict that his h index would reach an h index of 82 by 2015, which was demonstrated by using the example of the scientific output of the Brazilian researcher. In this way, we intend to point out the risk assumed if we believe that the creative process in science can be quantified with the goal of predictability.
Hirsch proposes an index to predict the future of scientists’ merging quality and quantity into a single number. As far as we are concerned, this proposal of using mathematics probability or statistics, aiming to predict future research achievement, is not possible because the phase transition in a scientist’s career seems not to be predictable by an index or methodology as shown in this work through the example of the Nobel—and Ig Nobel—winner Andre Geim.
Although at first sight, this could be negative, from a scientific point of view, because it indicates that one of the most important goals in science is not achieved—the aim for establishing models that can cover the phenomena. We should consider that it also preserves the element of surprise involved in the discovery, a fundamental part and basis to science.
As stated in Braun (2010), having metrics as a single criterion to define research budget could lead to “bad science,” as pay levels and pay rises are not connected to the scientists’ real motivation. Furthermore, rewarding “linked to overall contributions” can really represent a great factor of motivation for scientists.
Therefore, why did the h index spread throughout the world and reach such visibility? The first hypothesis is that this indicator fits the ideal of an epoch. That is, we believe that the h index appears at a time when the concept of a man who is always under evaluation is a reality as philosophical studies have pointed out (Zarka, 2009).
The search for an ideal number portrays an attempt to find the best formula for the assessment of scientific activity. We aim to find a quantitative value to classify a scientist considering him or her as an isolated person, but we cannot forget that nowadays everybody is connected to a network and part of a community. Therefore, proposals such as these seem to go beyond mathematics’ boundaries.
In this work, we tried to show that the quantitative evaluation of research output is based on the development of a technological apparatus able to digitize scientific knowledge taking into account the citations found in papers.
Thus, focusing on Jorge Hirsch’s proposal of h index, we tried to show that mathematics when applied to a social field—in this case, research activity—loses its objectivity, because any indicator results from human elaboration, therefore requiring a choice. This choice may be economical, political, or even aesthetic. Therefore, indicators cannot bring with them the characteristics of universality and neutrality partially attributed to mathematical knowledge.
Footnotes
Acknowledgements
The authors acknowledge The Commission for the Improvement of people in Higher Education (CAPES), for allowing Brazilian universities and research institutions to access the Web of Science database.
Authors’ Note
Data included here are derived from the Science Citation Index Expanded, prepared by Thomson Reuters, Philadelphia, Pennsylvania, USA, Copyright Thomson Reuters, 2016.
Declaration of Conflicting Interests
The author(s) declared no potential conflicts of interest with respect to the research, authorship, and/or publication of this article.
Funding
The author(s) received no financial support for the research, authorship, and/or publication of this article.