
Abstract
This study examines the theoretical models used in electronic commerce (e-commerce) research and provides insights into future directions for measuring e-commerce success in the age of digital transformation. Based on the literature review, e-commerce development can be divided into seven phases, including initiation (between 1993 and 1994), start-up (between 1995 and 1999), growth (between 2000 and 2004), customer data analytics (between 2005 and 2009), social media (between 2010 and 2012), emerging technology (between 2013 and 2021), and generative AI (from 2022 onward). A comparative analysis is conducted to examine the theoretical models employed in e-commerce success studies. In total, 56 distinct models are identified and classified into four categories: most-used (4), often-used (4), rarely used (10), and single-use models (38). Four models were identified as the most effective for e-commerce research: the technology acceptance model (TAM), the technology–organization–environment (TOE) framework, the DeLone and McLean information systems success model and its extensions (D&M), and diffusion of innovation (DOI). However, this results in theoretical diversification and underscores the need for a more integrative, system-level approach, combined with organizational-level measurement, to conceptualize e-commerce success. A few studies have attempted to transform qualitative data into quantitative forms for comparative analysis. A case study is used to develop a transformative approach that demonstrates how a qualitative model can be converted into a quantitative one. As a result, an initial quantitative operationalization of the e-commerce success model – the EBS measurement model – is developed to translate qualitative success dimensions into measurable constructs, which can be used as a tool to provide an overall measurement through CSFs for businesses in measuring e-commerce success.
Keywords
Introduction
Although the COVID-19 pandemic has disrupted business operations and performance worldwide (Lee et al., 2023, p. 59; Gao et al., 2023, p. 1; Pratap et al., 2023, p. 736), it has simultaneously accelerated the expansion of online consumption, transforming electronic commerce (e-commerce) from an optional channel into a primary mode of commercial exchange (Li et al., 2022, p. 113; Q. Luo et al., 2023, p. 1). Conceptually, e-commerce refers specifically to digitally enabled buying and selling activities, particularly online transactions between firms and consumers or between businesses. Electronic business (e-business), by contrast, is considered the most comprehensive term in the realm of digital business (Ozansoy Cadirci & Sagkaya Gungor, 2021, p. 224). More recent research increasingly adopts the term digital business to capture the broader impact of digital transformation on business systems, structures, activities, and customers (Beynon-Davies 2018, p. 99; Broekhuizen et al., 2021, p. 851; Verhoef & Bijmolt, 2019, pp. 342, 344; Verhoef et al., 2021, p. 889). While these terms are sometimes used interchangeably in literature, this study treats e-commerce as a transactional subset of e-business and e-business as an operational component within the broader domain of digital business, thereby enabling clearer conceptual positioning of e-commerce success in the context of digital transformation.
In the literature, the three positive words have been widely used in e-commerce research, including the term “adoption” focusing on the initial system usage (Ain et al., 2019, p. 7), the term “success” concentrating on achievement of expected benefits and outcomes (DeLone & McLean, 1992, 2003), and the term “utilization” paying attention to the extent and pattern of system use (DeLone & McLean, 2003; Goodhue & Thompson, 1995). Among them, the term “success” (41%) is used more frequently than “utilization” (38%) and “adoption” (28%; Ain et al., 2019, p. 7). In this study, e-commerce success is conceptualized as an outcome construction for evaluating the performance and effectiveness of e-commerce, e-business, and digital business initiatives, rather than as a substitute for these domains.
Digital transformation is defined as the use of technology to radically improve enterprises’ performance or reach (Jablonski & Jablonski, 2019, p. 3). While digitalization plays a significant role in advancing the Sustainable Development Goals, the economic and environmental challenges of the future cannot be solved sustainably without the digital transformation of existing businesses (Bican & Brem, 2020, p. 1). However, digital transformation is not only seen as the outcome of the interplay between digital technology, digital business model, and digital innovation. It is also influenced by three distinct elements: (i) technological viewpoint or digital readiness – based on the use of new digital technologies, such as social media, mobile, analytics or embedded devices; (ii) organizational viewpoint – requiring a change of organizational processes or the creation of new business models; (iii) human viewpoint or external collaborations – such as impacting on aspects of enhancing customers’ experience and satisfaction (Bican & Brem, 2020, p. 9; Jablonski & Jablonski, 2019, p. 3). While customer satisfaction is the primary focus of businesses, digital transformation prompts them to reassess and realign their practices to meet changing customer needs (Pratap et al., 2023, p. 736). It may be particularly relevant to incumbent firms, affecting the use and usefulness of performance metrics for e-commerce success (Verhoef et al., 2021, p. 892). For example, global cross-border e-commerce sales are expected to reach ∼US$4.2 trillion by 2027, representing a 28.4% increase from 2020 (Zion Market Research, 2019).
Therefore, today’s business demands for digital transformation make e-commerce success an attractive area for business research (Ku et al., 2018, p. 1; Soluk & Kammerlander, 2021, p. 704), which can serve as a critical benchmark for businesses’ sustainable e-commerce success (Pratap et al., 2023, p. 749). In the context of digital transformation, qualitative data primarily refers to perceptual, experiential, and evaluative information reported by organizational stakeholders, such as managers’ assessments of system effectiveness, strategic alignment, operational support, and overall satisfaction with e-commerce initiatives. These assessments are inherently qualitative in nature, as they are expressed through subjective judgments, narratives, or ordinal evaluations rather than directly observable performance metrics. Transforming such qualitative assessments into quantitative constructs enables systematic empirical analysis, comparison across organizations and contexts, and the integration of perceptual outcomes with structural and performance-based variables. This transformation does not aim to reduce the richness of qualitative insights, but rather to operationalize them as measurable constructs that can be analyzed within explanatory and predictive models of e-commerce success. However, researchers face challenges when using qualitative data, especially when transforming it into quantitative data in a transparent, systematic, and replicable manner (De Block & Vis, 2019, pp. 512–513). On the other hand, although up-to-date studies have focused on developing a theoretically grounded model to guide organizations that wish to adopt digital transformation by providing a comprehensive, objective, consistent, and standardized approach, no existing models fully satisfy all the criteria to improve digital transformation processes (Gökalp & Martinez, 2021, pp. 6282, 6295).
This study examines the theoretical models used in e-commerce research and provides insights into future directions for measuring e-commerce success in the age of digital transformation. Adopting a structured, theory-oriented literature review methodology, the study integrates systematic literature screening, comparative model analysis, and a case study to support conceptual synthesis rather than statistical generalization. The following sections focus on literature review, methodology, analysis, comparative analysis, case study, conclusion, recommendations, implications, limitations, and further research directions.
Literature Review
This study uses a structured literature review to reflect established review conventions, progressing from study identification and screening to model classification, comparative synthesis, and implications. Following established literature, this study adopts 1993 as the starting point of the e-commerce era. The first popular web browser – NCSA Mosaic – began to bring people to the web in the spring of 1993 (Ngai & Wat, 2002, p. 416; Zwass, 1996, p. 20). Three of the earliest e-commerce studies include Internet economic bulletin boards (K. W. Rogers, 1993), the advantages and disadvantages of electronic data interchange (Scala & McGrath, 1993), and the virtual corporation in information systems (IS) research (Byrne et al., 1993). Researchers have different views on the starting points for e-commerce. For example, Gupta et al. (2009) believed that the concept of e-commerce was initially discussed in 1992. Ozansoy Cadirci & Sagkaya Gungor (2021, p. 226) argued that the advent of the Internet and its commercialization began in 1994 with the first e-commerce transaction. However, neither study provided robust evidence to support their claim.
The literature shows that information, computers, and networks became the most visible nouns in early commercial web studies in 1994 (Ozansoy Cadirci & Sagkaya Gungor, 2021). More e-commerce research has been published since 1995 (Lugmayr & Grueblbauer, 2017; Ngai & Wat, 2002, p. 419). Since 1998, research on various e-commerce schemes has been conducted, including e-commerce loyalty (Valvi & Fragkos, 2012), transportation organization and procurement mechanism design (Lafkihi et al., 2019), and information disclosure methodology (Kolotylo-Kulkarni et al., 2021). Since 1999, mobile payments (Dahlberg et al., 2008, 2015) and the potential for creating e-business (Vaithianathan, 2010). Since 2000, various schemes in e-commerce research have been under discussion, such as personalization research in e-commerce (Adolphs & Winkelmann, 2010), value co-creation in e-commerce (Paredes et al., 2014), the influence of culture on website design and users’ perceptions (Moura et al., 2016), consumer-driven e-commerce (Lim et al., 2018), BI system success (Ain et al., 2019), and technical issues in consumer behavior (Ozansoy Cadirci & Sagkaya Gungor, 2021; Vanhala et al., 2020). Since 2003, research on e-commerce loyalty has dramatically increased (Valvi & Fragkos, 2012). Since 2005, e-commerce research has focused on social commerce and customer analytics, including social media marketing (Lamberton & Stephen, 2016), big data analytics (Akter & Wamba, 2016; Han et al., 2018), and analytics on connected consumers (Ozansoy Cadirci & Sagkaya Gungor, 2021).
Since 2010, diversity research has become increasingly prominent, including social media (Lamberton & Stephen, 2016), the spatial diversity of e-retailing (Sadowski et al., 2021), and digital marketing encompassing social, consumer, and service aspects (Ozansoy Cadirci & Sagkaya Gungor, 2021). Emerging technologies, including blockchain technology, business intelligence tools, and interactive approaches, have been applied to e-commerce applications since 2013 (Hawlitschek et al., 2020). Market intelligence tools have been used for data analysis since 2015 (Lamberton & Stephen, 2016, pp. 17–18). Research has also revealed a shift from a transactional focus to an interactional emphasis, keeping the social consumer at the center since 2015 (Ozansoy Cadirci & Sagkaya Gungor, 2021, p. 232).
Since 2022, generative artificial intelligence (AI) has been introduced into e-commerce. The reason is that AI can predict and enhance organizational agility in e-commerce by incorporating comprehensive data collection, prediction, and analysis methodologies (Shafiabady et al., 2023, p. 2). For example, on March 25, 2022, Bloom, the product photo performance engine, announced that it had raised $1.1 million at the close of its seed funding round, which aims to enhance customers’ online shopping experiences and drive more sales (Investment Weekly News, 2022). In March 2023, Shopify (Kronos Advanced Technologies, Inc., 2023) integrated AI-powered ChatGPT into its e-commerce platform, facilitating the creation of product descriptions, website copy, newsletter content, social media marketing, and other essential business tools for e-commerce companies (Bizcommunity, 2023).
Based on the above literature review, e-commerce development can be divided into seven phases, which which provide the analytical context for examining how the conceptualization and measurement of e-commerce success have evolved, including initiation (between 1993 and 1994), start-up (between 1995 and 1999), growth (between 2000 and 2004), customer data analytics (between 2005 and 2009), social media (between 2010 and 2012), emerging technology (between 2013 and 2021), and generative AI (from 2022 onward; see Supplemental Appendix 1). By delineating the seven developmental phases of e-commerce, the literature review illustrates the evolution of research themes and success measurement priorities over time. During the initiation, start-up, and growth phases, research focused primarily on technological feasibility, transaction efficiency, and early user adoption, laying the theoretical foundations for models such as the technology acceptance model (TAM) and the diffusion of innovations (DOI). Although later phases incorporated organizational and contextual considerations – most notably through the technology–organization–environment (TOE) framework and the DeLone and McLean information systems success model (D&M) – e-commerce success continued to be conceptualized largely in terms of system usage, user satisfaction, or system quality.
As e-commerce progressed into customer analytics, social media, and emerging technology phases, research expanded to address data-driven decision-making, platform integration, and social interaction. However, these developments were predominantly examined through extensions of adoption- and usage-centric models, resulting in incremental rather than fundamental shifts in how success was measured. The emergence of generative AI since 2022 further exposes these limitations, as AI-enabled e-commerce systems increasingly generate value through anticipatory, adaptive, and automated processes that are not directly observable through adoption rates or transaction frequency. This cross-phase comparison highlights a growing mismatch between prevailing success models and contemporary e-commerce practices, underscoring the need for business-level, outcome-oriented measures of e-commerce success in digitally transformed environments.
Methodology
This study follows established literature review methodologies in information systems research by adopting a structured, theory-oriented approach. Consistent with prior review studies, the process includes systematic database searching, explicit inclusion and exclusion criteria, staged screening, and qualitative synthesis of theoretical models rather than statistical meta-analysis. The emphasis is on theoretical identification, classification, and comparative analysis, which are appropriate for examining model use and conceptual development in e-commerce success research.
The literature shows that Ain et al. (2019) and Khoo et al. (2016) had reviewed e-commerce research until 2018. Thus, this study investigates studies published between January 2018 and May 2025. Due to single-journal studies, they cannot capture the overarching trend and cover the entire domain (Ozansoy Cadirci & Sagkaya Gungor, 2021, p. 225). This study investigates studies published in Q1-ranked journals. The reason is that Q1 publications typically represent the most influential outlets within a field, characterized by rigorous review standards and high citation impact. As this study aims to synthesize dominant theoretical perspectives and measurement approaches related to e-commerce success, limiting the review to Q1 journals helps ensure conceptual robustness, methodological consistency, and relevance to mainstream scholarly discourse, which may support the study in identifying widely recognized and theoretically grounded success measures.
A mixed research approach combines qualitative and quantitative methods, including a literature review, comparative analysis, and case study (see Figure 1). Studies by Ain et al. (2019) and Khoo et al. (2016) are included in this study as a priori reference framework rather than as part of the systematically screened article pool. They provide comprehensive syntheses of the theoretical models used to conceptualize e-commerce success in earlier periods. Their inclusion enables a longitudinal and conceptual comparison of success dimensions derived from the Q1 journal samples between 2018 and mid-2025 within a broader historical and theoretical context (Figure 2).
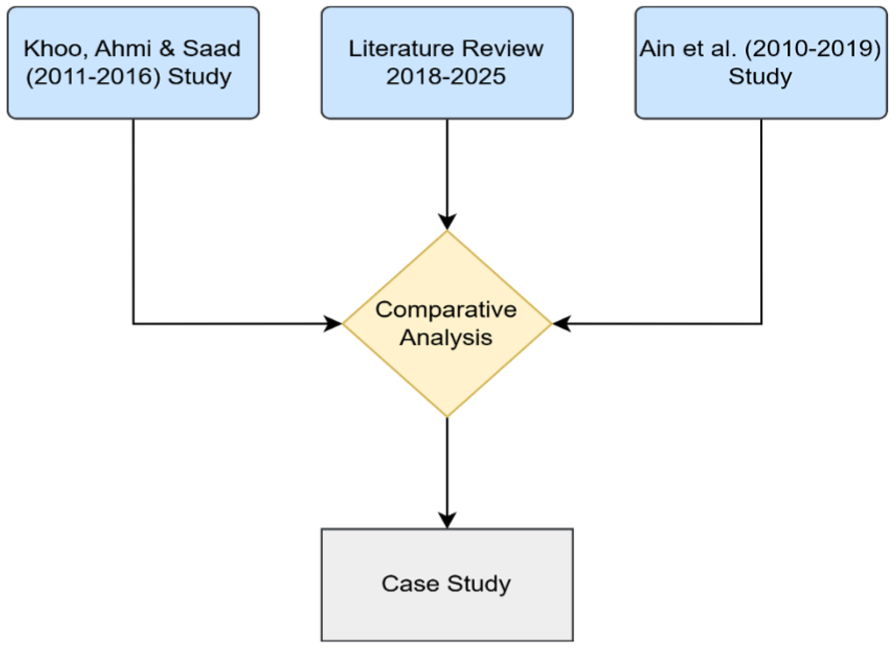
Research methodology.
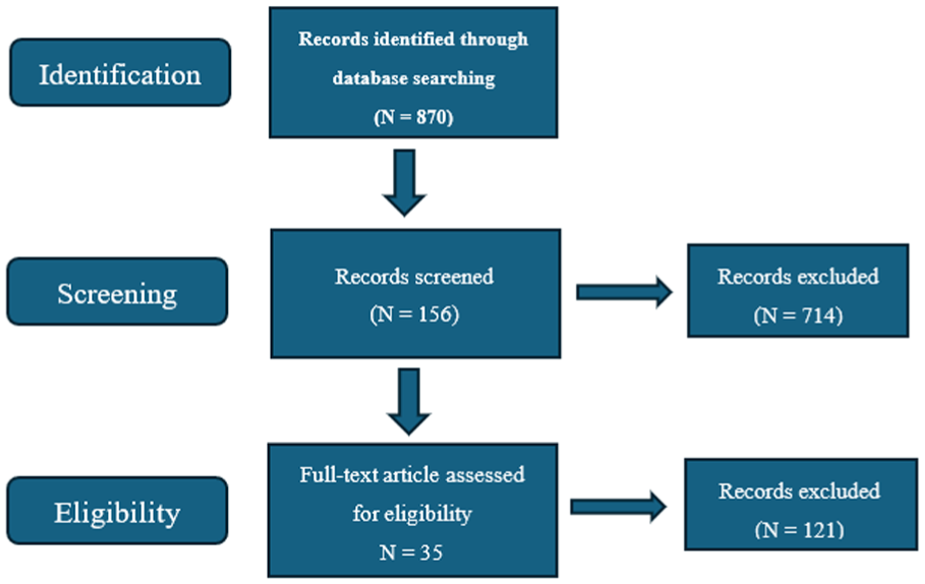
Flowchart of the literature search.
Thirteen items were searched, including “electronic commerce and model,”“e-commerce and model,”“e-business and model,”“electronic business and model,”“electronic commerce adoption model,”“digital business model,”“e-commerce adoption model,”“e-commerce success model,”“e-business success model,”“electronic commerce success model,”“electronic business adoption model,”“electronic business success model,” and “e-business adoption model.” A total of 870 records were initially identified through database searching.
During the first screening stage, 714 records were excluded after title and abstract review because they did not meet the predefined inclusion criteria. The primary reasons for exclusion at this stage included (i) lack of focus on e-commerce, e-business, or digital business success outcomes; (ii) absence of organizational- or business-level success constructs; (iii) non-article publication types (e.g. editorials, commentaries); and (iv) publications outside Q1-ranked journals. The remaining 156 records were subjected to full-text assessment. Of these, 121 articles were excluded because they did not provide extractable or explicit success constructs or measurement logic relevant to this study’s research purpose. This screening process resulted in a final sample of 35 eligible studies (see Table 1).
Core Dataset of Reviewed Studies (N = 35; 2018–Mid-2025).
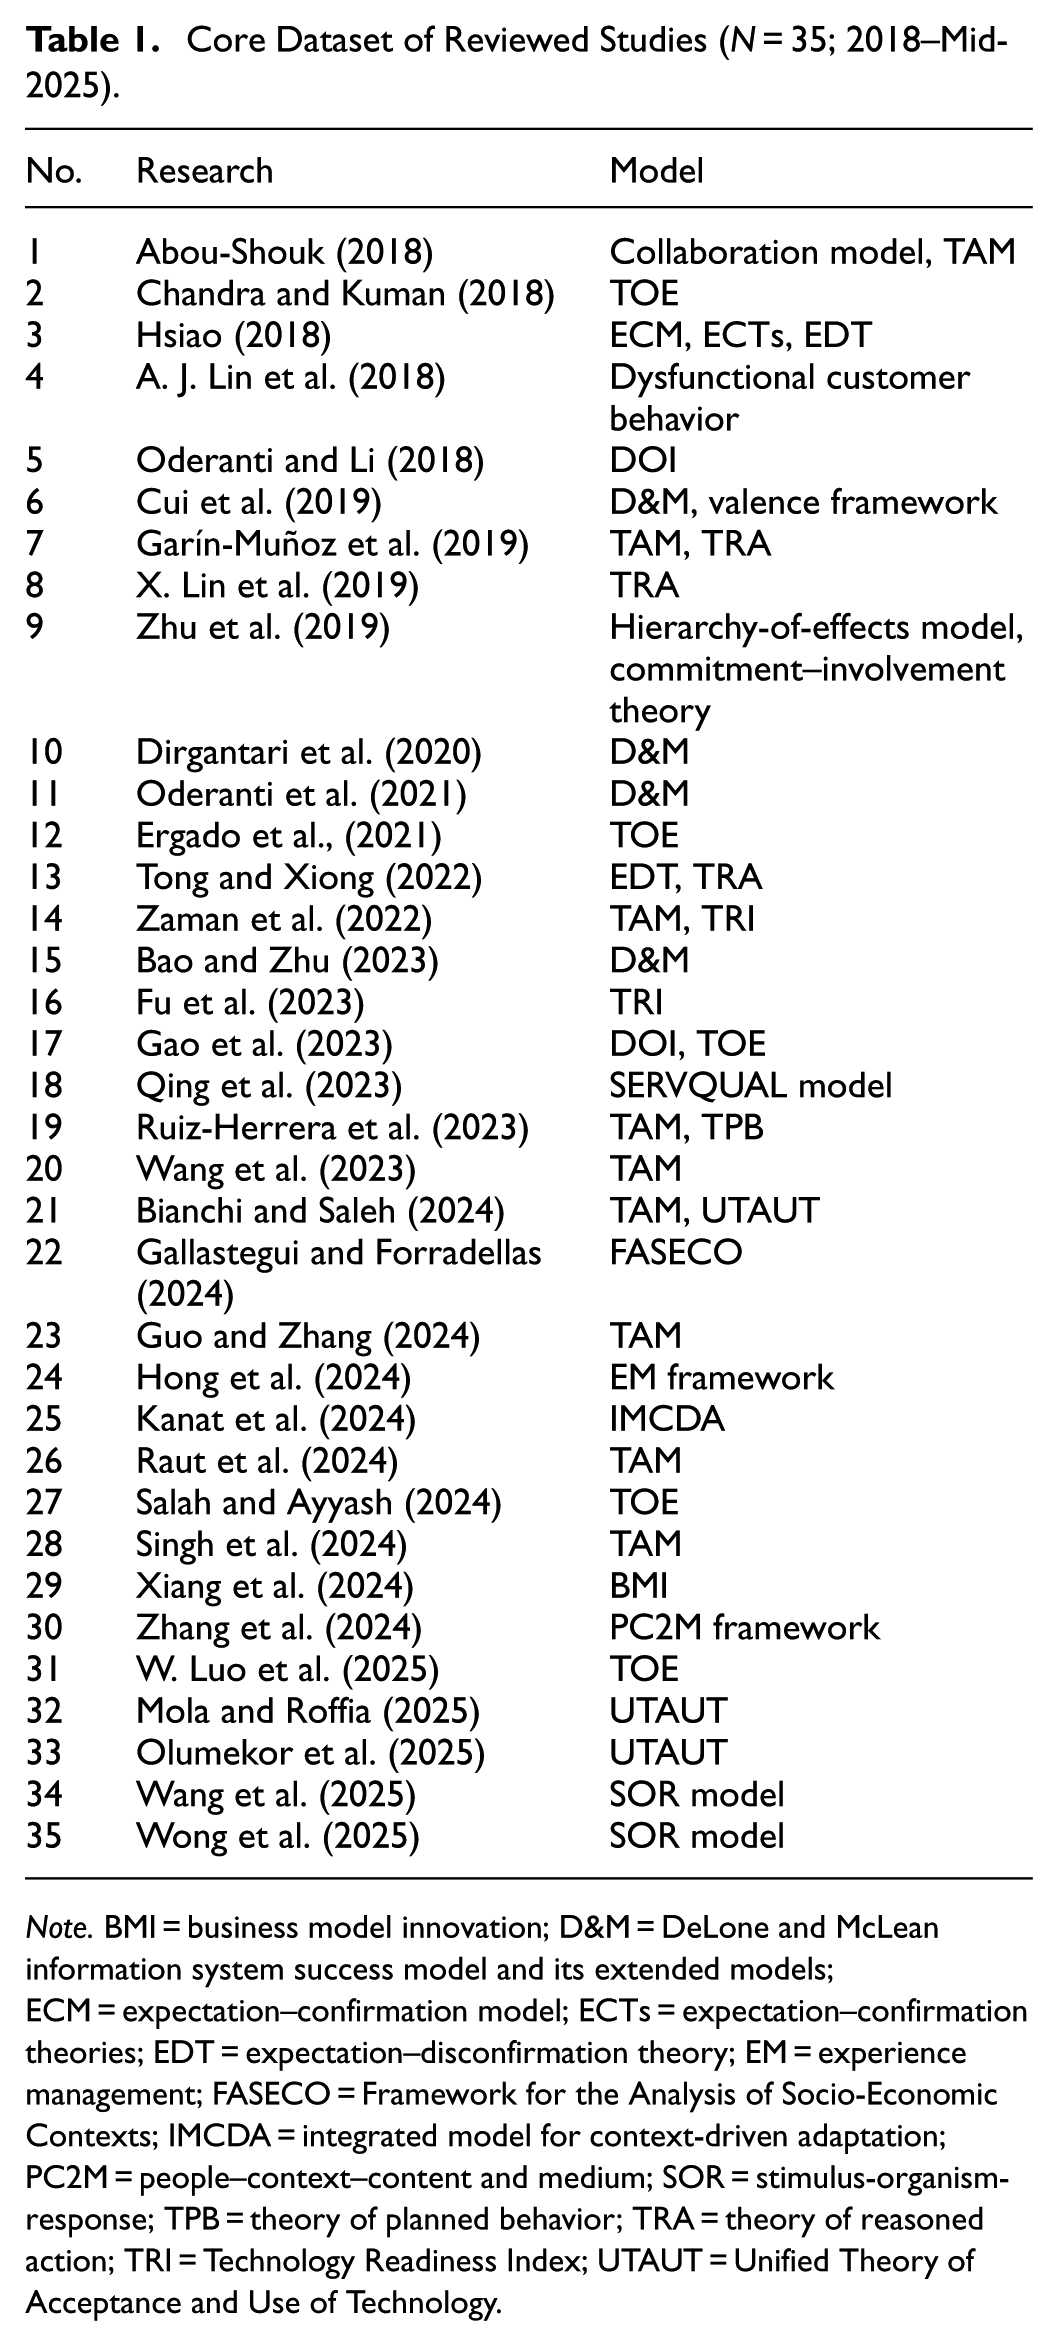
Note. BMI = business model innovation; D&M = DeLone and McLean information system success model and its extended models; ECM = expectation–confirmation model; ECTs = expectation–confirmation theories; EDT = expectation–disconfirmation theory; EM = experience management; FASECO = Framework for the Analysis of Socio-Economic Contexts; IMCDA = integrated model for context-driven adaptation; PC2M = people–context–content and medium; SOR = stimulus-organism-response; TPB = theory of planned behavior; TRA = theory of reasoned action; TRI = Technology Readiness Index; UTAUT = Unified Theory of Acceptance and Use of Technology.
Analysis
The above investigation finds that 35 eligible studies have been searched and cover 23 models (see Table 2). This analysis identifies and categorizes the theoretical models most frequently used to conceptualize e-commerce success and assesses the degree of theoretical concentration versus fragmentation within the literature. By mapping model usage across studies, the analysis provides a foundation for understanding dominant theoretical lenses and identifying gaps that motivate the development of a more integrative success framework. They include TAM, D&M, TOE, TRA, DOI, EDT, TRI, collaboration model, commitment–involvement theory, dysfunctional customer behavior, ECM, ECTs, hierarchy-of-effects model, FASECO, EM framework, IMCDA, BMI, PC2M framework, SERVQUAL, SOR model, TPB, UTAUT, and valence framework.
Frequency of Theoretical Models Across the Reviewed Studies (N = 35).

Note. The unit of analysis in this table is model occurrence, not the number of studies. Individual studies may employ multiple theoretical models, and the same model may be used across multiple studies. As a result, the total number of model occurrences (46) exceeds the number of reviewed studies (35).
Table 2 demonstrates seven models – TAM, TOE, ECM, ECTs, EDT, dysfunctional customer behavior, and DOI – discussed by five published studies in 2018. Four models – Commitment–involvement theory, D&M, TAM, and TRA – were covered by four published studies in 2019. The D&M model is the only model reported in 2020. Two models – D&M and TOE – were adopted by two studies in 2021. Four models – EDT, TAM, TRA, and TRI – were identified in 2022. Seven models – D&M, DOI, SERVQUAL, TAM, TOE, TPB, and TRI – were involved in six studies published in 2023. Seven models – BMI, EM framework, FASECO, IMCDA, PC2M framework, TAM, and UTAUT – were explored by eight studies in 2024. Three models – TOE, UTAUT, and SOR – were applied by five studies in 2025.
Table 2 reports the frequency with which specific models are used across the 35 studies – rather than the number of studies themselves (N = 35), which shows that 23 models have been discussed up to 46 times, including TAM (9), TOE (5), D&M (4), TRA (3), UTAUT (3), DOI (2), EDT (2), SOR model (2), TRI (2), BMI (1), collaboration model (1), commitment–involvement theory (1), dysfunctional customer behavior (1), ECM (1), ECTs (1), EM FRAMEWORK (1), FASECO (1), hierarchy-of-effects model (1), IMCDA (1), PC2M (1), SERVQUAL model (1), SOR model (2), TPB (1), and valence framework (1).
Table 2 analysis does not assume a one-to-one correspondence between studies and theoretical models. Individual studies frequently draw on multiple theoretical models, while the same model may appear across multiple studies. Consistent with the qualitative and theory-driven nature of the analysis, this study focuses on the identification, classification, and comparison of conceptual models used to theorize e-commerce success rather than for hypothesis testing or statistical inference. The final sample consists of 35 studies, which may thus be appropriate for identifying, classifying, and comparing conceptual models used to theorize e-commerce success, providing sufficient conceptual diversity and theoretical coverage to support the objectives of this analysis.
Comparative Analysis
A comparative analysis is conducted to better understand research models in e-commerce success studies.
Comparative Analysis
The above resulting model classifications are subsequently used in comparative analysis with established benchmark frameworks proposed by Ain et al. (2019) and Khoo et al. (2016). Comparative analysis employs two complementary analytical tools: a Sankey diagram (see Supplemental Appendix 2) and a consolidated comparative list of theoretical models (see Supplemental Appendix 3).
A Sankey diagram is used to visualize the evolution, persistence, and fragmentation models across different periods of e-commerce success research, rather than to aggregate independent empirical datasets. Supplemental Appendix 3 presents a comparative analysis of the research outcomes of Ain et al. (2019), Khoo et al. (2016), and this study (see Table 2). Collectively, a consolidated list is provided for identifying 56 theoretical models across the three sources (see Supplemental Appendix 3), including (i) the 55 model occurrences in the benchmark framework proposed by Khoo et al. (2016; 2011–2016), (ii) the 80 model occurrences in the benchmark framework proposed by Ain et al. (2019; 2010–2019), and (iii) the 46 model occurrences in this study (2018–2025).
It also provides a comprehensive overview of the theoretical landscape underpinning research on e-commerce success over time. The final systematic review comprises 35 eligible studies, which represent the unit of analysis at the article level. In these studies, theoretical models are often used multiple times, yielding 46 model occurrences that reflect the frequency with which specific models are employed across studies rather than the number of studies. In the subsequent comparative analysis, these findings are combined with two benchmark framework studies (Ain et al., 2019; Khoo et al., 2016) to examine the broader theoretical landscape of e-commerce success research. When model references from all three sources are consolidated, the result is 181 model mentions, reflecting the cumulative use of theoretical models across different time periods and sources. These figures, therefore, represent different analytical levels and are not intended to be directly comparable.
Among all models, TAM is the most used model (16.57%, 30 out of 181) in a total of three sources – including 6 (10.91% of 55) by Khoo et al. (2016), 15 (18.75% of 80) by Ain et al. (2019), and 9 (19.57% of 46) by this research. TOE is the next most used model (16.02%, 29 out of 181) by 21 (38.18% of 55), 3 (3.75% of 80), and 5 (10.87% of 46). D&M is another model, that is, most used (11.05%, 20 out of 181) in two sources, including 16 (20% of 80) by Ain et al. (2019) and 4 (8.70% of 46) by this research. DOI appears at high frequency (9.39%, 17 out of 181) in three studies, including 5 (9.09% of 55), 10 (12.50% of 80), and 2 (4.35% of 46). TPB appears in 7 (3.87% of 181) studies, including 4 (7.27% of 55), 2 (2.50% of 80), and 1 (2.17% of 46). UTAUT also appeared in 7 (3.87% of 181) studies, including 1 (1.82% of 55), 3 (3.75% of 80), and 3 (6.52% of 46). TRA has been reported by 5 (2.76% of 181) studies, including 1 (1.82% of 55), 1 (1.25% of 80), and 3 (7.32% of 46). The Resource-based View is represented in two studies by 5 (2.76% of 181) studies, including 1 (1.82% of 55) by Khoo et al. (2016) and 4 (5.00% of 80) by Ain et al. (2019).
Among all models, TAM is the most used model (16.57%, 30 out of 181) across the three sources – including 6 (10.91% of 55) by Khoo et al. (2016), 15 (18.75% of 80) by Ain et al. (2019), and 9 (19.57% of 46) by this research.bTOE is the next most used model (16.02%, 29 out of 181) by 21 (38.18% of 55), 3 (3.75% of 80), and 5 (10.87% of 46). D&M is another model most used in studies (11.05%, 20 out of 181), with two sources: 16 (20% of 80) by Ain et al. (2019) and 4 (8.70% of 46) by this research. DOI appears at high frequency (9.39%, 17 out of 181) in three studies, including 5 (9.09% of 55), 10 (12.50% of 80), and 2 (4.35% of 46).TPB appears in 7 (3.87% of 181) studies, including 4 (7.27% of 55), 2 (2.50% of 80), and 1 (2.17% of 46).UTAUT also appeared in 7 (3.87% of 181) studies, including 1 (1.82% of 55), 3 (3.75% of 80), and 3 (6.52% of 46). TRA has been reported by 5 (2.76% of 181) studies, including 1 (1.82% of 55), 1 (1.25% of 80), and 3 (7.32% of 46). The Resource-based View is represented in five occurrences (2.76% of 181), including 1 (1.82% of 55) by Khoo et al. (2016) and 4 (5.00% of 80) by Ain et al. (2019). ECM appeared in 3 (1.66% of 181) studies, including 2 (2.50% of 80) in Ain et al. (2019) and 1 (2.17% of 46) in this study. Three studies reported motivational theory and SMECA, accounting for 1.66% (three out of 181) of the total. These studies were reported separately by Ain et al. (2019) at 3.75% (three out of 80) and by Khoo et al. (2016) at 5.45% (three out of 55). BDB, G&S framework, information processing theory, and theory of effective use were used by 2 (1.10% of 181) studies and only reported by 2.50% (two out of 80) in Ain et al. (2019). The EDT, SOR model, and TRI were also used by two studies (1.10% of 181). They were reported in 4.35% (two out of 46) of the cases in this study.
ECM appeared in 3 (1.66% of 181) studies, including 2 (2.50% of 80) in Ain et al. (2019) and 1 (2.17% of 46) in this study. Three studies reported motivational theory and SMECA, accounting for 1.66% (three out of 181) of the total. These studies were reported separately by Ain et al. (2019) at 3.75% (three out of 80) and by Khoo et al. (2016) at 5.45% (three out of 55). BDB, G&S framework, information processing theory, and theory of effective use were used by 2 (1.10% of 181) studies and only reported by 2.50% (two out of 80) in Ain et al. (2019). The EDT, SOR model, and TRI were also used by 2 (1.10% of 181) studies. They were reported in 4.35% (two out of 46) of the cases in this study.
Business environment framework, combination of various models, EBS management model, European Union e-commerce Impediments Framework (EUIF), Inter-organizational Systems Adoption Process Model (ISAPM), Network-Based Classification Techniques (NBCT), National Institutional Perspective (NIP) theory, Organization Information Processing theory (OIPT), Perceived eReadiness Model (PERM), Stages of Growth (SOG) model, stakeholder theory, structuration theory, and the treatment effects model are used in one (0.55% of 181) study and are only reported by Khoo et al. (2016) study with 1.82% (one out of 55).
Technology Adoption Model, Burton-Jones and Straub Dimensions, Clark’s Model, Expectancy Theory, Institutional Theory, Integrative Model of IT Value, Limayem et al.’s IS Continuance Model, Nomological Net Model, Porter’s Value-Chain Activities Framework, Social Exchange Theory, Strategic Orientation of Business Enterprise (STROBE) Framework, Technology to Performance Chain (TPC), and the Wixom & Watson Framework are used in one (0.55% of 181). They were used in only one study for each (1.25%, one out of 80) by Ain et al. (2019).
One study utilized BMI, collaboration model, commitment–involvement theory, dysfunctional customer behavior, ECM, EM framework, FASECO, hierarchy-of-effects model, IMCDA, PC2M, SERVQUAL, and valence framework (0.55% of 181). These models each appear only once among the 46 identified model occurrences (2.17%), suggesting they represent peripheral or context-specific theoretical approaches rather than dominant frameworks in the e-commerce success literature.
Overall, comparative analysis reveals a pattern of theoretical concentration alongside substantial fragmentation. While a small number of models account for a large share of model occurrences, many models appear only once (e.g. one out of 46), suggesting exploratory or context-dependent theorization. This pattern highlights the absence of a unifying success framework and motivates the need for a higher-level, integrative perspective on e-commerce success.
Findings
Based on the above discussion, the identified models can be categorized into four categories: most-used, often-used, rarely-used, and single-used models, including:
Most-Used Models
Four models were identified as the most effective for measuring the degree of e-commerce success. They include TAM (16.57%, 30 out of 181), TOE (16.02%, 29 out of 181), D&M (11.05%, 20 out of 181), and DOI (9.39%, 17 out of 181).
This result shows that TAM emerges as the most frequently adopted theoretical framework in e-commerce research. This dominance can be attributed primarily to the model centers on perceived usefulness (PU) and perceived ease of use (PEOU; Garín-Muñoz et al., 2019, p. 106). Much of the e-commerce literature focuses on system adoption, usage, and user behaviour in consumer-facing contexts. Thus, TAM’s simplicity, adaptability, and compatibility make it especially attractive for analyzing technology-mediated interactions.
Often-Used Models
The four models were used in more than five studies. The evaluations included TPB (3.87%, seven out of 181), UTAUT (3.87%, seven out of 181), TRA (2.76%, five out of 181), and Resource-based View (2.76%, five out of 181).
Rarely-Used Models
Ten models are rarely discussed by at least two studies, including ECM (1.66%, three out of 181), Motivational Theory (1.66%, three out of 181), SMECA (1.66%, three out of 181), Bagozzi, Dholakia, and Basuroy (BDB; 1.10%, two out of 181), EDT (1.10%, two out of 181), Gorry and Scott Morton Framework of Management IS (G&S Framework; 1.10%, two out of 181), Information Processing Theory (1.10%, two out of 181), SOR Model (1.10%, two out of 181), Theory of Effective Use (1.10%, two out of 181), and TRI (1.10%, two out of 181).
Single-Use Models
Thirty-eight models are only reported by one study with 0.55% (one out of 181), including BMI, Collaboration Model, Commitment–Involvement Theory, Dysfunctional Customer Behavior, ECM, EM Framework, FASECO, IMCDA, PC2M Framework, SERVQUAL Model, Valence Framework, Burton-Jones and Straub Dimensions, Clark’s Model, Expectancy Theory, Institutional Theory, Integrative Model of IT Value, Limayem et al.’s IS Continuance Model, Nomological Net Model, Porter’s Value-Chain Activities Framework, Social Exchange Theory, STROBE Framework, TPC Model, Wixom & Watson Framework, Business Environment Framework, Combination of Various Models, EBS Management Model, EUIF, ISAPM, NBCT, NIP Theory, OIPT, PERM, SOG Model, Stakeholder Theory, Structuration Theory, and Treatment Effects Model.
Overall, e-commerce success research spans diverse contexts, including online retailing, mobile commerce, social commerce, platform-based marketplaces, and AI-enabled digital services. The findings indicate that theoretical model selection varies systematically across various contexts. However, this results in theoretical diversification and underscores the need for a more integrative, system-level approach, combined with organizational-level measurement, to conceptualize e-commerce success. A few studies have attempted to transform qualitative data into quantitative forms for comparative analysis.
Case Study
Although up to 56 models have been applied in e-commerce studies, the current literature highlights that a few studies have attempted to transform qualitative data into quantitative forms for comparative analysis. In this section, a case study is used to develop a transformative approach that demonstrates how a qualitative model can be converted into a quantitative one.
EBS Management Model as a Case
The EBS management model is selected as the case study model. The primary reason is that, although 56 models have been applied to e-commerce success research, most focus on customer satisfaction measures. The EBS management model is one of the few models that explicitly focus on business satisfaction measures and therefore offers a more effective perspective for evaluating e-commerce success from a business standpoint. In this context, e-commerce business satisfaction is defined as the extent to which businesses are satisfied with using e-commerce systems to meet their organizational requirements and expectations (Gide & Wu, 2005, p. 4, 2007, p. 312). It reflects how confident businesses are in their e-commerce systems regarding future performance, alignment with digital strategy, readiness for change, and perceived long-term value creation (Gide & Wu, 2007, p. 313). In contrast, customer satisfaction focuses on customers’ evaluations of products or services and is typically backward-looking, experience-based, and retrospective (SteinerMarketing, 2003).
Another reason for selecting the EBS management model is that it has been recognized as a comparative framework for assisting business managers in achieving e-commerce success across different geographical contexts (Khoo et al., 2016, p. 3). A further reason is that the original data used to establish the EBS management model are available through public data repositories (Figshare, 2023), which enhances transparency and facilitates cross-country comparative studies.
The EBS management model comprises five components with 15 items (M. X. Wu et al., 2014):
The components of Knowledge & Skills include the following: ○ Item 1: CEO’s IT/e-commerce/e-commerce marketing knowledge. ○ Item 2: Senior staff IT/e-commerce knowledge and ○ Item 3: Regular staff training with appropriate or relevant IT skills.
The components of Managing Change include the following: ○ Item 4: The flexibility of e-commerce systems to change depending on the business process, and ○ Item 5: The ability to keep up with the rate of technology change (externally).
The components of Website Effectiveness & Cost include: ○ Item 6: The response time effectiveness/performance of an e-commerce site. ○ Item 7: Trust in the interface design and information displayed on a website. ○ Item 11: Cost associated with keeping up-to-date e-commerce systems, and ○ Item 15: Consistency of website graphics, backgrounds, and business culture.
The components of Management Support & Customer Acceptance include: ○ Item 8: Top management/decision-makers support. ○ Item 9: Support from senior management, and ○ Item 10: Customer pressure/acceptance/interests.
The components of Marketing include the following: ○ Item 12: Effective decision-makers’ e-commerce marketing plan. ○ Item 13: Effective e-commerce marketing strategy, and ○ Item 14: Adopting different e-commerce marketing strategies based on business requirements/needs.
Weighting of Each Component Item
Several objective weighting methods have been used widely, including Criteria Significance Through Intercriteria Correlation (CRITIC), Entropy, Principal Component Analysis (PCA), and Technique for Order Preference by Similarity to Ideal Solution (TOPSIS; R. M. X. Wu et al., 2022, p. 7). However, no single method could be better for weighting the criteria (R. M. X. Wu et al., 2022, p. 21). Different objective methods might lead to completely different values in the estimates of the weights of the criteria (Mukhametzyanov, 2021, p. 30), which might lead to inconsistent results and other results to solve the same case (Mukhametzyanov, 2021, p. 30; Peng & Garg, 2021, p. 3; Watrobski et al., 2019, p. 108). Among above, PCA is a dimension reduction technique that could be handy for identifying the critical variables or factors and might effectively be well-applied for developing predicting systems (R. M. X. Wu et al., 2022, p. 21). Moreover, the case study in this research is designed primarily as a methodological demonstration rather than an empirical validation exercise. Specifically, the PCA-based transformation of the E-commerce Business Satisfaction (EBS) management model is used to illustrate how qualitatively defined success dimensions can be systematically operationalized into a quantitative measurement structure. While this approach provides transparency in weighting and construct operationalization, the resulting quantitative model has not been empirically assessed for reliability, construct validity, or predictive performance. The PCA method was thus adopted in this research to weigh items in the EBS management model.
Due to the SPSS analysis software package not directly calculating the PCA weight of each CSF, this research uses an SPSS analysis software package and an Excel sheet to compute the weighting results (see Supplemental Appendix 4).
For individual critical success factors (CSFs), a combination of SPSS and Excel was used to derive the weighting results (see Supplemental Appendix 4). Higher weight values indicate greater relative importance of the corresponding CSFs. Based on the results presented in Supplemental Appendix 5, the 15 weighted CSFs are grouped into three levels of importance (see Table 3) as follows:
Level 1 CSFs (top-most important CSFs) – 3Ss (speed, spending, and skills) – are identified, including CSF 1 (Item 6, 10.6%), CSF 2 (Item 11, 10.5%), and CSF 3 (Item 3, 10.4%). ○ Speed (CSF 1): the response time/effectiveness/performance of an e-commerce website.
Set of Weighted CSFs.
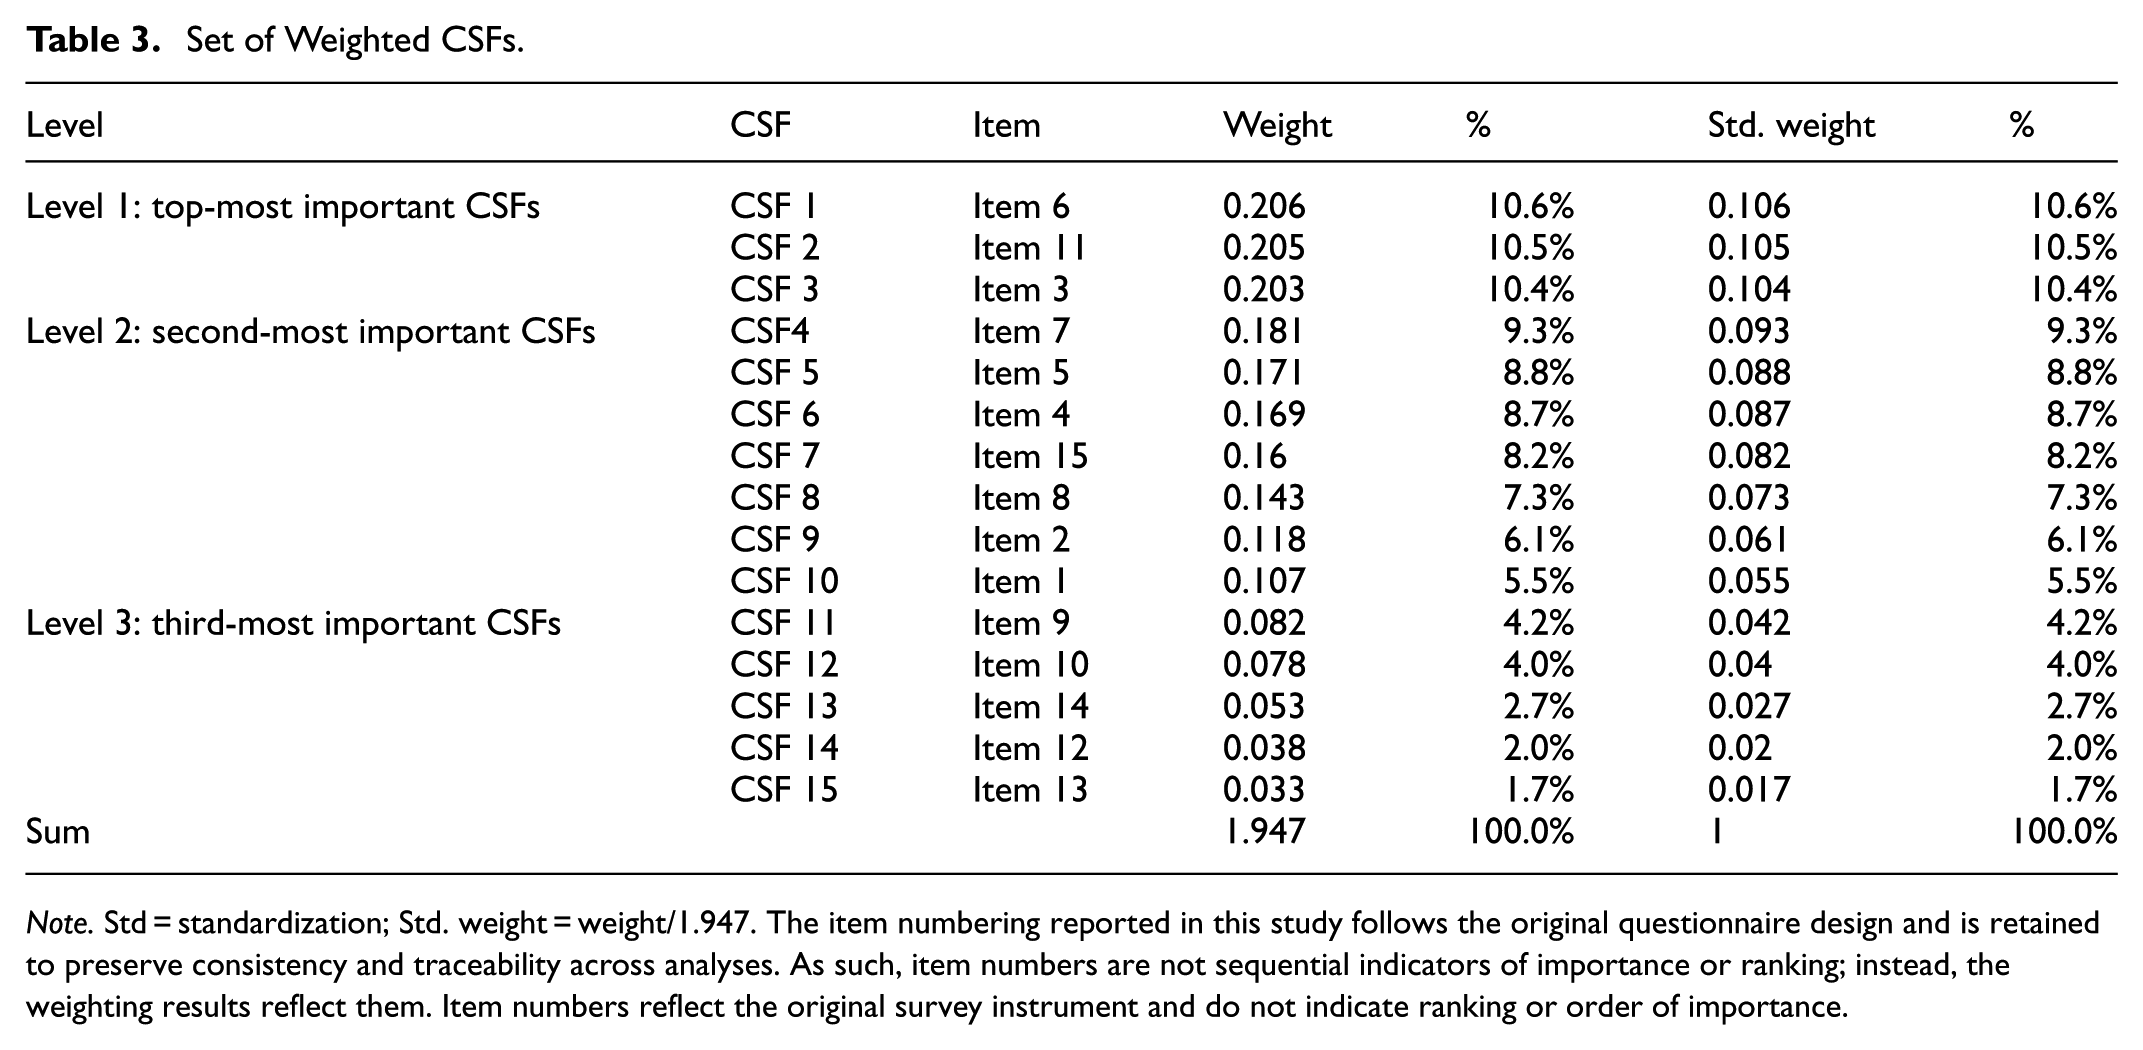
Note. Std = standardization; Std. weight = weight/1.947. The item numbering reported in this study follows the original questionnaire design and is retained to preserve consistency and traceability across analyses. As such, item numbers are not sequential indicators of importance or ranking; instead, the weighting results reflect them. Item numbers reflect the original survey instrument and do not indicate ranking or order of importance.
Speed (CSF1) refers to the response time, effectiveness, and performance of an e-commerce website. Item 6, which measures the response time and operational performance of an e-commerce website, receives the highest weighting (10.6%), indicating that system responsiveness is perceived as the most critical success factor. This finding underscores the importance of fast and reliable system performance in shaping both user experience and business outcomes in e-commerce environments.
To contextualize this finding, established thresholds of users’ tolerable website response time were synthesized from prior human–computer interaction and information systems research (Card et al., 1991, pp.181–188; Miller, 1968, pp.267–277 cited in Galletta et al., 2004, p. 20; Nielsen, 1994; Poggi et al., 2014, p. 881). Supplemental Appendix 6 summarizes response-time tolerance thresholds derived from established human–computer interaction and information systems literature. No primary data collection or human-participant experimentation was conducted in this study; the thresholds reported are based on secondary synthesis of prior empirical findings. These These thresholds are derived from prior empirical studies rather than primary data collected in the present research as follows:
0.1 s (Instantaneous threshold). It is about the limit for the user to feel that the system reacts instantaneously, meaning that no feedback is necessary beyond displaying the result.
1 s (Uninterrupted threshold). It is about the limit of the user’s uninterrupted flow of thought, even though the user would notice the delay. Usually, no feedback is necessary during delays of more than 0.1 s but <1 s, but the user does lose the feeling of operating directly on the data.
2 s (Dropping threshold). There is a massive drop in the average number of clicks per session after 2 s.
3 s (Tolerating threshold). The tolerance response time threshold is 3 s.
5 s (Delayed threshold). The user should note the system delay; however, the system is currently in operation.
8 s (Webpage threshold). Little research has been conducted on the so-called eight-s rule, where no web page should take longer than 8 s to respond, and
10 s (Frustration threshold). The threshold for most users’ attention is the limit of their ability to maintain focus on the dialogue. For longer delays, users would want to perform other tasks while waiting for the computer to finish; thus, they should receive feedback indicating when the computer is expected to finish. Feedback during delays is vital when response times are variable, as users will not know what to expect. Ten seconds will be the upper limit for user satisfaction.
The recommendation is to develop an effective website with a response time of <1 s but never more than 2 s. Although measuring response time in hypertext transfer protocol (HTTP) requests to assess web browsing quality (Lopez et al., 2021, p. 1), it is unknown which critical factors within the website itself might determine whether response times are satisfactory for business. Future research may investigate how system architecture, content complexity, and platform design jointly influence acceptable response-time thresholds in e-commerce environments.
○ Spending (CSF 2): the cost of updating or upgrading an e-commerce system.
Spending (CSF 2) refers to the costs associated with maintaining, updating, and upgrading an e-commerce system. Item 11, which captures the cost of supporting and upgrading the e-commerce system, receives the second-highest weighting (10.5%), indicating that ongoing financial investment is a critical determinant of e-commerce success.
This finding aligns with prior research suggesting that digital technologies can generate long-term cost efficiencies while simultaneously requiring sustained investment in system upgrades and maintenance (Soluk et al., 2021, p. 869). Accordingly, organizations must align their financial strategies to ensure that e-commerce systems can be continuously updated and supported, enabling both cost optimization and sustained performance in digitally evolving environments. It is valuable to be further investigated.
○ Skills (CSF3): regular staff training on appropriate or relevant IT skills.
Regular staff training in the proper or relevant IT skills is indicated as the third-highest weight in the CSF. This can be seen in Item 3 (regular staff training in the right or suitable IT skills; 0.104). Relevant skills and knowledge are core requirements for e-commerce talent to achieve e-commerce success (Cheng et al, 2019, p. 819; Garín-Muñoz et al., 2019, p. 109). The empirical literature confirms a positive relationship between ICT and workers’ skills (Bolli & Pusterla 2023, p. 1). Regular training may help staff better understand new and updated systems adopted for business processes. This result implies regularly maintaining appropriate e-commerce knowledge and skills for each staff level.
Level 2 (second-most important CSFs; std. weight ≥0.05 and <0.1). Level 2 (second-most important CSFs) consisted of seven items: CSF 4 (Item 7, 9.3%), CSF 5 (Item5, 8.8%), CSF 6 (Item 4, 8.7%), CSF 7 (Item 15, 8.2%), CSF 8 (Item 8, 7.3%), CSF 9 (Item 2, 6.1%), and CSF 10 (Item 1, 5.5%).
Level 3 (third-most important CSFs; std. weight >0 and <0.05). Level 3 (Third-most important CSFs) contains five CSFs: CSF11 (Item 9, 4.2%), CSF12 (Item 10, 4.0%), CSF13 (Item 14, 2.7%), CSF14 (Item 12, 2%), and CSF15 (Item 13, 1.7%).
Establishing a Quantitative Model
Each component of the EBS management model can be weighed (see Table 4) as follows:
Website Effectiveness & Cost are the primary concerns (38.6%), composed of four weighted CSFs: CSF 1 (10.6%), CSF 2 (10.5%), CSF 4 (9.3%), and CSF 7 (8.2%).
Knowledge and Skills (22%) consist of three weighted CSFs: CSF 3 (10.4%), CSF 9 (6.1%), and CSF 10 (5.5%).
Managing Change (17.5%) contains CSF 5 (8.8%) and CSF 6 (8.7%).
Management Support & Customer Acceptance (15.5%) covers three weighted CSFs: CSF 8 (7.3%), CSF 11 (4.2%), and CSF 12 (4.0%), and
Marketing (6.4%) includes CSF 13 (2.7%), CSF 14 (2%), and CSF 15 (1.7%).
Weighting Components of Each CSF.
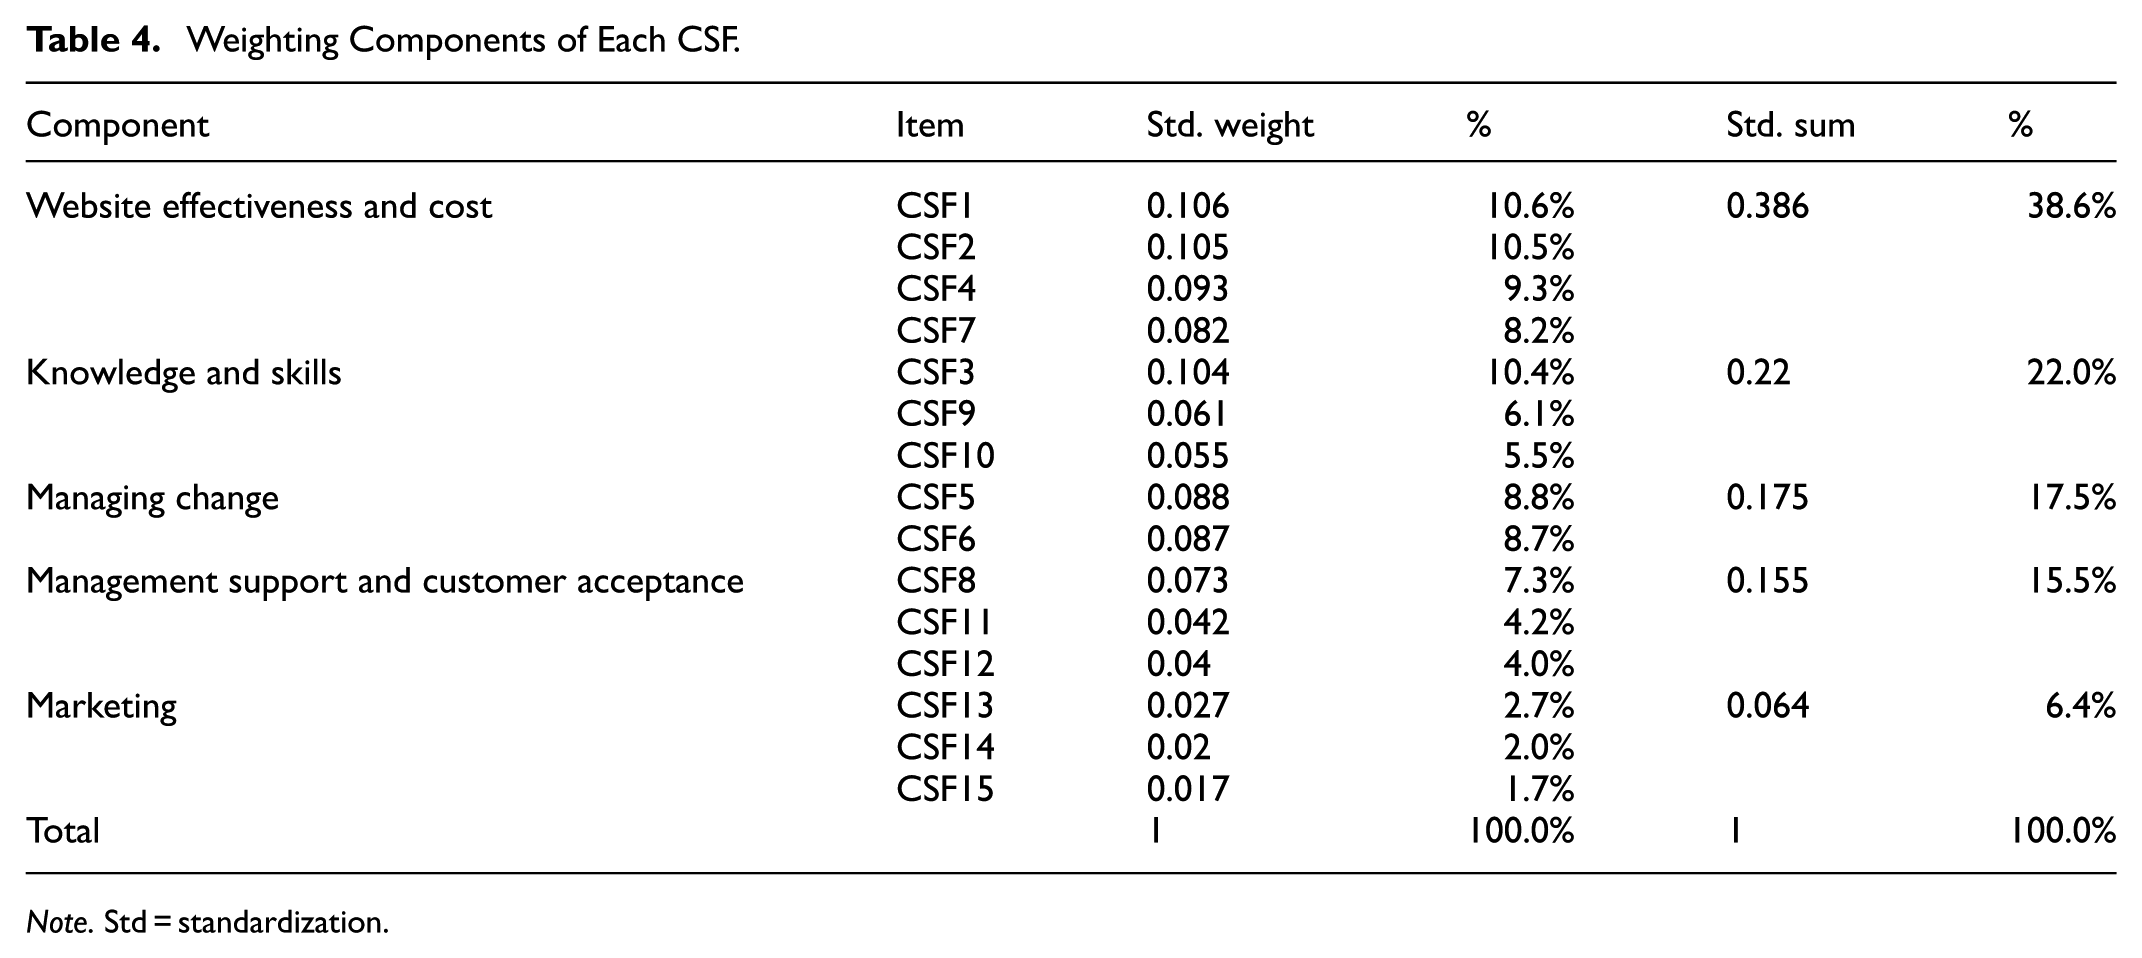
Note. Std = standardization.
As a result, an initial quantitative operationalization of the e-commerce success model – the EBS measurement model – is developed to translate qualitative success dimensions into measurable constructs, comprising five weighted components and 15 CSFs (see Supplemental Appendix 7). This model can help business managers understand the degree to which businesses adopt e-commerce systems, measure e-commerce success, and realize improvements at the business level. The EBS equation is also provided to compute the EBS value (Y; see equation 1). A higher value (Y) indicates a higher measurement of business satisfaction regarding e-commerce success.

Where is the importance of weighting of CSFi from {0.106, 0.105, 0.093, 0.082, 0.104, 0.061, 0.055, 0.088, 0.087, 0.073, 0.042, 0.04, 0.027, 0.02, 0.017}, and
In summary, the EBS measurement model is designed as a measurement and operationalization framework rather than as a tool for testing causal relationships or statistically validating hypotheses. Its primary purpose is to translate qualitatively identified e-commerce success dimensions into a structured and quantifiable form. Following established practices in information systems research, qualitative constructs are decomposed into CSFs and operationalized using weighted indicators, enabling a systematic and comparative assessment of e-commerce success across organizational contexts. Accordingly, the EBS management model should be interpreted as a business-level assessment instrument rather than an explanatory or predictive model. The EBS equation provides a structured approach to computing business satisfaction, with higher values indicating stronger perceived e-commerce success. By shifting analytical attention from individual adoption and usage toward organizational outcomes and value realization, the model offers a foundation for measuring e-commerce success in mature, digitally transformed environments and for informing future hypothesis-driven validation studies.
Examples of Implementing the EBS Management Model
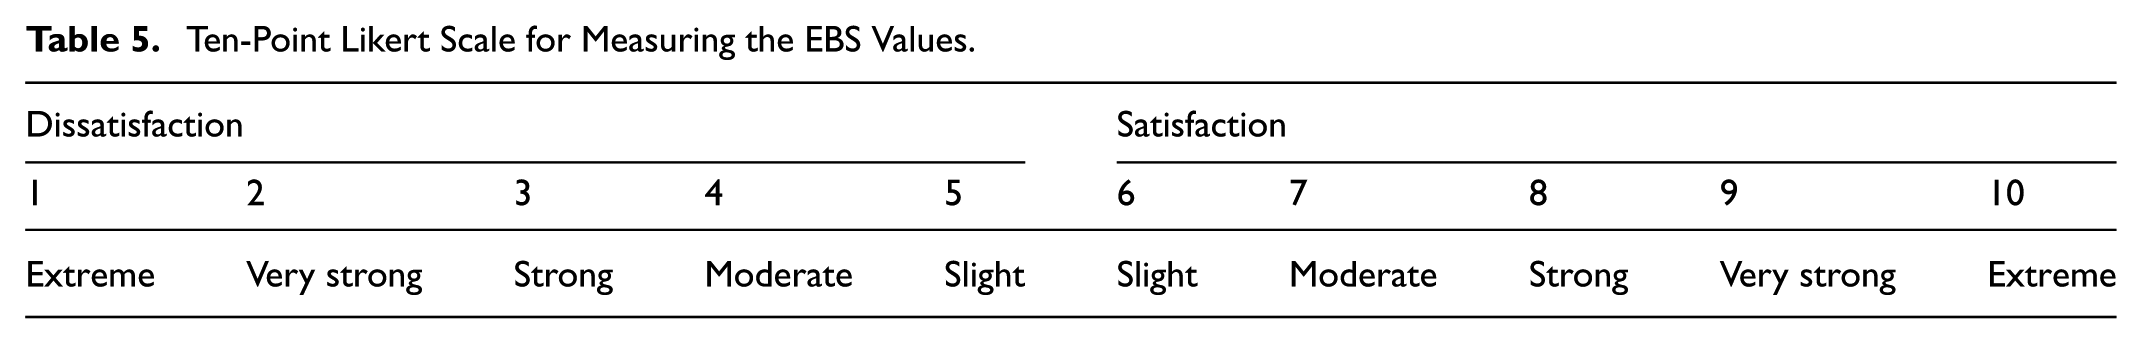
The examples are provided as a guide for the practical implementing the EBS measurement model. A 10-point Likert Scale is used to measure satisfaction in the case studies (see Table 5).
Ten-Point Likert Scale for Measuring the EBS Values.
Based on sample cases, the EBS value for each business involved in the case studies was calculated and summarized in Table 6. The Data can be seen in Supplemental Appendix 8. The cases and data have been authorized for use and provided by the chief investigator (See R. M. X. Wu 2009).
EBS Values for Each Case.

The value of EBS for each business was calculated according to Equation 1).
These results show that:
No Chinese cases showed satisfaction with their e-commerce system – each EBS value was below 6.
All Australian cases have higher EBS values (8.229, 7.747, and 5.846) than Chinese cases (5.747, 5.291, and 3.953); this implies that Australian businesses are more experienced in adopting e-commerce systems than Chinese ones.
Australian case 3 had the highest EBS value (8.229), indicating strong satisfaction with its e-commerce system (which should have been the case, as this business is an ICT service provider and has developed its own system).
Australian case 2 had the second-highest EBS value (7.747) and a moderate satisfaction with the e-commerce system.
Three cases (Australian case 3, Chinese case 1, and Chinese case 3) had slight dissatisfaction with their e-commerce systems (EBS values of 5.846, 5.747, and 5.291, respectively); and
one case (Chinese case 2) was measured with the lowest EBS value (3.953), showing strong dissatisfaction with its e-commerce system.
Table 6 also shows that:
CC1 and AC1 had closed EBS values (5.747 and 5.846, respectively). It implies that both Chinese and Australian businesses had slight dissatisfaction with the e-commerce system.
Both CC2 and AC2 are manufacturing and design businesses that sell their products. They obviously had different levels of satisfaction with the adoption of e-commerce systems. CC2 had a strong dissatisfaction with the e-commerce system (3.953) while AC2 had a moderate satisfaction with the system (7.747); this implies that Chinese wholesale /retail trading businesses in adopting the e-commerce system lag behind Australian ones, and
Both CC3 (5.846) and AC3 (8.229), both ICT service providers, show slight dissatisfaction and strong satisfaction, respectively, with the e-commerce system. These results imply that the Chinese ICT/communication business, in adopting e-commerce systems, also lagged behind Australian ones.
Thus, the EBS measurement model can be used as a tool to provide an overall measurement framework, using CSFs, for businesses to assess e-commerce success.
Conclusions and Further Research
Conclusions
This study examines the theoretical models used in e-commerce research and provides insights into future directions for measuring e-commerce success in the age of digital transformation. Adopting a structured, theory-oriented literature review methodology, the study integrates systematic literature screening, comparative model analysis, and a case study to support conceptual synthesis rather than statistical generalization. Following established literature, this study adopts 1993 as the starting point of the e-commerce era. It organizes e-commerce development into seven evolutionary phases, ranging from early initiation to the current generative AI-enabled stage: initiation (between 1993 and 1994), start-up (1995 and 1999), growth (2000 and 2004), customer data analytics (2005 and 2009), social media (2010 and 2012), emerging technology (2013 and 2021), and generative AI (2022 onward). This study systematically compares existing frameworks and demonstrates how a business-satisfaction-oriented perspective can be operationalized into a quantitative measurement framework. By shifting analytical attention from individual adoption and usage toward organizational outcomes and value realization, this study complements established models and responds directly to the evolving nature of e-commerce in the age of digital transformation. This historical framing also provides contextual grounding for understanding how research focus and the conceptualization of success have evolved alongside technological change.
This study identifies 35 eligible Q1-ranked studies published between 2018 and mid-2025, encompassing 23 distinct theoretical models. The resulting model classifications are then subsequently used in a comparative analysis with established benchmark frameworks. To support comparative synthesis, a Sankey diagram is employed to visualize model usage across this study and two benchmark frameworks, identifying 56 unique models in total. These models are categorized into four groups – most-used, often-used, rarely-used, and single-use – revealing a pattern of theoretical concentration at the core and fragmentation at the periphery. Adoption- and system-oriented models – particularly TAM, TOE, D&M, and DOI – emerge as foundational frameworks, reflecting the field’s historical emphasis on adoption and system use. The four models are often-used models – TPB, UTAUT, TRA, and Resource-based View. Ten models are rarely used – ECM, Motivational Theory, SMECA, BDB, EDT, G&S Framework, Information Processing Theory, SOR Model, Theory of Effective Use, and TRI. The other 38 models are single-use. Through a case study, this research demonstrates how qualitatively identified success dimensions can be translated into measurable constructs. Using a PCA-based weighting approach, three top-level Critical Success Factors – the 3Ss: Speed, Spending, and Skills– are identified, representing system performance, sustained financial investment, and organizational capability, respectively. This process illustrates a methodological transformation from qualitative conceptualizations to quantitative measurement, rather than a fully validated causal model.
As a result, the EBS measurement model is developed as an initial quantitative operationalization of e-commerce success and is intended as a business-level measurement and assessment framework, rather than as a tool for testing causal relationships or statistically validating hypotheses. Its purpose is to translate qualitatively identified e-commerce success dimensions into a structured, quantifiable form by decomposing constructs into CSFs and operationalising them through weighted indicators, following established practices in information systems research. The resulting EBS equation provides a systematic means of measuring business satisfaction with e-commerce outcomes, with higher values indicating greater perceived success. By shifting analytical attention from individual adoption and usage toward organizational outcomes and value realization, the model offers an exploratory basis for evaluating e-commerce success in mature, digitally transformed environments and for informing future hypothesis-driven validation studies. Practical examples illustrate how the model can be implemented in applied settings.
Recommendations
Based on the findings of this study, several evidence-informed recommendations can be derived. These recommendations are intended to provide guidance grounded in the identified CSFs, rather than prescribe best practices.
First, the prominence of Speed as a top-level CSF highlights the importance of website responsiveness and system performance. Rather than prescribing a specific technical threshold, the findings suggest that organizations should prioritize fast and reliable system response times as a key component of e-commerce success.
Second, the identification of Spending as a critical factor indicates that sustained financial investment is necessary to support the ongoing maintenance, updating, and upgrading of e-commerce systems. Organizations are therefore encouraged to align financial strategies with long-term system evolution, ensuring that cost considerations do not constrain system performance or scalability.
Third, the significance of Skills underscores the role of organizational capabilities in achieving e-commerce success. The findings suggest the need for continuous development of e-commerce-related knowledge and skills across different staff levels, particularly as digital technologies and business models evolve.
In addition, the results have implications for the higher education sector. Given the increasing complexity of digitally transformed e-commerce environments, the study highlights the value of integrating digital transformation-related content into undergraduate and postgraduate curricula, in order to better prepare graduates for contemporary e-commerce roles.
Theoretical and Practical Implications
From a theoretical perspective, the findings indicate that adoption- and system-oriented models – particularly TAM, TOE, D&M, and DOI – continue to dominate the e-commerce success literature. This pattern suggests that these models function as foundational theoretical lenses in the field. At the same time, their dominance highlights the need to extend existing frameworks beyond adoption and usage to business-level measurement of success, thereby supporting EBS’s positioning as a complementary, outcome-oriented lens rather than a replacement. In this context, although the EBS management model has been cited relatively infrequently, this reflects historical research priorities rather than conceptual inadequacy. EBS shifts analytical attention from individual acceptance to business-level measurement of e-commerce success, a perspective that has received comparatively less scholarly attention. This shift is particularly relevant in digitally transformed e-commerce environments, where organizational outcomes and system-level value creation extend beyond system adoption and usage. EBS is therefore positioned in this study as a complementary, outcome-oriented success lens, rather than a replacement for established adoption-based theories.
From a practical and methodological perspective, this study demonstrates how qualitatively identified success dimensions can be systematically operationalized into a quantitative measurement framework. Rather than claiming full empirical validation, the proposed EBS measurement model illustrates an approach for translating conceptual success factors into weighted indicators that support structured assessment and comparison of e-commerce success at the business level. This operationalization study provides a methodological foundation for future empirical research to test, refine, and validate e-commerce success measurement models across different organizational and technological contexts.
Limitations and Further Reserach Directions
This study adopts a structured, theory-oriented literature review and case study approach, rather than a hypothesis-testing or predictive research design. Several limitations should be acknowledged to clarify the scope of the study and to guide future research.
Limitations
The first limitation (L1) is that this study adopts the EBS management model as a representative success framework to illustrate the methods. The selection of EBS does not imply that it is the only, or even optimal, model for measuring e-commerce success, nor does the study claim theoretical superiority over alternative frameworks. Rather, EBS provides a clear business-level success structure suitable for demonstrating model operationalization and illustrates a methodological approach for transforming a qualitative success framework into a quantitative measurement structure. The choice of a single model and dataset allows for transparency and clarity in illustrating the transformation process, while recognizing that the applicability of this approach to other models and contexts requires further empirical investigation. As such, the proposed EBS measurement model should be interpreted as an exploratory and illustrative operationalization, rather than a fully validated measurement instrument.
The second limitation (L2) concerns the use of a single illustrative case. The EBS management model is employed as a sample framework to demonstrate how a qualitatively derived success model can be operationalized into a quantitative measurement structure. The case study is designed as a methodological demonstration rather than an empirical validation exercise. It does not claim that the EBS management model is the only or optimal model for this purpose, nor does it empirically validate the resulting measurement model. Using an existing dataset, the PCA-based transformation illustrates how a qualitatively defined e-commerce success framework can be operationalized into a quantitative measurement structure. The resulting EBS measurement model has not been empirically assessed for reliability, construct validity, or predictive performance, and the study does not support generalized conclusions about transforming all qualitative models into quantitative forms.
The third limitation (L3) relates to the use of previously published datasets in case-based operationalization. While these data are sufficient to illustrate the methodological transformation process, they do not capture the most recent developments in e-commerce practice, particularly those associated with generative AI-enabled systems.
The fourth limitation (L4) is that, although a growing number of self-developed, context-specific success models have emerged in recent e-commerce research, these models have not been examined in detail. The study prioritizes widely cited and benchmarked frameworks to support comparative synthesis, thereby necessarily limiting coverage of newer, less established models.
Overall, these limitations reflect intentional methodological choices consistent with theory-oriented review research, rather than deficiencies in empirical execution.
Further Research Directions
Building on the above limitations, several directions for future research are proposed.
First, future research is needed to extend this study by formulating testable hypotheses grounded in the EBS measurement model and validating them using large-scale empirical datasets across diverse e-commerce contexts. Comparing countries’ contexts will enrich the generalizability of success frameworks across countries (Khan et al., 2024, p. 15; addressing L1).
Second, future studies may explore whether widely used theoretical models, such as TAM, TOE, the D&M, and DOI, can be similarly operationalized into quantitative measurement frameworks for evaluating e-commerce success, extending the methodological approach demonstrated in this study (addressing L2).
Third, further research may empirically test whether the measurement operationalization approach illustrated here can be applied across different datasets, industries, and business contexts, enabling validation and refinement of business satisfaction-based success measures (addressing L3).
Fourth, future studies may examine the role of recently developed and domain-specific models in explaining e-commerce success, particularly in emerging application areas, to assess how these models complement or extend established theoretical foundations (addressing L4).
In addition, the emergence of generative AI in e-commerce applications since 2022 has introduced a fundamental shift in how e-commerce success is conceptualized and measured. By enabling adaptive, anticipatory, and often indirect forms of value creation that may be invisible to users, generative AI challenges adoption- and usage-centric success models. These developments reinforce the need to move beyond technology acceptance toward business-level value realization and satisfaction, positioning EBS as a potentially relevant outcome-oriented lens in AI-enabled e-commerce contexts. However, empirical validation of generative AI-driven success measurement models remains an important avenue for future research.
Supplemental Material
sj-docx-1-sgo-10.1177_21582440261448511 – Supplemental material for E-Commerce Research Trend: Transforming Qualitative Models into Quantitative Forms for Measuring E-Commerce Success in the Age of Digital Transformation
Supplemental material, sj-docx-1-sgo-10.1177_21582440261448511 for E-Commerce Research Trend: Transforming Qualitative Models into Quantitative Forms for Measuring E-Commerce Success in the Age of Digital Transformation by Robert M.X. Wu, Ergun Gide, Eva Cheng, Niusha Shafiabady, Seb Dianati and Kailash Kuumaran Sharavanavel in SAGE Open
Footnotes
Funding
The authors disclosed receipt of the following financial support for the research, authorship, and/or publication of this article: Supported by Australian UNSW-UTS Trustworthy Digital Society (TDS) grant (2024–2026; grant PRO24-20538).
Declaration of Conflicting Interests
The authors declared no potential conflicts of interest with respect to the research, authorship, and/or publication of this article.
Data Availability Statement
Supplemental Material
Supplemental material for this article is available online.
References
Supplementary Material
Please find the following supplemental material available below.
For Open Access articles published under a Creative Commons License, all supplemental material carries the same license as the article it is associated with.
For non-Open Access articles published, all supplemental material carries a non-exclusive license, and permission requests for re-use of supplemental material or any part of supplemental material shall be sent directly to the copyright owner as specified in the copyright notice associated with the article.