
Abstract
This study documents robust associations between corporate equality policies and information asymmetry in capital markets. Using the Corporate Equality Index (CEI) for 217 U.S. Fortune 1000 firms over 2008 to 2024 (excluding 2023; 3,053 firm-year observations), we examine how CEI is related to three market microstructure proxies of information asymmetry—the quoted bid–ask spread, Amihud illiquidity, and the high–low price spread. Across fixed effects, system GMM, instrumental-variables (2SLS), quantile, and difference-in-differences specifications, higher CEI scores are consistently associated with tighter spreads, improved liquidity, and lower price-based uncertainty. The association is most pronounced in less transparent settings, consistent with the view that inclusivity initiatives may be particularly relevant where information frictions are highest. Overall, the findings align with signaling, stakeholder, and agency-based channels and indicate that inclusive governance investments can be linked to capital-market outcomes alongside social value; however, given endogeneity concerns, we interpret all estimates as conditional associations.
Keywords
Introduction
Information asymmetry between firms and investors is a persistent friction in capital markets: it widens trading spreads, reduces liquidity, and raises the cost of capital (Ahmad et al., 2023; Akerlof, 1970; Diamond & Verrecchia, 1991; Healy & Palepu, 2001). This study examines whether corporate equality policies—formal, externally visible commitments to inclusive treatment of employees and other stakeholders—are systematically associated with market-based proxies of the information environment. Using the Human Rights Campaign Foundation’s Corporate Equality Index (CEI), we analyze its association with three market-microstructure proxies of information asymmetry (the quoted bid–ask spread, Amihud illiquidity, and the high–low price spread) for U.S. Fortune 1000 firms over 2008 to 2024. Across multiple econometric specifications commonly used to mitigate endogeneity concerns, higher CEI scores are associated with lower information asymmetry and more stable trading conditions. Given the observational setting and remaining endogeneity concerns, we interpret these results as documenting conditional associations rather than definitive causal effects.
On the other hand, in recent years, board diversity has emerged as a key issue attracting the attention of policymakers, shareholders, and academics (Brahma et al., 2021; Çelik, 2024; Chuah et al., 2025; H. Li & Chen, 2018; Reddy & Jadhav, 2019; Simionescu et al., 2021). Diversity in corporate governance structures—particularly in terms of gender, age, ethnicity, and professional background—provides significant strategic advantages for firms. Diverse boards offer a broader range of perspectives, thereby enhancing the quality of decision-making (Ali et al., 2022; Carter et al., 2003) and strengthening transparency and accountability toward stakeholders (Adams & Ferreira, 2009; Peng & Byron, 2022; Wijayanti & Setiawan, 2024). Moreover, board diversity positively influences firms’ risk profiles (Z. Li et al., 2022). Since board composition can shape monitoring intensity and disclosure oversight, diversity in governance structures has been linked to lower information asymmetry through improved reporting quality and stronger internal controls (e.g., Nwude & Nwude, 2021; Post et al., 2015; Terjesen et al., 2016).
However, the existing evidence largely focuses on who sits in the boardroom, whereas considerably less is known about whether organization-wide equality and inclusion systems—the policies, benefits, practices, and accountability mechanisms that structure day-to-day workplace inclusivity—also shape firms’ market information environments. This distinction matters: a firm may exhibit demographic diversity at the top while lacking comprehensive equality practices across the organization, and vice versa. Accordingly, beyond board composition, we examine whether firm-level equality policies provide incremental explanatory power for information asymmetry in capital markets.
In this context, the Corporate Equality Index (CEI) serves as an important benchmark for assessing firms’ LGBTQ+ equality policies in the United States. Published by the Human Rights Campaign Foundation, CEI provides a structured, multi-dimensional assessment of corporate inclusivity practices (HRC, 2023). Unlike board diversity measures (which capture the composition of a single governance body), CEI captures comprehensive, organization-wide equality policies—including non-discrimination protections, inclusive benefits, inclusive corporate culture and social responsibility, and responsible citizenship practices. These policies can influence transparency and credibility by affecting internal information flows, stakeholder trust, and the firm’s overall governance philosophy; related evidence shows that corporate social responsibility is associated with information asymmetry (Cui et al., 2018).
Accordingly, if equality-related policies are associated with stronger disclosure practices and stakeholder trust, and if firms with more transparent information environments exhibit lower information risk, we expect a negative association between CEI and information asymmetry. While prior research has examined board diversity and has discussed the broader financial relevance of inclusivity initiatives, to the best of our knowledge no study has directly examined whether the Corporate Equality Index (CEI)—as a comprehensive, organization-wide equality policy measure—is associated with market microstructure proxies of information asymmetry (e.g., bid–ask spreads, illiquidity, and high–low price-based volatility). By focusing on the CEI–information asymmetry relationship and controlling for board characteristics, we assess whether CEI is related to information asymmetry beyond what can be explained by board composition.
Accordingly, we examine the association between CEI and information asymmetry using an unbalanced panel of 217 U.S. Fortune 1000 firms over 2008 to 2024 (excluding 2023 due to the non-publication of CEI scores), comprising 3,053 firm-year observations. To capture adverse-selection-related frictions in trading, we compute three market microstructure proxies—QBAS, ILLIQ, and HILO—capturing transaction costs, liquidity, and price-based uncertainty.
To address potential endogeneity and heterogeneity issues, we employ the system generalized method of moments (System GMM) and a dynamic panel framework (Çelik et al., 2023). After controlling for corporate governance, firm characteristics, and the firm’s information environment, we find a negative association between corporate equality policies (CEI) and the degree of information asymmetry in the market.
The primary objective of this study is to examine the relationship between CEI and information asymmetry. In addition, we control for board characteristics (percentage of women, average age, independent directors, meeting frequency, CEO duality, and board size) as well as firm-level variables (ROA, Tobin’s Q, and financial leverage).
This article contributes to the existing literature in several important ways.
First, it extends the corporate governance literature by linking board diversity and inclusive workplace policies with information asymmetry in financial markets. While prior research has examined the role of board composition on firm performance and disclosure quality (Adams & Ferreira, 2009; Carter et al., 2003; Terjesen et al., 2016), there is limited empirical evidence regarding the effects of equality-oriented indices such as the Corporate Equality Index (CEI) on market information flows. By focusing on CEI, this study bridges the gap between diversity policies, corporate governance, and market microstructure outcomes. Second, the article enriches the information asymmetry literature by testing multiple proxies—Quoted Bid–Ask Spread (QBAS), Amihud Illiquidity Ratio (ILLIQ), and High–Low Price Spread (HILO)—to capture different dimensions of information risk. Prior studies have mostly focused on a single indicator (e.g., bid–ask spread: Stoll, 2000; illiquidity: Amihud, 2002; volatility: Corwin & Schultz, 2012), while this research integrates them to provide a more comprehensive understanding of how inclusivity influences trading costs, market liquidity, and volatility simultaneously. Third, this study adds to the growing body of literature on corporate equality and stakeholder theory by empirically demonstrating that inclusive policies not only foster social and ethical outcomes but also generate tangible financial benefits through reduced information asymmetry (Benlemlih, 2019; Hossain et al., 2020; Y. Wang & Schwarz, 2015). This dual perspective highlights that CEI functions as both a governance mechanism and a market signal, enhancing investor confidence and lowering the cost of capital. Finally, the study offers methodological contributions by applying advanced econometric techniques such as System GMM and Difference-in-Differences (DiD). These approaches address potential endogeneity concerns and strengthen the causal interpretation of the findings (Arellano & Bond, 1991; Blundell & Bond, 1998). By combining dynamic panel models with quasi-experimental analysis, the paper ensures that the observed effects are robust and not driven by omitted variables or reverse causality. In summary, this research extends prior knowledge by integrating corporate equality policies into the financial economics literature, providing strong empirical evidence that inclusivity reduces information asymmetry, thereby benefiting both firms and investors.
The remainder of this paper is organized as follows. Section 2 reviews the relevant literature and develops the testable hypothesis. Section 3 presents the research design, including the measures, model, and sample. Section 4 reports the empirical results, and the final section concludes.
Related Literature and Hypothesis Development
Prior Literature on Corporate Equality Policies, Board Diversity, and Information Asymmetry
Recent research on corporate equality policies shows that these practices can be viewed not only as an ethical imperative but also as a tool of corporate governance and effective diversity management (Avery & McKay, 2010). Pichler et al. (2010) demonstrated that inclusive equality policies enhance employee commitment and motivation, which indirectly contributes to productivity performance. Firms with highly motivated employees also tend to exhibit greater creativity and innovation capacity (Hossain et al., 2020). Furthermore, embracing LGBTQ+ groups broadens firms’ existing talent pools (Hossain et al., 2020). By fostering greater diversity among employees, such policies provide companies with additional strategic advantages. In addition, employees of firms that adopt these policies experience improvements in well-being, psychological health, and job satisfaction (Badgett et al., 2013; Griffith & Hebl, 2002; Sandfort et al., 2006; Waldo, 1999). CEI policies that promote sexual equality help LGBTQ+ employees feel valued and comfortable, thereby improving firm performance and contributing to overall corporate value (Shan et al., 2017). Companies adopting corporate equality policies also demonstrate stronger financial performance, enjoying higher stock returns and greater market valuations (Fatmy et al., 2022; Foster et al., 2023; Fu & Shan, 2009; Johnston & Malina, 2008; Shan et al., 2017; P. Wang & Schwarz, 2010).
From an agency theory perspective, a highly diverse board enhances monitoring efficiency by incorporating multiple perspectives and areas of expertise, which in turn translates into better corporate performance. Board members from different age groups, ethnicities, and cultural backgrounds contribute a broader knowledge base and alternative viewpoints to decision-making (Fayyaz et al., 2023; Goyal, 2018; Tiwari, 2022). Moreover, greater board diversity has been associated with significant improvements in firms’ disclosure practices (e.g., ESG reporting; Al-Jaifi et al., 2023; Ben-Amar et al., 2017; Wasiuzzaman et al., 2020; Wong et al., 2023). Additional evidence suggests that diverse boards are generally linked with more effective stakeholder management (Fernandez & Thams, 2019). In line with these advantages, CEI policies can also enhance board inclusiveness and diversity, enabling firms to better engage with a wide range of societal stakeholders (Badgett et al., 2021; Hossain et al., 2020). This, in turn, fosters stronger connections between the firm and external stakeholder groups (Hillman et al., 2007). Based on this reasoning, corporate equality policies are also expected to reduce firms’ information asymmetry. This general expectation is tested in the present study using three distinct measures of IA.
Underpinning Theory and Hypothesis Development
Signaling Theory (Spence, 1973) suggests that firms can alleviate information asymmetry by sending credible, externally observable signals about otherwise unobservable attributes such as governance quality and transparency. In our setting, the CEI score is publicly visible and based on verifiable, organization-wide equality practices; importantly, these practices can be linked to the market information environment through several concrete channels. First, a disclosure-and-verification channel: formal non-discrimination policies, inclusive benefits, training requirements, and responsible citizenship commitments typically require codified internal policies and documentation and are subject to external scrutiny via the CEI scoring process, which can increase the credibility of firm communications and the perceived quality of disclosures. Second, an internal information-flow channel: CEI-related structures (e.g., diversity councils, employee resource groups, and training) can improve escalation pathways and reduce information hoarding, increasing the timeliness and accuracy with which operational information is aggregated and transmitted to capital-market gatekeepers. Third, an internal governance/managerial behavior channel: stronger accountability and stakeholder scrutiny associated with high-CEI environments can discipline managerial opportunism and reduce incentives to conceal adverse information, thereby improving the firm’s information environment. Through these channels, CEI can serve as a credible signal that is associated with lower adverse-selection concerns among market participants (Al-Jaifi et al., 2023; Ben-Amar et al., 2017; Wasiuzzaman et al., 2020; Wong et al., 2023). In market microstructure settings, higher information asymmetry raises adverse selection risk for liquidity providers; market makers and investors protect themselves by demanding higher transaction costs, which manifests as a wider quoted bid–ask spread (QBAS; Easley & O’Hara, 2004). If CEI operates as a credible transparency-related signal via the channels above, higher CEI should be associated with narrower bid–ask spreads.
Stakeholder Theory (Freeman, 1984) argues that firms create value and manage risk by building credible, durable relationships with a broad set of stakeholders (investors, employees, customers, and communities). Comprehensive equality and inclusivity policies reflected in a high CEI score can strengthen stakeholder trust and legitimacy and lower perceived social and reputational risk, which can broaden investor participation and stabilize the investor base. This yields an information-production channel: wider participation and greater stakeholder engagement can increase information acquisition and dissemination around the firm (e.g., through greater attention and monitoring), thereby improving the overall information environment. Consistent with this logic, Diamond and Verrecchia (1991) show that stronger disclosure and transparency are linked to higher trading activity and enhanced liquidity. Accordingly, CEI can be associated with richer and more credible information flows and stronger market participation (Al-Jaifi et al., 2023; Ben-Amar et al., 2017; Wasiuzzaman et al., 2020; Wong et al., 2023), which should be reflected in tighter liquidity-related measures and lower price impact.
The Amihud illiquidity measure (ILLIQ) is a widely used proxy for market liquidity because it captures how strongly prices move in response to trading volume; more liquid stocks exhibit smaller price changes per unit of traded volume (Amihud & Mendelson, 1986). Accordingly, if CEI-related stakeholder trust and information-production mechanisms are stronger, firms with higher CEI scores should exhibit lower illiquidity.
Agency Theory (Jensen & Meckling, 1976) suggests that governance practices that strengthen monitoring can constrain managerial opportunism and limit the scope for trading based on private information. In our setting, a high CEI score can coincide with firm-wide accountability, oversight structures, and internal reporting routines, which are plausibly linked to a more disciplined information environment. Complementing this governance-based channel, behavioral finance research indicates that when information environments are opaque, investor herding can amplify speculative price movements and bubble-like dynamics, ultimately increasing volatility (Erol & Dogan, 2024). Therefore, we expect higher CEI scores to be associated with lower price volatility, as captured by the HILO measure. These theoretical arguments motivate our empirical hypotheses, which are presented explicitly in Section 3.1.
Research Design and Sample
Research Hypotheses
Drawing on the theoretical arguments in Section 2, we test whether corporate equality policies (as proxied by the CEI score) reduce information asymmetry in capital markets. Accordingly, we propose the following hypotheses:
Data and Sample
The sample consists of a unbalanced panel dataset of 217 U.S. firms listed in the Fortune 1000 index between 2008 and 2024. The data were obtained from Bloomberg, the Human Rights Campaign (HRC), and companies’ annual reports. After excluding firms with missing data, the final sample comprises 3,053 firm-year observations. The Corporate Equality Index (CEI) data were obtained from the Human Rights Campaign (HRC). However, it should be noted that the CEI report for the year 2023 was not published by HRC, resulting in a 1-year data gap. Therefore, our baseline analyses use the 2008 to 2024 period excluding 2023.
To demonstrate that this omission does not drive our findings, we conducted an additional robustness check by imputing the missing 2023 CEI score via linear interpolation using adjacent years (i.e., CEI_2023^interp = (CEI_2022 + CEI_2024) / 2 for each firm). We then re-estimated our main models on the augmented panel that includes 2023 with the interpolated CEI values. The inferences regarding the effect of CEI on information asymmetry remain qualitatively unchanged. The results of this robustness check are reported in Table A1 and show that the CEI coefficients remain qualitatively unchanged when 2023 is included using interpolated CEI values. This omission does not materially affect the analysis, as unbalanced panel construction was maintained, and robustness checks confirm that the absence of a single year does not bias the overall findings.
Variable Measurement
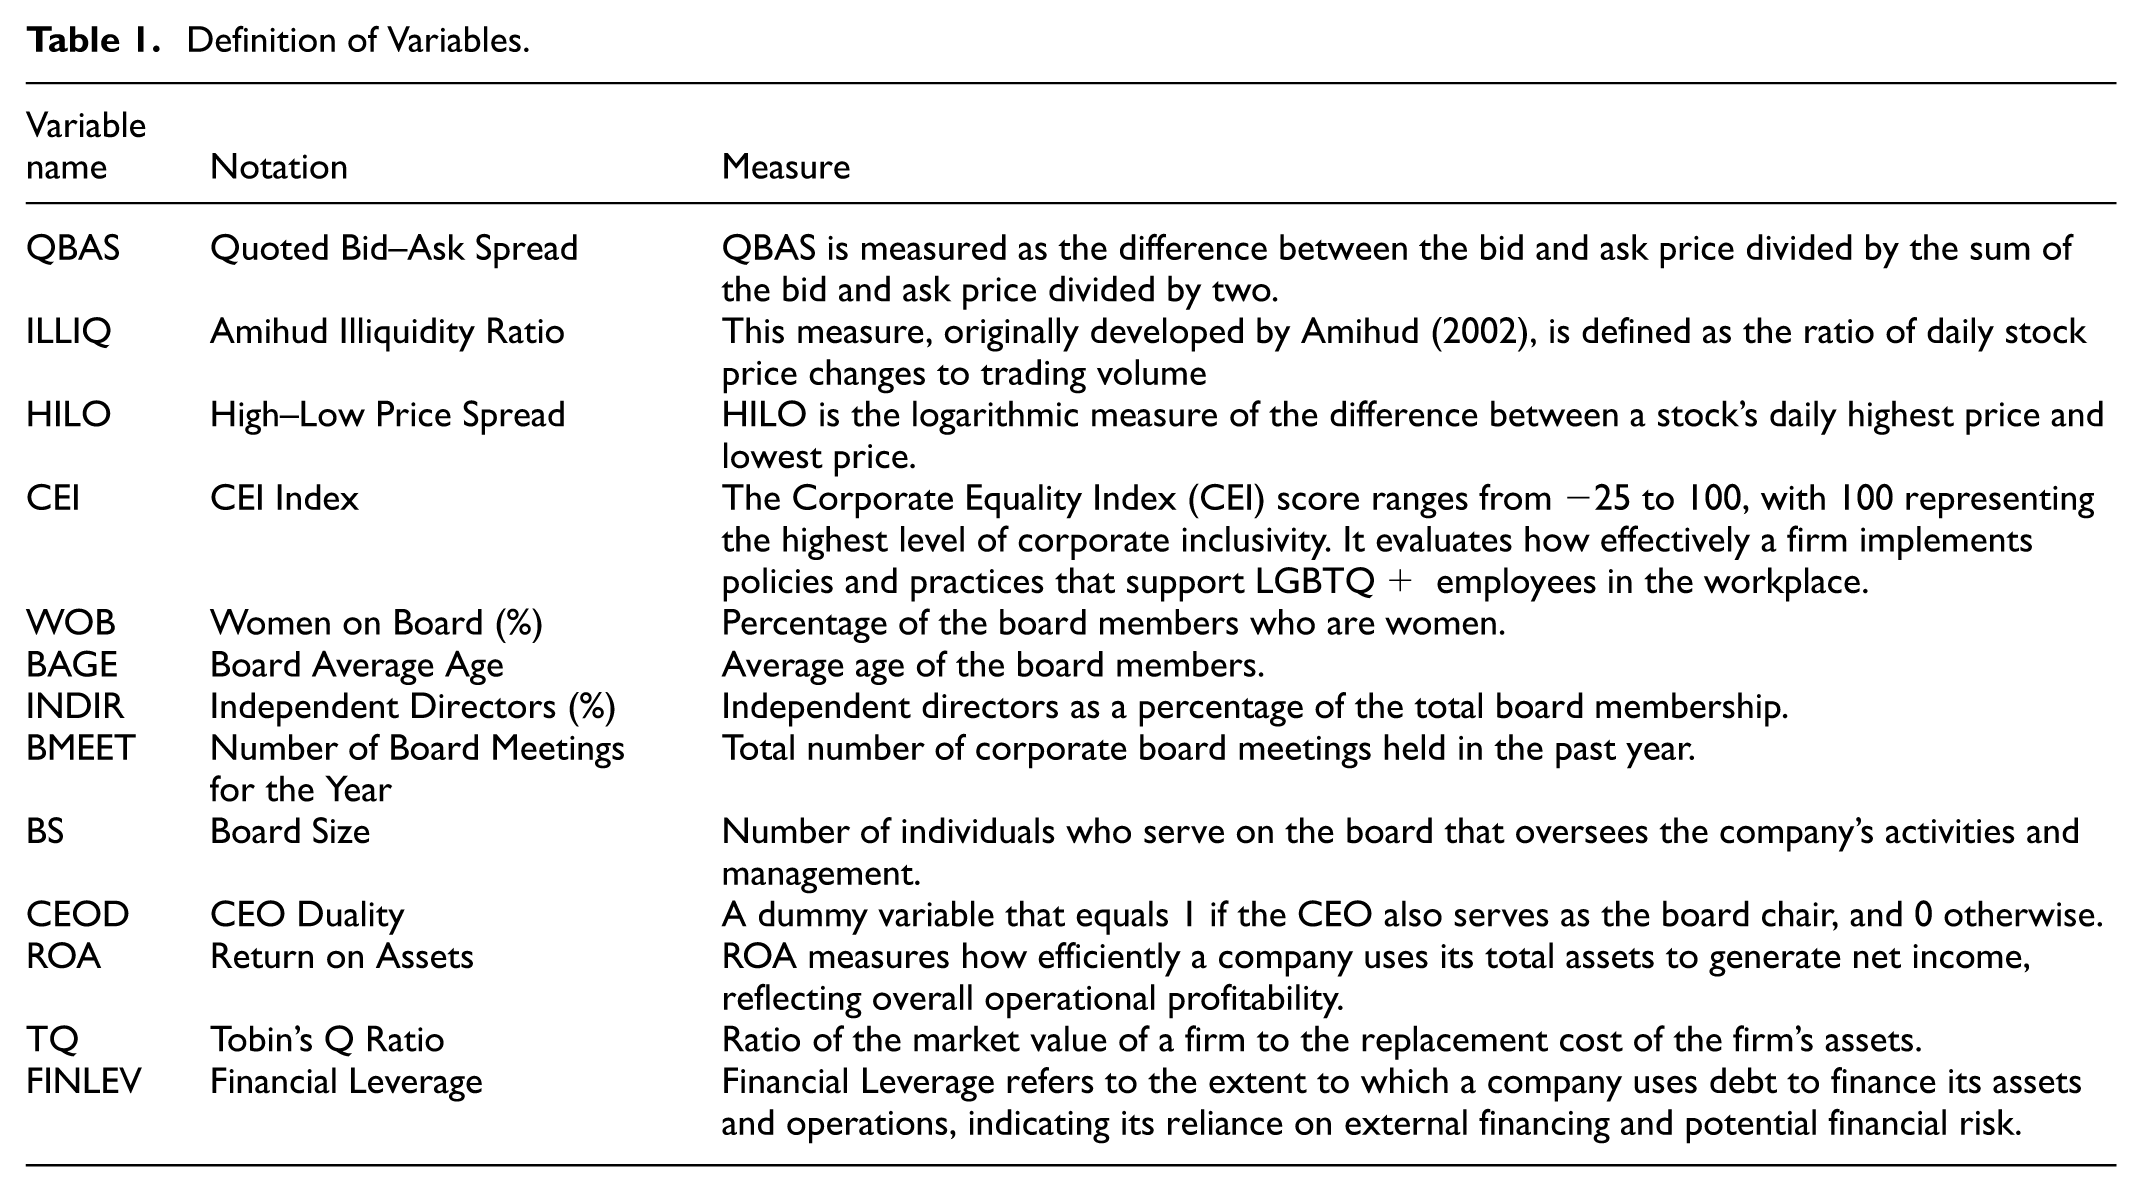
Table 1 provides the definitions of the variables.
Definition of Variables.
Dependent Variables
To measure firms’ levels of information asymmetry (IA), we employ three different methods that are frequently used in the literature. By doing so, we aim to broaden the scope of our tests across three separate models and enhance the robustness of our results.
Quoted Bid–Ask Spread (QBAS)
The quoted bid–ask spread (QBAS) is one of the most widely used proxies for measuring information asymmetry (Abad et al., 2017; Almulhim, 2023; Goh et al., 2016; Heflin et al., 2005; Leuz & Verrecchia, 2000). QBAS is calculated as the difference between the ask price and the bid price, divided by the average of the bid and ask prices. This method has been extensively applied in the literature to capture the degree of asymmetric information.

QBAS represents the difference between the best bid price and the best ask price of a financial asset. Specifically, Askt denotes the lowest daily ask (offer) price, while Bidt denotes the highest daily bid price. QBAS is one of the most fundamental indicators of information asymmetry and market liquidity (Stoll, 2000). In this study, QBAS values were calculated for each trading day within a year, and subsequently, annual averages were computed for each firm-year observation.
Amihud Illiquidity Ratio (ILLIQ)
The Amihud illiquidity ratio, developed by Amihud (2002), is defined as the ratio of daily absolute price changes to trading volume. This measure has been widely applied in the literature as a proxy for information asymmetry (Yang et al., 2025).

Here, Rt represents the daily return, and VOLDt denotes the trading volume. A high ILLIQ value indicates that even a small trading volume leads to large price changes, implying that the stock is illiquid. Conversely, a low ILLIQ value reflects more efficient price formation and lower information asymmetry (Amihud, 2002). For the purposes of this study, annual averages were calculated from the daily values.
High–Low Price Spread (HILO)
HILO is defined as the logarithmic difference between a stock’s daily highest and lowest prices. This method is widely used in the literature to measure information asymmetry (Chen, 1997; Han et al., 2022).

HILO serves as a reliable volatility indicator for measuring information asymmetry (Corwin & Schultz, 2012). A higher HILO reflects greater information imbalance, uncertainty, and speculative trading in the market, whereas a lower HILO indicates stronger price stability. For this study, daily HILO values were calculated and then averaged annually.
Independent Variables
Key Variable (CEI Score)
The Corporate Equality Index (CEI) is the key variable in this study. CEI evaluates firms’ policies regarding non-discrimination toward LGBTQ+ employees and their families, the promotion of an inclusive workplace culture, and corporate social responsibility practices (HRC, 2023). As shown in Table 2, the CEI assesses companies’ LGBTQ+ inclusivity policies under four main categories: employment protections (e.g., prohibiting discrimination based on sexual orientation and gender identity), inclusive benefits (e.g., equal health and social benefits for same-sex and heterosexual employees), inclusive corporate culture and social responsibility (e.g., internal training, employee resource groups, and community engagement), and responsible citizenship practices. Firms earn points for adopting these inclusive policies, while those that fail to adopt them lose points. Thus, CEI serves as a comprehensive measure of corporate-level equality policies (HRC, 2023).
Criteria of the Corporate Equality Index (CEI).
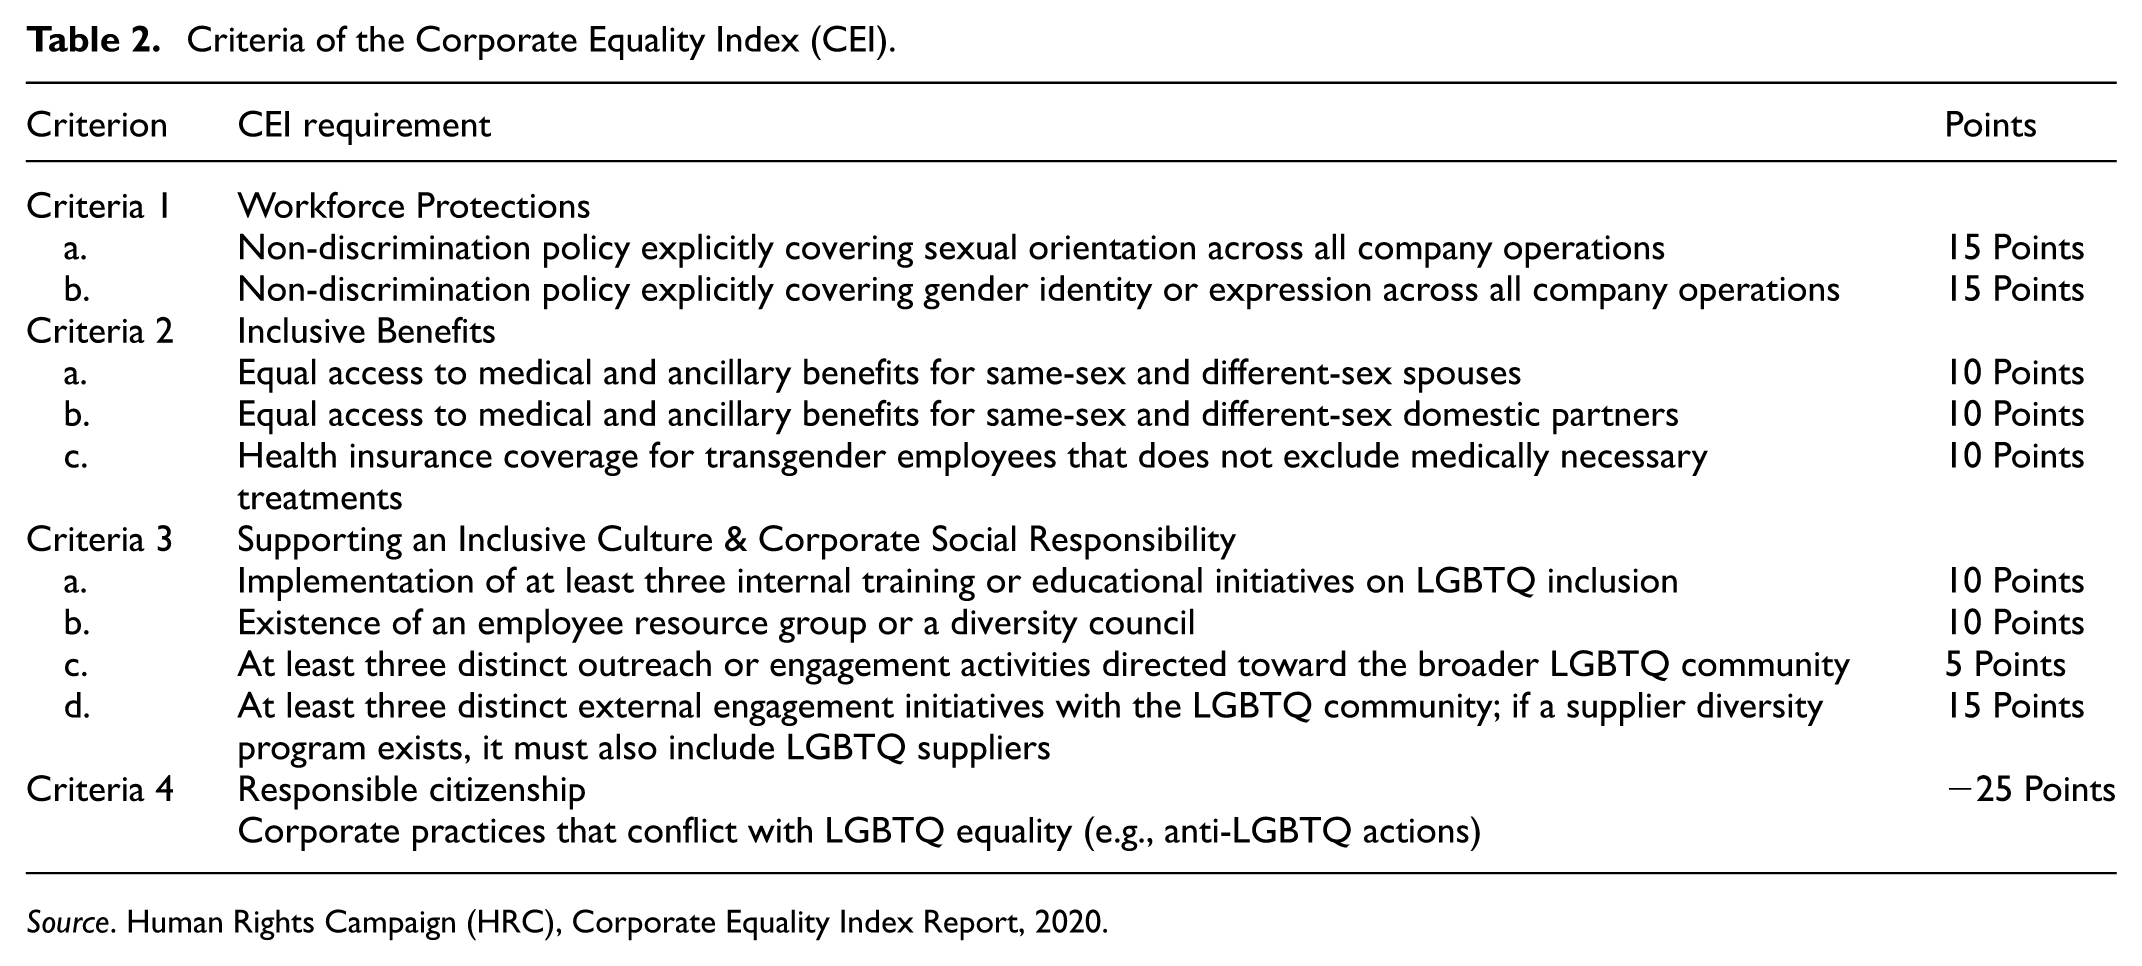
Source. Human Rights Campaign (HRC), Corporate Equality Index Report, 2020.
Control Variables
Board Characteristics
We include a number of control variables which may affect the IA, based on the previous studies (Almulhim, 2023; Özparlak, 2024; Sarang et al., 2024).
Women on Board (WOB) refers to the proportion of female directors on a company’s board and has been widely employed as a key control variable in studies examining the relationship between information asymmetry and board diversity (Aribi et al., 2018; Loukil et al., 2020). Board Average Age (BAGE) represents the mean age of board members, which may influence information asymmetry through factors such as risk-taking tendencies and strategic agility (Sarang et al., 2024). Board Independence (INDIR), measured as the proportion of independent directors, is considered a component of corporate governance that may either mitigate or exacerbate information asymmetry (Almulhim, 2023; Hamrouni et al., 2022). Board Meeting Tenure (BMEET) indicates the number of board meetings held in the previous year, with higher frequency serving as a proxy for governance effectiveness, potentially reducing information asymmetry by enhancing oversight and decision-making processes (Cormier et al., 2011; Huang & Hilary, 2018).
Board Size (BS) refers to the total number of directors on the board, which may affect both the diversity of strategic decision-making and the scope of corporate disclosure (Almulhim, 2023; Goh et al., 2014; Hamrouni et al., 2022; Loukil et al., 2020; Sarang et al., 2024). Finally, CEO Duality (CEOD) captures whether the CEO simultaneously serves as the board chair, a governance structure that may influence disclosure practices through concentration of authority (Almulhim, 2023; Loukil et al., 2020).
Firms Characteristics
Return on Assets (ROA) is a profitability indicator that measures how efficiently a firm utilizes its assets and is widely used to analyze the impact of corporate disclosures on firm performance (Hamrouni et al., 2020; Sarang et al., 2024). Tobin’s Q ratio (TQ), defined as the ratio of market value to replacement cost, is employed to examine the relationship between firm value and information asymmetry (Poursoleiman et al., 2020). Financial Leverage (FINLEV) measures the extent of debt financing within a firm, with higher leverage potentially influencing the level of information asymmetry (Bae et al., 2018; Roberts, 1992).
The sample of the study consists of firms operating across 11 different sectors. As shown in Table 3, the largest portion of the sample is represented by the financial sector (19.8%), followed by consumer discretionary (17.5%) and industrials (13.8%). These are followed by information technology, consumer staples, healthcare, energy, and other sectors. This distribution indicates that the sample is diverse across industries and that the analyses are capable of reflecting sectoral differences.
Sample by Industry Sector Between 2008 and 2024.
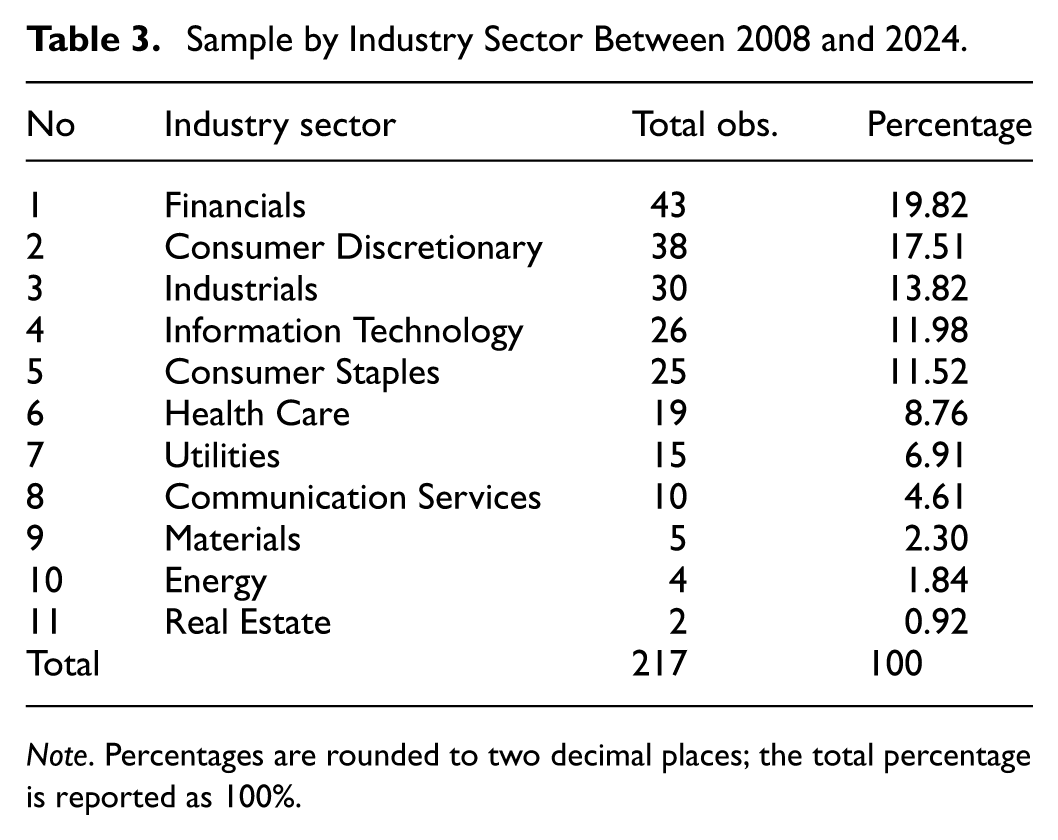
Note. Percentages are rounded to two decimal places; the total percentage is reported as 100%.
Model Specification and Estimation Procedure
To examine the association between Corporate Equality Index (CEI) and information asymmetry (IA), we follow a sequential empirical strategy that assesses robustness to alternative specifications commonly used to mitigate endogeneity concerns. First, we estimate Pooled OLS models to present a transparent baseline association between CEI and each IA proxy. Second, we estimate firm fixed-effects models to absorb time-invariant unobserved firm characteristics (e.g., persistent corporate culture or long-run governance orientation) that may be correlated with both CEI and the firm’s information environment. Third, because information asymmetry measures can be persistent over time and CEI may be endogenous (including potential reverse causality), we employ System GMM to address dynamic endogeneity using internal instruments derived from lagged variables. We also report complementary 2SLS and difference-in-differences (DiD) specifications that leverage plausibly exogenous variation and quasi-experimental contrasts; however, consistent with the observational nature of this setting, we interpret all estimates as documenting conditional associations rather than definitive causal effects. The main and robustness results are reported in the Empirical Findings section, followed by the additional analyses.
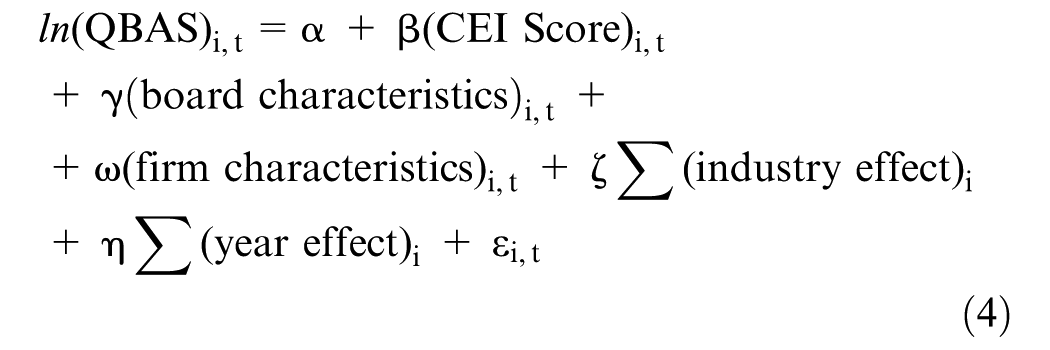
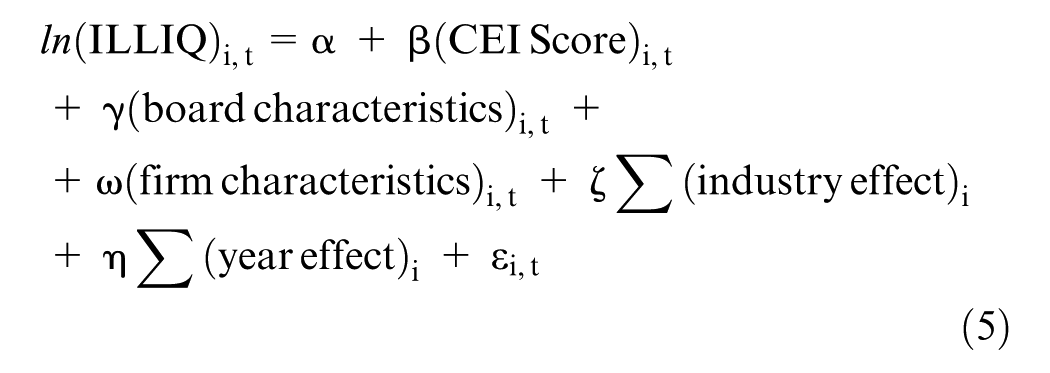
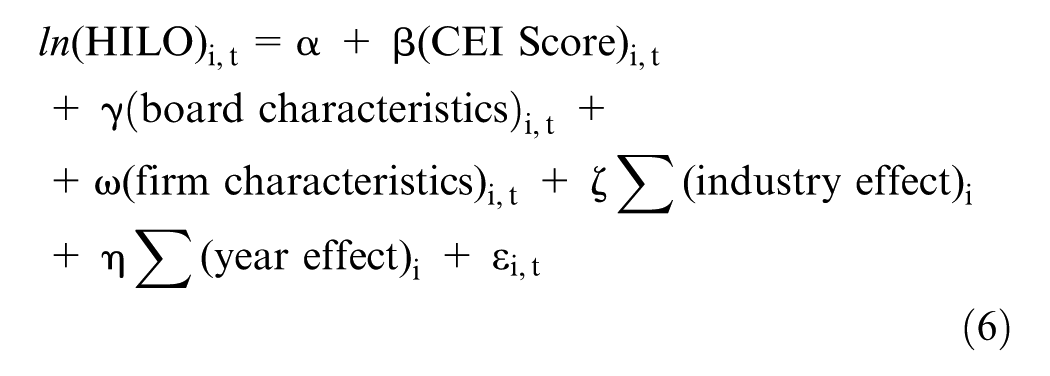
Equations 4 to 6 present the models employed in this study. In these models, three different proxies are defined to measure information asymmetry as dependent variables. In the first model, the Quoted Bid–Ask Spread (QBAS), which reflects transaction costs, is used to represent IA; in the second model, the Amihud Illiquidity Ratio (ILLIQ), a reverse measure of market liquidity, is employed; and in the third model, the High–Low Spread (HILO), which captures price volatility, serves as the dependent variable. Indicators of information asymmetry and market microstructure (QBAS, ILLIQ, HILO) are typically included in analyses using logarithmic transformation (ln). This approach has two main advantages: First, since the distribution of these variables is usually right-skewed, the logarithmic transformation helps achieve a distribution closer to normality, thereby improving the validity of parametric tests (Gujarati & Porter, 2009; Wooldridge, 2010). Second, the ln transformation reduces the impact of outliers, allowing regression coefficients to be interpreted more consistently and comparably (Abad et al., 2017; Amihud, 2002; Leuz & Verrecchia, 2000).
The main independent variable in the model, (CEI Score)i,t represents the intensity of corporate equality policies. In addition, (board characteristics)i,t denotes variables related to firms’ board structures. These include the proportion of female directors, the average age of board members, the proportion of independent directors, the number of board meetings, board size, and CEO duality. Furthermore, (firm characteristics)i,t refers to firms’ financial indicators, such as return on assets, Tobin’s Q, and financial leverage. To account for unobserved heterogeneity, industry and year fixed effects are included, thereby controlling for sectoral and temporal differences that may influence the results.
Empirical Findings
Descriptive Analysis and Correlation Matrix
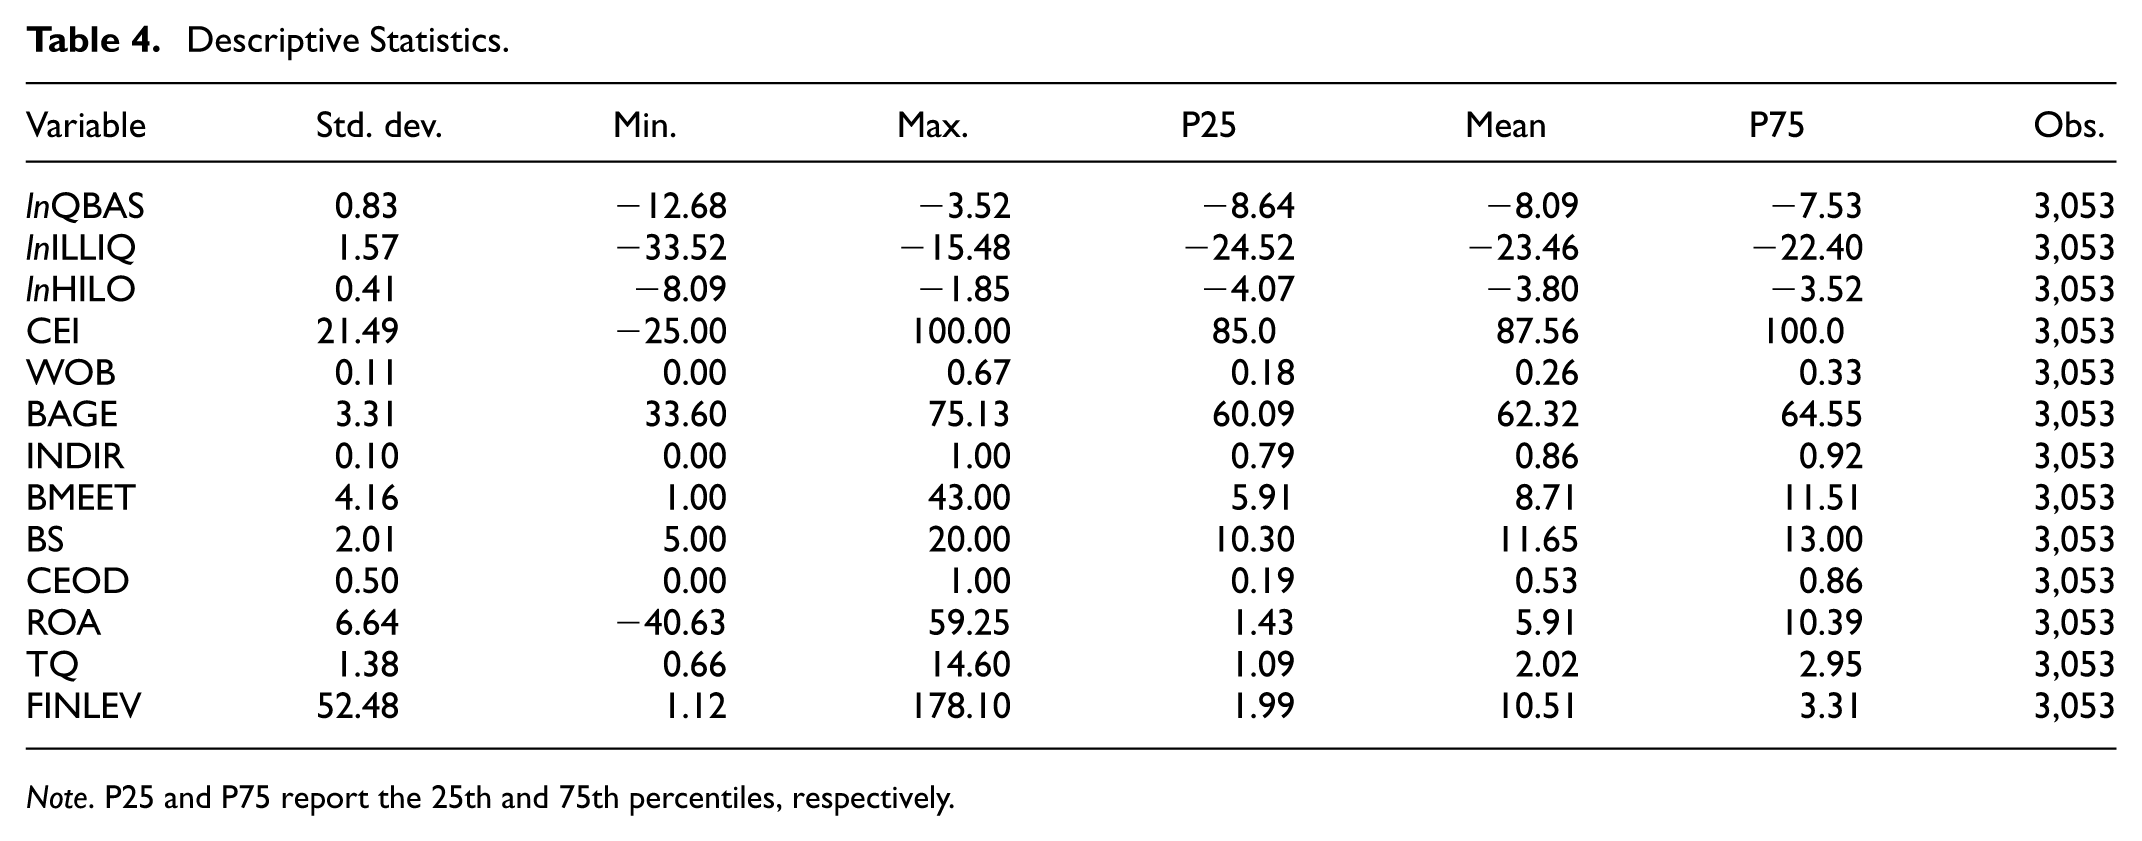
Table 4 presents the descriptive statistics of the variables used in this study; P25 and P75 denote the 25th and 75th percentiles (interquartile range), which complement the mean and standard deviation by summarizing the distribution in a way that is less sensitive to extreme observations. The value of lnQBAS ranges from −12.68 to −3.52, with a mean of −8.09. The mean of lnILLIQ is −23.46, with values ranging between −33.52 and −15.48. In addition, the final IA indicator, lnHILO, ranges from −8.09 to −1.85, with a mean of −3.80. The study’s key variable, CEI, has an average score of 87.56, with values ranging from −25.00 to 100, reflecting the index’s 25-point penalty for certain publicly documented anti-LGBTQ policies (“blemish”), in addition to the 0 to 100 scoring criteria. The CEI distribution exhibits substantial mass at the upper bound (100), resulting in P75 equal to the maximum value. Among the corporate governance variables, the average proportion of women on boards (WOB) is 26%, which falls below the 40% benchmark commonly targeted by international organizations. The average board age (BAGE) is 62.32, suggesting that relatively older individuals serve on the boards of U.S. firms. The mean board size (BS) is 11.65, indicating broad representation within boards. The average percentage of independent directors (INDIR) is 86%. Boards meet on average 8.71 times per year (BMEET), with a maximum of 43, suggesting substantial heterogeneity across firms. The percentage of CEO duality is 53%, which may indicate a concentration of power in governance structures. The average return on assets (ROA) is 5.91%, although the presence of outliers points to considerable volatility. Tobin’s Q has a mean of 2.02, indicating that many firms are priced above their book value in the market. Finally, FINLEV is highly right-skewed, ranging from 0.01 to 1,813 in the raw data; after winsorization/trimming (state the rule), the maximum is 178.10. Notably, for some variables (e.g., FINLEV and BMEET), the distance between the mean and the percentile-based summaries indicates a right-skewed distribution and the presence of extreme observations, reinforcing the use of robust specifications in the subsequent analyses.
Descriptive Statistics.
Note. P25 and P75 report the 25th and 75th percentiles, respectively.
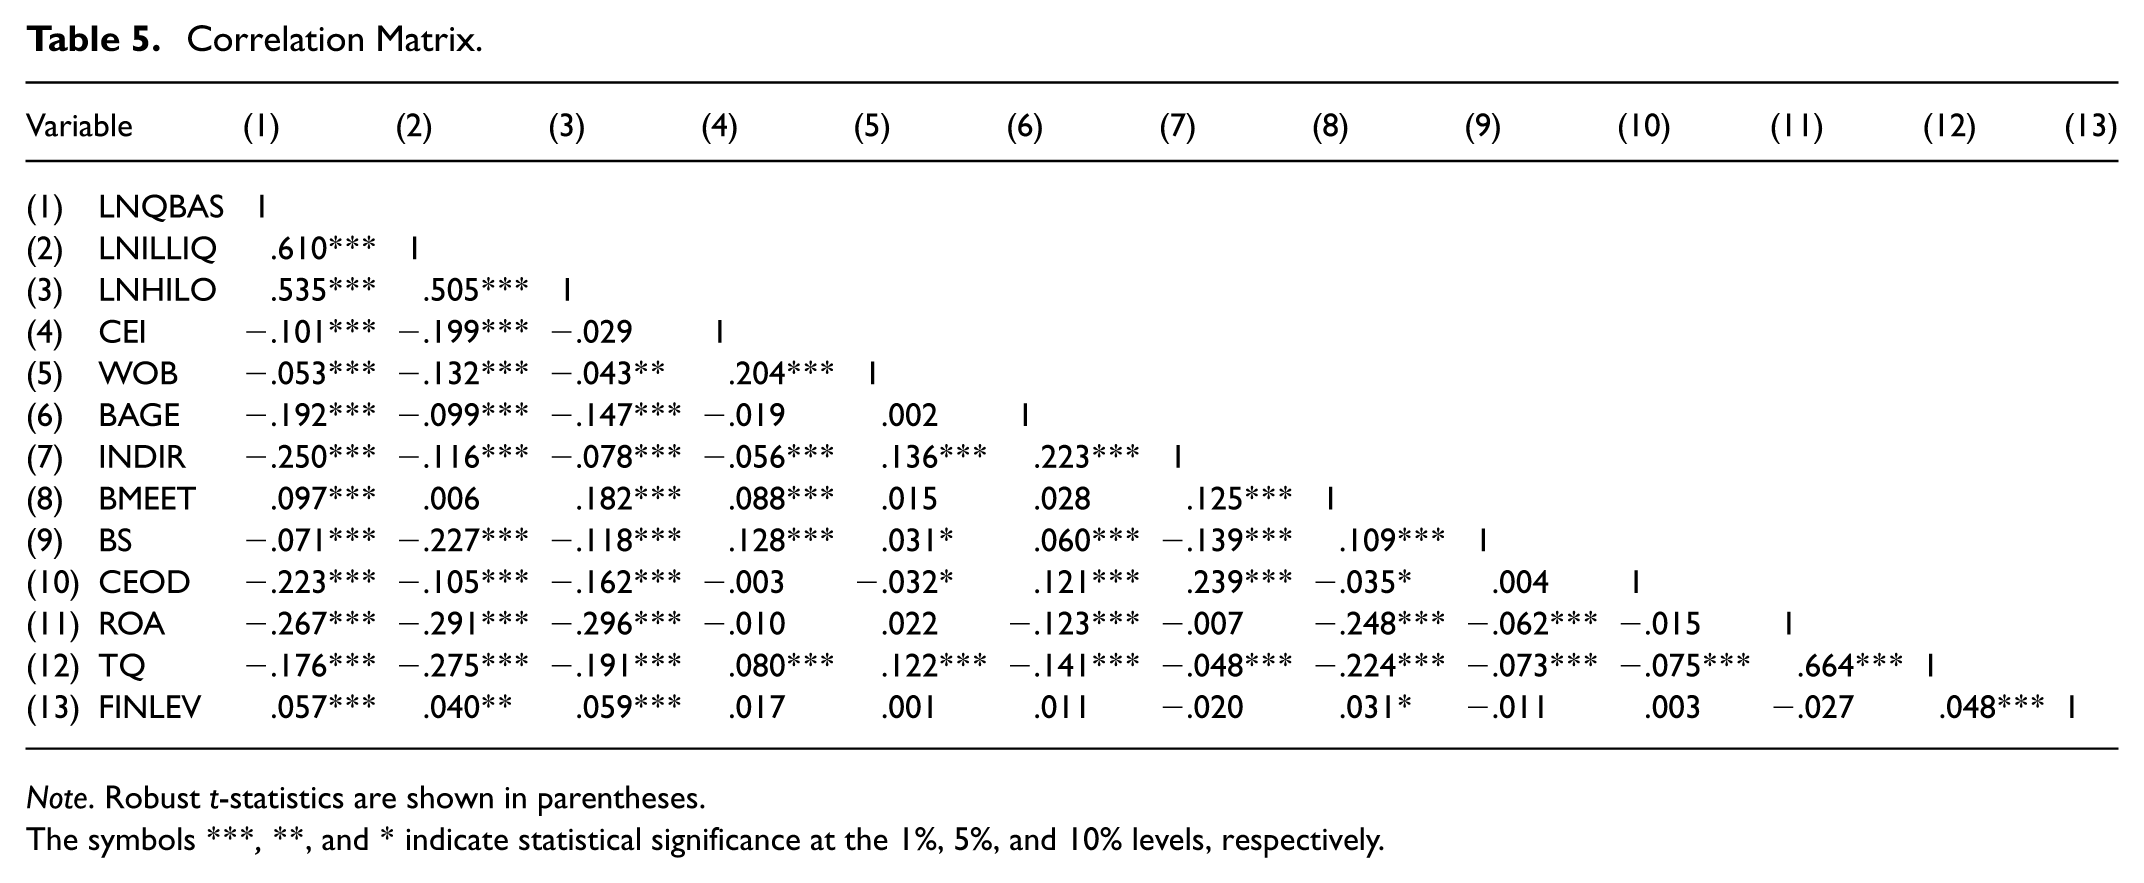
The correlation matrix in Table 5 illustrates both the direction and magnitude of the linear associations between the variables.
Correlation Matrix.
Note. Robust t-statistics are shown in parentheses.
The symbols ***, **, and * indicate statistical significance at the 1%, 5%, and 10% levels, respectively.
First, there are strong and positive correlations among the variables measuring liquidity asymmetry (LNQBAS, LNILLIQ, LNHILO), with coefficients around 0.61, 0.51, and 0.54. This indicates that the three proxies capture similar dimensions of information asymmetry in different forms. Negative relationships between CEI and these liquidity measures are noteworthy (e.g., −0.20 with LNILLIQ and −0.10 with LNQBAS), suggesting that firms with higher Corporate Equality Index scores exhibit lower information asymmetry. Similarly, WOB is positively associated with CEI (0.20) but negatively associated with liquidity measures, implying that female representation on boards strengthens market transparency.
Regarding board characteristics, the proportion of independent directors (INDIR) shows significant negative correlations with liquidity asymmetry measures, but a positive relationship with CEO duality (0.24). This suggests that greater board independence enhances market transparency, whereas CEO duality tends to coexist with higher independence. Interestingly, CEO duality is also strongly and negatively correlated with liquidity measures (approximately −0.22), implying that duality may enhance transparency—an outcome that warrants theoretical discussion.
Turning to performance indicators, both ROA and Tobin’s Q show strong negative associations with liquidity asymmetry variables (e.g., −0.30 between ROA and LNHILO; −0.28 between TQ and LNILLIQ), indicating that better-performing firms are also more transparent. Moreover, the high positive correlation between ROA and TQ (0.66) is consistent with expectations. By contrast, financial leverage (FINLEV) exhibits weak but significant relationships with other variables, such as a slight positive correlation with LNQBAS (0.06) and with ROA (0.05), though generally at low levels.
Regression Analysis
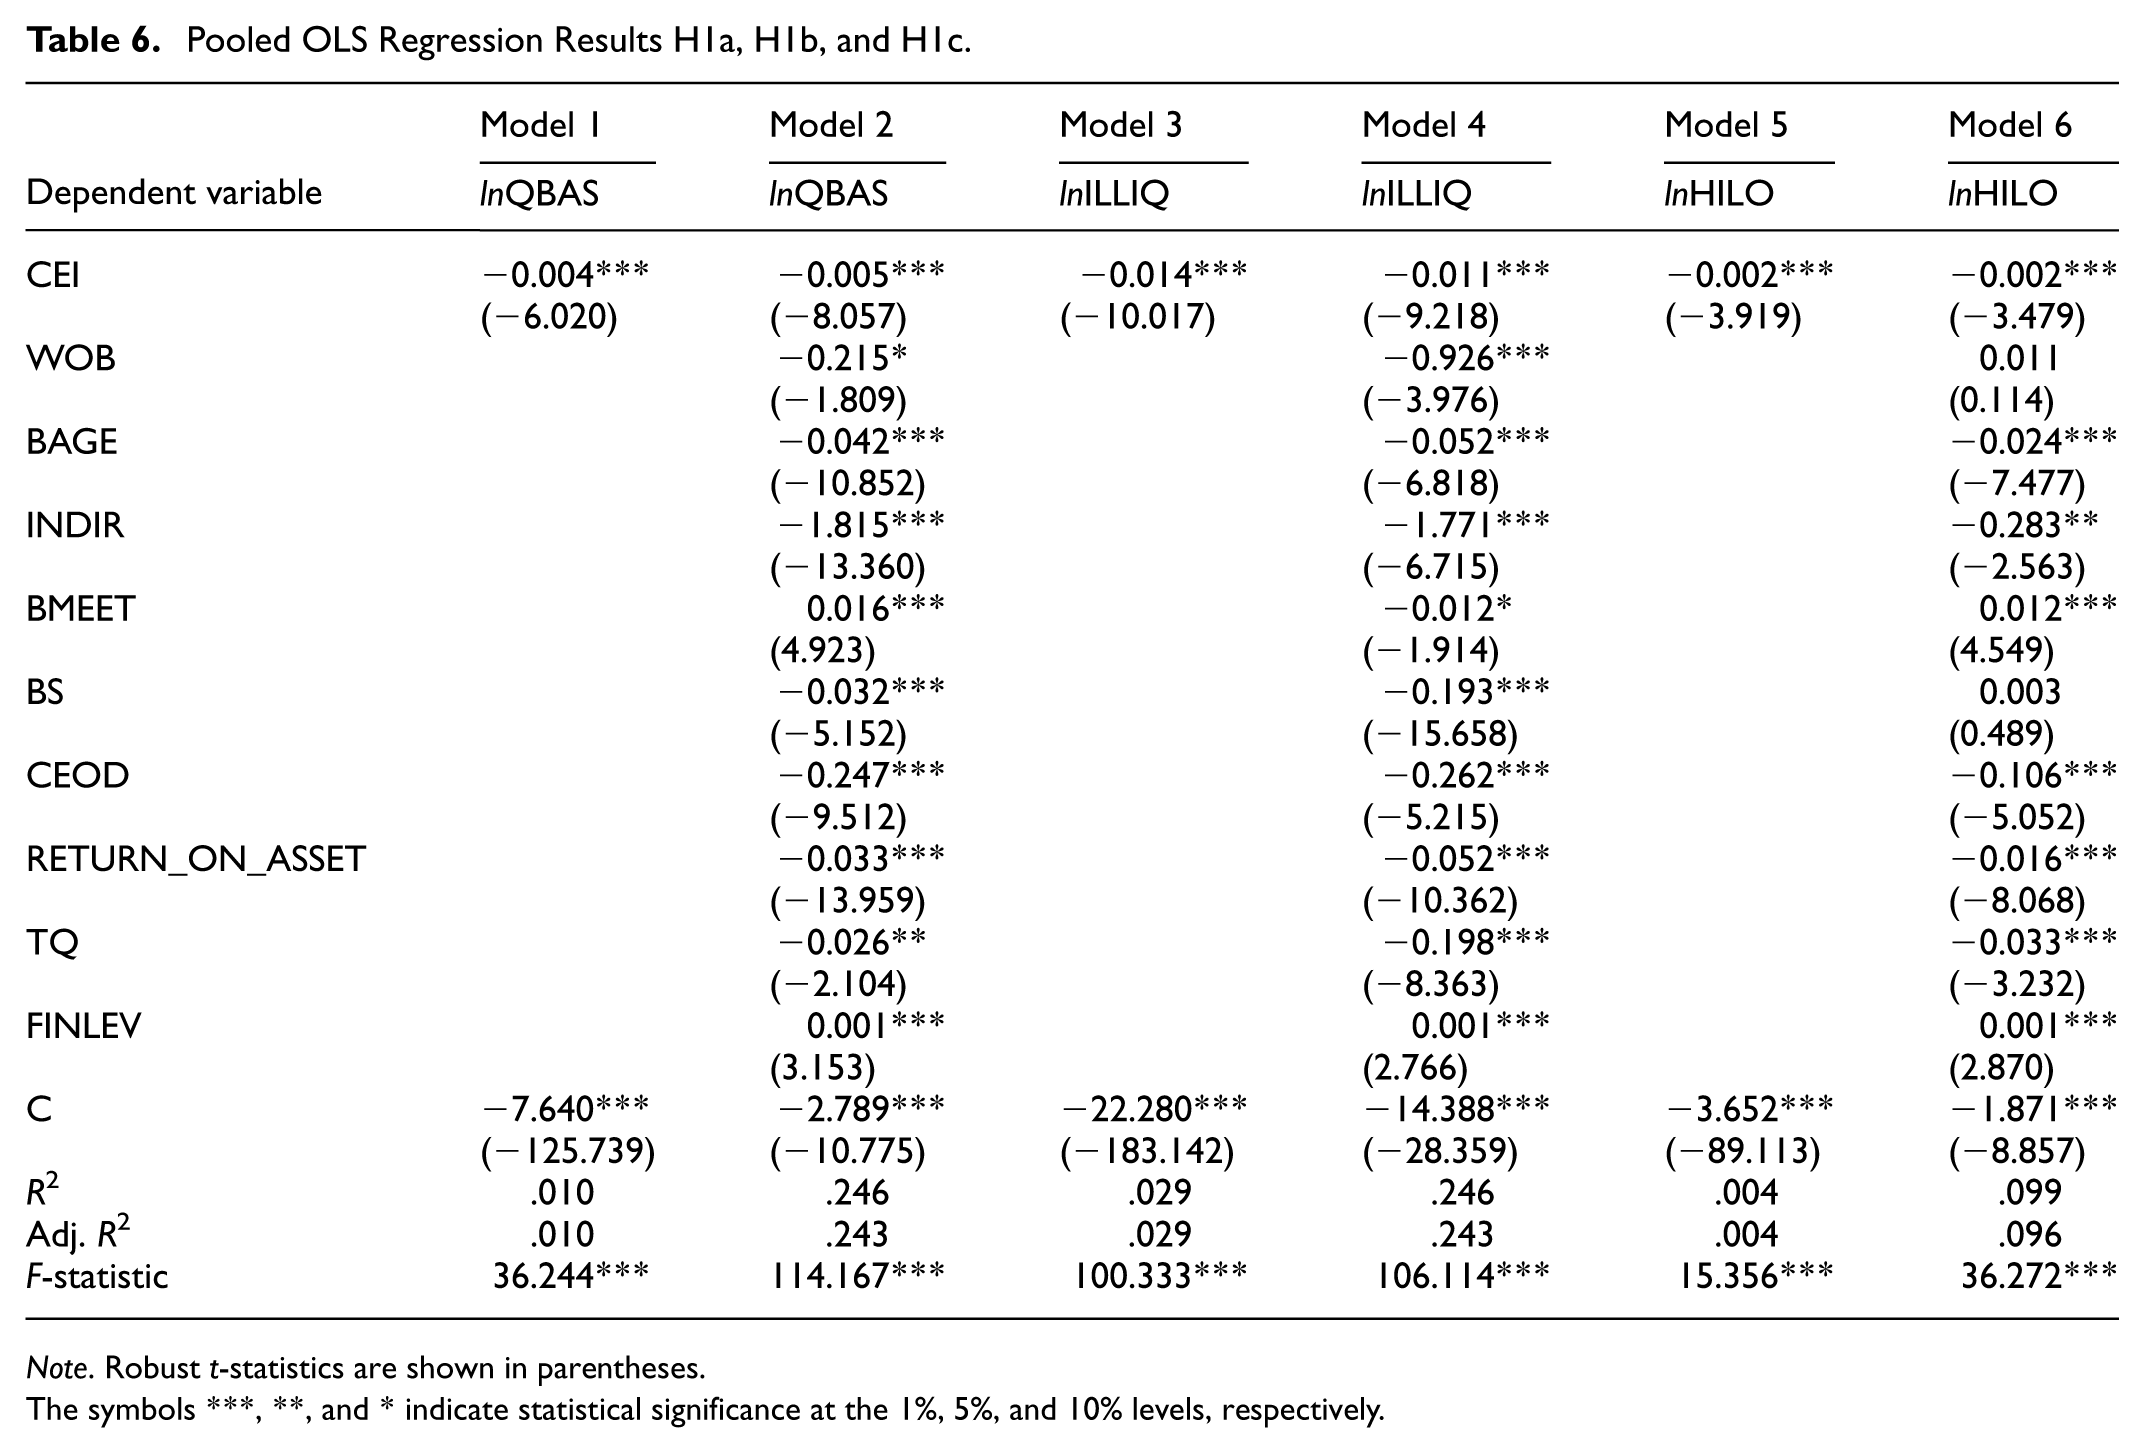
The Pooled OLS results in Table 6 directly evaluate hypotheses H1a, H1b, and H1c regarding the association between CEI and information asymmetry. Models 1, 3, and 5 present the CEI–IA association without control variables, while Models 2, 4, and 6 incorporate board and firm-level controls. Across all models, the CEI coefficient is negative and statistically significant at the 1% level. This pattern indicates that firms with higher Corporate Equality Index scores (i.e., stronger diversity and inclusion practices) tend to exhibit lower information asymmetry, as measured by lnQBAS, lnILLIQ, and lnHILO. Specifically, a one-point higher CEI score is associated with approximately 0.4% to 0.5% lower QBAS, 1.1% to 1.4% lower ILLIQ, and 0.2% lower HILO.
Pooled OLS Regression Results H1a, H1b, and H1c.
Note. Robust t-statistics are shown in parentheses.
The symbols ***, **, and * indicate statistical significance at the 1%, 5%, and 10% levels, respectively.
To gauge economic significance, we scale the lnQBAS estimate using a one-standard-deviation change in CEI (σCEI = 21.49). Based on the fully controlled specification (Model 2), a one-standard-deviation higher CEI score is associated with an estimated 10.2% lower QBAS (exp(−0.005 × 21.49) − 1). Using the sample mean of lnQBAS (−8.09), this corresponds to about 0.31 basis points (bps) lower quoted bid–ask spread, from roughly 3.07 bps to 2.76 bps. In trading-cost terms, this magnitude corresponds to approximately $16 lower spread costs per $1 million traded for a one-way marketable trade (half-spread), or about $31 per $1 million for a round-trip (full spread). Overall, the evidence is consistent with a robust negative association between CEI and multiple information-asymmetry proxies, in line with H1a, H1b, and H1c.
In addition, the proportion of women on boards (WOB) is negative and weakly significant (10% level) in the lnQBAS model, while it is strongly negative and significant in the lnILLIQ model, suggesting that female board representation improves market transparency for certain IA proxies. However, the coefficient is insignificant for lnHILO, indicating that the effect is not consistent across all measures. Board Average Age (BAGE) is negative and significant, implying that older boards enhance transparency. Board independence (INDIR) is strongly negative in all models, confirming that greater independence reduces information asymmetry. Board Meetings (BMEET) show mixed results: more frequent meetings are associated with higher asymmetry in lnQBAS and lnHILO, yet lower illiquidity (lnILLIQ). This pattern is consistent with two complementary channels. First, a monitoring/disclosure channel: more active boards may facilitate timelier oversight and richer voluntary disclosure, improving trading conditions and market depth, which can translate into lower illiquidity. Second, a reactive governance channel: boards may meet more often during periods of weak performance or elevated uncertainty, so meeting frequency can co-move with wider spreads and higher volatility even if governance is tightening. Prior evidence shows that board activity often increases following share price declines, consistent with a partly reactive “fire-fighting” role (Vafeas, 1999). In addition, information asymmetry can intensify around board meetings because private information is exchanged and may be reflected in informed trading and spread dynamics (Mishra et al., 2009). At the same time, stronger board governance and disclosure environments are linked to lower bid–ask spreads and lower return volatility (Laksmana, 2008) and to higher market liquidity (Foo & Mat Zain, 2010). Overall, the mixed signs suggest that meeting frequency is an imperfect proxy for meeting quality, and that liquidity improvements may coexist with short-run information events that widen spreads and volatility.
Importantly, CEO Duality (CEOD) is consistently negative and significant across models, indicating that firms where the CEO also serves as board chair exhibit lower information asymmetry in our sample. We emphasize that this finding should not be read as implying that prior researchers are “incorrect.” The dominant agency-based view predicts the opposite—namely that CEO duality weakens board monitoring, increases entrenchment risk, and may deteriorate the firm’s disclosure and information environment (Fama & Jensen, 1983; Jensen & Meckling, 1976). Consistent with this view, prior evidence often finds that CEO duality is associated with lower voluntary disclosure (Gul & Leung, 2004) and, in some settings, higher information asymmetry proxies such as wider bid–ask spreads (Alduais, 2022) or greater overall information asymmetry through weaker disclosure (Almulhim, 2023). At the same time, the CEO duality literature also highlights that its effects can be contingent and “double-edged,” depending on complementary governance mechanisms and organizational context (Brickley et al., 1997; Finkelstein & D’Aveni, 1994; Krause et al., 2014).
In our setting, we interpret the negative CEOD association as a context-contingent pattern that may arise when duality coexists with governance complements that mitigate entrenchment concerns and strengthen transparency. For example, duality can coincide with stronger independent monitoring (e.g., higher board independence), which in our sample tends to co-move with dual leadership structures, potentially offsetting the classic agency costs. Moreover, because CEI captures comprehensive, organization-wide inclusivity policies that often come with stronger stakeholder scrutiny and more formalized internal reporting routines, high-CEI firms may have complementary transparency channels that dampen the opacity risks typically attributed to CEO duality. Under such complementary conditions, CEO duality may deliver “unity of command” benefits—faster coordination and clearer accountability for disclosure decisions—without generating the usual deterioration in the information environment. We therefore present this result as a potentially important, context-dependent insight rather than a refutation of prior theory, and we encourage future research to test these mechanisms directly (e.g., CEI × CEOD interaction models or subsample analyses by CEI intensity and monitoring strength).
Finally, performance indicators ROA and Tobin’s Q are both negative, consistent with the notion that more profitable and higher-valued firms are more transparent. By contrast, financial leverage (FINLEV) is small but positive, suggesting that more indebted firms face slightly higher information asymmetry. One plausible channel is that higher leverage amplifies default and refinancing risk and makes firm value more sensitive to privately held information about cash flows and credit conditions; this can increase informed trading and the adverse-selection component of trading costs. Consistent with this view, financially weaker firms exhibit higher bid–ask spreads, and poorer credit quality is associated with larger adverse-selection measures in equity markets (Agrawal et al., 2004; Odders-White & Ready 2006).
Robustness Tests
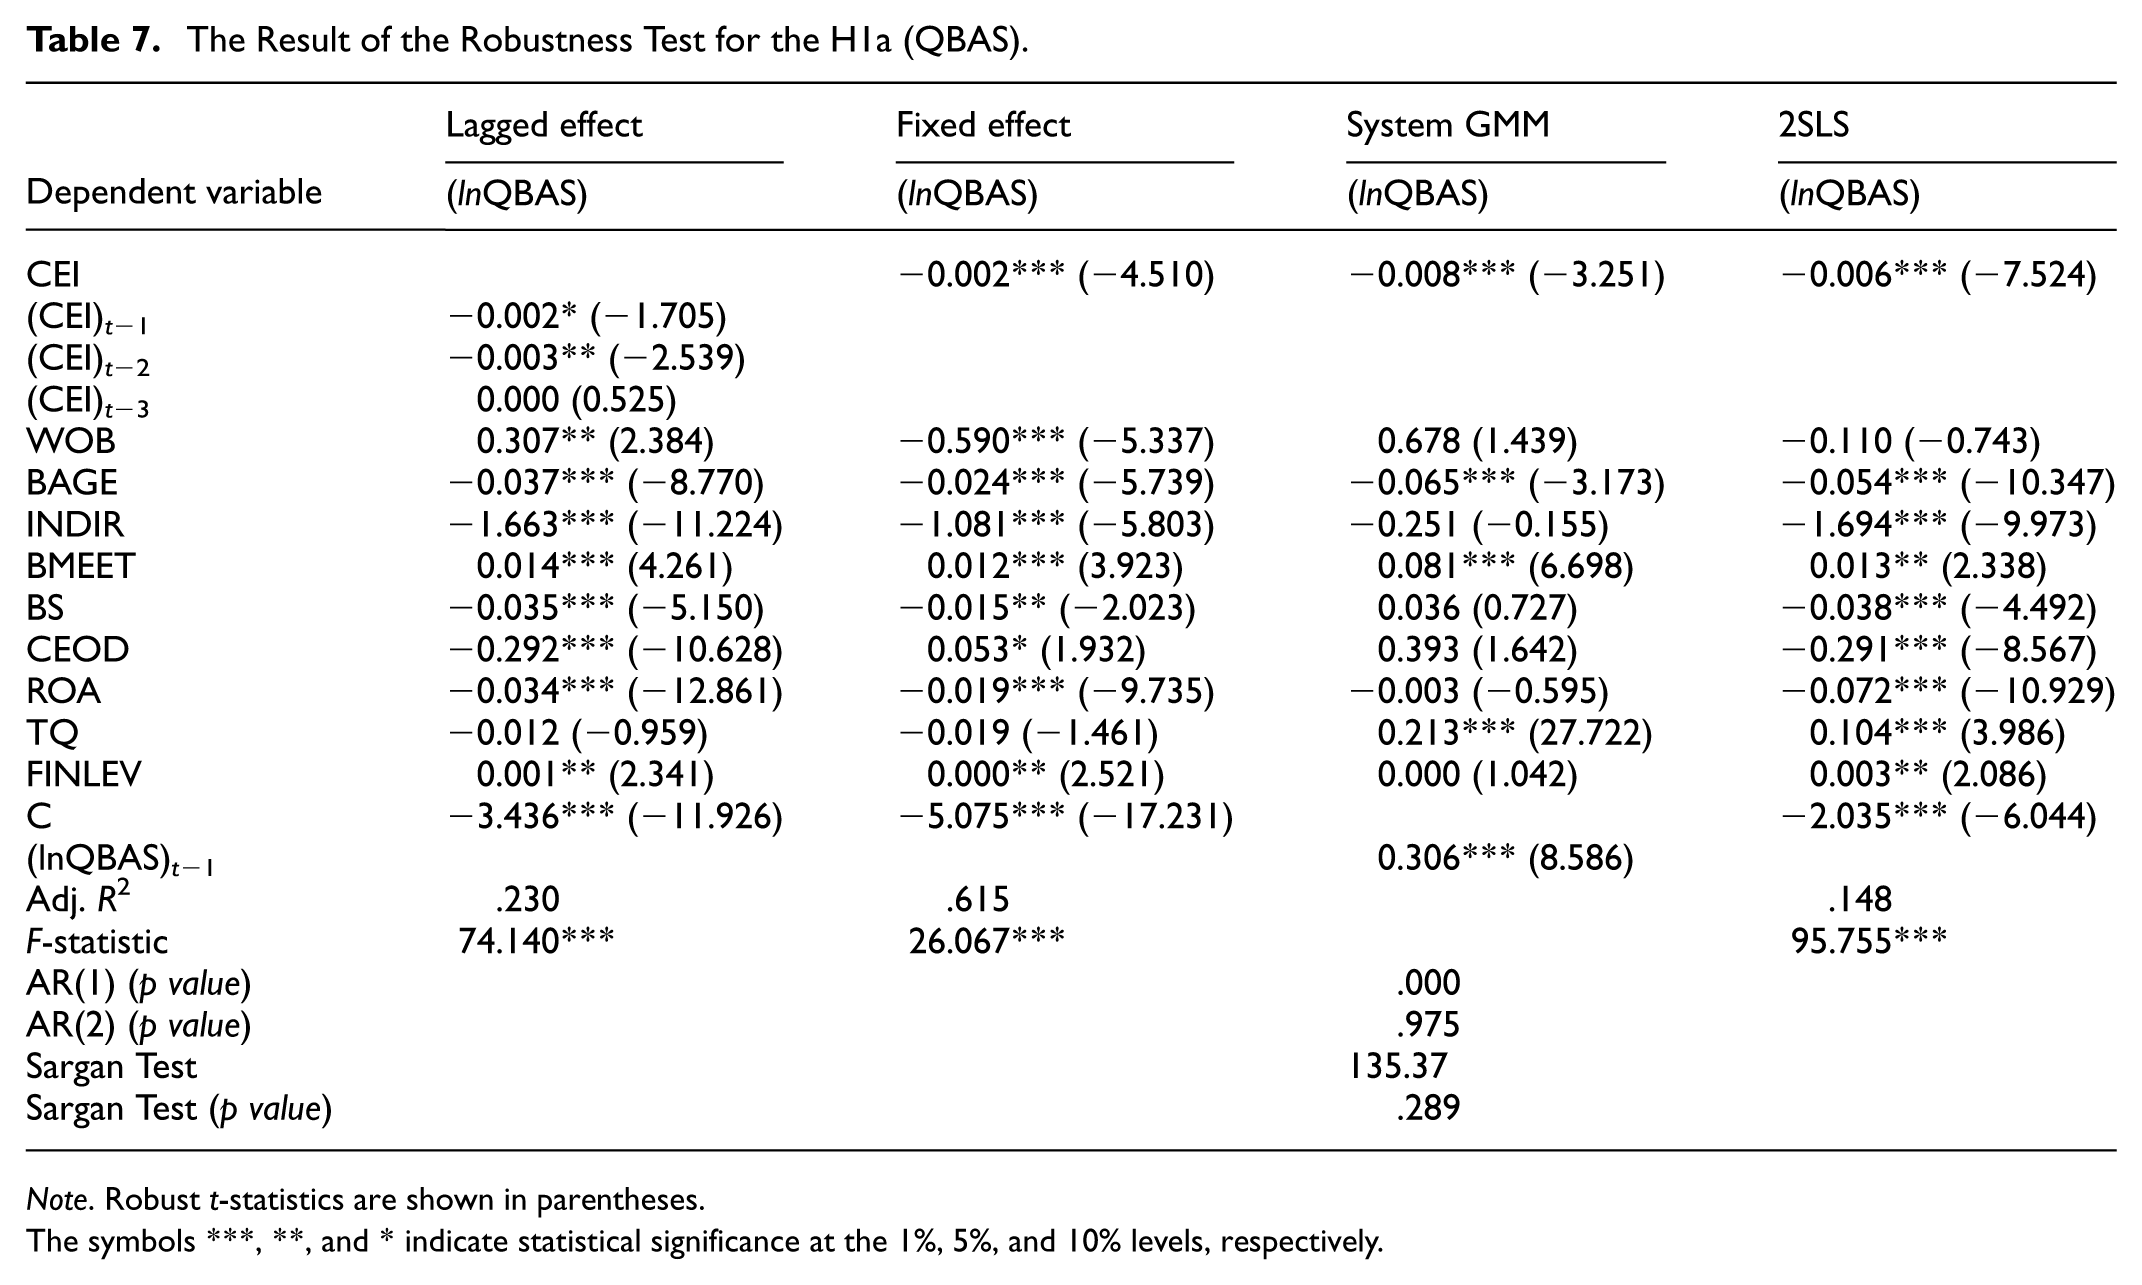
Information asymmetry, corporate governance, and firm performance are inherently dynamic in nature (Arellano & Bond, 1991; Blundell & Bond, 1998; Wintoki et al., 2012). Accordingly, this study first employs a lagged-effect approach to examine how past-period variables affect the current period. By including lagged values of the dependent variable in the model, this method captures persistence effects and allows for a more reliable interpretation of causality (Arellano & Bond, 1991; Wooldridge, 2010). In addition, to prevent unobserved yet time-invariant firm-level differences (e.g., sectoral conditions, corporate culture) from biasing the results, we apply the fixed-effects method. Fixed effects account for unobserved heterogeneity and enhance the reliability of the estimates (Baltagi, 2008; Greene, 2012). To simultaneously address both the dynamic structure and endogeneity concerns, we further employ the System GMM estimator. System GMM combines level and difference equations, producing more consistent and efficient results in short time-span, large-panel datasets (Arellano & Bover, 1995; Blundell & Bond, 1998; Roodman, 2009). However, these approaches alone may not fully resolve potential bidirectional causality between governance variables and information asymmetry. For instance, while more inclusive firms may exhibit greater transparency, firms with higher transparency may also be more inclined to adopt inclusive policies. To address this potential endogeneity, we additionally implement the Two-Stage Least Squares (2SLS) method (Angrist & Pischke, 2009; Gujarati & Porter, 2009; Wooldridge, 2010). Collectively, these four methodological approaches strengthen the robustness of our findings and enhance the credibility of the results. The robustness checks for each IA proxy are presented separately in Tables 7 to 9.
The Result of the Robustness Test for the H1a (QBAS).
Note. Robust t-statistics are shown in parentheses.
The symbols ***, **, and * indicate statistical significance at the 1%, 5%, and 10% levels, respectively.
The Result of the Robustness Test for the H1b (ILLIQ).
Note. Robust t-statistics are shown in parentheses.
The symbols ***, **, and * indicate statistical significance at the 1%, 5%, and 10% levels, respectively.
The Result of the Robustness Test for the H1c (HILO).
Note. Robust t-statistics are shown in parentheses.
The symbols ***, **, and * indicate statistical significance at the 1%, 5%, and 10% levels, respectively.
Table 7 reports robustness tests assessing the stability of the negative association between CEI and information asymmetry as proxied by the bid–ask spread (QBAS). Across alternative estimation methods (lagged effect, fixed effects, System GMM, and 2SLS), CEI coefficients remain consistently negative and statistically significant. Notably, the magnitude of the negative CEI–QBAS association is strongest under the System GMM specification, which is consistent with the possibility that dynamic endogeneity matters in this setting. Overall, these results indicate that the negative CEI–QBAS association is robust across multiple specifications, in line with H1a.
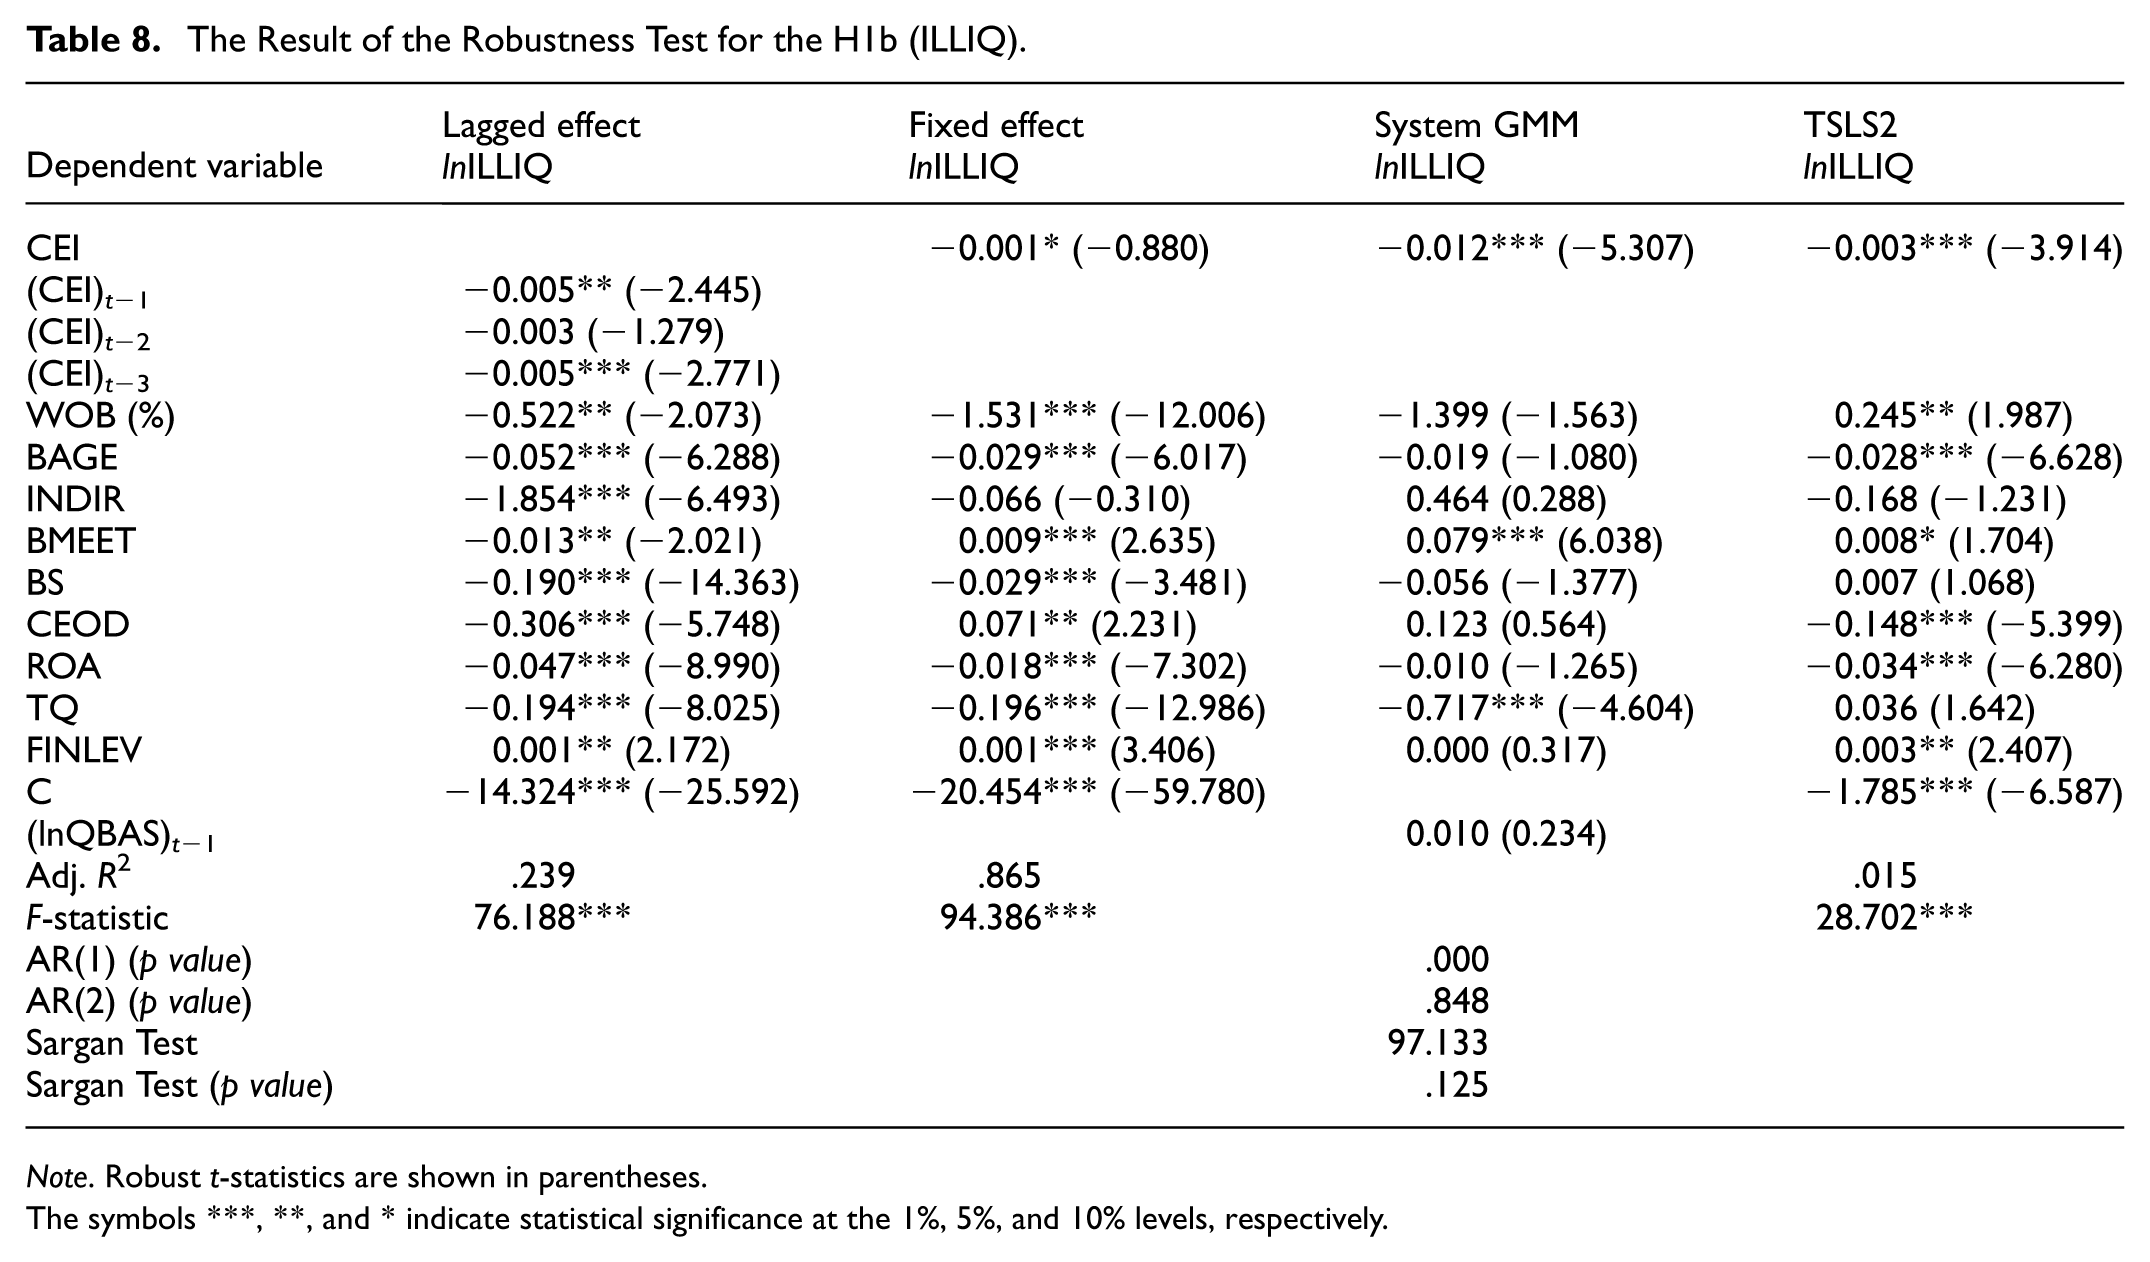
Table 8 presents robustness tests evaluating whether the association between CEI and market liquidity (proxied by illiquidity, ILLIQ) is stable across alternative estimation methods. Estimates obtained through various methods (lagged effect, fixed effects, System GMM, and 2SLS) indicate that the CEI coefficient is generally negative and statistically significant. Overall, the evidence is consistent with a robust negative association between CEI and ILLIQ across specifications, in line with H1b.
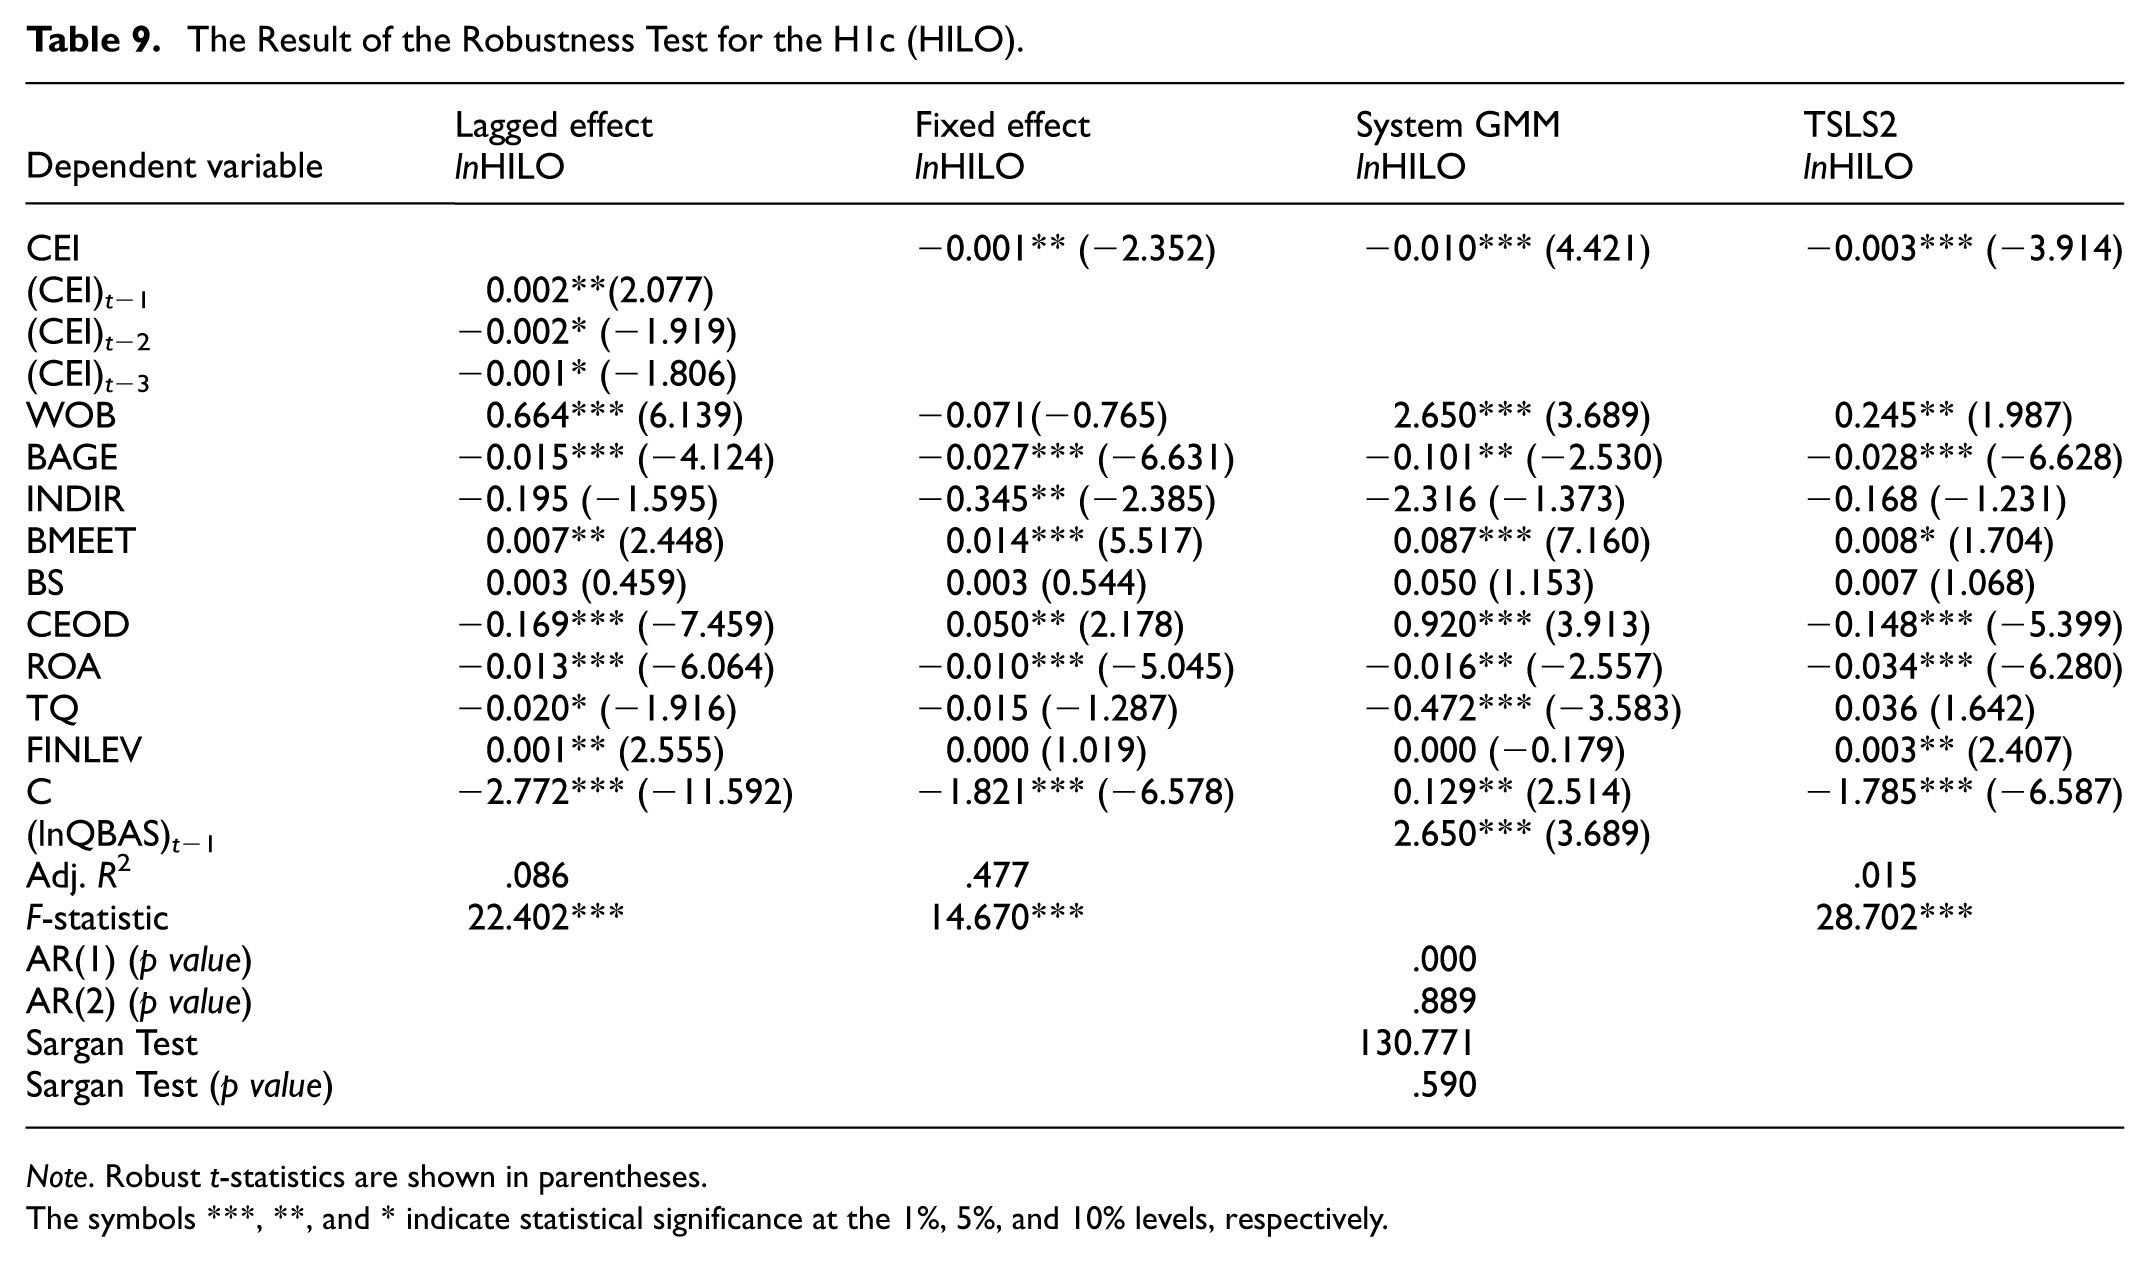
Table 9 reports robustness tests examining whether the association between CEI and price-based uncertainty (HILO) is stable across estimation methods. Results obtained from different methods indicate that the CEI coefficient is negative and statistically significant in most models. In particular, the System GMM and 2SLS specifications yield negative CEI–HILO estimates, consistent with a negative association between CEI and price volatility in the sample. Overall, these findings indicate that the negative CEI–HILO association is robust across specifications, in line with H1c.
Additional Tests
Quantiles Test
Since traditional panel regression methods are limited to estimating average effects, quantile regression analysis (Koenker & Bassett, 1978) was applied to capture the impact of corporate equality policies (CEI) at different points of the dependent variable distributions. As emphasized in the literature, information asymmetry, liquidity, and volatility variables often exhibit asymmetric distributions and are influenced by outliers; therefore, quantile-based analyses provide a more accurate representation of heterogeneous effects across different groups of firms (Ardia et al., 2019).
The results reported in Table 10 indicate that the CEI coefficient is negative and statistically significant across the conditional distributions of QBAS and ILLIQ, with larger absolute effects toward the upper tail (Q75), suggesting that equality policies are most effective where trading frictions and information problems are more severe. For HILO, CEI remains negatively associated with volatility and is statistically significant at the median and upper quantiles (Q50 and Q75), whereas the Q25 estimate is negative but not statistically significant; the HILO coefficients therefore do not show a monotonic strengthening toward Q75. In the spirit of Akerlof’s “market for lemons” intuition, these heterogeneous patterns imply that CEI operates as a governance-and-transparency mechanism that is particularly valuable when adverse-selection concerns and trading frictions are highest, while its volatility-stabilizing effect is concentrated among firms with moderate-to-high volatility. Overall, the quantile results reinforce H1a–H1c, with stronger distributional evidence for H1a–H1b and Q50–Q75 support for H1c.
The Result of the Quantiles Test for QBAS, ILLIQ, and HILO.
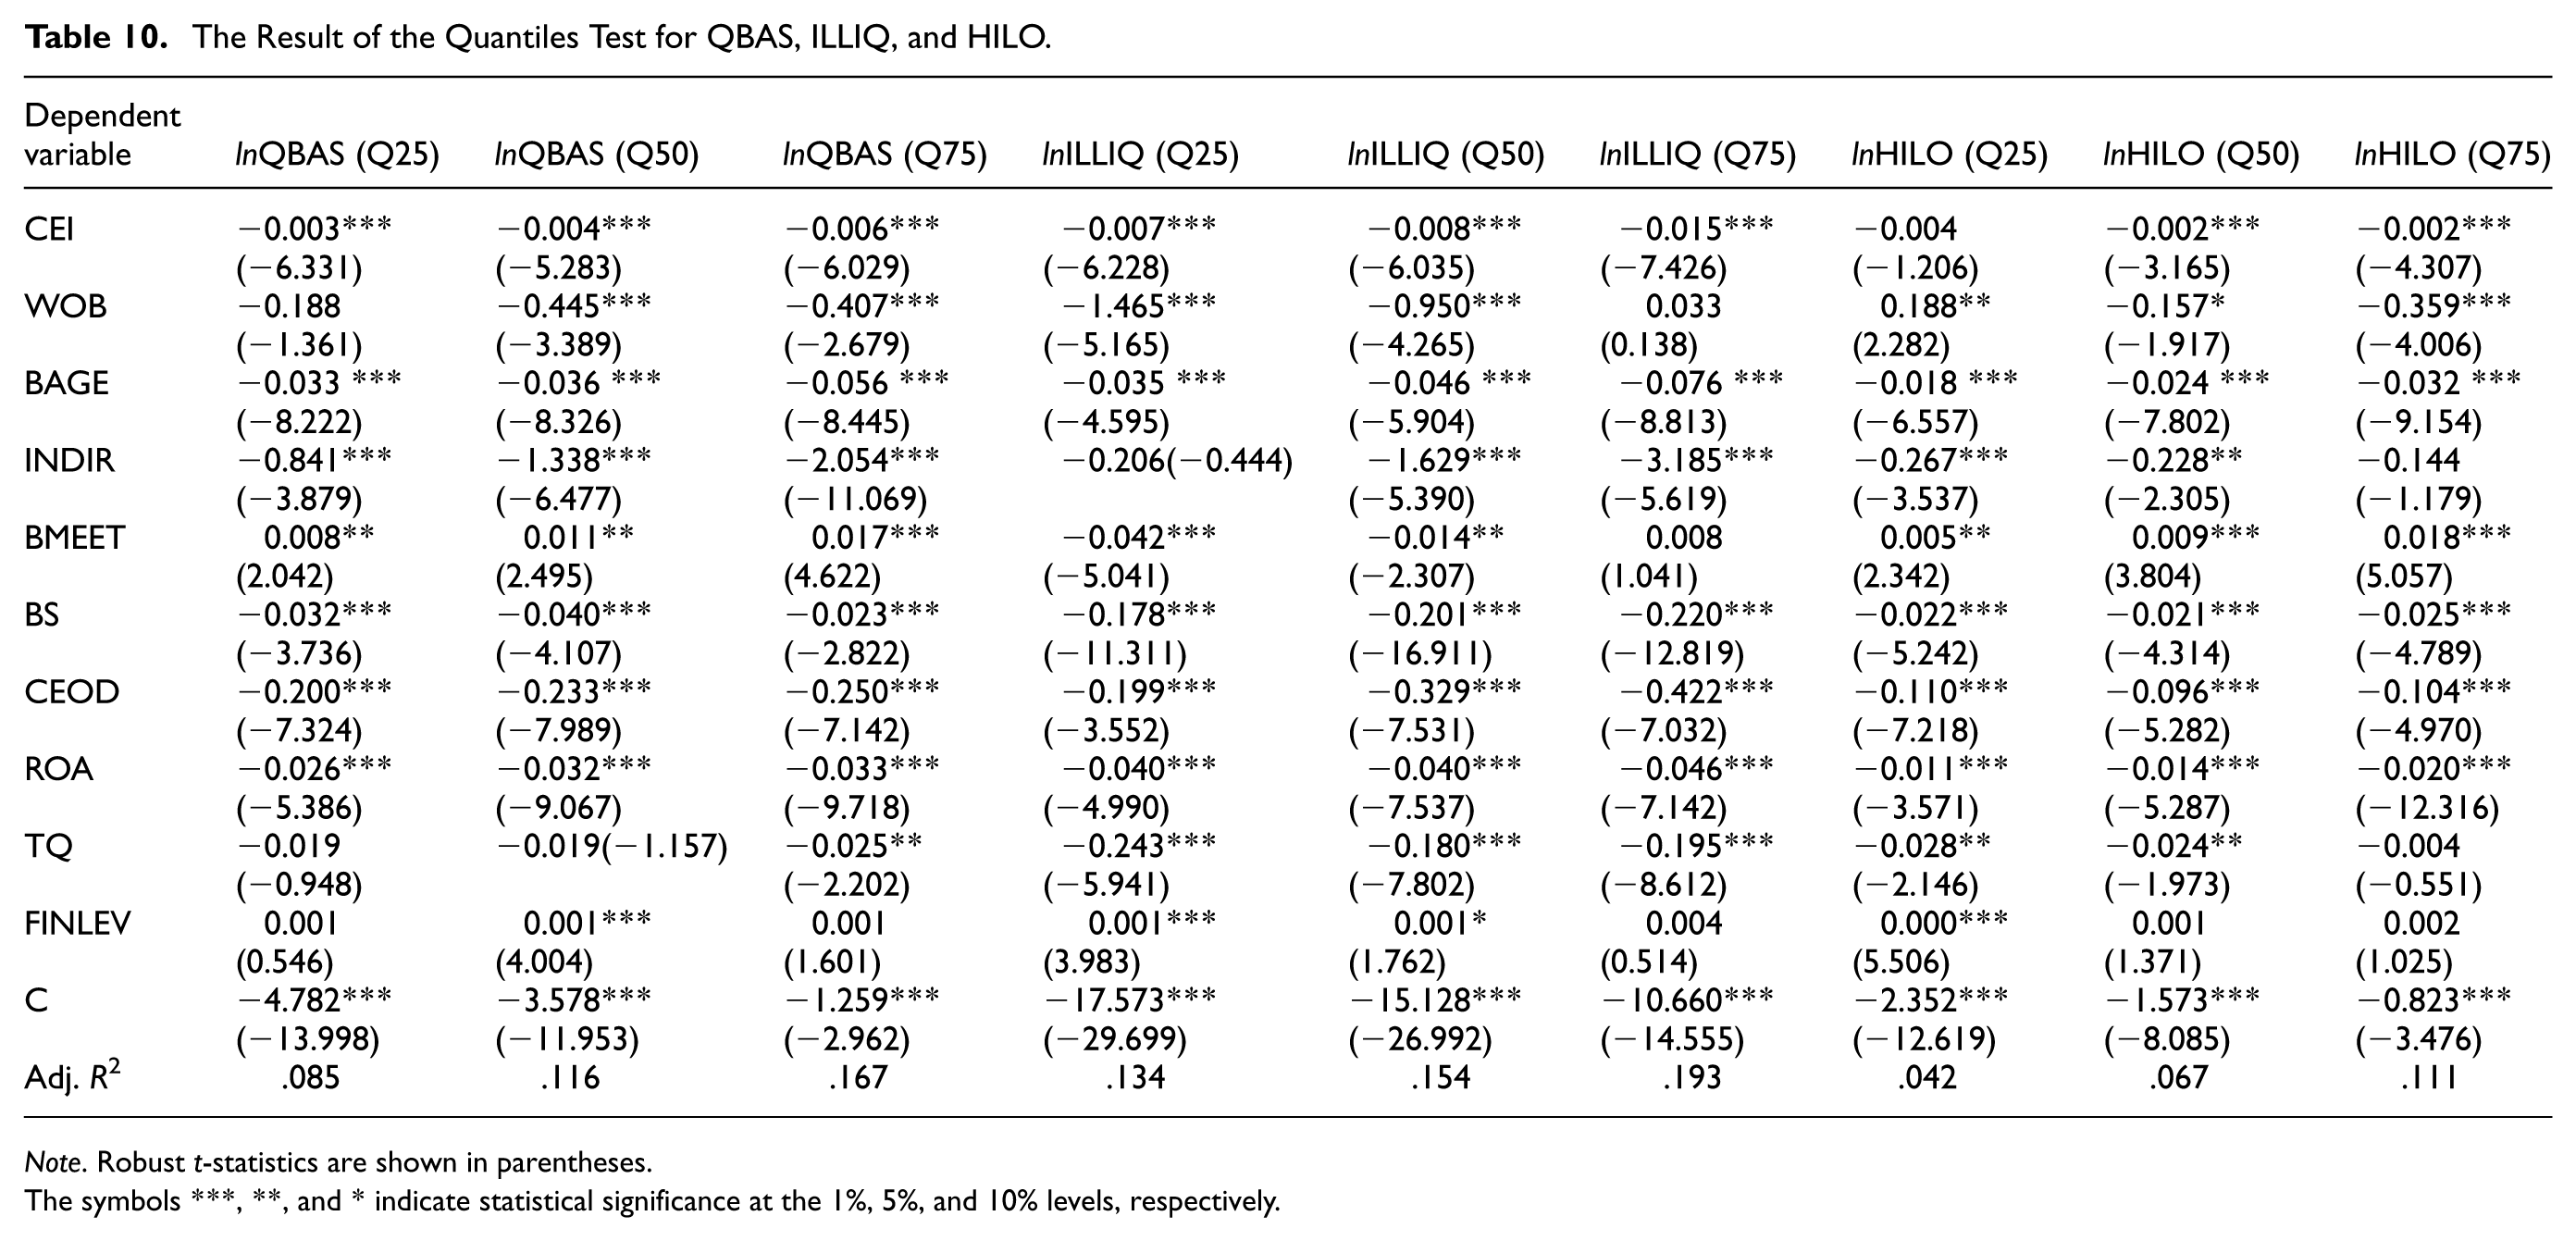
Note. Robust t-statistics are shown in parentheses.
The symbols ***, **, and * indicate statistical significance at the 1%, 5%, and 10% levels, respectively.
Difference-in-Differences (DiD) Analysis
The Difference-in-Differences (DiD) method is one of the most widely used causal analysis techniques for measuring the effects of exogenous policy changes or institutional shocks (Atif et al., 2019; Ben Slama et al., 2019; Genin et al., 2023). DiD strengthens causal inference by comparing the changes in outcomes for a treated group relative to an appropriate control group before and after the shock (Angrist & Pischke, 2009; Goodman-Bacon, 2021). In corporate finance and governance research, it is particularly preferred to examine the effects of regulations, market shocks, or policy reforms on firm behavior (Bertrand et al., 2004).
In this study, the year 2013 is considered an exogenous and normative shock for firms, following the United States Supreme Court’s United States v. Windsor decision and the expansion of CEI criteria. To implement a more rigorous DiD design (beyond a simple pre–post comparison), we explicitly construct treatment and control groups based on firms’ baseline CEI levels prior to 2013. The control group comprises firms with very high pre-2013 CEI scores (top quartile of the average CEI over 2008–2012), which were plausibly less affected by the shock because they had already adopted comprehensive equality practices. The treated group includes the remaining firms (below the pre-2013 top quartile), which had more room—and stronger incentives—to adjust their equality policies after 2013.
We estimate the following canonical DiD specification:
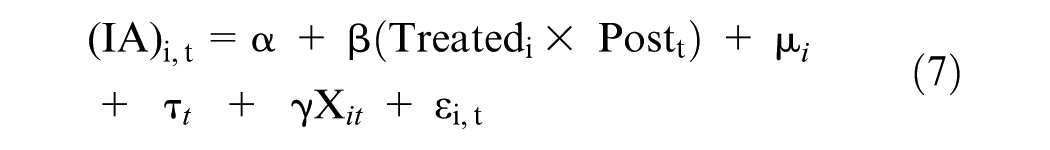
where (IA) it denotes each information asymmetry proxy (lnQBAS, lnILLIQ, or lnHILO), Treated_i is the treatment-group indicator defined above, and Post_t equals 1 for the post-shock period (t ≥ 2013; excluding 2023 due to the CEI data gap) and 0 otherwise. μ i and τ t represent firm and year fixed effects, respectively, and X it is the set of time-varying control variables used throughout the paper. Standard errors are clustered at the firm level. The coefficient β captures the incremental change in information asymmetry for treated firms relative to the high-baseline CEI control group after 2013.
Table 11 reports the estimated coefficient on (Treated i × Post t ) for each proxy. The interaction term is negative and statistically significant across the three models, indicating that firms with lower baseline CEI (i.e., the treated group) experienced larger post-2013 reductions in bid–ask spreads, illiquidity, and price volatility compared to firms that already had very high CEI scores before 2013.
The Result of the Difference-in-Differences (DiD) Test for the QBAS, the ILLIQ, and the HILO.
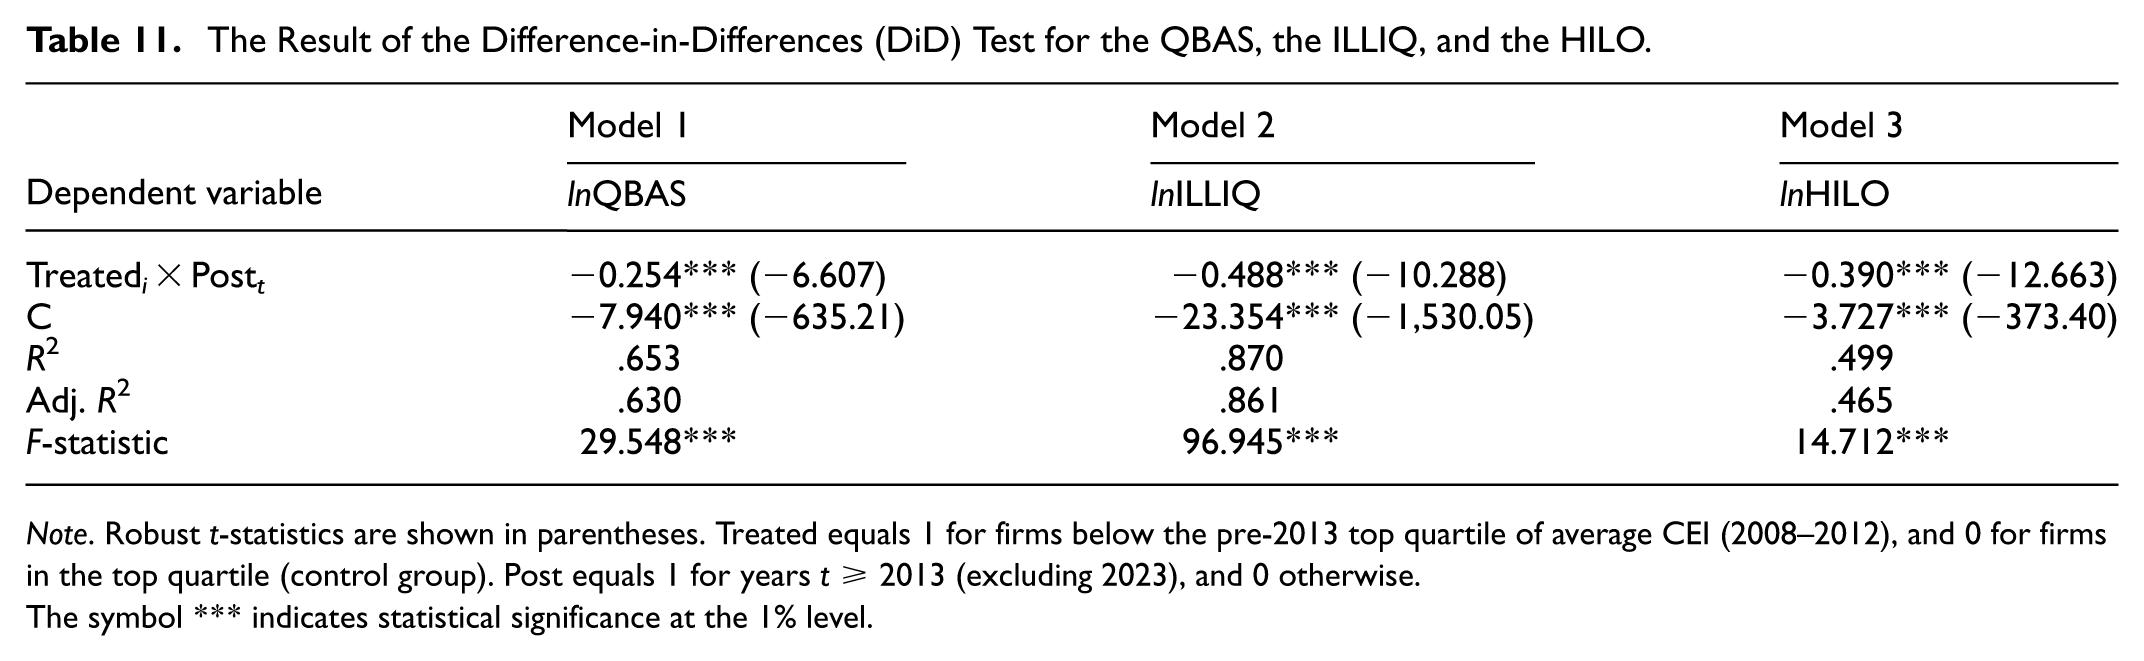
Note. Robust t-statistics are shown in parentheses. Treated equals 1 for firms below the pre-2013 top quartile of average CEI (2008–2012), and 0 for firms in the top quartile (control group). Post equals 1 for years t ≥ 2013 (excluding 2023), and 0 otherwise.
The symbol *** indicates statistical significance at the 1% level.
Conclusion
This article has comprehensively examined the effects of corporate equality policies on information asymmetry. Three different measures of information asymmetry were employed: bid–ask spread (QBAS), illiquidity ratio (ILLIQ), and price volatility (HILO). The empirical results demonstrate that corporate equality policies significantly reduce all three measures. These findings indicate that diversity and inclusion policies are not only a source of social benefit but also a mechanism that enhances transparency and stability in financial markets.
The main finding of this study is that firms with higher CEI scores exhibit lower information asymmetry. This confirms that inclusive policies send credibility signals to the market. Through LGBTQ+ equality policies, firms adopt more transparent reporting and stronger corporate governance practices, which facilitate investors’ access to information. As a result, market participants face lower information risk and transaction costs. Secondly, the impact of CEI scores on QBAS is strong. The negative coefficients indicate that equality policies narrow bid–ask spreads, suggesting that inclusive firms have more liquid stocks and lower transaction costs. Increased liquidity expands the investor base and fosters trust in financial markets, consistent with market microstructure theory. Thirdly, the effect of CEI policies on ILLIQ is significant. Our analyses show that stocks of firms with higher CEI scores display greater liquidity. The negative coefficients for ILLIQ suggest that even small trading volumes lead to smaller price changes, highlighting that inclusive policies improve market depth. This aligns with liquidity theories, which emphasize the role of information transparency in reducing capital costs and improving market efficiency. Fourthly, the effect of CEI on HILO is also statistically significant and negative. Price volatility reflects imbalances in information, and HILO captures relative price volatility by indicating how intensively speculative trading and private information are incorporated into market prices. The fact that higher CEI scores are associated with lower HILO suggests that equality policies help stabilize stock prices by reducing volatility-related uncertainty and deterring information-based speculation. This interpretation is also consistent with behavioral evidence that herding can fuel speculative bubbles and intensify volatility when fundamentals are difficult to assess in opaque information environments (Erol & Dogan, 2024). Overall, this provides a contemporary application of Akerlof’s “market for lemons” intuition: inclusive corporate policies mitigate misinformation-driven investor behavior, making markets more predictable.
Connecting our findings back to theory, the results provide consistent support for the three frameworks motivating the study. First, under Signaling Theory (Spence, 1973), a higher CEI score functions as an externally observable and credible signal of a more transparent information environment; consistent with this mechanism, we observe tighter market microstructure frictions (e.g., narrower bid–ask spreads and lower price-based uncertainty), suggesting reduced adverse-selection concerns. Second, Stakeholder Theory (Freeman, 1984) is supported by the liquidity channel: comprehensive inclusivity practices strengthen trust and legitimacy among a broader set of stakeholders, which can foster a more stable investor base and deeper participation—patterns consistent with the observed improvements in liquidity (lower illiquidity). Third, Agency Theory (Jensen & Meckling, 1976) is validated insofar as inclusive, organization-wide equality systems are associated with outcomes indicative of stronger governance and monitoring, which can curb opportunism and reduce private-information-driven frictions—consistent with lower information asymmetry across the examined proxies. Overall, the evidence suggests that CEI operates simultaneously as a market signal, a stakeholder-governance mechanism, and a complementary monitoring device that improves firms’ information environments.
In terms of empirical contributions, this study fills a gap in the literature. While previous research has examined the relationship between board diversity and information asymmetry, no study has directly tested the impact of corporate equality policies such as CEI. This article is the first to comprehensively demonstrate that CEI exerts strong effects on both transaction costs and market volatility. Additional tests further support these findings. Quantile regression results show that the effect of CEI is strongest in the upper quantiles of the information-asymmetry distribution, indicating that equality policies are most beneficial where they are needed most—among otherwise opaque firms facing more severe adverse-selection (“lemons”) problems. The Difference-in-Differences analysis treats 2013 as an exogenous shock year and strengthens causal inference, showing that firms adopting CEI policies after 2013 experienced significant reductions in all measures of information asymmetry.
The policy implications are equally noteworthy. The findings demonstrate that inclusive policies provide not only social but also financial benefits. These results deliver important messages for regulators and policymakers: promoting corporate equality policies can contribute to more efficient capital markets. For investors, CEI scores offer a strong signal of corporate transparency and may become an important criterion in investment decisions.
Nonetheless, this study has certain limitations. First, the analysis covers only U.S. firms, and it remains uncertain whether the results hold in different institutional contexts. Importantly, our key explanatory variable is the Human Rights Campaign Foundation’s Corporate Equality Index (CEI), which is a U.S.-based rating system; comparable, consistently measured indices may not exist (or may not be directly comparable) across emerging markets. In emerging markets, where information asymmetry is typically higher due to weaker disclosure enforcement and thinner information intermediaries, CEI-like transparency signals and governance improvements could potentially yield even larger marginal benefits. However, differences in legal institutions, governance regimes, cultural norms, and measurement comparability may attenuate or alter these effects, and external validity should therefore be tested with context-appropriate equality-policy measures. Second, the effects of CEI policies may vary over time; future research with longer time-series data should examine dynamic effects. Third, information asymmetry was measured using only market microstructure indicators. Incorporating alternative measures could enhance the robustness of the findings.
Future research could extend this study in several directions. First, conducting similar analyses in different countries would test the influence of institutional contexts. Second, examining the impact of CEI policies on firm valuation and long-term investor behavior would provide deeper insights. Third, exploring the effects of inclusive policies on innovation, employee engagement, and sustainability reporting would broaden understanding. Fourth, analyzing the interactions between CEI and other governance indicators, such as female board representation or board independence, would add further depth.
In conclusion, this study makes significant contributions to the finance literature. It strongly demonstrates that CEI policies reduce information asymmetry, lower transaction costs, and enhance market stability. These findings confirm that inclusive policies deliver not only ethical but also economic benefits. By adopting equality policies, firms can strengthen stakeholder trust and improve financial performance, while investors may treat CEI scores as a reliable signal. For policymakers, the results show that inclusive corporate governance is a tool that promotes transparency and stability in markets.
In this regard, the Corporate Equality Index can be regarded not only as a measure of social justice but also as an indicator of market efficiency and financial sustainability. The findings of this study provide valuable insights for academics, investors, and policymakers alike. Future research can test these results across different contexts, thereby enriching the literature and deepening our understanding of both the social and economic dimensions of corporate equality policies.
Finally, we reiterate our core research hypotheses linking CEI to alternative dimensions of information asymmetry: (H1a) higher CEI is associated with a narrower quoted bid–ask spread (QBAS), (H1b) higher CEI is associated with lower illiquidity (ILLIQ), and (H1c) higher CEI is associated with lower price volatility (HILO). Across our empirical designs (pooled OLS, firm fixed effects, system GMM, 2SLS, quantile regressions, and DiD), the evidence supports these predictions. Accordingly, H1a, H1b, and H1c are supported (accepted).
Recommendations for Policymakers and Practitioners
This study’s findings show that inclusive corporate policies are not only an ethical imperative but also a critical tool that enhances transparency and financial stability in markets. Policymakers should therefore consider integrating CEI-like indices into regulatory frameworks and develop incentives that encourage firms to adopt inclusive policies. Instruments such as tax benefits, mandatory diversity disclosures in reporting standards, or preferential access to capital markets could direct firms toward inclusive governance practices.
For practitioners, it should be noted that policies which increase CEI scores provide tangible benefits not only in terms of social responsibility but also by enhancing investor confidence and reducing the cost of capital. Managers should thus treat equality and inclusion policies as a strategic source of competitive advantage and as a market signal, embedding them into the core of corporate strategies.
Footnotes
Appendix A
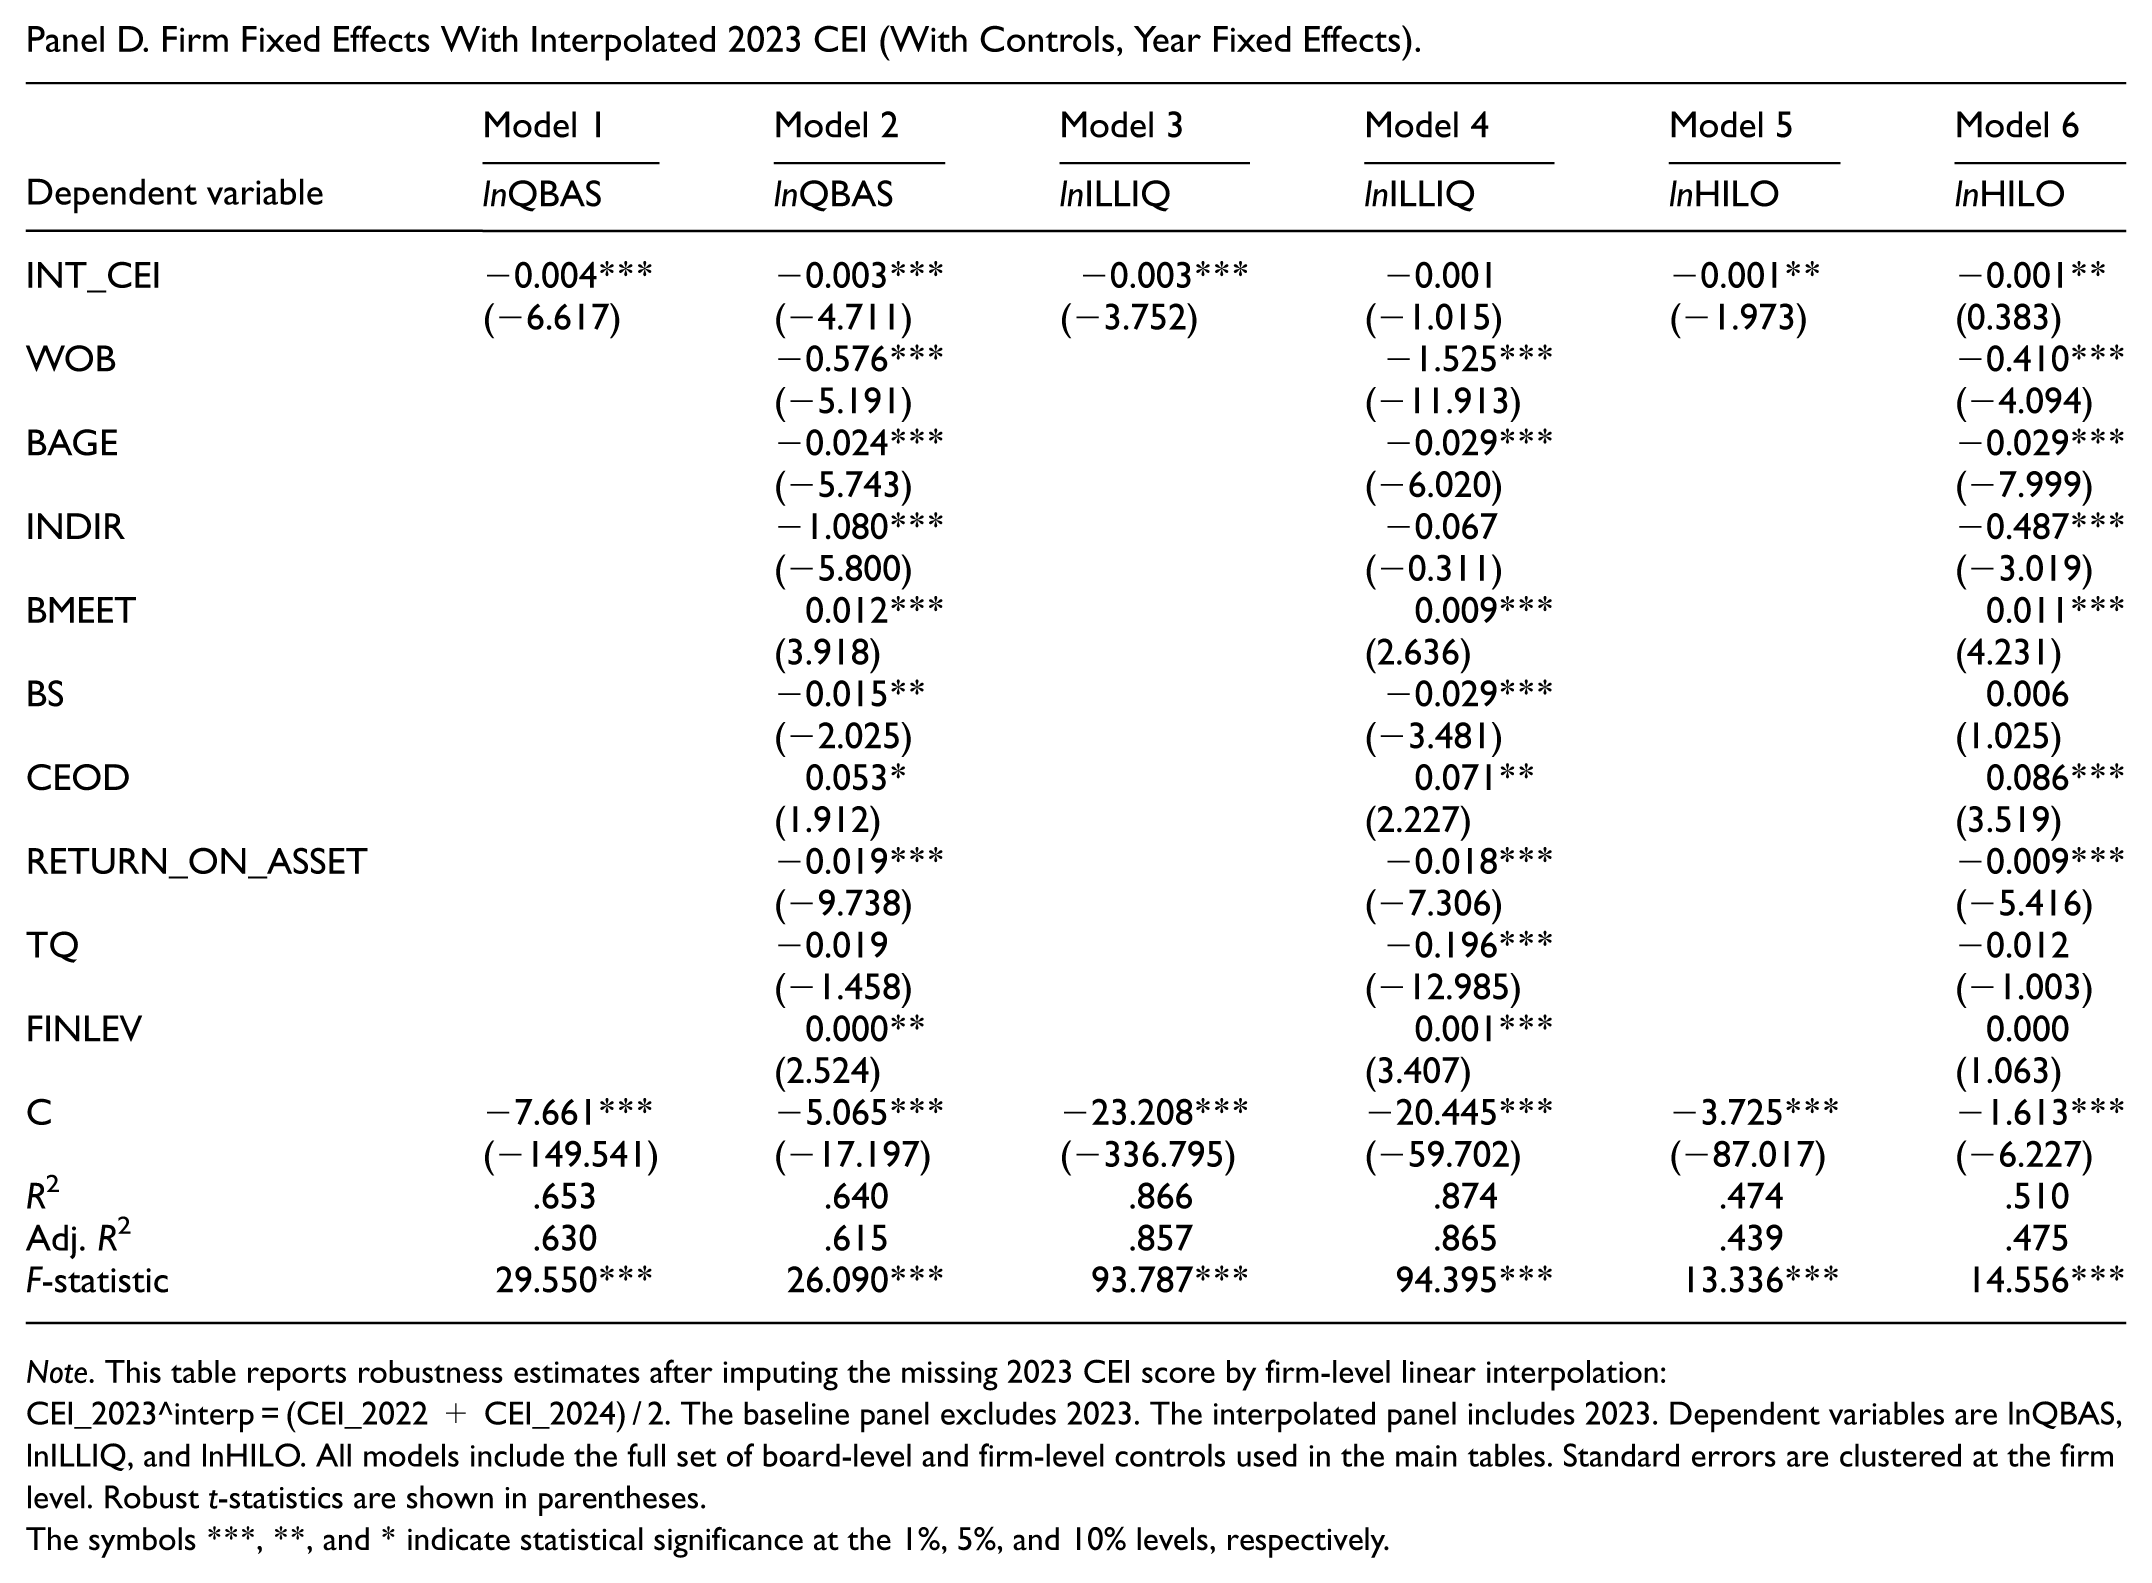
Panel D. Firm Fixed Effects With Interpolated 2023 CEI (With Controls, Year Fixed Effects).
| Dependent variable | Model 1 | Model 2 | Model 3 | Model 4 | Model 5 | Model 6 |
|---|---|---|---|---|---|---|
| lnQBAS | lnQBAS | lnILLIQ | lnILLIQ | lnHILO | lnHILO | |
| INT_CEI | −0.004*** (−6.617) | −0.003*** (−4.711) | −0.003*** (−3.752) | −0.001 (−1.015) | −0.001** (−1.973) | −0.001** (0.383) |
| WOB | −0.576*** (−5.191) | −1.525*** (−11.913) | −0.410*** (−4.094) | |||
| BAGE | −0.024*** (−5.743) | −0.029*** (−6.020) | −0.029*** (−7.999) | |||
| INDIR | −1.080*** (−5.800) | −0.067 (−0.311) | −0.487*** (−3.019) | |||
| BMEET | 0.012*** (3.918) | 0.009*** (2.636) | 0.011*** (4.231) | |||
| BS | −0.015** (−2.025) | −0.029*** (−3.481) | 0.006 (1.025) | |||
| CEOD | 0.053* (1.912) | 0.071** (2.227) | 0.086*** (3.519) | |||
| RETURN_ON_ASSET | −0.019*** (−9.738) | −0.018*** (−7.306) | −0.009*** (−5.416) | |||
| TQ | −0.019 (−1.458) | −0.196*** (−12.985) | −0.012 (−1.003) | |||
| FINLEV | 0.000** (2.524) | 0.001*** (3.407) | 0.000 (1.063) | |||
| C | −7.661*** (−149.541) | −5.065*** (−17.197) | −23.208*** (−336.795) | −20.445*** (−59.702) | −3.725*** (−87.017) | −1.613*** (−6.227) |
| R 2 | .653 | .640 | .866 | .874 | .474 | .510 |
| Adj. R2 | .630 | .615 | .857 | .865 | .439 | .475 |
| F-statistic | 29.550*** | 26.090*** | 93.787*** | 94.395*** | 13.336*** | 14.556*** |
Note. This table reports robustness estimates after imputing the missing 2023 CEI score by firm-level linear interpolation: CEI_2023^interp = (CEI_2022 + CEI_2024) / 2. The baseline panel excludes 2023. The interpolated panel includes 2023. Dependent variables are lnQBAS, lnILLIQ, and lnHILO. All models include the full set of board-level and firm-level controls used in the main tables. Standard errors are clustered at the firm level. Robust t-statistics are shown in parentheses.
The symbols ***, **, and * indicate statistical significance at the 1%, 5%, and 10% levels, respectively.
Ethical Considerations
The researcher ensured full compliance with ethical standards in accordance with the ethical principles of psychologists and the Code of Conduct of the American Psychological Association.
Funding
The author received no financial support for the research, authorship, and/or publication of this article.
Declaration of Conflicting Interests
The author declared no potential conflicts of interest with respect to the research, authorship, and/or publication of this article.
Data Availability Statement
The data that support the findings of this study are available from the corresponding author upon reasonable request.*