






Abstract
This study introduces the Composite Index of Systemic Competitiveness (CISC), a new framework to quantify national competitive potential by the examination of three interdependent pillars: governance efficiency, economic mass, and competitiveness drag. A focus on Saudi Arabia and Egypt from 2020 to 2023, this research examines how institutional performance, economic diversification strategies, and structural constraints affect development pathways in alignment with the United Nations Sustainable Development Goals (SDGs), especially SDG 8 (Decent Work and Economic Growth) and SDG 10 (Reduced Inequalities). Cross-national, quantitative case study is the research design. The CISC combines internationally aggregated measurements of indicators from only 2020 to 2023 for Egypt and KSA from institutions such as the World Bank, IMF, and Transparency International, for example, economic resilience variables, governance norms, non-oil GDP growth, and measures to mitigate inequality. Sensitivity tests ensure index reliability through tests of robustness. As a limitation for the study, data used in the study is a 4 years data for both Egypt and KSA from 2020 to 2023. Saudi Arabia exhibits remarkable CISC developments, fueled by governance reform and economy diversification in line with Vision 2030, speeding up to SDG 8. Conversely, Egypt is hindered by budget constraints, institutional fragility, and persisting inequalities, restraining SDG 10 ambitions. The implications show that balance synergism among macroeconomic policy, institutional responsibility, and distributive policies are essential to unlock sustainable development. The CISC presents a revolutionary way of measuring systemic competitiveness in the form of direct ratio correlation with SDG standards. The instrument provides policymakers with a diagnostic tool that can help them determine reform priorities to reconcile economic growth and social cohesiveness and long-term sustainability. The CISC facilitates the realignment of efforts with systemic competitiveness drivers, allowing evidence-based policy-making for maximizing national development results and global economic positioning. Governments and institutions can utilize this framework to navigate structural risks while following inclusive growth agendas.
Keywords
Introduction
In the current globalized and dynamic economic landscape, nations focus on enhancing their economic resilience, government level, and geopolitical standing to ensure sustainable growth. Traditional competitiveness measures such as the Global Competitiveness Index (GCI; Schwab, 2019), Ease of Doing Business Index (World Bank, 2019), and Corruption Perceptions Index (Transparency International, 2024) have been effective in measuring economic productivity, regulatory efficiency, and integrity. Yet, these instruments have a tendency to examine competitiveness from standalone lenses, without accounting for its systemic and interdependent character (Rodrik, 2013). Competitiveness is not economic performance or business efficiency; it is inextricably linked with institutional resilience, governance arrangements, and geostrategy (Acemoglu & Robinson, 2012; North, 1990). Empirical studies emphasize that countries with open institutions, secure regulatory environments, and sound systems of governance are rewarded with more investment flows, growth through innovation, and long-term stability (Fukuyama, 2013; Kaufmann et al., 2010).
While the governance function as a basis of competitiveness is increasingly acknowledged today, current frameworks do not fully incorporate its multi-dimensional role. They also do not address systemic problems like corruption, inequality, sovereign debt, and institutional weakness that undermine national progress (Collier, 2007; Reinhart & Rogoff, 2010). Argentina and Turkey, for example, with all their economic promise, stagnate due to governance failures and fiscal volatility (Acemoglu et al., 2014). Likewise, resource-rich economies such as Nigeria also suffer from the “resource curse” because institutional vulnerabilities and policy uncertainty constrain development (Collier, 2007).
To complete these gaps, this study proposes the Composite Index of Systemic Competitiveness (CISC), one model of national competitiveness based on three interconnected pillars:
Governance Efficacy (G): Government effectiveness, rule of law, regulatory quality, voice & accountability, and political stability (Kaufmann et al., 2010).
Economic Mass (M): Trade-to-GDP ratio, non-oil GDP growth, GDP-per-capita, and nominal GDP (Rodrik, 2013).
Competitiveness Drag (C): Corruption Perception Index, debt-to-GDP ratio, and fragile state index (Reinhart & Rogoff, 2010; World Bank, 2024).
Inspired by the Schwarzschild-radius analogy, the Composite Index of Systemic Competitiveness (CISC) defines competitiveness as a function of a system’s “mass,” which includes economic mass (M) and governance efficacy (G), compared to the “drag” forces that undermine it (C). The squared drag term is seen as a guide rather than a strict physical law. Systemic frictions often create non-linear effects, meaning that small increases in corruption, weak institutions, or high debt can lead to much larger losses in competitiveness (Acemoglu & Robinson, 2012; Rodrik, 2008). Non-linear penalty structures are commonly used in creating composite indices to show these imbalances (Nardo et al., 2005). Thus, the CISC is presented here as a tentative diagnostic:

This formula highlights the increased, opposite effect of structural drag on systemic competitiveness. It positions the index as a tool driven by policy that combines economic and institutional factors without favoring economic indicators over governance and structural challenges.
The CISC framework is applied to Saudi Arabia and Egypt using global indicators from 2020 to 2023. It assesses how governance effectiveness and structural limitations together influence competitiveness paths. Saudi Arabia’s institutional and economic reforms under Vision 2030 differ sharply from Egypt’s decline due to rising debt and weak institutions. This comparison sheds light on the relationship between growth drivers and systemic risks. The index’s components align with international policy objectives: Economic Mass (M) indicators, like non-oil GDP growth, connect to SDG 8 (Decent Work and Economic Growth). Governance Efficacy (G) and Competitiveness Drag (C) measures, such as corruption perceptions and debt-to-GDP ratios, relate to SDG 10 (Reduced Inequalities) by highlighting institutional and fiscal gaps.
Traditional competitiveness indices often focus on productive drivers like technology, infrastructure, and innovation, while neglecting structural weaknesses such as income inequality, government debt, and fragile institutions, which can undo economic progress (Reinhart & Rogoff, 2010). Real-world examples show this limitation. Argentina and Turkey suffer from long-term stagnation tied to governance failures, fiscal mismanagement, and financial instability, despite having economic potential (Acemoglu et al., 2014). Resource-rich Nigeria illustrates how weak institutions can hinder natural resources from leading to widespread prosperity (Collier, 2007). These cases suggest that partial economic reforms are not enough when systemic barriers remain.
Furthermore, traditional indices often fail to accurately assess governance such as the rule of law, accountability, and institutional performance in shaping competitiveness. The Global Competitiveness Index (GCI), for instance, emphasizes innovation but does not fully reflect how weak legal systems or unclear regulations can deter foreign direct investment and entrepreneurship (Porter, 1990). By incorporating institutional quality as a primary factor, the CISC clarifies how governance builds investor trust, lowers transaction costs, and enhances public sector performance (Fukuyama, 2013; Kaufmann et al., 2010; Kaufmann & Kraay, 2024). Regions with strong legal frameworks, like Denmark, tend to attract more foreign investment (La Porta et al., 1998). Therefore, the CISC brings together governance, economic capacity, and structural challenges into a single, policy-focused framework that connects institutional and economic analysis while stressing the importance of reform.
Debate surrounding composite competitiveness indices is ongoing. Supporters of these indices argue that combining different measures reveals systemic links that are valuable for policymakers and investors (Porter, 1990; Schwab, 2019). Critics argue that merging non-comparable variables can hide causal relationships and create misleading rankings (Lall, 2001; Saisana & Saltelli, 2011). Some perspectives prioritize structural change and innovation dynamics over composite scores (Aiginger, 2006). Evidence is mixed: while studies often connect good governance with competitiveness (Kaufmann et al., 2010), some fast-growing economies succeed despite low institutional scores, showing that there are various paths to competitiveness (Rodrik, 2008). Similarly, while fiscal vulnerability is typically seen as a systemic drag, examples exist where high short-term debt matches growth under specific policy conditions (Reinhart & Rogoff, 2010). These varying results suggest that systemic competitiveness cannot be explained by one theoretical framework.
Within this complex landscape, the CISC is proposed as an exploratory, policy-driven tool rather than a decisive solution to theoretical debates. It provides a clear, testable way to combine governance, economic mass, and drag forces into one diagnostic tool while remaining methodologically careful. Future research should focus on testing the CISC’s reliability, trying out different functional forms, and examining it across more countries to see if its three-pillar structure supports or contradicts other views.
Literature Review
Composite Index of Systemic Competitiveness (CISC) Buidling: Main Variables and Sub-Variables
The CISC is theory-driven: Governance Efficacy (G) and Economic Mass (M) are treated as complementary enablers, while Competitiveness Drag (C) operationalizes systemic constraints that reduce the effectiveness of those enablers. The multiplicative aggregation of G and M captures theoretical complementarity (i.e., governance conditions the returns to economic scale) as discussed in institutional and development literature (Acemoglu & Robinson, 2012; Rodrik, 2007). Placing C in the denominator operationalizes the dilutive effect of structural drags on effective competitiveness.
Governance Efficacy
Governance Efficacy is a complex concept at the frontier of institutional performance and collective well-being measurement. This report synthesizes earlier studies into its five constitutive elements: Rule of Law, Voice & Accountability, Political Stability & Absence of Violence, Regulatory Quality, and Government Effectiveness.
Governance Efficacy is measured through five related variables Rule of Law, Voice & Accountability, Political Stability & Absence of Violence, Regulatory Quality, and Government Effectiveness because they all manifest the institutional, participatory, and operational needs for effective governance (Fukuyama, 2013). Rule of Law sets up justice and predictability in legal institutions by preventing corruption and forging institutional trust (Kaufmann et al., 2010; North, 1990; Thamrin et al., 2024). Voice & Accountability facilitates citizen participation to ensure government openness for the sake of democratic legitimacy (Bloom, 2024; Dahl, 1971; Sen, 1999). Political Stability prevents development halts instigated by conflict or instability, allowing long-term planning (Fearon & Laitin, 2003). Regulatory Quality balances social welfare and market efficiency, stimulating innovation without system breakdowns (Djankov et al., 2002). Finally, Government Effectiveness summarizes bureaucratic ability to implement policies and provide public services effectively (Rauch & Evans, 2000). These variables exhibit interdependence: accountability mechanisms strengthen stability, for example, while competent institutions reinforce legal frameworks. Collectively, they address governance complexity by unifying legal, political, and operational facets, ensuring systems remain adaptive, equitable, and conducive to sustained societal progress (Fukuyama, 2013; Grindle, 2004).
Rule of Law
The rule of law mandates the consistent application of legal frameworks, cultivating institutional trust and diminishing discretionary power in governance (Thamrin et al., 2024). Kaufmann and Kraay (2024) underscore its significance in mitigating corruption and advancing economic progress, as evidenced by the World Bank’s Worldwide Governance Indicators (WGI). North (1990) posits that institutions anchoring the rule of law are critical for sustained economic expansion, as they lower transactional barriers and stimulate investment incentives. Empirical analyses, including those by the World Justice Project (2021), demonstrate linkages between resilient legal architectures and elevated societal trust. Nevertheless, obstacles endure in developing economies, where informal governance mechanisms frequently supersede formal legal systems (Helmke & Levitsky, 2004; Thamrin et al., 2024).
Voice & Accountability
Voice and accountability is the extent to which citizens participate in governance and keep leaders responsible. Bloom (2024) noted that democratic accountability is crucial for legitimizing authority, while Sen (1999) relates participatory governance to equitable development outcomes. Kaufmann and Kraay (2024) measure this dimension through public engagement in elections and civil liberties. Norris (2012) identifies a “democratic deficit” in nations where marginalized groups lack representation, exacerbating inequality. Recent studies stress the role of digital platforms in amplifying citizen voices, though they also warn of misinformation risks (Bloom, 2024; Bovaird & Löffler, 2009).
Political Stability & Absence of Violence
Political stability minimizes disruptions caused by conflicts, fostering environments conducive to growth (Özbozkurt & Satrovic, 2024). Fearon and Laitin (2003) attribute instability to weak institutions and economic disparities, while Collier (2007) underscores its devastating economic impacts, particularly in resource-dependent regions. Kaufmann and Kraay (2024) link stability to investor confidence and social cohesion. Acemoglu and Robinson (2012) argue that extractive institutions heighten risks of violence, whereas inclusive systems promote resilience. Helmke and Levitsky (2004) and Feng (2001) emphasize the cyclical relationship between governance quality and conflict prevention.
Regulatory Quality
Effective regulation balances public welfare with economic freedom (Handoyo & Anas, 2024). Djankov et al. (2002) demonstrate that overly burdensome regulations stifle entrepreneurship, whereas streamlined frameworks enhance competitiveness. The World Bank’s Doing Business Report (2020) highlights regulatory quality as a determinant of foreign investment. La Porta et al. (1998) link legal origins to regulatory outcomes, noting common law systems’ adaptability. Stigler’s (1971) theory of regulatory capture warns of industry dominance in policy-making, advocating for transparent oversight mechanisms (Handoyo & Anas, 2024).
Government Effectiveness
Government effectiveness pertains to the capacity to implement policies and deliver public services (Handoyo & Anas, 2024). Kaufmann and Kraay (2024) associate it with meritocratic bureaucracies and efficient resource allocation. Rauch and Evans (2000) find that professionalized civil services improve outcomes, while Handoyo and Anas (2024) stresse the need for state capacity to address complex challenges like climate change. Tanzi and Schuknecht (2000) persuasively, argue, that until the 1960s the rise in spending seems to have brought a big increase in public welfare. Rotberg (2014) notes that ineffective governments in developing nations struggle with legitimacy, perpetuating cycles of underdevelopment.
Economic Mass (M)
Economic Mass (M) serves as a composite indicator of a nation’s economic scale, diversification, and integration into global markets. This review examines the four constituent variables Nominal GDP, Non-Oil GDP Growth, GDP per Capita, and Trade-to-GDP Ratio and their collective role in shaping Economic Mass, emphasizing their interdependencies and relevance to macroeconomic resilience.
Nominal GDP
Nominal GDP quantifies the total monetary value of goods and services produced within a country, reflecting its economic size (Nduokafor et al, 2024). Barro (1997) identifies GDP as a critical determinant of national influence, enabling investments in infrastructure, education, and innovation. However, nominal GDP can also conceal structural imbalance, such as over-reliance on boom-bust industries (Rodrik, 2007). Resource-based economies, such as Nigeria, have high nominal GDP but remain vulnerable to commodity price shocks (Sachs & Warner, 2001; Nduokafor et al, 2024). The World Bank (2022) points to the application of GDP in cross-country comparison but cautions against the omission of purchasing power parity (PPP) adjustments in welfare measurement.
Non-Oil GDP Growth
Growth of non-oil GDP is a measure of economic growth excluding earnings from oil sector, indicating growth in diversification efforts. Sachs and Warner (2001) link over dependence on oil to the “resource curse,” in which non-oil sectors are affected by impacts attributed to Dutch disease. Conversely, nations like Norway have invested in the development of renewable energy and technology advancement using earnings from oil, such that long-term economic stability exists (Mehlum et al., 2006; Nduokafor et al., 2024).
GDP per Capita
Per capita GDP reflects average incomes and living standards approximating economic well-being (Afonso & Blanco-Arana, 2024). Acemoglu and Robinson (2012) relate greater per GDP per capita to inclusive institutions that promote human accumulation of capital. Kuznets (1955) cautions that greater per capita GDP may create inequality because growth might happen in elite or urban economies only. A critique by the OECD (2021), points out its inability to quantify non-monetary values such as environmental sustainability or work-life balance, therefore, the need for complementary indicators like the Human Development Index (Afonso & Blanco-Arana, 2024).
Trade-to-GDP Ratio
Trade-to-GDP ratio captures and measures a nation’s openness to global markets, indicating integration into international supply chains (Yaqub et al, 2024). Frankel and Romer (1999) explain that higher trade ratios correlate with faster growth, driven by technology transfer and competitive pressures. However, excessive reliance on trade exposes economies to external shocks, as seen during the 2008 financial crisis and COVID-19 pandemic (Baldwin & Tomiura, 2020; Yaqub et al, 2024). Rodrik (2011) advocates for fair trade policies placing emphasis on native industrial capacity to offset vulnerabilities.
Economic Mass (M) integrates these measures to reflect a complete picture of economic size, stability, and sustainability. Growth in non-oil GDP is a minimum measure of economic size, and nominal GDP is also used to reflect possible diversification opportunity, reducing vulnerability to sectoral shocks (Hausmann et al., 2008). GDP per capita puts economic growth into a welfare context to ensure growth translates into benefits to society (Stiglitz et al., 2009). The trade-to-GDP ratio, on the other hand, measures international integration, which is sensitive to growth opportunities but requires strong domestic institutions to counter concomitant risks (Rodrik, 2007; Yaqub et al., 2024). As a whole, these indicators harness quantitative scale and qualitative resilience in economic development, allowing policymakers to balance system robustness and economic growth.
Competitiveness Drag (C)
Competitiveness Drag (C) refers to institutional obstacles that limit the productivity, development potential, and market positioning of a country in the international economy. This research assesses three indicators Corruption Perceptions Index (CPI), Debt-to-GDP Ratio, and Fragile States Index (FSI) as drivers of prime importance for the calculation of Competitiveness Drag, highlighting their interdependence dynamics and significance to sustainable development. These indicators together specify structural weaknesses, including governance shortcomings, fiscal disequilibrium, and institutional fragility, that limit competitiveness by skewing the distribution of resources, discouraging investment, and exposing systemic risk.
Corruption Perceptions Index (CPI)
Annual CPI scores by Transparency International, captures perceived public sector corruption which erodes institutional trust and economic efficiency. Corruption increases transaction costs, deters foreign investment, and distorts resource allocation (Mauro, 1995; Shleifer & Vishny, 1993). For instance, nations with low CPI scores, such as Venezuela, face capital flight and stagnated productivity (Index, 2022). Conversely, countries like Denmark, with high CPI scores, benefit from transparent governance, fostering innovation and investor confidence (Søreide, 2014). However, critics argue that the CPI’s reliance on expert surveys may overlook grassroots realities (Heywood & Rose, 2014).
Debt-to-GDP Ratio
The Debt-to-GDP Ratio reflects fiscal sustainability, with elevated levels signaling macroeconomic vulnerability (Yovchev et al, 2024). Reinhart and Rogoff (2010) identify a threshold (90% of GDP) beyond which debt stifles growth by crowding out public investment and increasing borrowing costs. For example, Greece’s debt crisis (180% of GDP in 2018) led to austerity measures, reduced social spending, and prolonged recession (IMF, 2022). However, moderate debt can stimulate growth if channeled into productive infrastructure (Eberhardt & Presbitero, 2015). The ratio’s impact also depends on debt structure foreign-denominated debt poses higher risks than domestic borrowing (Cecchetti et al., 2011; Panizza et al., 2009).
Fragile States Index (FSI)
The FSI, developed by the Fund for Peace, assesses state fragility across 12 indicators, including security, governance, and economic pressures. Fragile states, such as Somalia or Yemen, exhibit weak institutions, civil unrest, and poor service delivery, deterring investment and destabilizing markets (Fund for Peace, 2023). Fearon and Laitin (2003) link state fragility to prolonged conflict, which destroys infrastructure and human capital. Even moderately fragile states, like Pakistan, face challenges in attracting FDI due to perceived instability (Collier, 2007). The FSI also highlights spillover effects, such as refugee crises, which strain neighboring economies (Ghobarah et al., 2004).
The interdependencies of those variables amplify Competitiveness Drag. For example, corruption (low CPI) often exacerbates inequality by enabling elite capture of resources (You, 2015), while fragile states (high FSI) struggle to manage debt (Panizza et al., 2009). Similarly, austerity measures to reduce debt can deepen inequality, fueling instability (Stiglitz, 2012). Together, these variables provide a holistic framework to diagnose and address systemic barriers to competitiveness.
Methodology
Research Type and Scope
This study is an applied research with an explanatory design, aiming to test the CISC framework’s utility in diagnosing systemic competitiveness. It employs a comparative case study approach, focusing on Saudi Arabia and Egypt to contrast policy environments and institutional capacities. By integrating quantitative data analysis with theoretical frameworks from economics (Rodrik, 2013) and governance (Kaufmann et al., 2010) the research bridges disciplinary gaps in competitiveness measurement. The methodology emphasizes reproducibility, enabling future applications of the CISC model to other nations or regions. Of course generalizing the results will require applying the CISC to additional countries in future studies (Hausmann et al., 2005; Rodrik, 2007). While a two-country sample is limited in scope, this choice follows established practice in comparative case-study research (Gerring, 2007), where in-depth analysis of a few cases can yield robust insights.
This research adopts a quantitative, applied approach to construct and analyze the Composite Index of Systemic Competitiveness (CISC), combining comparative case study design with time-series data analysis. The methodology is structured into four sequential phases: data collection, normalization, index formulation, and analytical testing.
Data, Data Collection, and Variable Selection
Each sub-indicator maps to a specific, theoretically supported channel affecting systemic competitiveness: WGI governance dimensions (rule of law, voice & accountability, political stability, regulatory quality, government effectiveness) capture institutional enablers (Kaufmann et al., 2010); Nominal GDP, GDP per capita, non-oil GDP growth and trade/GDP capture economic mass and diversification capacity (Hausmann et al., 2005; Rodrik, 2013); CPI, Debt/GDP and Fragile States Index capture corruption, fiscal vulnerability and state fragility that empirically reduce growth potential (Collier, 2007; Mauro, 1995; Reinhart & Rogoff, 2010).
The study utilizes secondary data from 2020 to 2023 for Saudi Arabia and Egypt, sourced from internationally recognized institutions to ensure validity:
Governance Efficacy (G): Sub-variables (Rule of Law, Voice & Accountability, Political Stability, Regulatory Quality, Government Effectiveness) are drawn from the World Bank’s Worldwide Governance Indicators (Kaufmann et al., 2010).
Economic Mass (M): Metrics include Nominal, GDP per Capita and Trade-to-GDP Ratio were collected from World Bank for all variables. Only Non-Oil GDP Growth was collected from Federal Reserve Bank of St. Louis for Egypt and from Trading Economics for Saudi Arabia.
Competitiveness Drag (C): Includes Corruption Perceptions Index (Transparency International, 2024), Debt-to-GDP Ratio (World Economics), Fragile States Index (Fund for Peace).
A 4 Years Data for KSA & Egypt (2020–2023) was collected from different well-known sources as illustrated in the following tables below to cover the needed data for each variable included in the research. This corresponds with both data availability and coverage. First, part of the indicators utilized in the construction of the CISC pillars (particularly non-oil GDP growth, adjusted Fragile States Index scores, and harmonized trade-to-GDP ratios) only become available on a regular basis for Egypt and Saudi Arabia starting from the year 2020 and thus limit the possible analysis starting point. Second, the 2020 to 2023 period is relevant to study: it is the period of the COVID-19 shock and initial recovery period when governance effectiveness, macroeconomic resilience, and competitiveness drags were subjected to unprecedented stress. Targeting this period thus imposes a close challenge to the capacity of the CISC framework to identify real-time systemic tensions. Although a longer time series would be preferable, during the first application the interval of 2020 to 2023 is a good balance between completeness of data and usefulness for analysis. Future research may be expanded to pre-2020 years as backfilling and harmonization of the concerned indicators become feasible
Egypt Data Tables
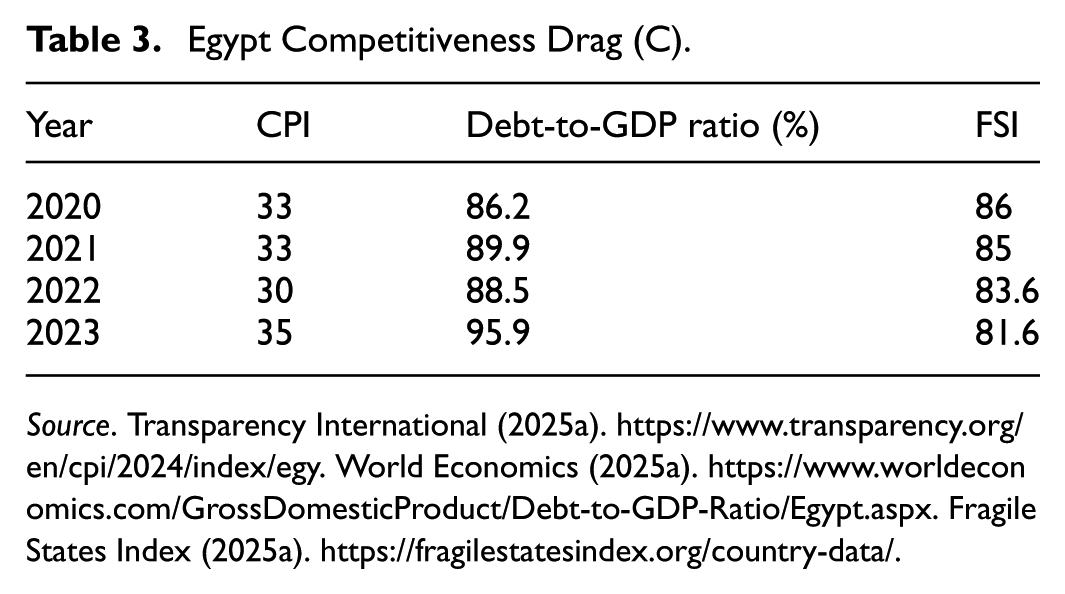
The following is the data of the main variables for Egypt Governance Effectiveness for 4 years indicators, along with the sources of the data (Tables 1–6).
Egypt Governance Efficacy.
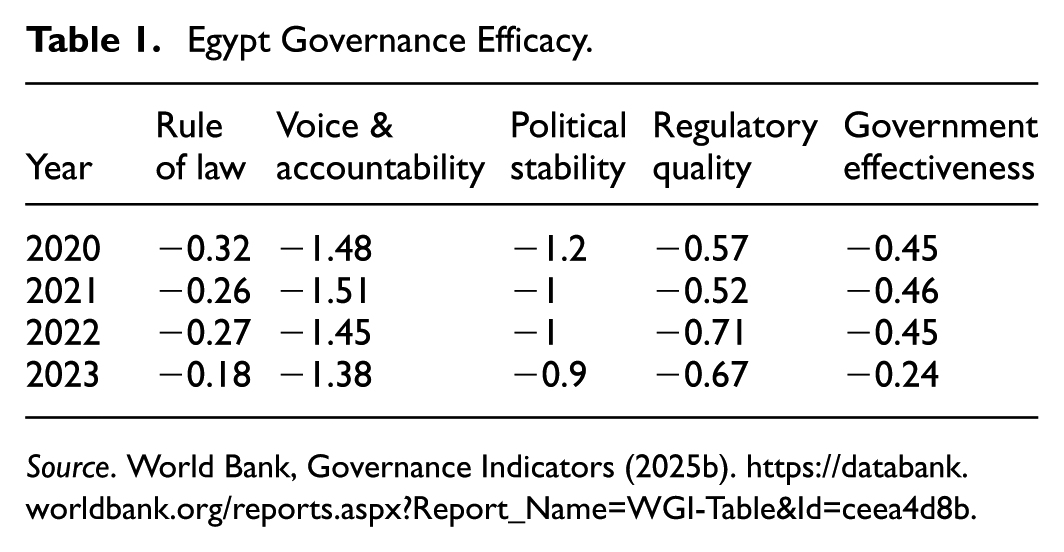
Source. World Bank, Governance Indicators (2025b). https://databank.worldbank.org/reports.aspx?Report_Name=WGI-Table&Id=ceea4d8b.
Egypt Economic Mass (M).
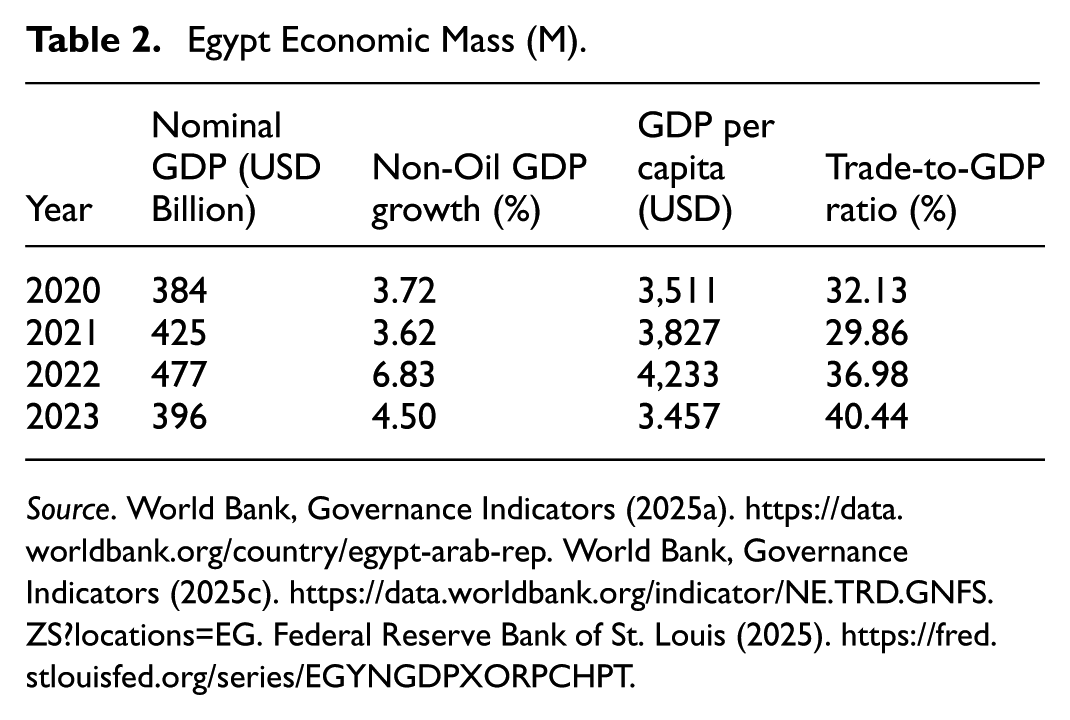
Source. World Bank, Governance Indicators (2025a). https://data.worldbank.org/country/egypt-arab-rep. World Bank, Governance Indicators (2025c). https://data.worldbank.org/indicator/NE.TRD.GNFS.ZS?locations=EG. Federal Reserve Bank of St. Louis (2025). https://fred.stlouisfed.org/series/EGYNGDPXORPCHPT.
Egypt Competitiveness Drag (C).
Saudi Arabia Governance Efficacy.
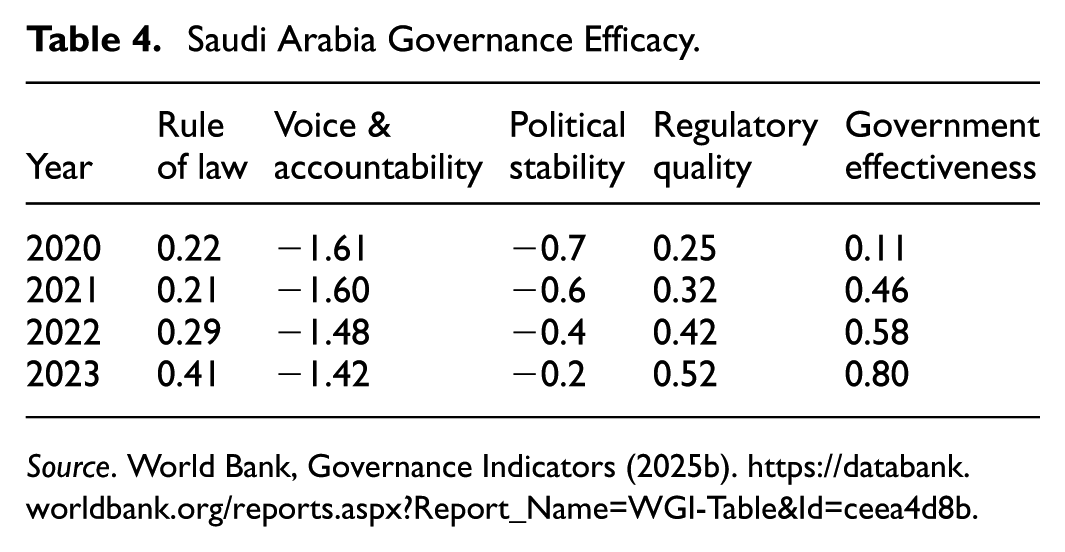
Source. World Bank, Governance Indicators (2025b). https://databank.worldbank.org/reports.aspx?Report_Name=WGI-Table&Id=ceea4d8b.
Saudi Arabia Economic Mass (M).
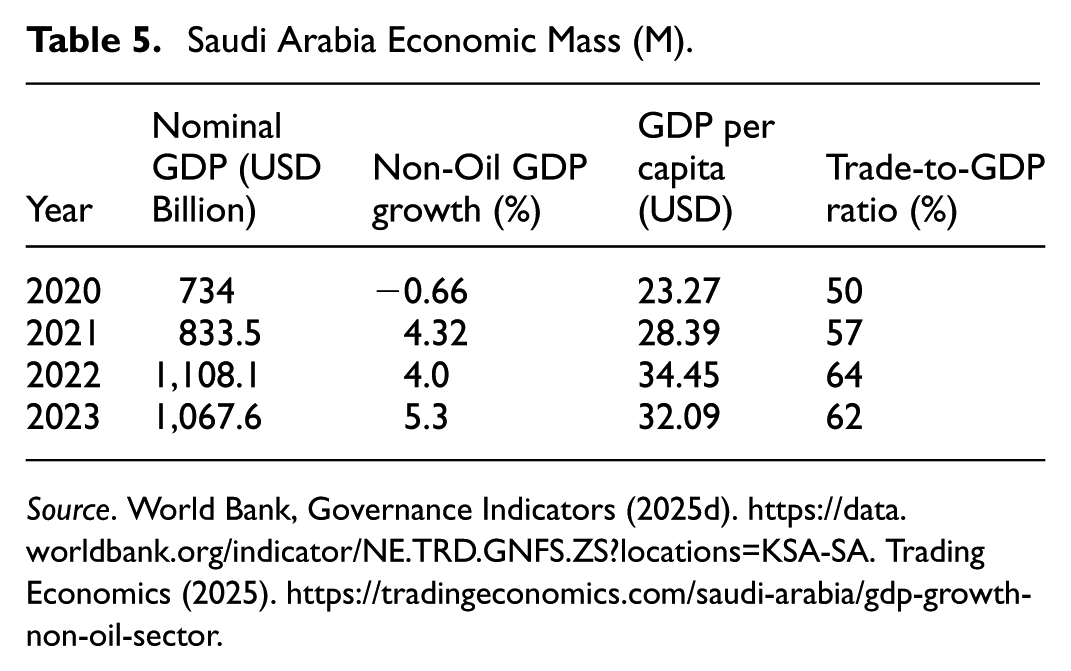
Source. World Bank, Governance Indicators (2025d). https://data.worldbank.org/indicator/NE.TRD.GNFS.ZS?locations=KSA-SA. Trading Economics (2025). https://tradingeconomics.com/saudi-arabia/gdp-growth-non-oil-sector.
Saudi Arabia Competitiveness Drag (C).
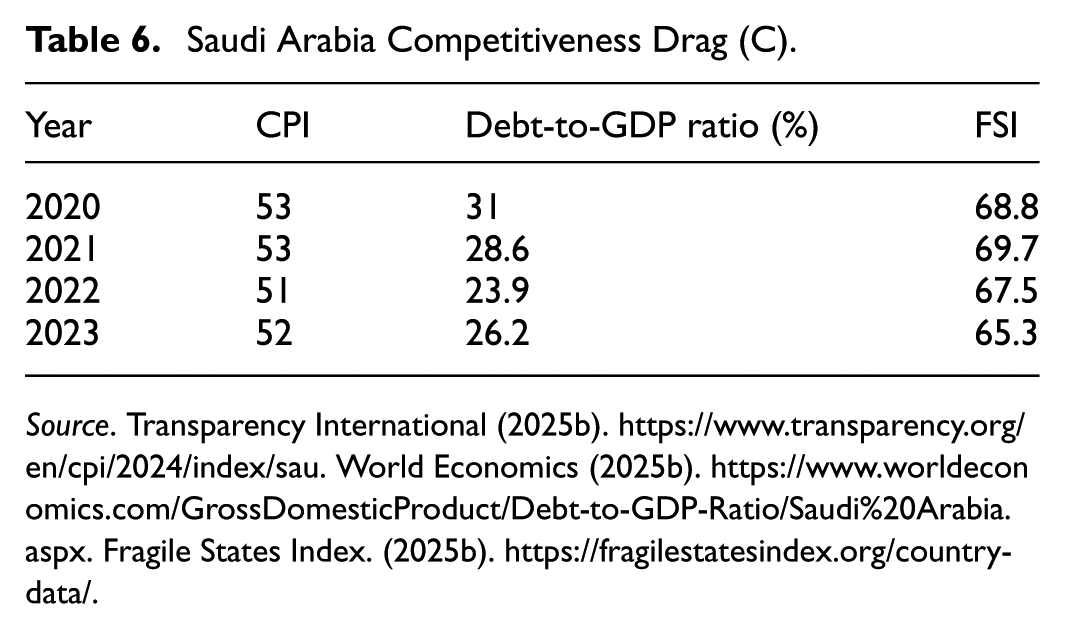
Saudi Arabia (KSA) Data Tables
The following is the data of the main variables for Saudi Arabia Governance Effectiveness for 4 years indicators, along with the sources of the data.
Index Formulation
The CISC equation will integrate the four dimensions as follows:
Analytical Framework
The analysis will employ two techniques:
Comparative Time-Series Analysis: Trends in Saudi Arabia and Egypt’s CISC scores will be evaluated annually (2020–2023) to identify patterns in governance, economic diversification and barriers.
Sensitivity Testing: Each variable (G, M, C) will be adjusted by ±10% to assess its marginal impact on CISC scores, isolating key leverage points for policy design.
Data and Analysis
Research Data
A 4 Years Data for KSA & Egypt (2020, 2021, 2022, and 2023) was collected from different well-known sources as illustrated in the following Table 7 to cover the needed data for each variable included in the research.
Data Sources.
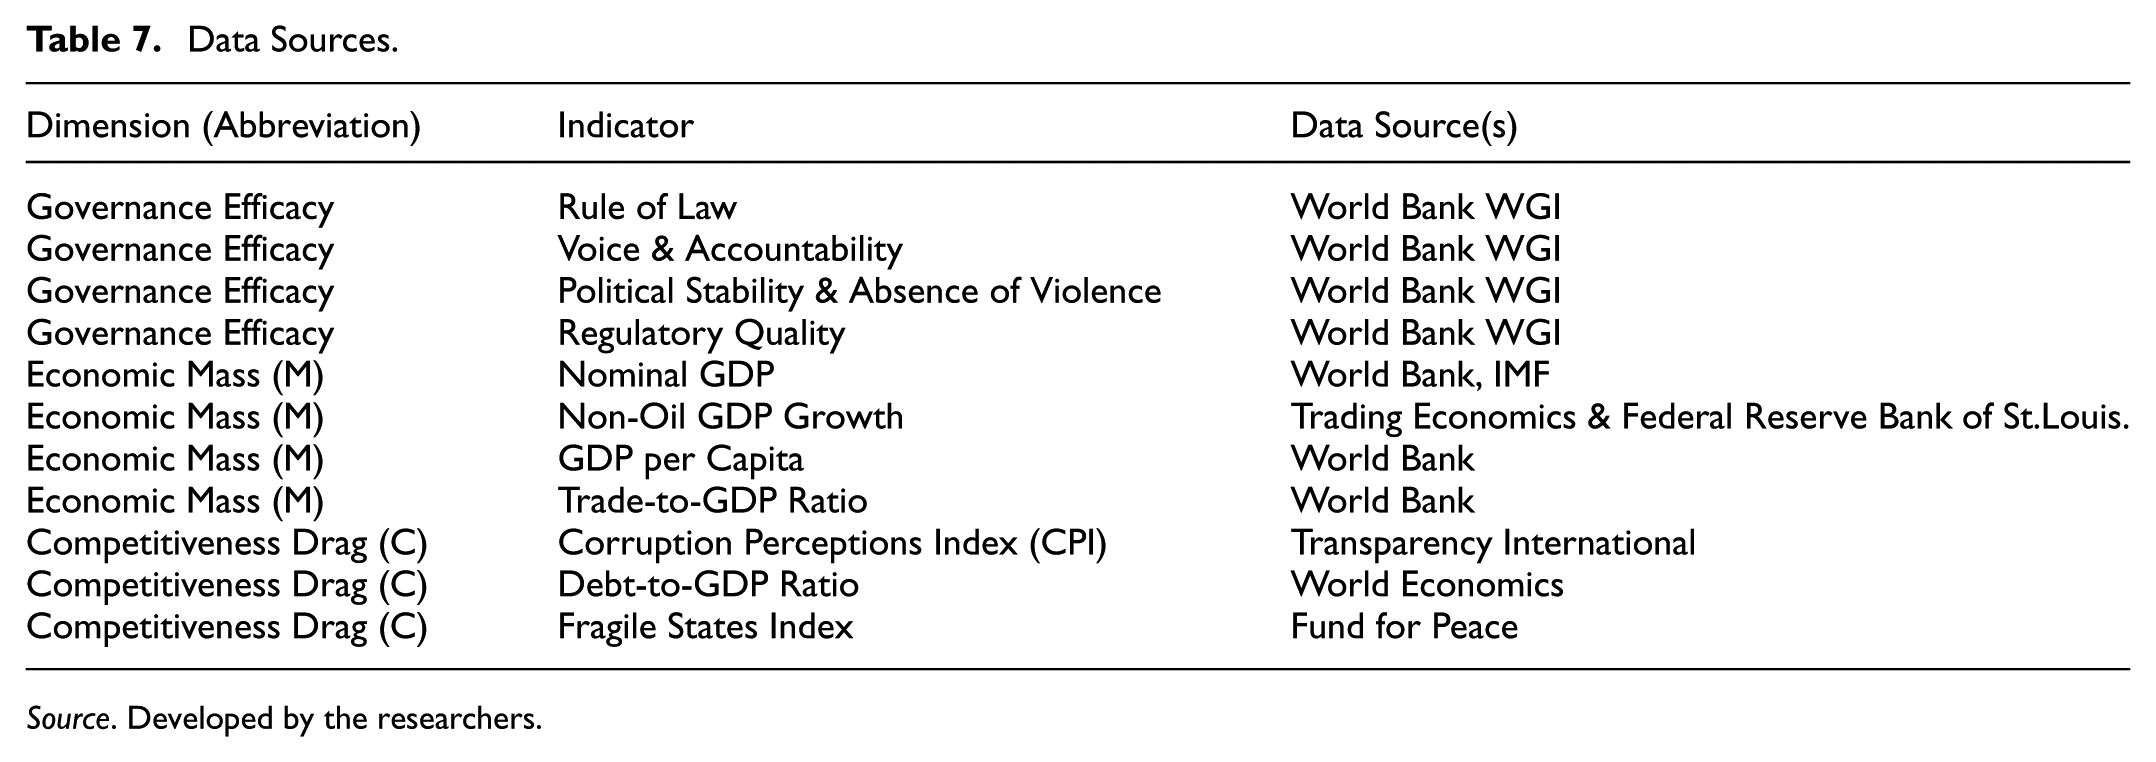
Source. Developed by the researchers.
Normalization Process of Data
The normalization process is a key step in preparing the data for calculating the CISC. It ensures that all variables Governance Efficacy (G), Economic Mass (M), and Competitiveness Drag (C) are on a comparable scale, preventing any single variable from dominating the analysis due to differences in measurement units (e.g., percentages, monetary values, or indices).
Each sub-variable contributing to G, M, and C is scaled to a range between 0 and 1, where:
0 represents the minimum observed value across both countries and years (2020–2023).
1 represents the maximum observed value across the same dataset.
The normalization formula depends on whether higher or lower values are desirable:
For variables where higher values are better (e.g., Rule of Law, Nominal GDP): Normalized Value=x−min (x) / max (x)−min (x)
For variables where lower values are better (e.g., Debt-to-GDP Ratio): Normalized Value=max (x)−x / max (x)−min (x).
For Competitiveness Drag (C), which represents barriers to competitiveness, sub-variables like the Corruption Perceptions Index (CPI) are inverted for both countries (higher CPI is better), while others like Debt-to-GDP Ratio are normalized directly (higher values are worse).
In this section, we present the CISC values and their underlying variables for Saudi Arabia and Egypt over the period from 2020 to 2023. The data is organized into three tables: one for each country’s CISC and main variables, followed by a comparative table of CISC values. Each table is accompanied by a comment highlighting key observations.
The following are the tables of data after normalization process for the two countries:
In Table 8, the normalized governance scores reveal two distinct trajectories. Egypt’s composite Governance Efficacy rises modestly from 0.1374 in 2020 to 0.3398 in 2023, reflecting incremental gains in Voice & Accountability (from 0.5652 to 1.0000) and Political Stability (from 0.0000 to 0.3000), but persistent weaknesses in Rule of Law and Regulatory Quality. In contrast, Saudi Arabia’s composite G grows from 0.4945 to 0.9652 over the same period, driven by uniformly strong performance across all five dimensions most notably, perfect scores in 2023 for Rule of Law, Regulatory Quality, and Government Effectiveness.
Egypt and Saudi Arabia Governance Efficacy.
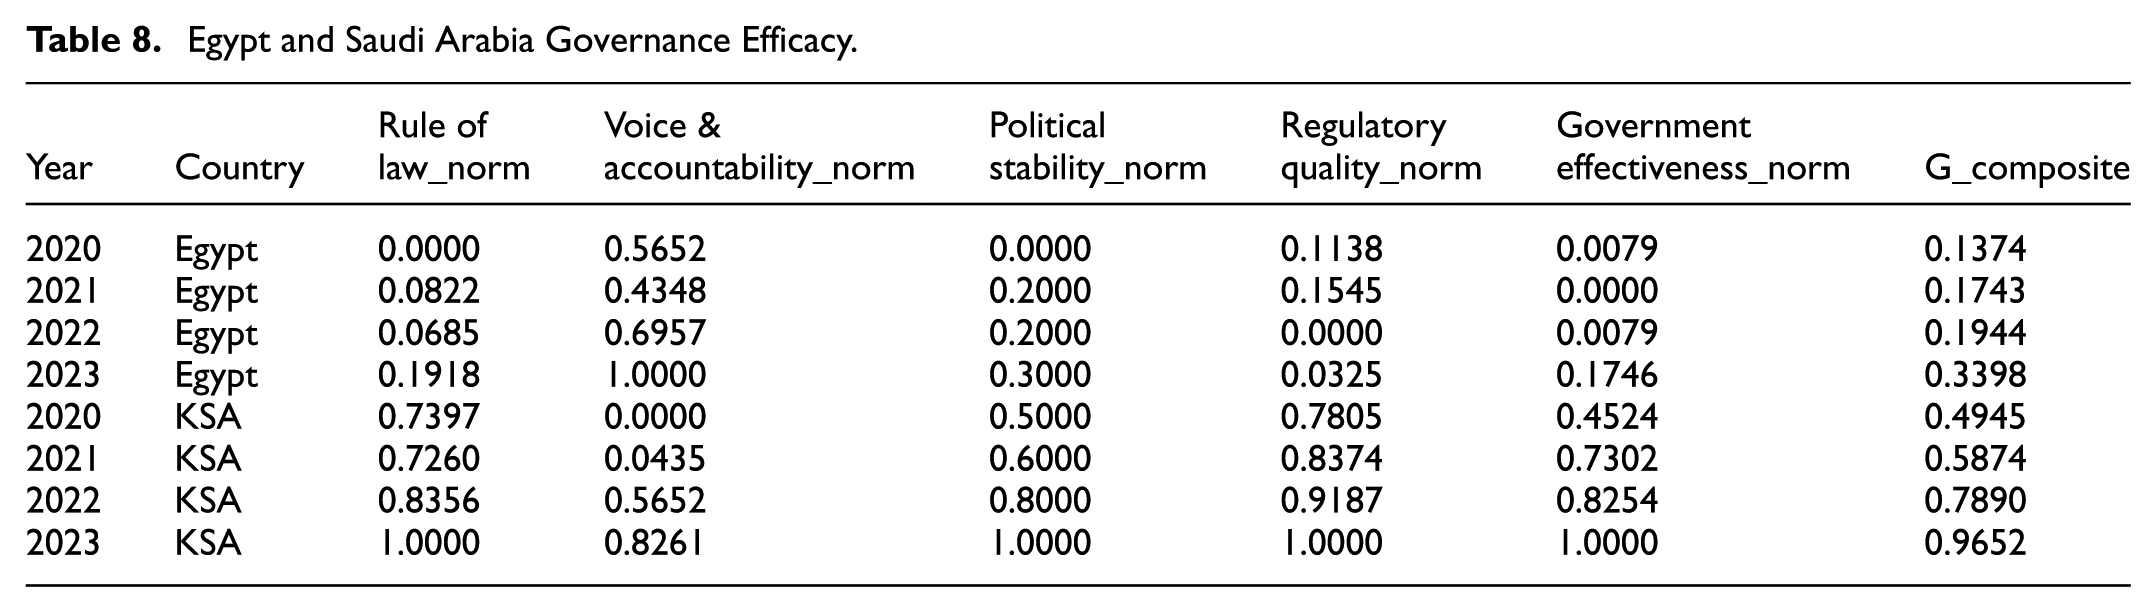
Egypt’s trajectory suggests that recent reforms and anti-corruption efforts have begun to bolster citizen participation and political calm, yet institutional foundations remain fragile. The Rule of Law_norm barely improves above 0.19 by 2023, indicating that legal predictability and judicial independence continue to lag behind regional peers. Similarly, Egypt’s Regulatory Quality_norm declines in 2022 before a marginal recovery, signaling inconsistent advancements in regulatory simplification and business climate reforms.
In contrast, Saudi Arabia’s governance improvements correlate with its Vision 2030 strategic blueprint, which prioritizes institutional efficiency, transparency, and accountability. The near-maximum scores in Regulatory Quality_norm (1.0000) and Government Effectiveness_norm (1.0000) by 2023 reflect transformative administrative reforms and nationwide digital transformation programs implemented under Vision 2030’s execution phase. The incremental rise in Voice & Accountability_norm (from 0.0000 to 0.8261) further indicates gradual enhancements in participatory governance mechanisms, albeit within a context of limited political liberalization.
These contrasting trajectories highlight the utility of a composite governance index: it quantifies both the scope of institutional modernization (via disaggregated sub-indicators) and the magnitude of systemic transformation (through the aggregated G score). For policymakers, Egypt’s stagnation underscores the necessity of harmonizing legal and regulatory reforms, while Saudi Arabia’s progress demonstrates how centralized, high-priority policy agendas can simultaneously elevate multiple governance dimensions.
In Table 9, the normalized Economic Mass scores reveal contrasting patterns of growth and diversification in Egypt and Saudi Arabia over 2020 to 2023. Egypt’s composite M rises modestly from 0.3699 in 2020 to 0.3829 in 2021, then jumps to 0.5842 in 2022 before easing back to 0.4578 in 2023. This 2022 peak is driven by exceptionally strong non-oil GDP growth (norm = 1.0000) and GDP per capita (norm = 1.0000), reflecting concerted diversification efforts that echo the literature on capability-driven expansion beyond oil sector. However, the subsequent decline underscores the volatility inherent in trade-exposed economies: Egypt’s trade-to-GDP ratio (norm = 0.2086 in 2022, 0.3099 in 2023) was insufficient to fully offset slower nominal GDP growth, illustrating how openness can amplify external shocks.
Egypt and Saudi Arabia Economic Mass (M).
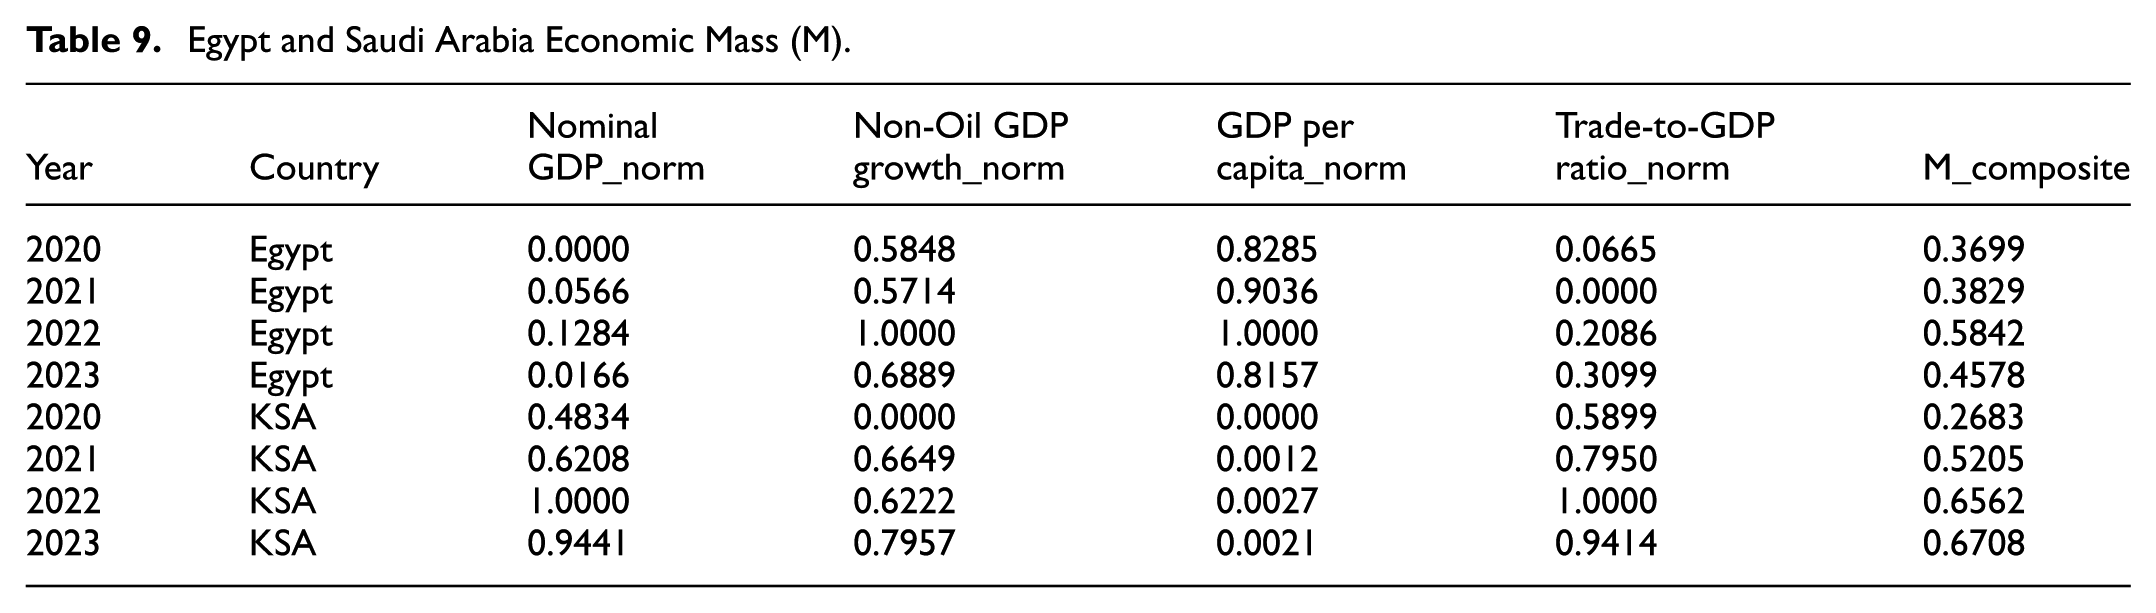
In contrast, Saudi Arabia’s Economic Mass climbs steadily from 0.2683 in 2020 to 0.6708 in 2023, underpinned by its sheer economic scale and sustained integration into global markets. Its nominal GDP attains the maximum normalized value of 1.0000 in 2022, and trade-to-GDP remains robust (norm ≈ 0.94 in 2022–2023). Yet the kingdom’s non-oil GDP growth (norm = 0.6222 in 2022) and per-capita income (norm = 0.0027 in 2022) lag behind Egypt’s, highlighting the challenges of shifting away from oil dependence despite Vision 2030 reforms. Together, these trajectories illustrate the trade-off between rapid, policy-induced diversification in emerging markets and the stabilizing effects of large-scale, resource-anchored economies
In Table 10, the Competitiveness Drag (C) composite index illustrates significant disparities between Egypt and Saudi Arabia in terms of macroeconomic and institutional constraints. Egypt’s consistently high scores across all 4 years rising from 0.9116 in 2020 to a peak of 0.9271 in 2022 before declining slightly to 0.8567 in 2023 signal persistent structural vulnerabilities. These are primarily driven by elevated public debt levels (with a normalized Debt-to-GDP ratio reaching 1.0000 in 2023), coupled with ongoing political and security risks as captured by the Fragile States Index (FSI) and the inverted Corruption Perceptions Index (CPI). These findings align with prior research emphasizing that fiscal imbalances and governance-related frictions can substantially inhibit competitiveness and investment climate stability (Ramey & Ramey, 1995; World Bank, 2023).
Egypt and Saudi Arabia Competitiveness Drag (C).
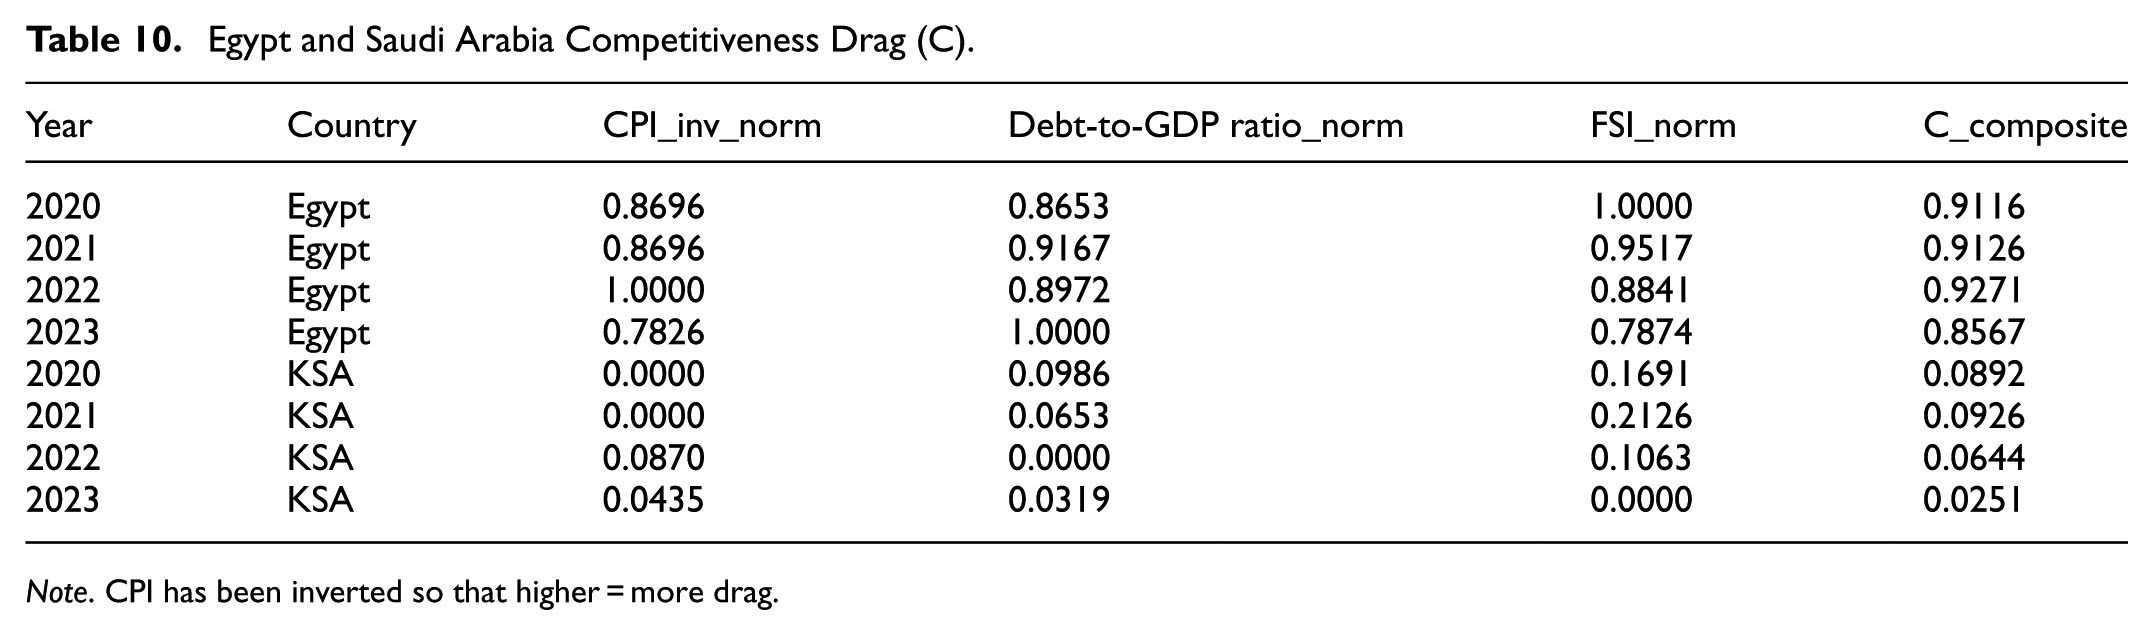
Note. CPI has been inverted so that higher = more drag.
Saudi Arabia demonstrates markedly lower drag throughout the period, with its composite score declining steadily from 0.0892 in 2020 to just 0.0251 in 2023. This is a testimonial to the effectiveness of public finance management, particularly reductions in debt burden and an enhanced institutional setting by Vision 2030 projects (IMF, 2023; Kingdom of Saudi Arabia, 2016). The decline to near zero levels of FSI and negative CPI by 2023 also predict increasing political stability and decline in corruption perception, respectively, which all together present a more favorable platform for private-sector development.
By and large, this comparative evaluation of Competitiveness Drag suggests that although Egypt continues to be saddled with entrenched structural problems, Saudi Arabia has managed to buffer considerable institutional and macroeconomic frictions and hence has more capability to support long-term economic transformation.
Calculating CISC for Both Countries Using the Equation (CISC = 2GM / C^2)
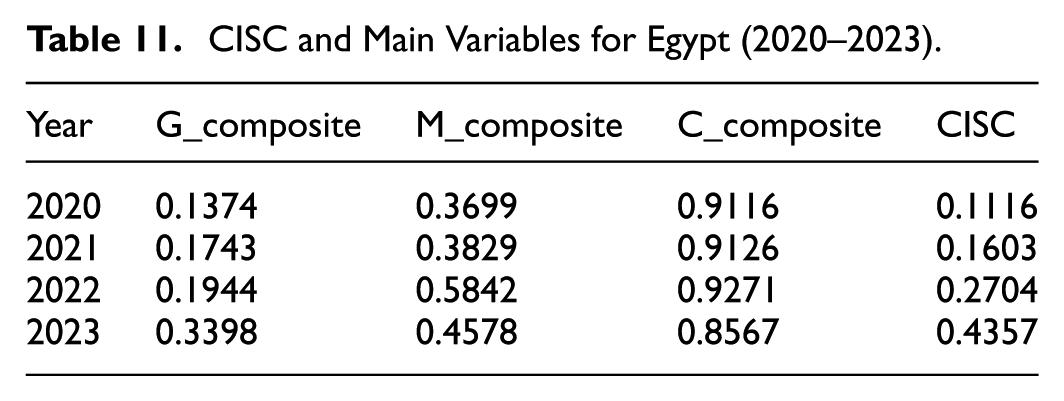
Table 11 shows Egypt’s Governance Efficacy, Economic Mass (M) and Competitiveness Drag (C) indicators that indicate modest and incremental growth over the 4-year period. Governance indicators improved from 0.1374 in 2020 to 0.3398 through 2023, indicating incremental enhancement in institutional quality, rule of law, and political stability. The Economic Mass indicator also showed steady growth, at 0.5842 in 2022, before a slight decline in 2023. This indicates middling growth in trade performance and GDP numbers, but not even overall growth. However, Egypt’s Competitiveness Drag remained considerably high throughout the period, with scores hovering above 0.85 indicative of persistent structural constraints such as high public debt, institutional fragility, and governance inefficiencies. Consequently, Egypt’s CISC (Composite Index of Systemic Competitiveness) remained low, reaching only 0.4357 by 2023, signaling limited overall systemic Competitiveness to transform economic and institutional environments at scale.
CISC and Main Variables for Egypt (2020–2023).
As for Saudi Arabia, Table 12 demonstrates a markedly different trajectory. Governance Effectiveness showed a robust and continuous improvement, growing from 0.4945 in 2020 to an impressive 0.9652 by 2023. This progression reflects significant strides in political stability, regulatory quality, and government effectiveness, likely driven by strategic reforms under Vision 2030. Similarly, the Economic Mass component improved consistently, with notable growth in non-oil GDP and trade ratios, reaching 0.6708 by 2023. Crucially, Saudi Arabia’s Competitiveness Drag diminished sharply over time from 0.0892 in 2020 to just 0.0251 in 2023 highlighting successful efforts to reduce corruption perceptions, enhance institutional resilience, and maintain fiscal discipline. The combined impact of these events is realized by the exponential jump in the CISC score from 33.3493 in 2020 to a stunning 2055.3838 in 2023, as a sign of stupendous progress in national systemic Competitiveness.
CISC and Main Variables for Saudi Arabia (2020–2023).
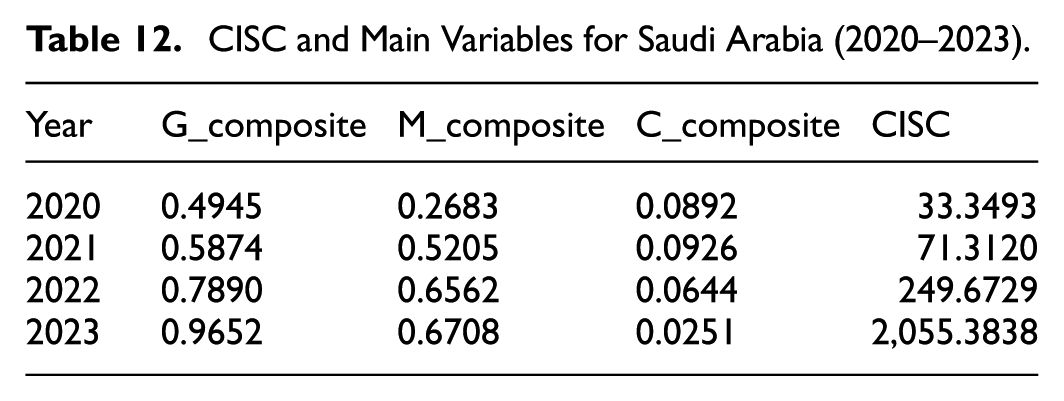
The Saudi Arabia-Egypt comparison is enlightening. Egypt experienced modest gains in economic mass and governance but high competitiveness drags, which overpowered systemic improvement, resulted in flat CISC scores. Conversely, the strategic economic and institutional modernization effort of Saudi Arabia’s Vision 2030 has brought significant change across all dimensions in particular governance effectiveness and competitiveness barrier reduction leading to a staggering improvement in its CISC performance. This difference emphasizes the importance of coordinated, high-leverage reforms that take place concurrently to build institutional resilience, economic responsiveness, and fiscal balance. The Saudi example illustrates how ideologically guided policy plans, like Vision 2030, can lead to the construction of statehood once they are implemented with finesse and ongoing political commitment.
The using of C^2 (Competitiveness Drag squared) into the CISC equation and its noticed huge impact on the results as in Saudi Arabia and Egypt case is rooted in economic theories that recognize the non-linear, compounding consequences of structural weaknesses. Institutional economics highlights how systemic risks like corruption or institutional fragility do not just hinder growth linearly but create self-reinforcing cycles of inefficiency as corruption erodes trust, stifles innovation, and deters investment, disproportionately amplifying economic harm over time (Acemoglu & Robinson, 2012; Mauro, 1995). Similarly, fiscal theories emphasize threshold effects, where high debt-to-GDP ratios trigger accelerating declines in growth as borrowing costs crowd out critical investments (Reinhart & Rogoff, 2010). By squaring C, the model captures these accelerating dynamics, reflecting how interconnected risks (e.g., weak governance, debt., etc.) compound to constrain competitiveness. This design aligns with empirical evidence showing that structural failures often escalate multiplicatively, necessitating urgent policy interventions to mitigate their outsized impact on development trajectories.
Sensitivity Analysis
Sensitivity analysis determines the impact of varying the core variables (G, M, C) on the Composite Index of Systemic Competitiveness (CISC), indicating the resilience of the framework and relative weights of each component. In order to approximate it, each core variable was shocked by ±10% for Saudi Arabia and Egypt with the remaining variables fixed, and then calculation of the ensuing percentage change in CISC.
The ±10% proportionate shock across all indicators is not intended to predict historical volatilities observed but instead to be an open-ended stress test. With a proportionate shock of the same proportion for variable heterogeneity, the exercise is similar and shows the response of the CISC in the same direction when all pillars are different. This method is in alignment with index construction best practice, using simple symmetric shocks in preliminary sensitivity analyses prior to the use of more sophisticated scenario-specific calibrations (Saltelli et al., 2008).
Egypt’s sensitivity analysis for the years 2020 to 2023, (see Table A1), provides initial observations regarding the sensitivity of CISC to incremental variations in its composition factors: Governance Efficacy (G), Economic Mass (M), and Competitiveness Drag (C). Observations reflect an even pattern throughout the study period: a ±10% change in G or M results in a similar ±10% change in CISC. This balance suggests linear interdependence among these variables and Egypt’s strategic potential, which underscores their pivotal centrality in defining developmental returns.
There is a sharp asymmetry in the impact of Competitiveness Drag (C). A 10% increase in C leads to a 17.4% decrease in CISC, while a 10% decrease in C leads to a 23.5% rise in the index. This asymmetrical impact captures the nonlinear, destabilizing character of structural drags in shaping systemic competitiveness.
This non-linear sensitivity indicates that efforts to alleviate structural bottlenecks such as lowering corruption, debt burdens, or fragility indicators can yield disproportionately positive outcomes for systemic Competitiveness. Consequently, the analysis reinforces the strategic imperative for Egypt to prioritize reforms that target the sources of competitiveness drag, as such interventions appear to offer the highest leverage for boosting national competitiveness and resilience over time.
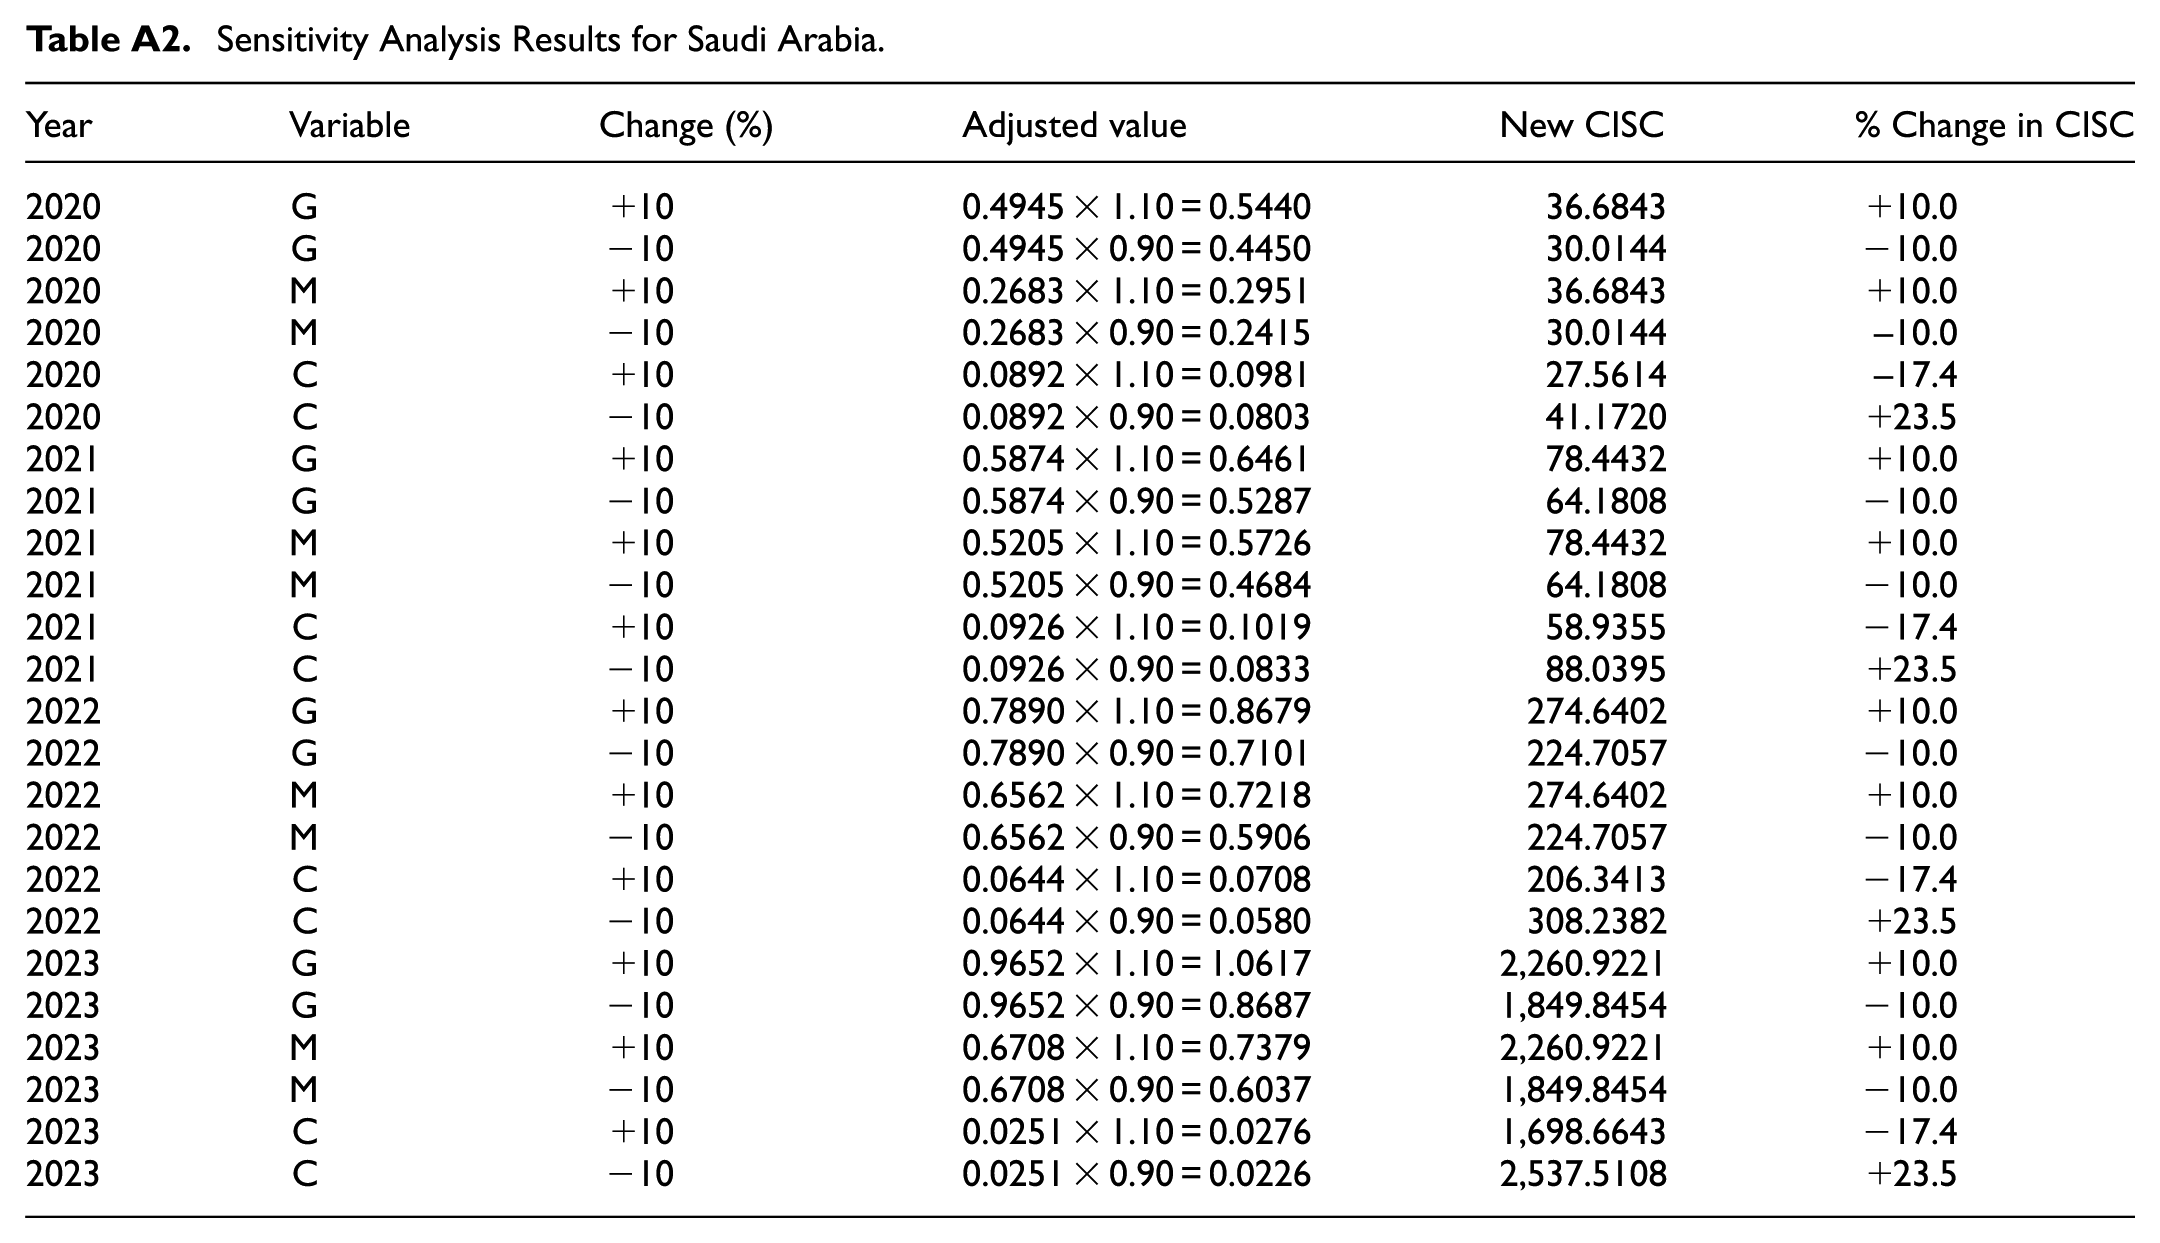
The sensitivity analysis for Saudi Arabia (see Table A2) reveals a high degree of responsiveness in the Composite Index of Systemic Competitiveness (CISC) to shifts in its three core dimensions: Governance Efficacy (G), Economic Mass (M), and Competitiveness Drag (C). A consistent pattern emerges throughout the 2020 to 2023 period, where a 10% increase or decrease in either Governance or Economic Mass leads to an exact 10% change in CISC. This proportional relationship underscores the linear impact these components have on the country’s systemic Competitiveness, reflecting the structural strength and increasing institutional maturity that underpins Saudi Arabia’s development trajectory.
More notably, the impact of Competitiveness Drag on CISC is highly asymmetric and nonlinear. An increase of 10% in the drag factor consistently leads to a significant decrease in CISC by approximately 17.4%, while a 10% reduction in drag results in a sharp increase in CISC by about 23.5%. This sensitivity is particularly pronounced in 2023, where a minor reduction in competitiveness drag yields an extraordinary spike in CISC from 2,055.38 to 2,537.51. Such a response indicates that minimizing constraints related to corruption, fiscal fragility, or institutional inefficiencies can amplify national competitiveness dramatically. Therefore, maintaining a low drag environment appears essential to sustaining Saudi Arabia’s strategic momentum and its ability to convert economic and governance inputs into tangible strategic power.
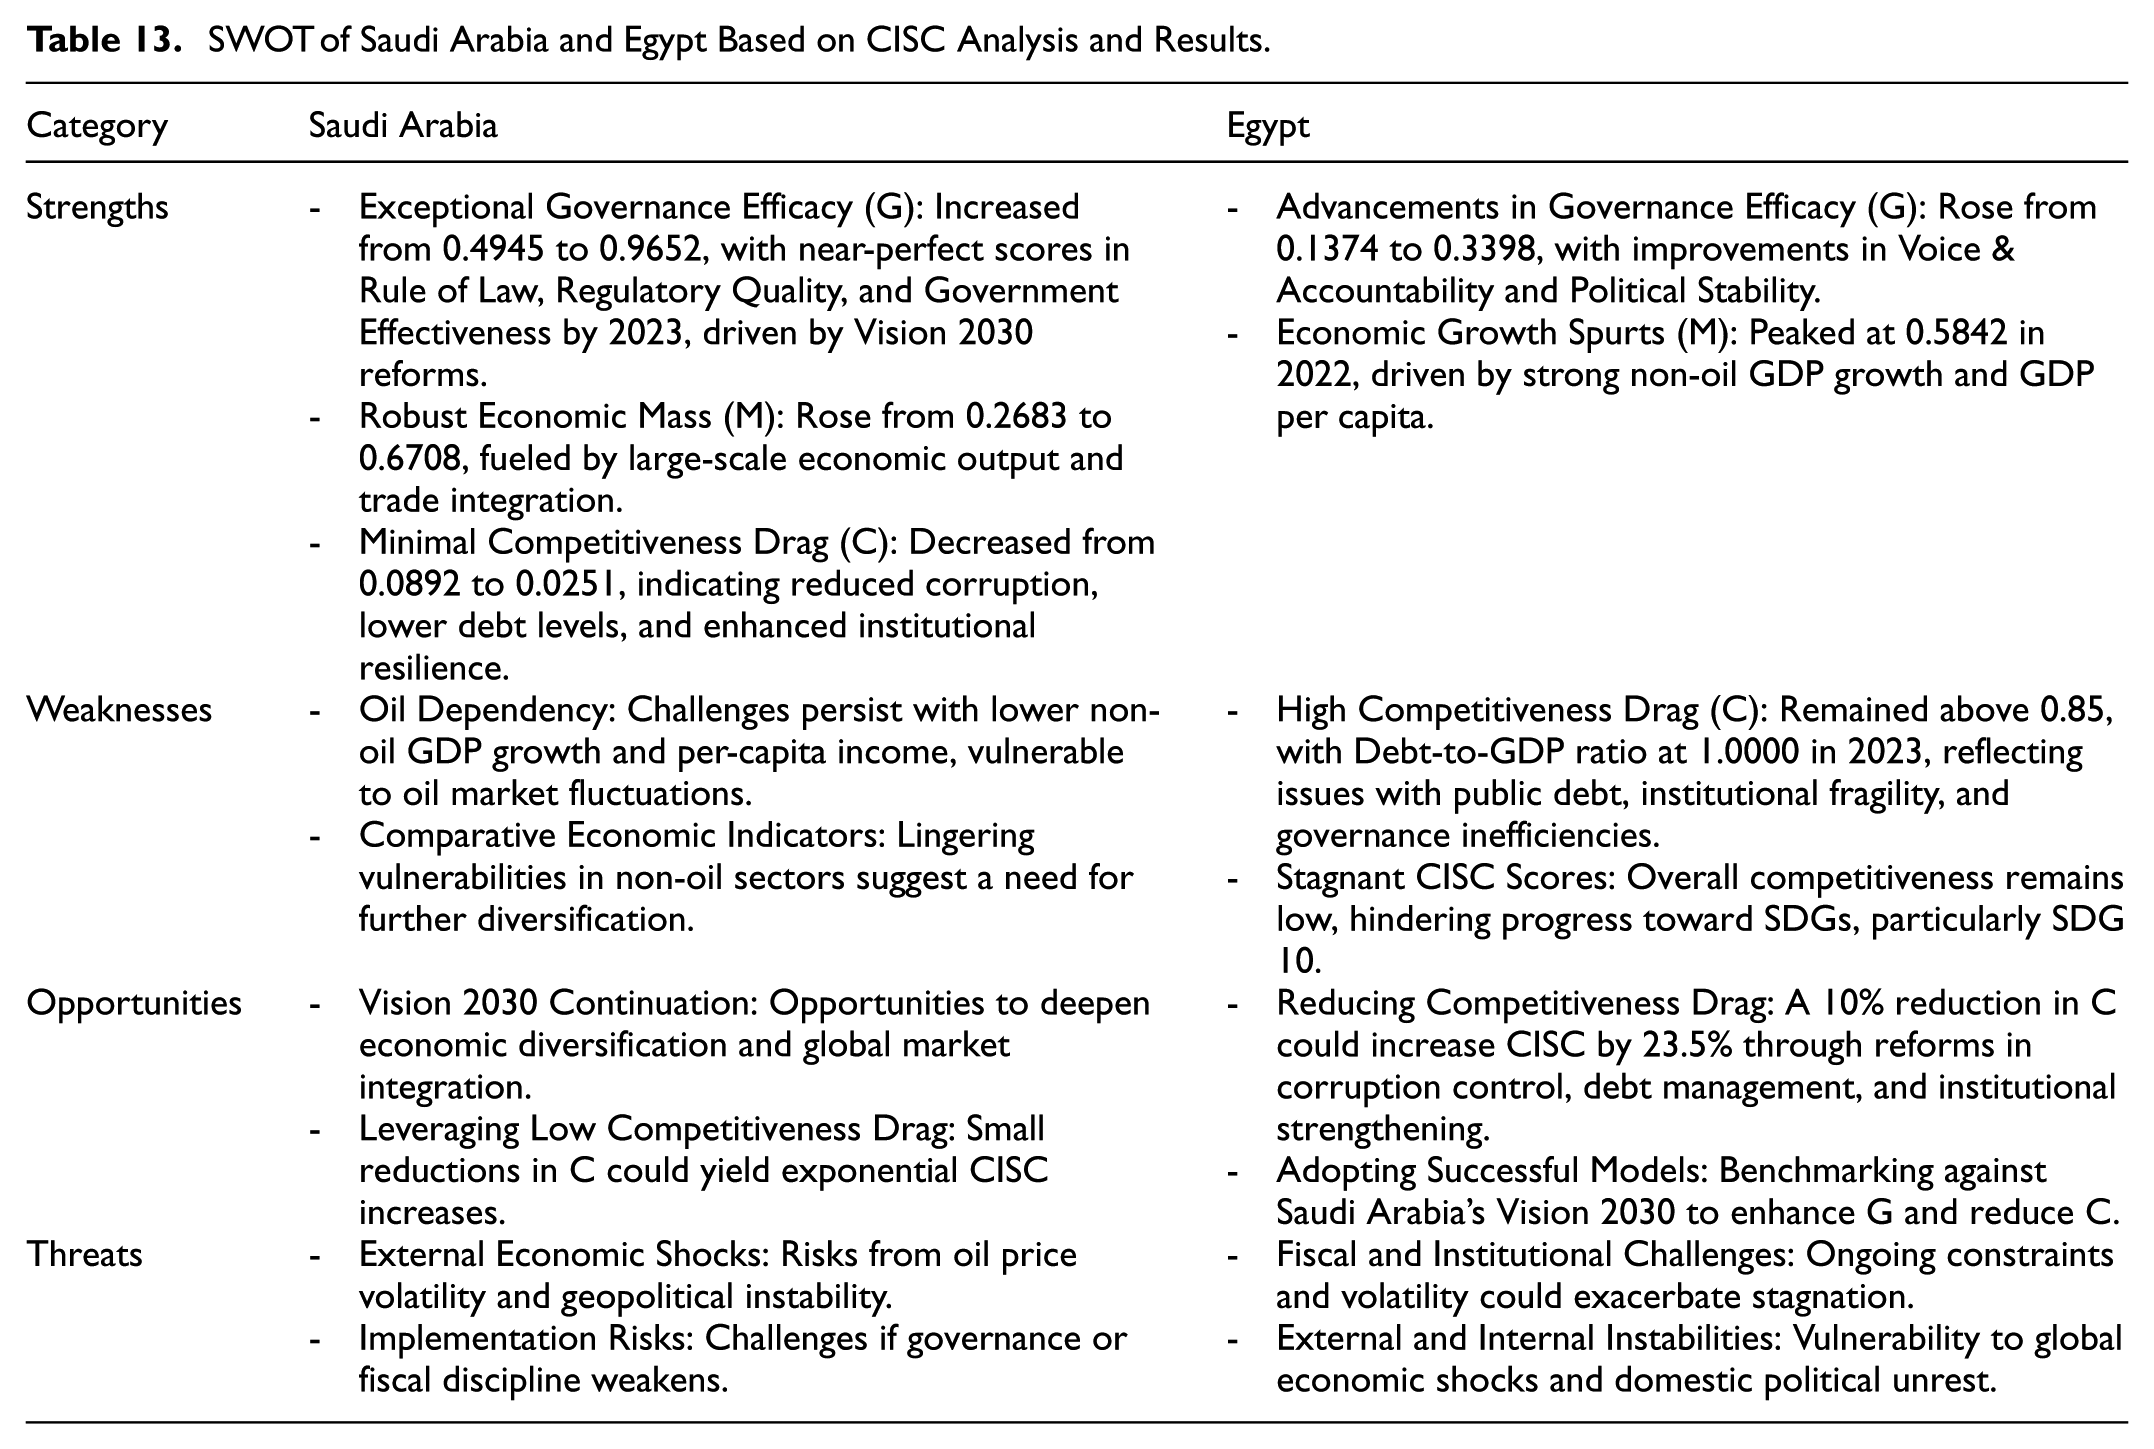
From the previous analysis and finding, Table 13 presents a summarized SWOT for both countries based on the CISC analysis and results and its integrated variables:
SWOT of Saudi Arabia and Egypt Based on CISC Analysis and Results.
Managerial and Practical Implications
Managerial and Practical Implications for Policy Makers
The managerial and practical implications presented in this section are derived from an exploratory application of the newly constructed Composite Index of Systemic Competitiveness (CISC) to a limited comparative case study of Saudi Arabia and Egypt over the 2020 to 2023 period. Given the small sample size and 4 years data, these insights should be viewed as a starting point for the index rather than definitive causal inferences or far-reaching policy prescriptions. Instead, they highlight potential patterns and leverage points such as the interplay between governance enhancements, economic diversification efforts, and reductions in structural drags that may inform future research and policy deliberations. By reframing the discussion in this tentative manner, the study underscores the CISC’s value as a diagnostic framework for generating hypotheses about systemic competitiveness, encouraging broader validation through expanded samples and longitudinal analyses to strengthen its applicability in diverse contexts.
To validate the Composite Index of Systemic Competitiveness (CISC) and assess its added explanatory value, we compare its trends for Saudi Arabia and Egypt (2020–2023) against established benchmarks, including the World Economic Forum’s Global Competitiveness Index (GCI) and a composite of the Worldwide Governance Indicators (WGI). Although the GCI report was discontinued after 2019 (with Saudi Arabia scoring 70.0, ranking 36th, and Egypt 54.5, ranking 93rd), subsequent IMD World Competitiveness Rankings (a similar metric) show Saudi Arabia improving dramatically from 24th in 2020 to 16th in 2024, aligning with CISC’s exponential rise from 33.35 to 2055.38, driven by governance reforms and reduced drag factors. Egypt, conversely, ranked around 34th to 35th in IMD (2023–2024), mirroring CISC’s modest gains from 0.11 to 0.44, constrained by persistent institutional fragilities. For WGI, we compute a composite average of the five indicators used in CISC’s Governance Effectiveness pillar (Rule of Law, Voice & Accountability, Political Stability, Regulatory Quality, Government Effectiveness). Saudi Arabia’s WGI composite improves from −0.346 to 0.022, correlating strongly (r ≈ .98) with CISC’s surge, while Egypt’s shifts from −0.804 to −0.674 (r ≈ .95 with CISC). Unlike GCI/WGI, which emphasize enablers without penalizing drags nonlinearly, CISC’s inclusion of Competitiveness Drag squared amplifies the inhibitory effects of corruption, debt, and fragility, providing greater predictive sensitivity for example, explaining Saudi Arabia’s outsized gains under Vision 2030 and Egypt’s stagnation despite partial improvements thus offering policymakers a more diagnostic tool for systemic risks and SDG alignment.
The comparative analysis between Egypt and Saudi Arabia, combined with the sensitivity evaluations, provides critical insights for policymakers, strategists, and institutional leaders seeking to enhance national capacity and long-term competitiveness. The findings reveal several implications that should inform future decision-making and resource allocation.
Enhancing Governance Quality: Saudi Arabia’s consistently higher Governance Efficacy scores, coupled with the significant impact of governance on the Composite Index of Systemic Competitiveness (CISC), emphasize the role of institutional strength in building national systemic Competitiveness. Managers in public administration should prioritize reforms aimed at improving regulatory quality, government effectiveness, and the rule of law. For Egypt, the gradual improvement in governance indicators especially between 2022 and 2023 demonstrates that targeted institutional enhancements can yield measurable gains in strategic positioning. Strengthening transparency, accountability, and public sector performance should remain a core focus.
Strengthening Economic Fundamentals: The results highlight the growing contribution of Economic Mass (M) to national competitiveness. In Saudi Arabia, the steady rise in normalized GDP and trade-to-GDP ratios reflects successful diversification efforts under Vision 2030. For Egypt, non-oil GDP growth shows promise, but remains vulnerable to volatility in trade integration and per capita income. Economic managers should prioritize investments in high-value sectors, infrastructure, and innovation ecosystems to sustain and expand economic output. Additionally, enhancing international trade linkages could provide a stronger economic base and improve Egypt’s overall resilience.
Reducing Institutional and Fiscal Barriers: Both nations’ sensitivity analyses underscore the disproportionate influence of the Competitiveness Drag (C) dimension. Even marginal increases in institutional frictions or fiscal instability can significantly erode national competitiveness. For instance, a 10% increase in Competitiveness Drag (C) triggered over 17% declines in CISC scores for both Egypt and Saudi Arabia. This result underscores the significance of pre-emptive responses to corruption, unleashing the pressures of sovereign debt, and enhancing fiscal resiliency. Institutional leaders and monetary policymakers need to integrate risk mitigation frameworks and governance bulwarks in order to limit drag effects and develop long-term competitive capabilities.
Strategic Planning through Simulation and Sensitivity Tools: The sensitivity analysis shows the way simulation models can enrich evidence-based policy-making. Scenario projections with marginal adjustments of strategic measures like Governance Efficacy or Economic Mass (M) are among the most critical instruments used for optimizing national development plans. Ministry strategy departments, economic councils, and planning boards should provide such analysis tools with a formal framework to gauge the system effects of policy plans or external shocks. For instance, by estimating the way even small increases in Competitiveness Drag (C) may disproportionately add to national capability, policymakers will be able to allocate resources more effectively.
Benchmarking and Cross-Learning: The two divergent paths of Egypt and Saudi Arabia at CISC highlight the importance of comparative analysis. Saudi Arabia’s 2020 to 2023 systematic competitiveness enhancement, sparked by developments in governance effectiveness and economic diversification, is a workable plan. Egypt can borrow reformed strategies such as going digital with public services, simplifying investor rules, and debt sustainability frameworks following Saudi reforms. Regional networks for knowledge sharing and multilateral alliances could speed up the adoption of good governance and economic blueprints.
Policy Cohesion and Synchronization: The cross-linkages between Governance Efficacy (G), Economic Mass (M), and Competitiveness Drag (C) emphasize the need for synchronized policymaking. Advances in one arena will be matched by setback or decline in others. Therefore, a balanced, multi-pronged policy approach is the way to go. National strategy institutions need to ensure that fiscal, institutional, and development agendas are not only visionary in design but synchronized in application for maximum cumulative strategic gains.
Practical Implications for Investors: The Strategic Role of CISC Index
The Composite Index of Systemic Competitiveness (CISC) provides rich practical wisdom for foreign and domestic investors moving through turbulent, dynamic markets. As investment policies progress deeper into optimizing political-economic stability, institutional dependability, and minimizing systemic risk, the CISC provides an anticipatory measure reflecting consideration of capital allocation strategies in accordance with structural economics and foundations of governance.
One of the CISC’s greatest contributions is its capacity to gauge a country’s direction of strategy through an integrated framework, as opposed to such short-run indicators as GDP growth or stock market performance over quarters. Through combining effectiveness of governance, economic mass, and structural constraint, the CISC isolates systemic weaknesses and strengths that traditional financial analysis cannot capture (Fukuyama, 2013). For example, a country with GDP growth and deteriorating regulatory quality and governance levels may seem attractive to investors on the surface, but the CISC reveals underlying risks in such a situation.
The governance element of the index is particularly relevant to institutional predictability and legality-founded respect for institutions preconditions to entice long-term investment. Higher ratings of governance among nations result in higher regulatory openness, contracted-enforceability, and less corruption, and consequently lower transaction risk and legal ambiguity (Acemoglu & Robinson, 2012). These findings support evidence by World Bank and OECD, which time and again attribute high foreign direct investment to well-functioning governance systems (World Bank, 2020).
Similarly, the economic mass component quantifies productive abilities and scalability within the market, not just capturing economic scale, but diversification and globalization as well. Such measures help investors gauge whether an economy is able to absorb capital flows without becoming a victim of inflationary threats or dependency on debt (Hausmann et al., 2014). Economies with higher economic mass scores usually have more diversified sectoral possibilities, thus making portfolio stability more favorable.
The competitiveness drag factor, which is negatively made up of corruption, fiscal pressure, and institutional weakness, allows investors to make more precise estimates of risk-adjusted returns. Sensitivity analyses indicate that marginal decreases in drag factors can disproportionately erode strategic visions, and hence the necessity to track structural barriers that erode investment viability in the long term (Rodrik, 2007).
Besides, the CISC’s responsiveness to policy change makes it a forecasting instrument for investors. Trends in the index can indicate impending reform directions or institutional deterioration, guiding strategic timing for market entry or exit. An upward CISC on a regular basis indicates improved national competitiveness and strategic strength, while a downtrend can predict systemic risk even under seemingly stable macroeconomic environments.
Briefly, the CISC presents investors with a three-dimensional risk-opportunity measurement model. With the connection between macroeconomic analysis and institutional diagnostics, it informs more effective, strategically linked investment choices during a period of integrated global challenges.
Future Research Directions
To further enhance the flexibility and resilience of the Composite Index of Systemic Competitiveness (CISC), future research should explore additional weighting approaches and aggregation models to analyze their impact on the index results. This includes experimenting with non-compensatory models, which may provide different analytical insights from standard linear aggregation models, larger number of countries and more number of years for time series analysis.
The Composite Index of Systemic Competitiveness (CISC) developed in this study is the starting point for applying internationally accepted indicators to continue further expanding the analysis of national economies. This methodological innovation aims to refine economic performance and strategic capability analysis while allowing for deeper economic assessment at a national level similar to SWOT (Strengths, Weaknesses, Opportunities, and Threats) analysis. By aggregating systematically international indicators into a composite framework, the CISC presents a multi-dimensional view of governance effectiveness, economic dynamism, and systemic competitiveness.
Subsequent studies can build on this framework by introducing additional variables and improving methodological sophistication to render the CISC useful for different economic systems and global transitions. As a strategic resource, such a tool can help governments, policymakers, and investors in managing complex issues. Such research can investigate whether or not CISC is able to forecast economic resilience, reveal early tendencies masked by conventional indicators. To confirm the index, comparison study can connect test outcomes through the CISC to actual economic and political trends. Chosen sector uses of CISC within sectors like energy, technology, or green environment could also explain its sector applicability.
The addition of emergent global challenges, such as climate volatility and geopolitical tension, would add even greater depth and relevance to the index. By including these issues of the moment in its framework, the CISC could be a dynamic instrument offering timely, actionable intelligence to global decision-makers. Ongoing refinements to the index can result in more sophisticated, anticipatory approaches to strengthen the economic and strategic strengths of nations in an interdependent world.
Limitations
There are a few limitations of this research that need to be stated. In the first place, the empirical inquiry is limited to two nations and the comparatively short 4-year period (2020–2023), limiting the external validity of the findings. Secondly, although the Composite Index of Systemic Competitiveness (CISC) provides an organized framework, its development entails methodological choices on indicator selection, normalization, and weighting involving methodological assumptions so it should be handled precisely. These constraints highlight that the current analysis must be read as a starting point for the index and that future research is necessary to expand the dataset, test alternative specifications, and test robustness of the CISC in more varied settings.
Conclusion
The Composite Index of Systematic Competitiveness (CISC) in this research is a new and combined method of measuring the capacity of a country to implement and maintain long-term development goals. In contrast to traditional indices that concentrate on single dimensions like economic growth or institutional quality, the CISC includes three significant and interrelated dimensions: Governance Efficacy, Economic Mass (M), and Competitiveness Drag (C). This triadic methodology reflects the multi-dimensionality of national capability, and the CISC subsequently becomes as much a planning report as it is a diagnostic tool.
The value of the CISC is that it can create a dynamic picture of how different structural and policy-driven variables combine to determine a nation’s direction of strategy. By measuring both enablers (G and M) and drags (C), the index provides a more balanced and sophisticated picture of national performance. Conventional analysis disregards the negative spillovers or institutional inefficiencies that negatively impact strategic projects. By contrast, the CISC incorporates such drags in a systematic way in the calculation so that the figure thus obtained is an approximation of the actual capability, which is more realistic and policy-relevant (Acemoglu & Robinson, 2012; Rodrik, 2007).
One of the key benefits of the CISC is its sensitivity to marginal changes. As demonstrated in the sensitivity analyses, even a 10% improvement in governance or economic fundamentals leads to measurable increases in systemic Competitiveness, while deterioration in institutional constraints (such as rising corruption or debt burdens) has a disproportionately adverse effect. This property enhances its practical utility for policymakers by making it a powerful tool for scenario planning and impact assessment. It enables national decision-makers to identify which reforms or investments are likely to yield the highest returns in strategic resilience (Hausmann et al., 2014).
Furthermore, the exclusivity of the CISC comes from its structure composition and approach. Inverting the Competitiveness Drag score so that it is a decaying factor, the index recognizes the reality that everything about national performance is not cumulative. The approach of the present study separates the CISC from other standard composite indexes like the Human Development Index or Global Competitiveness Index, which have a tendency to sum up favorable factors without subtracting offsetting factors (World Economic Forum, 2020). This adjustment makes the index more realistically usable in the sense that it measures real-world limitations on policymaking where advances in governance or economic bulk can be negated by institutional weaknesses or fiscal volatility.
Besides, CISC is a flexible and context-dependent system. It is also unencumbered by exact geographic or economic classifications and can be tailored using region-level metrics. Its malleability makes it possible for governments, multilateral organizations, and development agencies to tailor the index to specific local policy environments, maximizing its use for cross-country comparisons as well as for context-specific strategic plans (Fukuyama, 2013).
Briefly, the Composite Index of Systematic Competitiveness fills a significant gap in the measurement of national performance. It presents a balanced, multidimensional, and actionable model appropriate to the complexities of modern governance and developmental challenges. As countries increasingly look to reconcile tensions between institutional modernization, financial stability, and inclusive growth, models such as the CISC will be extremely valuable in pursuing sustainable, long-term strategic results.
Footnotes
Appendix A
Sensitivity Analysis Results for Saudi Arabia.
| Year | Variable | Change (%) | Adjusted value | New CISC | % Change in CISC |
|---|---|---|---|---|---|
| 2020 | G | +10 | 0.4945 × 1.10 = 0.5440 | 36.6843 | +10.0 |
| 2020 | G | −10 | 0.4945 × 0.90 = 0.4450 | 30.0144 | −10.0 |
| 2020 | M | +10 | 0.2683 × 1.10 = 0.2951 | 36.6843 | +10.0 |
| 2020 | M | −10 | 0.2683 × 0.90 = 0.2415 | 30.0144 | –10.0 |
| 2020 | C | +10 | 0.0892 × 1.10 = 0.0981 | 27.5614 | –17.4 |
| 2020 | C | −10 | 0.0892 × 0.90 = 0.0803 | 41.1720 | +23.5 |
| 2021 | G | +10 | 0.5874 × 1.10 = 0.6461 | 78.4432 | +10.0 |
| 2021 | G | −10 | 0.5874 × 0.90 = 0.5287 | 64.1808 | −10.0 |
| 2021 | M | +10 | 0.5205 × 1.10 = 0.5726 | 78.4432 | +10.0 |
| 2021 | M | −10 | 0.5205 × 0.90 = 0.4684 | 64.1808 | −10.0 |
| 2021 | C | +10 | 0.0926 × 1.10 = 0.1019 | 58.9355 | −17.4 |
| 2021 | C | −10 | 0.0926 × 0.90 = 0.0833 | 88.0395 | +23.5 |
| 2022 | G | +10 | 0.7890 × 1.10 = 0.8679 | 274.6402 | +10.0 |
| 2022 | G | −10 | 0.7890 × 0.90 = 0.7101 | 224.7057 | −10.0 |
| 2022 | M | +10 | 0.6562 × 1.10 = 0.7218 | 274.6402 | +10.0 |
| 2022 | M | −10 | 0.6562 × 0.90 = 0.5906 | 224.7057 | −10.0 |
| 2022 | C | +10 | 0.0644 × 1.10 = 0.0708 | 206.3413 | −17.4 |
| 2022 | C | −10 | 0.0644 × 0.90 = 0.0580 | 308.2382 | +23.5 |
| 2023 | G | +10 | 0.9652 × 1.10 = 1.0617 | 2,260.9221 | +10.0 |
| 2023 | G | −10 | 0.9652 × 0.90 = 0.8687 | 1,849.8454 | −10.0 |
| 2023 | M | +10 | 0.6708 × 1.10 = 0.7379 | 2,260.9221 | +10.0 |
| 2023 | M | −10 | 0.6708 × 0.90 = 0.6037 | 1,849.8454 | −10.0 |
| 2023 | C | +10 | 0.0251 × 1.10 = 0.0276 | 1,698.6643 | −17.4 |
| 2023 | C | −10 | 0.0251 × 0.90 = 0.0226 | 2,537.5108 | +23.5 |
Acknowledgements
We would like to thank all of the respondents who show sincere interest and dedicated their time to answer the research questionnaire.

Ethical Considerations
These considerations were not relevant for this study type.
Consent to Participate
Authors confirm that this article does not contain any studies with human or animal participants. The journal considerations were not relevant for this study type. The authors confirm that they have read, understand and agreed to the submission guidelines, policies and submission declaration of the journal. A local ethics committee ruled that no formal ethics approval was required in this particular research, they only asked to have a copy of the published report after the research has been completed.
Consent for Publication
Consent for participant is not applicable. Authors confirm that all the data and materials are available. Authors confirm that the manuscript is the authors’ original work and the manuscript has not received prior publication and is not under consideration for publication elsewhere. Authors re-assure that they have contributed significantly to the work, have read the manuscript, attest to the validity and legitimacy of the data and its interpretation, and agree to its submission. Also, authors of this paper confirm that the paper is not copied or plagiarized version of some other published work. Authors declare that this paper is not submitted for publication in any other Journal or Magazine till the decision is made by journal editors, and that if the paper is finally accepted by the journal for publication, authors confirm immediate publication of the paper by paying all charges or its withdrawal according to the journal withdrawal policies.
Author Contributions
A.M., Y.T. and R.A. have scrutinized the literature and formulated the research gap. In addition, they wrote down the literature review. A.M., Y.T. and R.A. formulated the methodical framework of this study to achieve the desired objectives. They selected the sample size from the available population, and has designed, together with A.M. the data collection instrument and suggested the method of data analysis. A.M., Y.T. and R.A. have presented the discussion of results. The discussion of different collected data presented in the results. All authors have read and approved the manuscript.
Funding
The authors disclosed receipt of the following financial support for the research, authorship, and/or publication of this article: The authors extend their appreciation to Prince Sattam bin Abdulaziz University for funding this research work through the project number (PSAU/2024/02/29007).
Declaration of Conflicting Interests
The authors declared no potential conflicts of interest with respect to the research, authorship, and/or publication of this article.
Data Availability Statement
The authors declare they have full access to all study data, take fully responsibility for the accuracy of the data analysis, and have authority over manuscript preparation and decisions to submit the manuscript for publication.