
Abstract
This research explores the impact of digital transformation (DT) on the evolution of the relationship between enterprises and consumers at the consumer level. On the basis of expectation confirmation theory, 545 validated questionnaires were collected, and relevant hypotheses were tested with the assistance of Mplus 8.0 software and artificial neural networks (ANNs). This study revealed linear relationships among the following factors: DT affects relationship commitment (RC) not only directly but also indirectly via perceived value (PV); PV positively affects RC and relationship satisfaction (RS); and RS is positively influenced by RC. In addition, customer empowerment (CE) significantly moderates the effect of PV on RC and the effect of RC on RS. This research also highlights important predictive factors with respect to differences in effectiveness (nonlinearity). Unlike previous studies that focused on the economic and social benefits of DT, this study reveals the impact of DT on customer satisfaction, and it constitutes one of the earliest empirical investigations of DT and business–customer relationships, which can be used in subsequent research on the theoretical and practical issues associated with DT and customer relationship management (CRM).
Keywords
Introduction
Digital technology has increased the level of competition among different industries, thus encouraging digital transformation (DT) across industries, as DT has been identified as an effective way of improving the innovation dynamics of enterprises, the customer experience, organizational performance, and market competitiveness (J. Li et al., 2022; L. Xue et al., 2022). Similar to other counties, China is actively introducing relevant policies with the goal of establishing a good policy and business environment that can facilitate the DT of enterprises (Neto & Chiarini, 2021; Shu & Srimuang, 2025; Zhang et al., 2023). The International Data Corporation (IDC) forecasts that by 2028, China’s digital transformation spending will reach a staggering $733 billion, accounting for 16.7% of the global total, with a compound annual growth rate (CAGR) of 15.6%—outpacing the overall global growth rate.
Previous attempts to promote DT have focused on the concept of DT itself (Haenlein et al., 2019), policy regimes (Neto & Chiarini, 2021; Zhang et al., 2023), opportunities for transformation and the corresponding challenges (Ahmadova et al., 2021; Soto-Acosta, 2024; Stewart, 2023), and the antecedents and consequences of DT (Jin & Pan, 2023; Luo et al., 2023; Zhang et al., 2023; Y. Zhu et al., 2022). For instance, Zhang et al. (2023) reported that both corporate DT strategies and top management, as well as investments in information technology (IT), have positive effects on the outcomes of corporate DT. In addition to IT, the antecedents of DT, such as digital orientation, digital intensity and digital maturity, affect the transformation of the financial industry (Nasiri et al., 2022). Moreover, the external environment of an enterprise has a profound effect on its DT (Jin & Pan, 2023; Luo et al., 2023; Zhang et al., 2023; Y. Zhu et al., 2022). According to the findings of previous research, DT has positive effects on workforce upgrading (W. Li et al., 2024), firm resilience (Q. Wang & Chen, 2022), organizational green innovation (K. He & Chen, 2025; Zhou et al., 2023), and firm environmental, social, and governance (ESG) performance (Cai et al., 2023).
DT should not focus solely on its underlying economic and social value (Soto-Acosta, 2024); rather, it must also prioritize the customer relationships that underpin digitalization. However, few attempts have been made to investigate DT from the perspective of relationship management (Tuyen et al., 2025). Some scholars have explored research topics related to digital transformation and customer concentration or value cocreation (M. Liu et al., 2023; Yao et al., 2025). A few scholars have attempted to explain how digital transformation among internal management (e.g., leaders’ digital transformation) affects leader–subordinate relationships (W. Qiao et al., 2024; S. Qiao et al., 2025), although the conclusions remain inconclusive. Recent studies such as those by Tuyen et al. (2025) and Braojos et al. (2024) suggest that digital leadership enhances organizational communication efficiency, thereby improving organizational climate and hierarchical relationships. Conversely, J. Chen and Kouhsari (2025) argue that internal management digitalization should proceed incrementally; otherwise, it may trigger digital anxiety and panic, hindering the achievement of organizational efficiency goals. In summary, research examining the relationship between DT and CRM, particularly regarding the link between digital transformation and customer satisfaction, remains scarce (G. Liu et al., 2025; Soto-Acosta, 2024).
Against this backdrop, this study aims to empirically investigate the potential mechanisms underlying the impact of DT on customer relationship development from the perspective of RS. Specifically, it addresses the following key questions: (1) How does DT influence RS through PV and RC? (2) Is the moderating effect of CE significant? (3) Which factors exert a greater influence on RS during the DT process? To address these questions, this study bridges DT and CRM through expectation confirmation theory, deepening the understanding of their interrelationship. Additionally, employing a research methodology that combines data collection, CB-SEM and ANNs, it delves into both the linear and nonlinear associations between DT and RS. This study addresses the limitation of SEM, which can reveal only simple linear relationships among the variables in a research model. It significantly enriches the quality of decision-making information available to corporate managers, thereby assisting decision makers in addressing complex issues such as DT and CRM. Furthermore, using China’s digital transformation as a case study, this study highlights the urgent need to focus on the DT-CRM issue, promoting its discussion and implementation in more countries.
The research logic of this paper is as follows: Following the introduction, we systematically review the existing DT literature and present the theoretical foundation of this study. We subsequently propose a research model and related hypotheses, elaborate on the research methodology and present the results of the data analysis. Next, we explore the core findings and their implications for theory and practice. Finally, we discuss the limitations of this study and potential future research directions.
Literature Review
Holistic Overview of DT Research
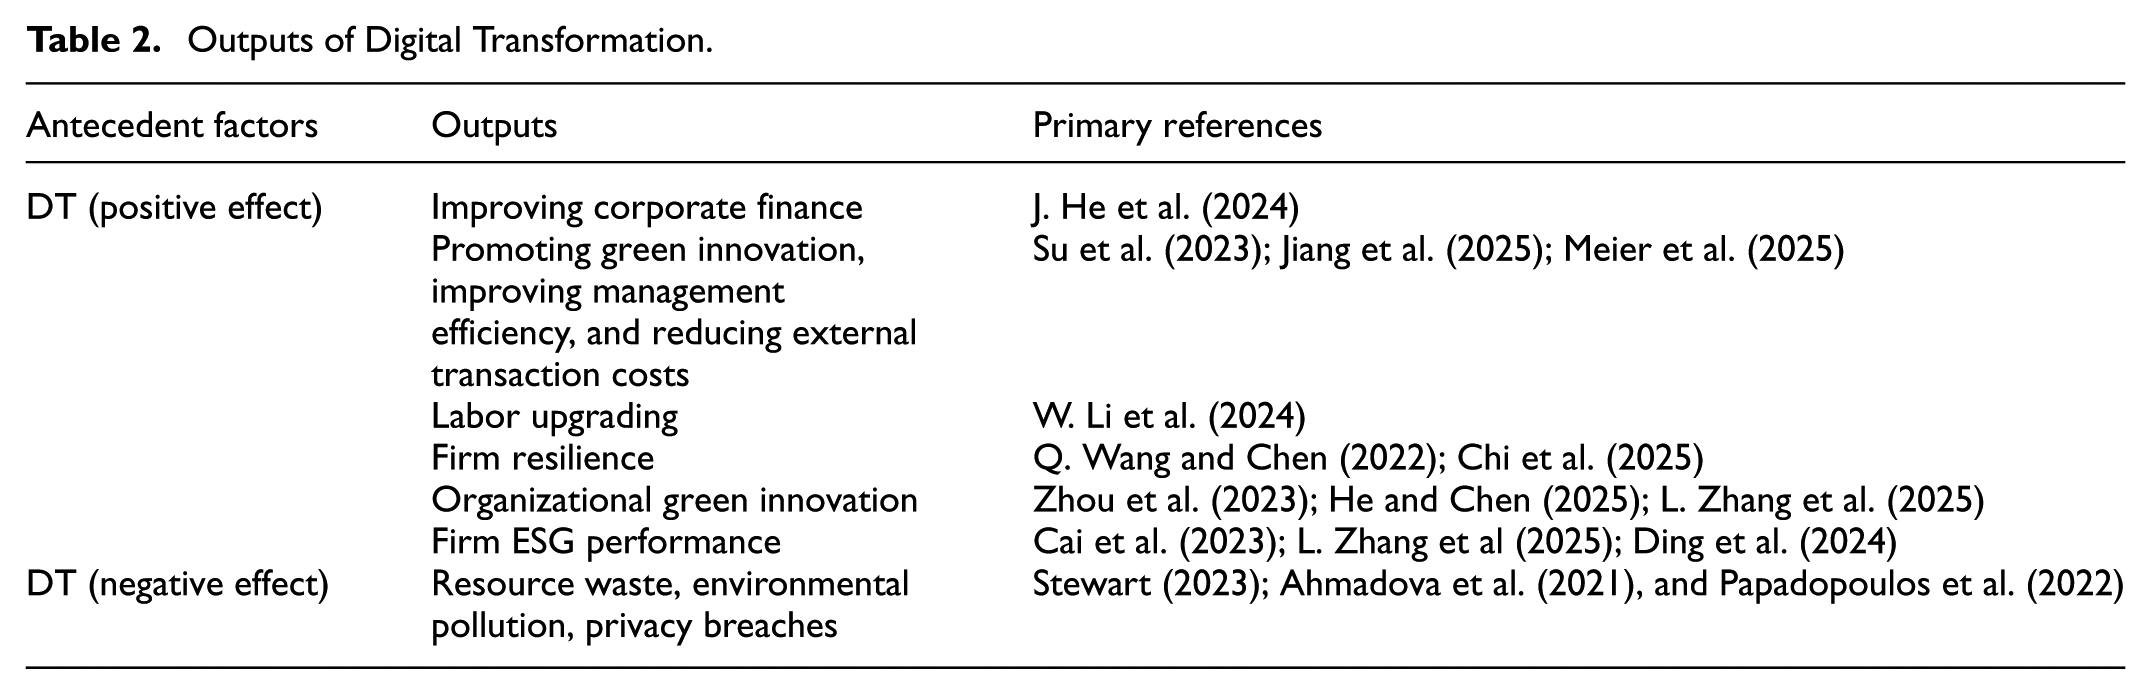
DT has been viewed as a product of transformations in IT (Lucas et al., 2013). Business model innovations resulting from DT are profoundly changing both the ways in which companies operate and consumers’ perceptions and behaviors (Verhoef & Bijmolt, 2019). Research on DT has permeated numerous fields, including research on educational innovation (Mohamed Hashim et al., 2022; Timotheou et al., 2023), business innovation (M. Liu et al., 2023), organizational management change (Abbu et al., 2022; J. Zhang & Chen, 2023), financial management (Q. Liu et al., 2023), city management (Sanina, 2024) and low-carbon development (Cai et al., 2023; Q. Zhu et al., 2023). The dominant research trends in this context can be broadly divided into two types: DT drivers and DT outputs (see Tables 1 and 2).
Primary Driver of Digital Transformation.

Outputs of Digital Transformation.
As shown in Table 1, studies on the drivers of DT have focused on exploring and identifying the internal and external drivers of enterprise DT. These rich findings reveal that the drivers of corporate digital transformation are complex: companies can advance their digital transformation by leveraging their own institutional strengths, financial resources, or talent advantages or by utilizing external resources such as supply chains, government policies, or open data (Baiyere et al., 2025; Butt et al., 2025; Held et al., 2025). Of course, fully integrating both internal and external resources also serves as a viable pathway for accelerating corporate digital transformation (Malik et al., 2024; J. Xue et al., 2025; Zhang et al., 2023).
Another major research focus on digital transformation explores its spillover effects. As shown in Table 2, digital transformation significantly enhances corporate resilience (Chi et al., 2025; Q. Wang & Chen, 2022), innovation capabilities (Meier et al., 2025; L. Zhang et al., 2025), ESG performance (Ding et al., 2024; L. Zhang et al., 2025), and the quality of human capital (W. Li et al., 2024). However, its negative effects also warrant attention; for example, Ahmadova et al. (2021) and Papadopoulos et al. (2022) have argued that the consumption of resources as a result of DT may increase. In other words, DT does not necessarily contribute to the green sustainability of businesses, as it may consume more resources or lead to more carbon emissions. Furthermore, digital security and privacy protection are issues that cannot be ignored in the DT context (Stewart, 2023). Accordingly, scholars such as Soto-Acosta (2024) have noted that future DT efforts should adhere to the principles of strategic vision, adaptability, and a human-centric approach and emphasize the importance of data assets.
DT and Customer Relationships
Although DT continues to be a popular focus of research, few studies have investigated the connections between DT and customer relationships. Although some scholars have explored these connections, their studies have not led to sustained interaction with this topic in the academic community (Kamalaldin et al., 2020; L. Liu et al., 2022).
DT cannot be accomplished without consumer involvement (Kamalaldin et al., 2020), and DT should thus be customer-centric (Soto-Acosta, 2024). As noted by Kamalaldin et al. (2020), DT requires companies to shift from traditional business–customer relationships to digital business–customer relationships. Although several scholars have begun to investigate the relationships between DT and customer concentration (L. Liu et al., 2022; Usman et al., 2025) and value cocreation (Matarazzo et al., 2020), these researchers have not explored the connection between DT and CRM in greater depth, with the exception of Gil-Gomez et al. (2020), who viewed CRM as a green tool that can be used to promote the transformation and sustainability of firms. In particular, few empirical studies have investigated the relationship between DT and business–customer relationships. Some scholars, such as Demirel (2022), have empirically explored the impact of digital services on CRM via questionnaires, and the findings reported by such researchers have suggested that digital services can help increase customer satisfaction (Bilgihan et al., 2025; Neto & Chiarini, 2021; Shu & Srimuang, 2025; Zhang et al., 2023).
As noted by Kamalaldin et al. (2020) and Soto-Acosta (2024), data-driven approaches must be customer-centric, as this process creates potential economic benefits for consumers while fostering customer relationship development. However, a review of existing research reveals that studies predominantly focus on the antecedents and outcomes of DT (economic and social aspects), while few studies explore the relationship between DT and CRM (Kamalaldin et al., 2020; G. Liu et al., 2025; Soto-Acosta, 2024). Against the backdrop of “sustainable development,” research shifting from traditional “economically centered” approaches toward “customer-centered” perspectives urgently requires further exploration in terms of both quantity and depth. Therefore, it is necessary to delve into the potential relationship between DT and customer relationship management from the customer perspective, with a focus on customer–firm interactions.
Theories and Hypothesis
Expectation Confirmation Theory
Oliver (1980) developed expectation confirmation theory, which has been used to assess levels of customer satisfaction in various contexts. This theory has subsequently been widely used to explain the relationships among customer expectations, expectation confirmation, customer satisfaction, and postevent behavior. Previous studies on this topic, such as that conducted by Ashfaq et al. (2020), have examined users’ satisfaction with and continuance intentions toward artificial intelligence (AI)-driven service agents. In addition, expectation confirmation theory has been widely used to analyze customers’ behavior and willingness in various scenarios, such as online shopping (H. Zhu et al., 2021), m-commerce applications (Guerola-Navarro et al., 2024; Wen et al., 2022), rural destinations (C. Wang et al., 2021), medical tourism (Mahmood et al., 2020), e-government services (Alruwaie et al., 2020; Sukma & Leelasantitham, 2022; Veeramootoo et al., 2018) and other services.
Expectancy confirmation theory has certain advantages for explaining customer satisfaction because it accurately reflects the cognitive–behavioral processes in which individuals engage (Fu et al., 2018). The main reasons for these benefits are as follows. First, as an ex ante construct, the expectation concept not only represents an individual’s beliefs regarding a firm’s service but also provides a baseline for the formation of evaluative judgments concerning the service (Fu et al., 2018; Jomnonkwao et al., 2015; Waheed et al., 2022; H. Zhu et al., 2021). In other words, this concept refers to an individual’s prediction of the possible future consumption of a particular service/product, which can positively influence the level of service quality that the individual in question perceives during the consumption process (Mahmood et al., 2020; Sukma & Leelasantitham, 2022). On the other hand, acknowledgment is rooted in the customer’s assessment of perceived service performance relative to his or her initial expectations (Fu et al., 2018; Oliver, 1980). In addition, expectations are often viewed as a key source of direct satisfaction. Fu et al. (2018) confirmed that high customer expectations are likely to increase customer satisfaction. In conclusion, consumers expect to gain more benefits (e.g., better customer relationships) from the DT of their organizations; therefore, this study relies on expectation confirmation theory as a theoretical foundation.
Research Model Construction and Hypothesis
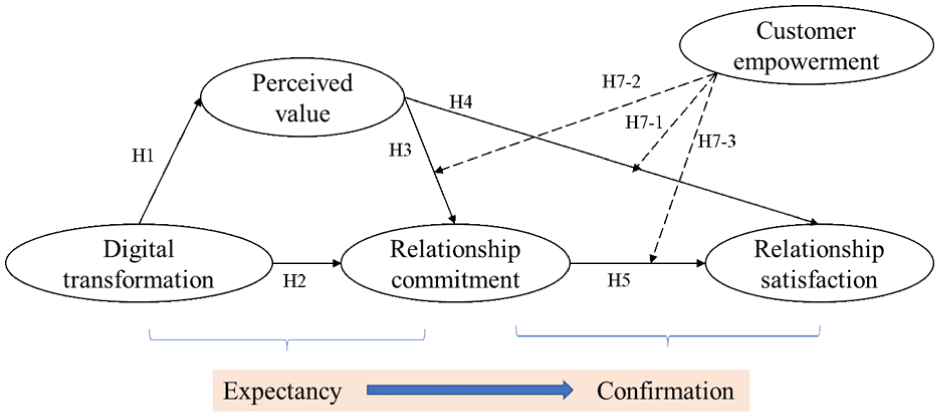
DT places greater demands on business–customer relationships (Papadopoulos et al., 2022). Accordingly, this study aims to empirically investigate the mechanisms underlying the impact of corporate DT on the development of customer relationships from the perspective of consumers. As illustrated in Figure 1, perceived value (PV) represents a prerequisite for the emergence of customer relationship commitment (RC) and customer relationship satisfaction (RS).
Research model.
Relations Between DT, PV, and RC
According to Verhoef and Bijmolt (2019), technology, competition, and customer behavior in the context of digitalization are the key elements that drive DT in enterprises. In other words, companies must undergo DT because this transformation can help them innovate, develop, and improve their future competitiveness (L. Li, 2022; Z. Li et al., 2021; L. Liu et al., 2022; M. Liu et al., 2023). In fact, DT is an ongoing process that involves a win–win situation for both businesses and customers. For example, digital technology allows consumers to participate in the design and development processes pertaining to a company’s products. Value cocreation through customer engagement encourages customers to participate in business activities such as corporate decision-making or to help other customers by sharing product reviews online (Bilgihan et al., 2025; Hauke-Lopes et al., 2022; Stegmann et al., 2021; Verhoef & Bijmolt, 2019).
Previous studies on this topic have reported that digitalization has dramatically changed the business–customer relationship, for example, by leading to a tighter provider–customer relationship logic, long-term commitments, and greater investment in the relationship (Bilgihan et al., 2025; Kamalaldin et al., 2020; Reim et al., 2018). In summary, consumers do not simply expect to obtain material benefits from companies’ DT efforts; rather, they expect to receive more care and assistance, including through interactions with sellers and the sharing of information. Therefore, this study proposes the following hypotheses:
Relations Between PV, RS, and RC
Establishing a good business relationship requires relevant actors to comply with the principle of mutual benefit. Specifically, business–customer relationships should seek to ensure a win–win situation for both the company and the customer (Dagger et al., 2011). The results reported by Itani et al. (2019) suggest that the quality of the relationships between customers and firms can be enhanced when customers perceive more gains (perceived benefits/value). Furthermore, expectation confirmation theory suggests that the extent to which customers’ expectations of a given product (service) are confirmed significantly affects customers’ post facto behavior (Huang et al., 2022; S. Li et al., 2019), their continuous use behavior (Chauhan et al., 2021; Kumar & Shankar, 2025; Lee & Kwon, 2011; S. Li et al., 2019), customer–provider relationships (Lee & Kwon, 2011; Kamalaldin et al., 2020) and customer satisfaction (Fu et al., 2018; Huang et al., 2022; Lee & Kwon, 2011). As noted by Lee and Kwon (2011), if interactions are perceived as providing confirmation, this situation leads to the expectation that such positive interactions will be repeated in the future, thus encouraging the establishment of intimate relationships. In a digital environment, DT requires companies to transition from traditional business–customer relationships to digital business–customer relationships (Kamalaldin et al., 2020; Soliman et al., 2025). Therefore, the following hypotheses are proposed:
Relations Between RC and RS
The relationship between commitment and satisfaction has been widely verified. Typical studies, such as the research conducted by Baker et al. (2017), have suggested that intimate relationships are maintained on the basis of relevant actors’ commitment to that relationship. The results of previous research on this topic have supported the positive claim that RC affects RS (Ito et al., 2021; Kumar & Shankar, 2025; Soliman et al., 2025). K. Tan and Agnew (2016), Ito et al. (2021) and Kalubanga and Namagembe (2022) reported that perceptions of commitment improve consumers’ certainty and positivity regarding future relationships. Such feelings also profoundly affect the length of the relationship, as well as an individual’s own RS.
Mediationg Effect of PV
Kamalaldin et al. (2020) argued that traditional business–customer relationships must be transformed in the digital era because digital communication technologies and internet technologies have enhanced the connections between businesses and their customers. The business–customer relationship in the digital age focuses on value cocreation. Research has reported that value cocreation is an effective way of increasing customer satisfaction. For example, Corsaro and Snehota (2010) investigated the value of product provider–customer relationships. The results reported by Vega-Vazquez et al. (2013) subsequently revealed that value cocreation can improve customer satisfaction. Similar studies have revealed that customers’ PV (in terms of economic benefits, social benefits, relational benefits, and spiritual benefits) has important influences on customer loyalty (Y. C. Chen et al., 2025; El-Adly, 2019), customer satisfaction (El-Adly, 2019), and the quality of business–customer relationships (J. Chin & Lin, 2015; Sayil et al., 2019). In summary, enterprises’ DT not only provides enterprises with profits but also offers potential benefits to consumers. When customers perceive more benefits from a company’s DT, they may be more willing to establish or develop a relationship with the company in question. On this basis, this research proposes the following hypotheses.
Moderationg Effect of CE
Digital business–customer relationships cannot be established without both customer participation and business support (Acayip et al., 2026; Kamalaldin et al., 2020; Xie et al., 2020). In this context, the term “corporate support” refers to customer empowerment (CE). This research relies on the definition of CE provided by Ramani and Kumar (2008): firms support customers’ efforts to share information, participate in service design, and interact with service employees. According to the theory of customer engagement, as a result of differences among individual customers, the level of interaction between customers and a company and the degree to which the company’s resources are used may also differ. The level and quality of interaction between an individual and a company may change when the company provides external support (Maier & Baccarella, 2025). Previous research has indicated that empowerment enhances self-efficacy and a sense of belonging, further enabling consumers to derive greater emotional and psychological benefits (Shukla et al., 2023). Empowerment also increases consumer engagement, satisfaction, and subjective well-being (Hollebeek & Belk, 2021). According to the latest findings by Amin et al. (2025), empowerment significantly influences the relationship between consumers’ perceived benefits and satisfaction. In short, customer empowerment not only expands consumers’ freedom of choice but also strengthens their ability to access information, thereby stimulating brand enthusiasm and loyalty. Accordingly, this research proposes the following hypotheses:
Research Design and Data Collection
This questionnaire survey was conducted after ethical approval was obtained from the relevant research ethics committee, and subsequent tasks were carried out with the consent of the respondents. The population investigated in this study consisted of Chinese consumers who have experience with corporate interactions (i.e., by providing feedback to or making demands of companies). This study collected data by employing two methods: an online professional questionnaire collection platform, Wenjuanxing (https://www.wjx.cn), and a market association. To more effectively control the quality of the questionnaire, the researcher also added a screening question at the beginning of the questionnaire: “Have you ever had an experience that involved interacting with a company (for example, by providing your opinion or making requests)?.” Respondents who possessed related experience were invited to continue to complete the questionnaire; otherwise, the questionnaire completion process ceased.
The first part of the questionnaire described the purpose and requirements of this research tool and contained basic questions that aimed to collect the sociodemographic characteristics of the respondents. The main part of the questionnaire was used to collect relevant data. As in most studies, all relevant items were scored on a seven-point Likert scale. The measurement of DT was developed on the basis of the research conducted by Verhoef and Bijmolt (2019), Nasiri et al. (2020), Stegmann et al. (2021) and Hauke-Lopes et al. (2022); Pan et al. (2025). The 5 items used to measure PV were adapted from El-Adly (2019), J. Chin and Lin (2015) and Sayil et al. (2019). The measurements of RC and RS were developed based on previous studies conducted by K. Tan and Agnew (2016), Ito et al. (2021) and Kalubanga and Namagembe (2022). The items used to measure CE were drawn from Pranic and Roehl (2012), Kamalaldin et al. (2020) and Xie et al. (2020); see Table A1.
Prior to the formal distribution of the questionnaire, experts and professors working in fields pertaining to DT and marketing were first invited to check the content of the questionnaire. Subsequently, 50 volunteers were recruited offline to participate in a pretest. These volunteers were asked to provide feedback concerning the presentation of the questions, their comprehensibility, and other topics. Finally, the researcher revised the questionnaire in accordance with the feedback received from the volunteers.
The questionnaire was completed between April and June 2025. Ultimately, 643 questionnaires were collected, and 545 (effective recovery rate = 84.75%) valid questionnaires remained after questionnaires that featured identical responses or that were completed in less than 90 s were removed. This research relied on the suggestions of W. W. Chin and Newsted (1999), Ringle et al. (2012) and Jackson et al. (2013) regarding appropriate criteria for the sample size requirement; that is, this figure was calculated by multiplying the number of items by 10. In this research, 25 items were used; therefore, more than 250 valid questionnaires (25 × 10) were required to meet the criteria for analysis.
As indicated in Table 3, the respondents exhibited a wide gender gap; that is, the sample contained 192 males (35.2% of the total) and 353 females (64.8%). In terms of the age distribution, more than half of the respondents were younger than 30 years. Most respondents worked as employees of companies (65.7% of the respondents were corporate employees). In terms of income, more than 25% of the respondents earned between 5,000 and 7,000 RMB, with the incomes of the remaining respondents distributed relatively evenly. This survey covered multiple industries, including manufacturing, tourism, catering, education, and logistics. Manufacturing had the highest proportion (27.9%), followed by education (20.9%) and catering (18.2%).
Respondents Profile.
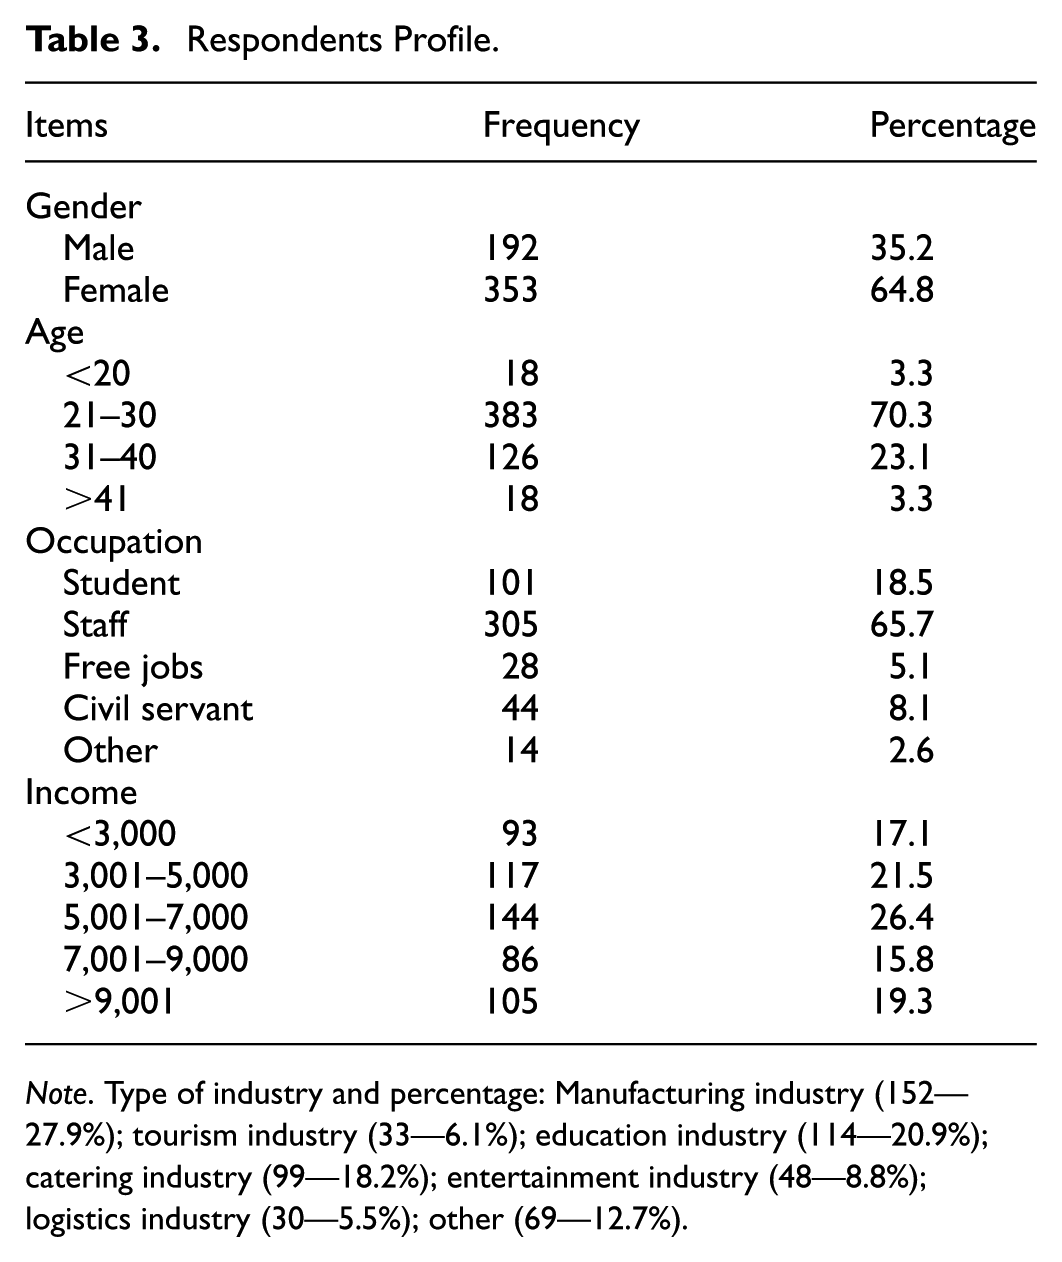
Note. Type of industry and percentage: Manufacturing industry (152—27.9%); tourism industry (33—6.1%); education industry (114—20.9%); catering industry (99—18.2%); entertainment industry (48—8.8%); logistics industry (30—5.5%); other (69—12.7%).
Results
Importantly, most of the data obtained for this study were self-reported under the same constraints; thus, Harman’s single-factor test was used to examine the possibility of common method bias (Podsakoff et al., 2003). According to the criterion suggested by Podsakoff et al. (2003), the greatest variance explained before rotation should generally not exceed half (50%) of the total variance explained. In this research, the greatest variance value was 41.72%, which was less than 50%, thus indicating the lack of any significant common method bias.
SPSS 26 software was used to perform Bartlett’s test and the Kaiser–Meyer–Olkin (KMO) test to confirm the suitability of the original items for factor analysis. The KMO value was 0.947, that is, greater than 0.70, thus indicating that the measurement model could be subjected to confirmatory factor analysis (CFA; Hair et al., 2011; Hair et al., 2016). The structural model and associated hypotheses were then tested with the assistance of Mplus 8.0.
Measurement Model Evaluation
The concept of reliability indicates the stability and consistency of the results obtained from a measurement model. Cronbach’s alpha coefficient is typically used to measure structural reliability (Lowry & Gaskin, 2014). The results presented in Table 3 reveal that the Cronbach’s alpha coefficients pertaining to each potential configuration surface ranged from .713 to .887, thereby exceeding the recommended threshold of .60 (George & Mallery, 2003).
Validity reflects the degree to which a test or measurement instrument actually measures what it is intended to measure. Validity tests include convergent validity and discriminant validity tests (Cheng et al., 2018). As indicated in Table 3, the factor loading values observed in this context ranged from 0.780 to 0.881. Furthermore, all composite reliability (CR) values presented in Table 3 were greater than 0.7. In addition, all average variance extracted (AVE) values exceeded the recommended threshold of 0.5. In addition, the R2 values ranged from .609 to .753, thus indicating that the data were internally consistent (Hair et al., 2011; Hair et al., 2016). Therefore, the reliability of the composition of the measurement model was good.
Discriminant validity focuses on the fact that the observed values should be distinguishable from each other when different methods are used to measure different constructs. Hair et al. (2011), Hair et al. (2016) argued that sufficient discriminant validity is indicated if the values shown on the diagonal (i.e., the square roots of the AVE values) are greater than any other relevant value. As indicated in Table 4, the discriminant validity of this measurement model indicated its reliability.
Details of Discriminate Validity.

Note. Bold black numbers represent the square root of AVE value. DT = digital transformation; PV = perceived value; RC = relationship commitment; RS = relationship satisfaction; CE = customer empowerment.
Structural Model Evaluation
It was necessary to evaluate the overall fit of the model before the hypotheses were tested. All fit indices (e.g., SRMR = 0.023, CFI = 0.969, and RMSEA = 0.054) were in line with the thresholds (e.g., CFI ≥ 0.95, RMSEA ≤ 0.06, SRMR ≤ 0.08) recommended by Hu and Bentler (1999) and Kline (2016), thus indicating that this hypothetical model could accurately reflect the actual research scenario.
Hypothesis Analysis
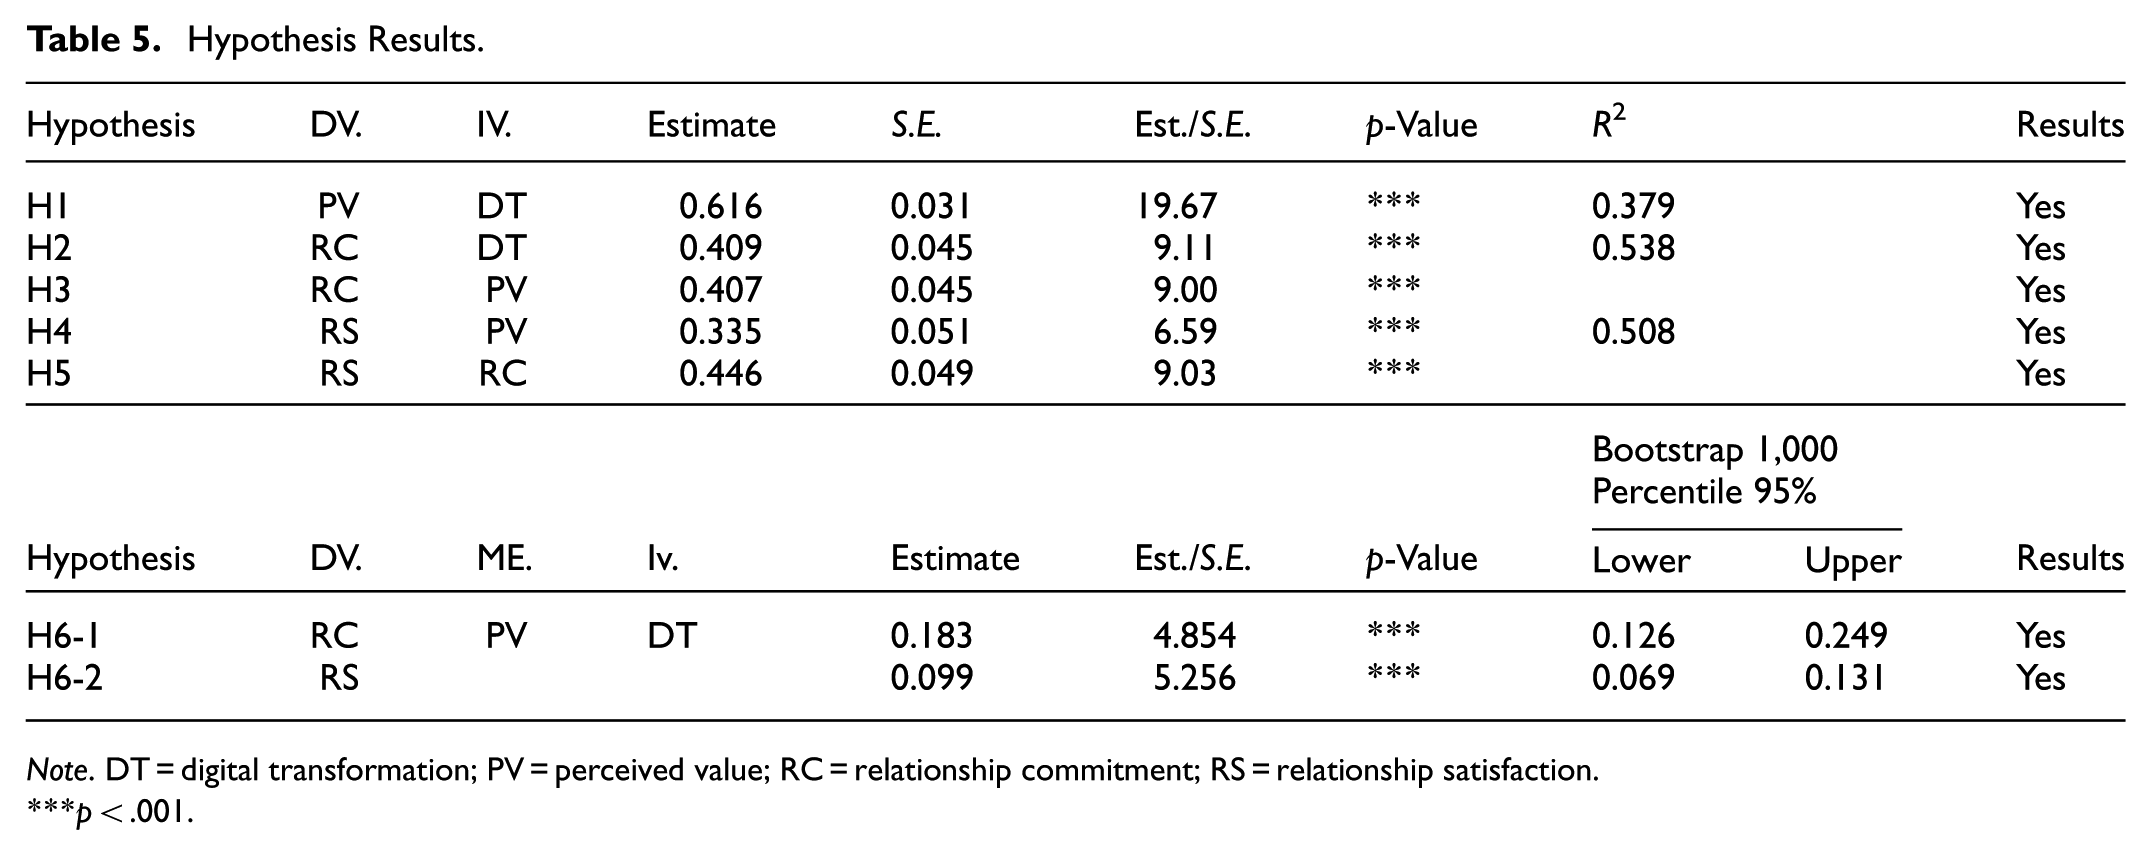
The direct effect of DT on PV was significant (β = .616, p < .001); thus, H1 was supported. DT also had a positive effect on RC (β = .409, p < .001); accordingly, H2 was also supported. In addition, the relationships among PV, RC, and RS were confirmed (β = .407, p < .001; β = .335, p < .001). Finally, H5 proposed that RC would have a significant influence on RS, and such an influence was observed (β = .446, p < .001); thus, H5 was also supported. The details are presented in Table 5.
Hypothesis Results.
Note. DT = digital transformation; PV = perceived value; RC = relationship commitment; RS = relationship satisfaction.
p < .001.
The presence of the mediating effect was tested by performing 5,000 bootstrap calculations with the assistance of Mplus 8.0. PV had a significant mediating effect on the relationships among DT, RC (β = .183, p < .001), and RS (β = .099, p < .001). Specifically, the coefficients of both indirect paths were greater than 0, the p values were less than .001, and the 95% confidence interval did not contain 0. Therefore, H6-1 and H6-2 were valid.
In this study, the PROCESS macro for SPSS (Hayes et al., 2017) was used to test the moderating effect of CE. The relationship between PV and RC was significantly influenced by CE (β = −.14, p < .001), and the 95% confidence interval did not contain 0 (LLCI = −0.18, ULCI = −0.097); thus, H7-1 was supported. The negative moderating effect of CE on the relationship between PV and RC was significant (Figure 2). This research also examined the moderating effect of CE on the relationship between PV and RS. The results indicated that this moderating effect was not significant (β = −.034, p > .05; LLCI = −0.318, ULCI = 0.047). In contrast, the moderating effect of CE on the relationship between RC and RS was significant (β = −.06, p < .001), and the 95% confidence interval did not contain 0 (LLCI = −0.12, ULCI = −0.01); thus, H7-3 was supported, whereas H7-2 was unsupported. The results presented in Figure 3 also indicate that CE weakened the effect of RC on RS.
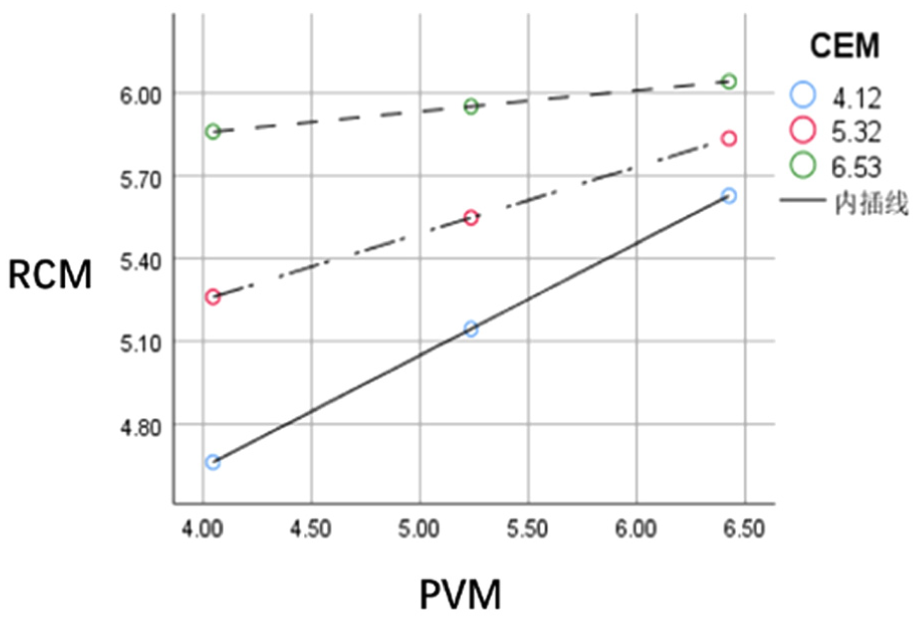
Moderation effect of CE between PV and RC.
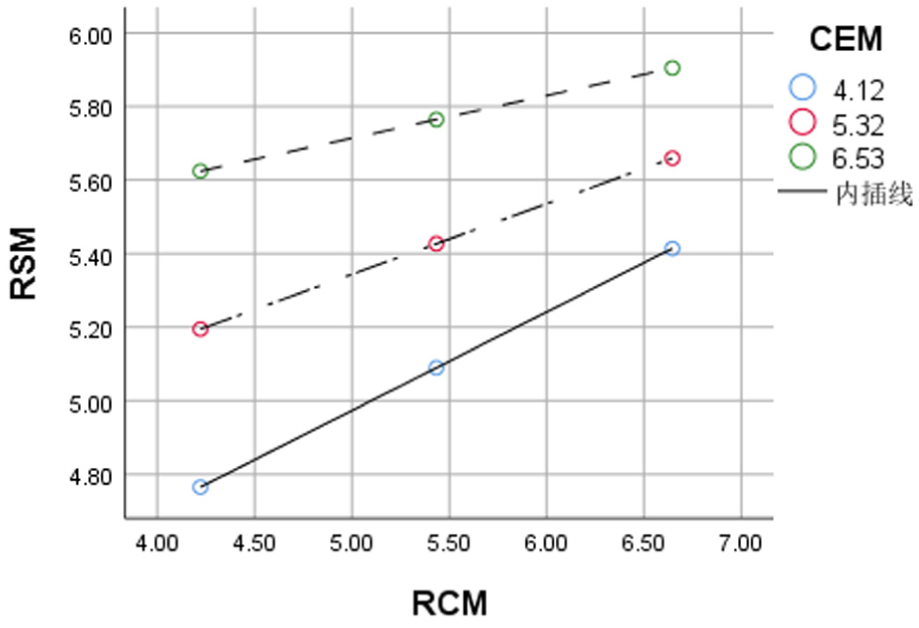
Moderation effect of CE between RC and RS.
Artificial Neural Networks (ANN)
An ANN is a computational model that simulates the network structure of a biological nervous system (Foo et al., 2018; L. Wang et al., 2023). This analytical tool has been identified as an effective complement to SEM because it can compensate for the inability of SEM to analyze nonlinear relationships (L. Wang et al., 2023), and it does not require the satisfaction of an excessive number of conditional assumptions, such as normality or linearity (Foo et al., 2018; K. Leong & Morris, 2015). This approach has been used to investigate issues such as tourists’ travel attitudes or behaviors (W. Zhang & Wang, 2023), green development (Foo et al., 2018), and commerce livestreaming (L. Wang et al., 2023), and it has played an important role in efforts to explore the nonlinear relationships among relevant elements (Leung & Bovy, 2019; Teo et al., 2015).
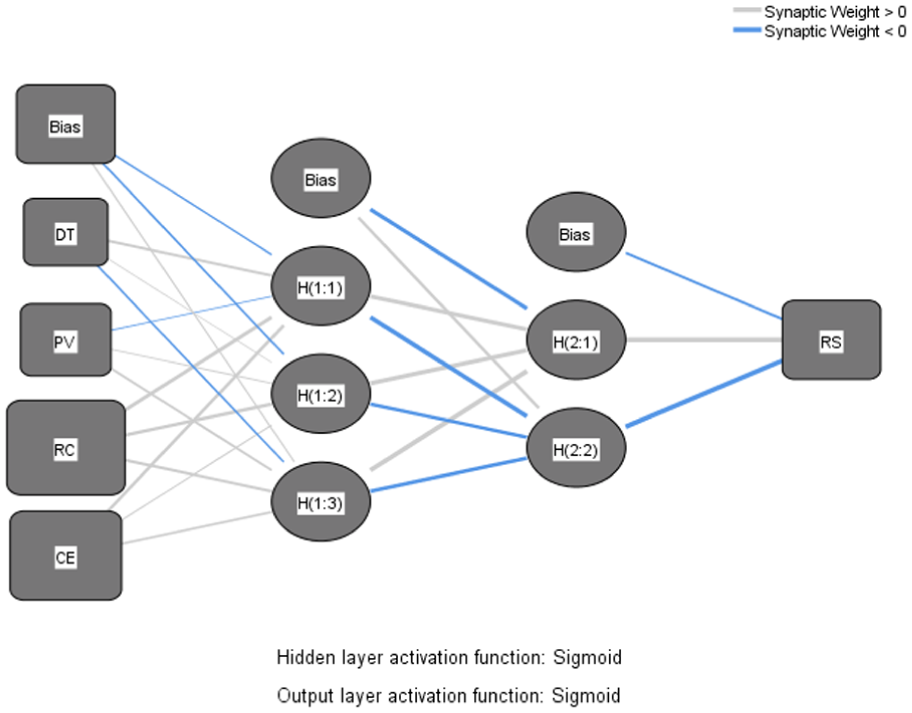
A multilayer perceptron (MLP) is a common feedforward neural network model whose structure consists of multiple layers of neurons (L. Wang et al., 2023; Zeinalizadeh et al., 2015). A neural network model generally consists of an input layer, a hidden layer, and an output layer. Each layer included in the ANN model is fully connected to the subsequent layer. Specifically, each layer consists of neurons that are connected to other neurons in the subsequent layer, and each connection is represented by a synaptic weight.
In accordance with the suggestions of G. W. H. Tan et al. (2014) and Liébana-Cabanillas et al. (2018), this study uses only the statistically significant predictors that were obtained via SEM pertaining to the ANN model. In Figure 4, the ANN research model introduces DT, PV, RC and CE as input neurons. RS is included as an output neuron. As indicated in Figure 4, the predictive relevance of the resistances was verified since each input neuron (i.e., PV) was connected to three hidden neurons via nonzero synaptic weights, thus suggesting a nonlinear combination between the input and intermediate layers.
ANN model for RS.
To prevent overfitting, this study used a cross-validation program included in SPSS 26 software itself, in which 90% of the data were used for training, whereas the remaining 10% were used for testing (C. T. Leong et al., 2024). All the root mean square error (RMSE) values (Table 6) indicate high prediction accuracy, as they are relatively small, with values ranging from 0.078 to 0.085.
RMSE Values for RS.
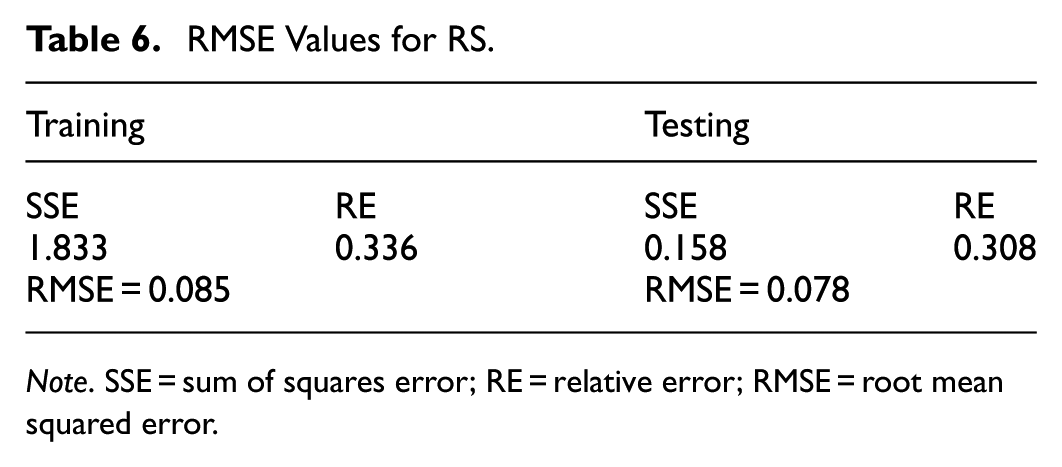
Note. SSE = sum of squares error; RE = relative error; RMSE = root mean squared error.
In this study, the research method suggested by C. T. Leong et al. (2024) was used to calculate the normalized importance (i.e., the ratio of the relative importance of each variable to its highest relative importance) of the determining factors. Additionally, this study ranked the independent variables based on the normalized relative importance of the dependent variable in Table 7 and Figure 5. Specifically, RC makes the greatest contribution to RS (importance value = 100%), followed by CE (importance value = 82.7%) and PV (importance value = 29.1%), and DT has the weakest impact on RS (importance value = 13.3%).
Independent Variable Importance.

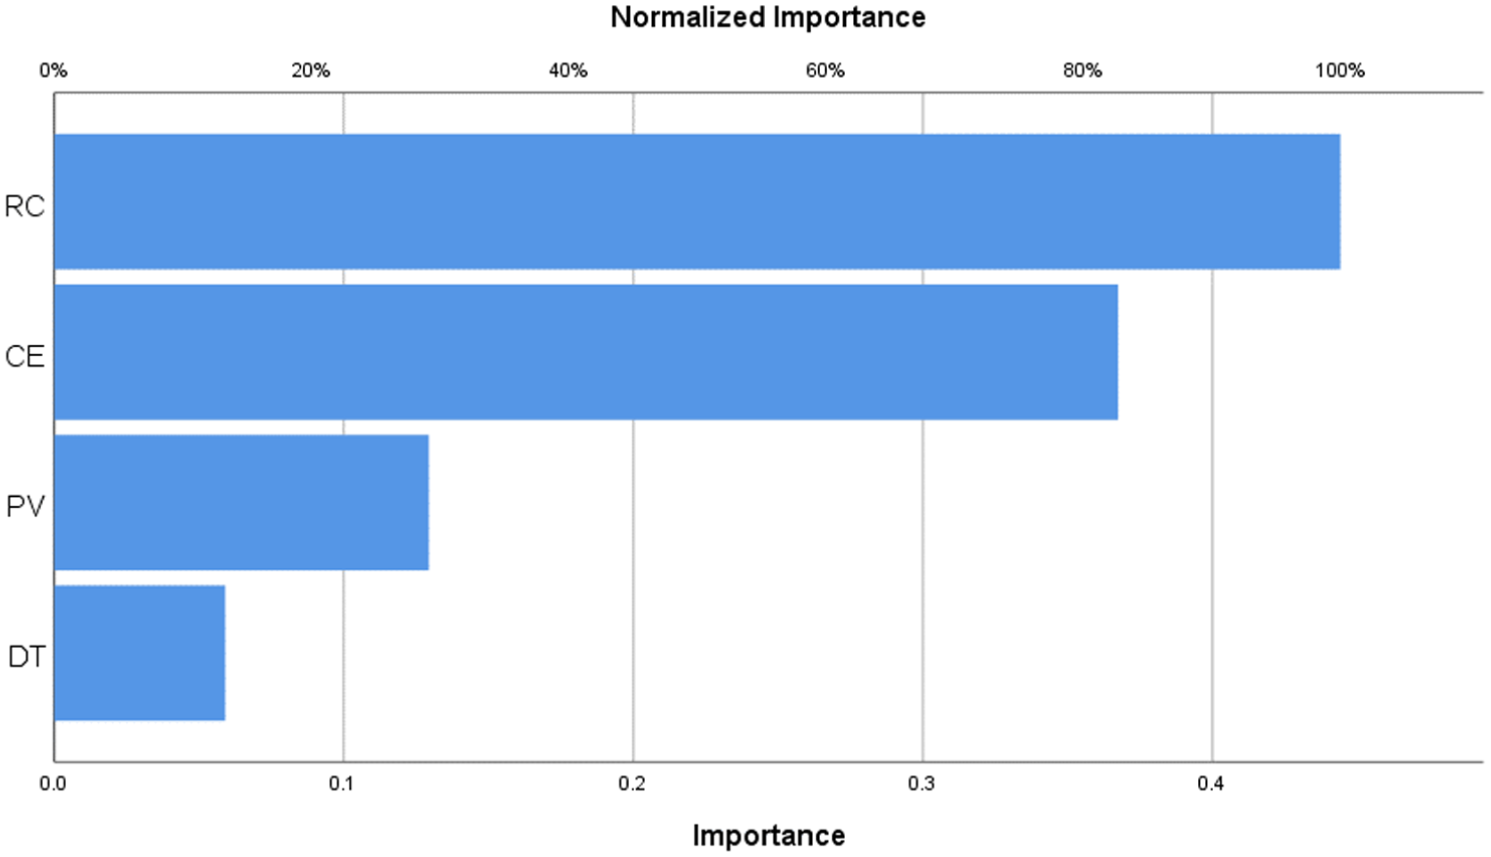
Independent variable importance chart.
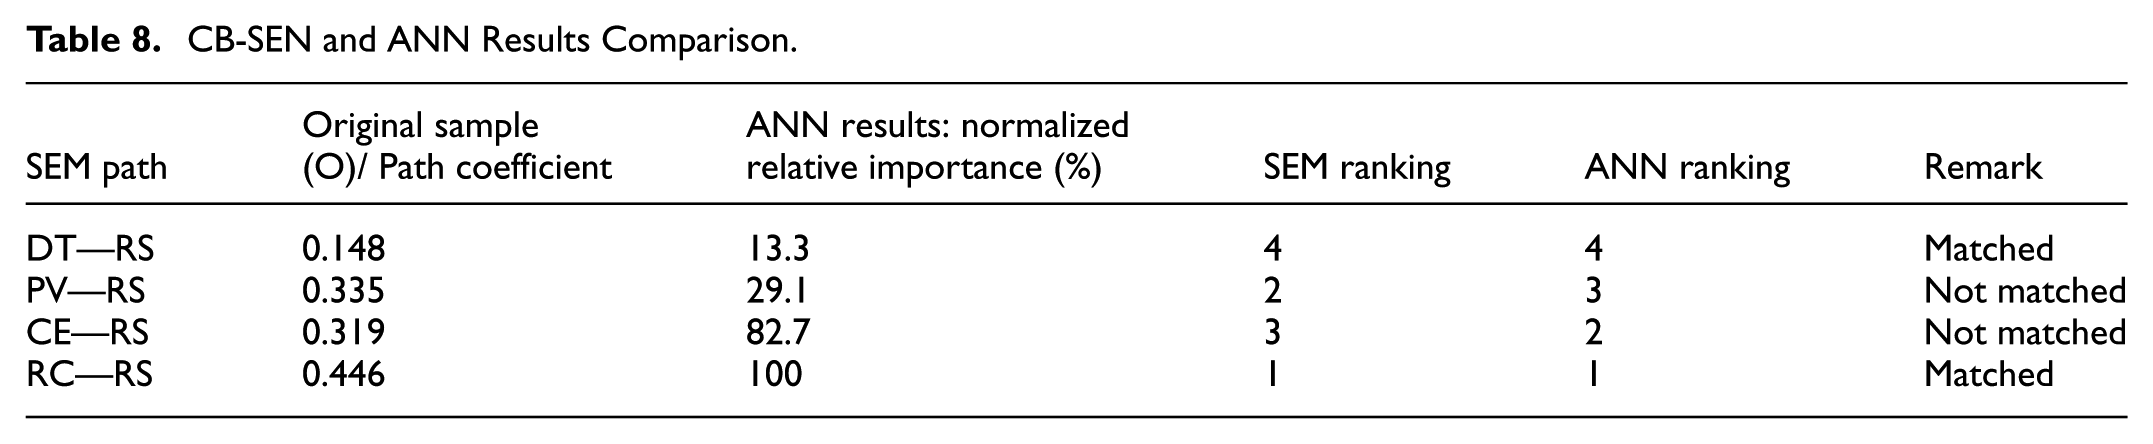
Finally, this study ranked and compared the significant predictor variables in the research model (Table 8). The CB-SEM ranking is based on path coefficient magnitudes, whereas the ANN ranking is based on the standardized relative importance. The results indicate inconsistent rankings for CE and PV across the CB-SEM and ANN models. This finding suggests that latent attributes influencing the role of RS may exist in practical contexts or that the interrelationships among these variables cannot be fully explained from a linear perspective alone (C. T. Leong et al., 2024; Y. Wang et al., 2022).
CB-SEN and ANN Results Comparison.
Conclusion and Discussion
Main Findings
Based on expectation confirmation theory, this study empirically investigates the relationship between DT and business–consumer relationships. The main findings of this research are as follows.
First, the DT efforts of a business, such as its use of technologies, significantly affect consumers’ PV (β = .616) and RC (β = .409). As noted by Kamalaldin et al. (2020) and Li (2022), DT not only is an effective way in which companies can become more competitive and potentially profitable but also offers potential benefits to consumers.
Second, consumers are more satisfied with the business—consumer relationship when they perceive more value from the business’ DT, and this result is consistent with the findings reported by S. Li et al. (2019) and Huang et al. (2022). In other words, consumers evaluate their input–output ratio in their interactions with companies, and they positively evaluate the quality of their relationships with companies when they believe that they can obtain additional value (or benefits) by doing so; in the opposite situation, they may be reluctant to establish good relationships with companies.
Third, the relationship between RC and RS is validated (β = .446). This finding is in line with the results of previous studies, such as those reported by K. Tan and Agnew (2016), Ito et al. (2021) and Kalubanga and Namagembe (2022).
Fourth, the mediating effects of PV on the relationships among DT, RC, and RS in companies are also tested. The findings reveal that PV plays a partially mediating role in the relationship between DT and RC (β = .183). Specifically, DT can affect consumer RC both directly and indirectly via perceived access. Moreover, PV mediates the relationship between DT and RS (β = .099). These conclusions are similar to the findings reported by El-Adly (2019) and other researchers.
In addition, this study is the first to demonstrate how CE affects customer satisfaction in the context of DT based on the theory of customer engagement. In line with the suggestions of Ramani and Kumar (2008), the level of CE is reflected in a company’s level of support for customers’ efforts to share information, participate in service design, and interact with service employees. In other words, companies must provide more support and services to customers in the context of DT to prevent or reduce customer “digital anxiety” (Ren et al., 2025). The positive role played by empowerment in corporate DT has been demonstrated; for example, recent research has reported that employee psychological empowerment mediates the relationship between corporate DT and corporate performance (Muneer et al., 2024). Furthermore, Ye et al. (2025) examined the notable positive impact of psychological empowerment on hotel employees’ work engagement in the context of DT.
Finally, in addition to the linear prediction results obtained via SEM, this study innovatively identifies nonlinear relationships among DT, PV, RC, and CE and RS by employing a new research methodology (i.e., ANNs). Specifically, CE and PV have the strongest effects on RS, whereas DT has the weakest effect on RS. These new discoveries enrich relevant research in the field of DT.
Contributions
This study contributes to our theoretical understanding of this topic in the following ways.
First, most previous studies on enterprise DT have focused primarily on the enterprise level (Ahmadova et al., 2021; Soto-Acosta, 2024). For example, they have sought to address the following questions: What factors affect the DT of enterprises? What impacts does enterprise DT have on enterprises themselves (e.g., in terms of firm innovation)? In contrast, this research explores the relationship between DT and business–customer relationships from the perspective of relationship management. This study, which represents one of the earliest attempts to investigate the connections between DT and business–customer relationships, builds a theoretical model based on expectation confirmation theory and reveals the positive effects of DT on business–customer relationships. Future researchers can build on this foundation to explore business–customer relationships in the digital era in further detail.
Second, many scholars, such as Pagani and Pardo (2017), Vendrell-Herrero et al. (2017) and Verhoef et al. (2021), have argued that digital technologies can reshape consumers’ preferences, create new value for consumers and change company–customer relationships. However, most of these studies have been theoretical in nature and have not empirically tested relevant hypotheses. This research tests such hypotheses empirically on the basis of expectation confirmation theory, thereby testing and supporting existing theoretical conjectures and providing strong support for existing theories in this context: (a) This study empirically tests the reliability of expectancy confirmation theory, especially in the context of customer satisfaction in the digital era. (b) Previous studies have used expectation confirmation theory to investigate problems pertaining to customer satisfaction in the fields of urban transportation (Fu et al., 2018) information and communication (Diegmann et al., 2017); however, few attempts have been made to investigate this topic in the field of DT. This study relies on expectancy confirmation theory to investigate such problems with customer relationship management in the context of DT, thereby not only expanding the scope of application of this theory but also providing a theoretical foundation for future research.
Third, this research incorporates the moderating role played by CE in the development of the business–customer relationship using the theory of customer engagement. Interestingly, the results reveal that the moderating effects of CE on both RC and RS are negative. These results may be related to the excessive CE exhibited by companies (Ramani & Kumar, 2008; Xie et al., 2020). In other words, companies expect to obtain more information through CE at the beginning of the DT process to improve the quality of their services (e.g., by providing personalized products or services), but this requirement may increase the burden on customers (Ramani & Kumar, 2008; Xie et al., 2020). This study incorporates the results of previous studies conducted by scholars such as Ren et al. (2025) and Maier and Baccarella (2025) and argues that the CE implemented by enterprises as part of their DT should be moderate rather than unlimited (Ramani & Kumar, 2008; Xie et al., 2020). Specifically, excessive CE actually increases customer pressure and is not conducive to efforts to promote business–customer relationships. Notably, the moderating effect of CE varies across different contexts. For instance, CE does not significantly moderate the relationship between PV and RC. In our interpretation of this finding, PV’s initial response to RC as a reward stimulus (i.e., RS) may not substantially influence the response to CE.
Finally, whereas most previous studies on this topic have used a single research methodology and focused exclusively on the direct relationships among factors, this research uses a combination of research methods involving Mplus (CB-SEM) and ANNs to explore the complex relationships among the relevant factors. This relatively new research method can increase the diversity of empirical research methods used in the field of DT. This research relies on analytical methods rooted in ANNs and attempts to highlight the importance of DT for efforts to improve customer relationships. This approach offers a new method that can be used in research in the fields of DT and CRM, thus indicating that the directions for future research identified by this study could focus not only on the importance of linear causal relationships among key elements but also on further exploration of the nonlinear relationships among these elements (in terms of differences in importance).
In addition to their theoretical contributions, the results of this study provide some practical insights into business–customer relationships in the context of DT.
First, companies should be aware that it is feasible to enhance business–customer relationships via DT. Companies can enhance RC via DT, and they can facilitate business–customer relationships by providing additional value to customers. For example, companies can communicate the benefits and value of DT to consumers with the goal of eliciting a stronger sense of gain in consumers, thus inspiring commitment and satisfaction with the relationship. Additionally, enterprises need to enhance the adoption and promotion of digital technologies, using them to shape their corporate image (for example, by demonstrating strong social responsibility) and to strengthen customer relationships (Guerola-Navarro et al., 2022; Maier & Baccarella, 2025). The reason is that customer relationship management is viewed as a form of green IT that can facilitate corporate digital transformation (Gil-Gomez et al., 2020; Pan et al., 2025).
Second, the results of this research suggest that RC is a prerequisite for RS. To increase customer RS, companies must make this process more rewarding for consumers. Specifically, business managers must ensure that customers perceive value (e.g., a sense of security, support, or good service) during the process of DT. Consumers’ willingness to commit to a relationship increases when they believe that they have received the expected rewards. This factor is particularly important because RC has been reported to have a positive effect on RS (Dagger et al., 2011; Goodwin & Gremler, 1996). For example, on the basis of additional market research, product innovation, user feedback, and technical support, business operators can improve the perceived benefits that they offer to customers and increase customers’ willingness to establish lasting business–customer relationships. Alternatively, enterprises can exploit the potential of DT to protect the security and stability of the supply chain by effectively decreasing the information gaps among enterprises in the chain, improving corporate governance, alleviating customers’ concerns regarding the authenticity of corporate performance, providing differentiated products and customized services, and using DT strategies as important tools in their efforts to reshape customer relationships and enhance customer stickiness.
Moreover, companies can encourage customer participation in relevant management activities during the DT process. For example, product developers can use social media to encourage consumers to retweet or discuss companies’ product designs with their friends and family (Maier & Baccarella, 2025; Xie et al., 2020). In this manner, companies can acquire more knowledge and skills from consumer feedback. However, CE does not entail unlimited empowerment; that is, more empowerment indicates more responsibility for consumers (Broniarczyk & Griffin, 2014; Xie et al., 2020), and different consumers behave differently in environments featuring different levels of CE (Broniarczyk & Griffin, 2014). Therefore, managers must empower customers appropriately with the goal of reducing the psychological burden that they face. In practical management scenarios, managers can conduct regular follow-ups to understand clients’ reactions during the authorization process, thereby making timely adjustments. In the process of DT, managers can take full advantage of the roles played by big data and AI technology in CE, for example, by leveraging big data analytics to understand customer information or implementing differentiated customer experience strategies tailored to distinct customer segments (loyal customers, regular customers, and new customers). Moreover, enterprises can employ different means and strategies with respect to the timing of CE; for example, in the new product development period, they can obtain more innovative inspiration by implementing a wider range of approaches to CE.
Finally, the findings of this research highlight the feasibility of “thinking from multiple perspectives” for managers. In other words, the connection between DT and corporate customer relationships is not simple or linear (Zhang et al., 2023). The results obtained from the ANNs suggest that different factors work together to drive customer relationships; however, the degree to which the impacts of these factors are significant varies widely. As a result, business managers must transition from “treating everyone the same” to “managing at the core.” Specifically, customer satisfaction in the context of DT can be improved in various ways, for example, by increasing PV, enhancing RC, and moderately expanding CE. However, in practice, managers can prioritize the goal of improving customer satisfaction by providing higher levels of PV and moderately expanding CE because these two factors make the greatest contributions (in terms of importance) to customer satisfaction. In conclusion, guidance that is rooted in both linear and nonlinear results can help managers understand the core of this problem, thus helping organizations develop clear solutions in contexts involving limited resources, avoid blindness, and improve the efficiency of customer management.
Limitations and Directions for Future Research
This study has the following limitations. First, in terms of sample characteristics, the respondents in this study were exposed to many types of enterprises. The levels of DT observed among different types of companies may differ, as may the levels of perceived value that these companies offer to consumers. Therefore, researchers can continue to explore topics pertaining to the DT of different types of companies and different industries, for example, by making comparisons among different industries in this context. Second, numerous factors influence corporate decision-making authority, and these potential triggers also impact the establishment and development of business–consumer relationships. These include national policies, industry competition levels, and corresponding technological capabilities. Future research can utilize analytical tools such as SEM+fsQCA+NCA to explore the complex impact mechanisms and varying effects of multiple factors on CRM. Finally, the degree of CE is an important topic in this context. As noted by Ramani and Kumar (2008), the level of CE implemented by firms should be moderate, as excessive delegation may increase the burden on consumers and thus produce negative effects. Therefore, future researchers could explore issues such as business–consumer relationships and the development of firm innovativeness at different levels of CE.
Conclusion
CRM has been viewed as a form of green IT that can facilitate the DT of enterprises (Gil-Gomez et al., 2020). This research explores the impact of DT on the development of business–consumer relationships with the aim of improving the competitiveness of companies. Expectancy confirmation theory is used as the framework for this research, and variables such as DT, RC, and CE are introduced to construct the theoretical framework employed in this study. A total of 545 valid questionnaires were collected via an online platform, and the quality of the data thus collected was controlled. This study employed a quantitative (survey + SEM + ANNs) approach to investigate both the linear and nonlinear effects of DT on customer satisfaction, with a particular focus on the extent to which different elements influence efforts to improve customer satisfaction. Unlike previous studies that have focused on the economic and social benefits of DT, this study actively explores the relationship between DT and customer relationships. On the one hand, the findings of this study establish a theoretical bridge between DT and customer management. On the other hand, the results of this study can serve as an important reference for DT and CRM in practice.
Footnotes
Appendix A
Details of Questionaires.

| Construct/definition | Indicator | References |
|---|---|---|
| DT Digital transformation refers to the process by which enterprises or organizations leverage next-generation information technologies such as cloud computing, big data, and artificial intelligence to reconstruct their value systems and establish digital business models. Its core lies in driving business optimization, upgrading, and systemic transformation through data-driven approaches. |
DT1: In general, the companies around me are working hard to advance digital transformation. | Verhoef and Bijmolt (2019); Nasiri et al. (2020); Pan et al. (2025) |
| DT2: In general, the companies around me are trying to promote information technology. | ||
| DT3: In general, the companies around me are gradually computerizing their management processes. | ||
| DT4: In general, the companies around me take the management and use of data very seriously. | ||
| PV The essence of customer value lies in customer perception—that is, customers’ subjective perception of their interactions with a company and the outcomes thereof. This includes customers’ comparison and weighing of their perceived gains against perceived losses. |
PV1: I think digital transformation can bring me economic benefits (lower prices). | El-Adly (2019); J. Chin and Lin (2015); Costa-Climent et al. (2024) |
| PV2: I think digital transformation can bring me environmental benefits (good environment). | ||
| PV3: I think digital transformation can bring me social benefits (social progress). | ||
| PV4: I think digital transformation can bring me relationship benefits (business-consumer relationship). | ||
| RC Relationship commitment is the willingness to develop and maintain a stable, long-lasting relationship. |
RC1: I would like to continue my interaction with the company. | K. Tan and Agnew (2016); Ito et al. (2021); Shi et al. (2024) |
| RC2: I think it makes sense to maintain good relationships with companies. | ||
| RC3: I think we’re both trying to maintain that relationship. | ||
| RC4: In short, I care a lot about the relationship with that business. | ||
| RS Relationship satisfaction reflects customers’ actual experience with your products or services, their psychological perception after comparing it with prior expectations, and their self-assessment of the current brand relationship quality. It directly determines whether customers will continue choosing you or even become loyal users. |
RS1: I am satisfied with the current relationship with the company. | K. Tan and Agnew (2016); Ito et al. (2021); Wattoo et al. (2025) |
| RS2: Overall, I am satisfied with the products and services provided by this business. | ||
| RS3: Overall, I am satisfied with this company’s efforts in maintaining customer relationships. | ||
| RS4: Overall, this business is more likely to satisfy me than others. | ||
| CE The transfer of power and control over the values, decisions, choices, and directions of human services from external entities to the consumers of services, resulting in increased motivation to participate and succeed and a greater dignity for the consumer |
CE1: This company encourages customers to share suggestions for their products or services with the company. | Pranic and Roehl (2012) Kamalaldin et al. (2020) and Xie et al. (2020); Maier and Baccarella (2025) |
| CE2: This company encourages the sharing of information between customers and other customers. | ||
| CE3: This company encourages customer participation in product design and development. | ||
| CE4: In general, this company values the opinions or ideas of its customers. |
Ethical Considerations
We have stated in the survey document that the purpose of the survey, especially regarding ethical issues, has been agreed and approved by the respondents.
Author Contributions
Yanan Wang and Jizhi Chen collected and analyzed the data regarding the digital transformation. Wenkun Zhang was a major contributor in writing the manuscript. All authors read and approved the final manuscript.
Funding
The authors disclosed receipt of the following financial support for the research, authorship, and/or publication of this article: This study was conducted with funding from the Natural Science Foundation of Shandong Province (ZR2023MG017).
Declaration of Conflicting Interests
The authors declared no potential conflicts of interest with respect to the research, authorship, and/or publication of this article.
Data Availability Statement
The research data was not available, but the relevant data can be obtained by contacting the corresponding author upon reasonable request.*