






Abstract
Rating quality is one of the central concerns in rater-mediated assessments. Rater severity has been used as one primary rater effect influencing rating quality. It measures the raters’ rating strict or lenient tendency, without evaluating the appropriateness of ratings. Rating adoption rates are the proportions of raters’ ratings that are used as the final ratings, which may reflect the appropriateness of individual rater’s ratings. The current study aimed to explore the associations betweenrating adoption rates, rater severity and raters’ characteristics (e.g., gender, rating experience), under the context of mathematics tests. A total of 101 raters participated in the rating. The many-facets Rasch model was used to calculate rater severity, and hierarchical linear models were conducted to investigate the relationships between rating adoption rates, rater severity and raters’ characteristics. Results showed an inverted U-shaped relationship between rating adoption rates and rater severity on some items. The results offer new understandings about rater severity and rating adoption rates in rater-mediated assessments.
Keywords
Introduction
Raters play a crucial role in rater-mediated assessments as they serve as the bridge between candidates and administrators. Their ratings are associated with candidates’ scores and administrators’ decisions. Thus, it is important for raters to provide appropriate ratings (Lumley, 2005). The rating quality is a key consideration when interpreting the results of rater-mediated assessments (Hamp-Lyons, 2007; Johnson et al., 2009). Rater severity and rater agreement, as the representative indicators of rating quality indirectly, have been widely studied (Burke & Cizek, 2006; Congdon & MeQueen, 2000; Leckie & Baird, 2011; Lim, 2011; Penny & Johnson, 2011; Tanaka & Ross, 2023). Rater severity could not reveal the level of the rating quality directly, due to the well-documented adverse effects of excessive severity and leniency (e.g., Bond & Fox, 2013; Erguvan & Aksu Dunya, 2020). Rater agreement measures the degree of consistency among raters’ scores on the same responses, reflecting the reliability of ratings (Chaturvedi & Shweta, 2015). This indicator is usually item-specific, referring to the rating consistency across raters for a given item (James, 1982; James et al., 1984, 1993; Liao et al., 2010). While rating adoption rates, defined as the percentages of raters’ ratings for candidates’ responses as the final ratings on a certain item, could reflect the rating consistency at the rater level, expanding the understanding of rater agreement.
Investigating the relationship between rater severity and rating adoption rates is critical for understanding the effects of raters’ tendencies on the practical utility of ratings. This exploration may reveal the potential misalignment between rating standards and practical implementation, as well as provide insights for rater training and assessment design. Thus, the current study aimed to explore the relationship between rater severity and rating adoption rates. Additionally, raters’ characteristics, such as gender and rating experience, are important aspects when examining rater effects (Bijani & Khabiri, 2017; Qiu et al., 2022; Şahan & Razı, 2020). Another purpose of the study was to examine the associations between raters’ characteristics and rating adoption rates.
Rating Quality in Rater-Mediated Assessments
Human rating of candidates’ performance on specific items or tasks remains a crucial aspect of educational and psychological assessments (Glazer & Wolfe, 2020; Johnson et al., 2009; Knoch et al., 2021). Rating involves assigning evaluation in the form of marks, or grade of statements about candidates’ performance in specific skills or domains (Cohen & Swerdlik, 2009), usually based on consistent criteria (Albano & Rodriguez, 2018). In the rater-mediated assessments, how to determine the appropriateness of raters’ ratings is a key issue.
Rating quality is a fundamental characteristic that measures the validity, reliability, and fairness of an assessment system (American Educational Research Association et al., 2014). It refers to the degree to which the rating assigned to a response is warranted by the quality of the performance (Wind, 2014), and can be investigated from three perspectives (validity, reliability/precision, and fairness). Validity refers to the extent to which accumulated evidence and theoretical frameworks support a particular interpretation of test scores for a specific test. Reliability or precision is defined as the consistency of results across repeated administrations of the testing procedure. Fairness is characterized as the sensitivity to individual characteristics and testing contexts, ensuring that test scores lead to valid interpretations for their intended purposes. Thus, considering and examining the rating quality in rater-mediated assessments can offer actionable insights into the improvement of ratings.
Several indicators were considered as measures of rating quality, such as rater agreement, rater accuracy, as well as rater effects (Myford & Wolfe, 2003, 2004; von Eye & Mun, 2005). Rater agreement refers to the rating consistency across raters for a given item, reflecting the similarity of ratings (Chaturvedi & Shweta, 2015). The consistency among the ratings is considered as a precondition to ensure the effectiveness of the assessment (Liao et al., 2010). Wind and Peterson (2018) believed that the overall consistency of ratings could provide descriptions of rating quality. To maximize the consistency, rater training is usually implemented before the formal rating (Johnson et al., 2009). Moreover, rater accuracy was conceptualized as the difference between observed ratings and experts’ ratings (Engelhard, 1996, 2013). Consistent with prior research (Şahan & Razı, 2020; Wang et al., 2016), inexperienced raters demonstrated higher rating variability than experienced raters, providing the evidence that experienced raters would get higher rater accuracy. Furthermore, rater effects are defined as any test score variance that is attributed to the rater rather than the assessment target (Scullen et al., 2000). In rating process, rater effects, such as judgmental tendencies, errors, and biases, would emerge and impact rating quality (Johnson et al., 2009; Myford & Wolfe, 2003; Saal et al., 1980).
Rater Severity and Rating Adoption Rates
It is widely recognized that rater effects can threaten the validity, reliability and fairness of ratings (Johnson et al., 2009; Myford & Wolfe, 2003; Saal et al., 1980). Five typical types of rater effects would cause errors in rating: assigning lower or higher ratings than candidates deserve (severity/leniency); assigning an appropriate average rating but showing greater variance than expected (inconsistency); overusing either middle or extreme scores in a rating scale (centrality/extremity); giving excessively favorable ratings to candidates similar to oneself (similarity); and allowing one’s evaluation of a candidate in a specific trait to be influenced by the overall (usually positive) impression of the candidate (halo effect). Several methods were developed to evaluate the rater effects. For example, Wolfe et al. (2015) developed two versions of raw score models (Rasch partial credit model, PCM, and Rasch rating scale model, RSM) to detect and differentiate rater severity, inaccuracy and centrality. And the dual differential rater functioning model (DDRFM) was proposed to detect and measure rater severity and centrality (Jin & Eckes, 2022).
Among these rater effects, rater severity is a pervasive and detrimental effect (Jin & Eckes, 2022). Most studies have focused on rater severity, specifically reporting the negative effect of excessive severity and leniency (Hoskens & Wilson, 2001; Leckie & Baird, 2011; Myford & Wolfe, 2004; Wind & Ge, 2021; Wind & Guo, 2019). Usually, severe raters consistently award lower ratings, while lenient raters usually assign higher ratings (Wind & Jones, 2019a). Both would cause unexpected deviations in the true levels of candidates’ trait or ability (Jin & Eckes, 2022), restricting providing good reliability of the assessment. Furthermore, Wind and Peterson (2018) pointed out the insufficiency of the group-level indicators, and advocated for the extension of rating quality indicators to encompass individual rater characteristics. Several methods could be used to evaluate rater severity, such as multilevel models (Leckie & Baird, 2011), Rasch models (Congdon & MeQueen, 2000; Jin & Eckes, 2022). Among these analysis methods, the many-facets Rasch model (MFRM) is widely used (Wind & Peterson, 2018).
Empirical findings demonstrate variations in raters’ severity between and within raters, which mean that individual rater’s severity is not fixed (Knoch et al., 2007; Raczynski et al., 2015; Uto, 2023). Exploring the association between rater severity and rating performance is beneficial for gaining a deeper understanding of the rating process. Rating adoption rates represent the rater agreement at the individual rater level, which are defined as the contribution of raters’ ratings for candidates’ responses as the final ratings on a certain item. A high value of rating adoption rate indicates the appropriateness of ratings provided by the rater. And its real-time accessibility enables immediate intervention, having practical value in online rating system. Its calculation formula is given below.
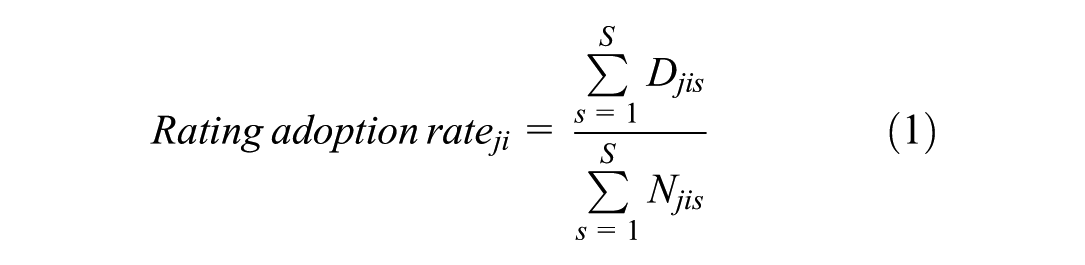
In the Formula 1,
The concept of rating adoption rates differs fundamentally from established rater metrics. Unlike rater accuracy, which is the agreement between individuals’ ratings and the expert benchmark (Baird et al., 2017), the benchmark for adoption rates is more flexible and context-dependent (Detailed information available at the Participants and Procedure section). Furthermore, while inter-rater reliability measures the consistency among multiple raters at the group level, it cannot diagnose the stability or efficacy of ratings provided by an individual rater (Liao et al., 2010). Similarly, rater agreement or Cohen’s kappa coefficients assess the match in judgments between raters or across occasions, but they do not capture the degree to which an individual rater’s judgments are informative within a formal measurement model (Chaturvedi & Shweta, 2015). In contrast, rating adoption rates directly quantify the extent to which an individual rater’s ratings are incorporated into the final score, serving as a representative indicator of how much “valid information” each rater contributes to the rating process. It is also different from the MNSQ fit statistics, which serve as model-based indicators of whether a rater’s rating pattern is overly unpredictable (random) or too predictable (overly patterned).
The Effects of Raters’ Characteristics
Several extraneous, irrelevant factors, such as raters’ characteristics can influence the rating process, causing distortions that would compromise the fairness of rating quality. Scullen et al. (2000) recommended that when explaining performance ratings, factors associated with raters’ perspectives should be considered. According to Knoch et al. (2021), the raters and their training, rater experience are important factors influencing the quality of rating. It was reported that raters may exhibit variability in their interpretation of rating criteria, application of the rubric, and severity or leniency in evaluating examinees’ performance (Bachman & Palmer, 1996; Eckes, 2008). For example, raters who perceive the scoring criteria as less important tend to exhibit greater severity in their ratings (Eckes, 2008).
To support valid interpretation and use of scores, it is essential for raters to develop a shared understanding of the criteria detailed in the scoring rubrics, and to apply these criteria both accurately and consistently to rating students’ performance (Lane & Stone, 2006). Training before formal rating is usually considered as an important step in ensuring the quality of ratings (Moser et al., 2018). Bijani and Lu (2019) found its usefulness in promoting rating consistency and preventing excessive or insufficient severity. Moreover, low-experienced raters often had greater difference on the ratings comparing to those raters who had more experience (Şahan & Razı, 2020). It indicates that the high-experienced raters would provide more appropriate ratings. However, few studies have focused on raters’ understanding of the rating criteria.
Furthermore, there were mixed results regarding gender difference in giving ratings or evaluations. Bijani and Khabiri (2017) did not find significant difference between the ratings provided by female and male raters. While in management, it showed that female were harsher raters, which indicated that female gave lower ratings than male (Furnham & Stringfield, 2001). This difference was also discovered in a clinical training evaluation, which showed that female trainees rated faculty lower than male trainees (Cullen et al., 2023). Besides, the advantage of higher education was revealed, which can make raters become experienced and compensate for their lack of experience (Ahmadi Shirazi, 2019).
The Current Study
Rater severity is one of the typical rater effects when examining rating quality (Erguvan & Aksu Dunya, 2020; Hamp-Lyons, 2007; Johnson et al., 2009; Leckie & Baird, 2011; Lim, 2011). The consistency of ratings could provide a good description of rating quality (Wind & Peterson, 2018). Rating adoption rates represent the validity of ratings provided by raters, indicating the rating consistency at the rater level. Analyzing the relationship between rater severity and rating adoption rates represents an investigation into how raters’ rating tendencies manifest in their rating behaviors, in other words, how individual judgment patterns yield more or less effective information. As such, it plays a pivotal role in optimizing rater training and, ultimately, enhancing the overall quality of the assessment.
However, there has been scant attention devoted to the association between rater severity and rating consistency at the rater level. Therefore, the study aims to explore the relationship between rating adoption rates and rater severity based on a rater-mediated assessment (research question 1). The consensus in literature suggests that both excessive severity and leniency can yield adverse effects (Bond & Fox, 2013; Erguvan & Aksu Dunya, 2020). It is expected that both excessive leniency and severity would result in low rating adoption rates, whereas moderate severity levels would contribute high adoption rates. This indicates an inverted U-shaped relationship between rater severity and rating adoption rates (hypothesis 1).
Moreover, raters’ characteristics should be considered due to their influences on rating quality (Ahmadi Shirazi, 2019; Bijani, 2018; Bijani & Lu, 2019; Cullen et al., 2023; Duijm et al., 2018; Huang et al., 2018; Şahan & Razı, 2020). While the associations between raters’ characteristics and rating adoption rates remain unclear. The study aims to investigate the effects of raters’ characteristics (including gender, pre-service teacher status, grade level, rating experience, perceived clarity of rating criteria, understanding of rating criteria, and satisfaction with rating training) on rating adoption rates (research question 2). Due to the unexplored associations, no explicit hypothesis is proposed about the research question 2. Furthermore, item features are reported to have effects on raters’ ratings (Wolfe et al., 2016). And there are variations in rating difficulty among different items, potentially influencing rater severity and consistency (Farrokhi et al., 2012). Thus, item features, such as item types and average difficulty are included as covariates in the current study.
Method
Assessments
The testing context of this study was based on the Mathematics Achievement Tests for fourth and eighth-grade students. The tests, along with their corresponding rating manual (including example answers and corresponding ratings), were developed in accordance with the curriculum standards in China, and completed collaboratively by teachers and experts in the field of educational measurement. The Mathematics Achievement Tests for the fourth and eighth-grade both included five booklets. By employing a multiple-test booklet design, the booklets incorporated a set of common anchor items. There were a total of 45 items, which could be divided into two types: arithmetic and word problem-solving items. The arithmetic items are focused on basic numerical operations, whereas word problem-solving items additionally require comprehension of real-world contexts. Three scores would be assigned to students’ responses on the two types of items: 0 for completely incorrect, 1 for partially correct, and 2 for completely correct.
Participants and Procedure
7,376 fourth-grade and 4,727 eighth-grade students took the corresponding test, and the number of responses was 36,884 for the fourth-grade and 23,636 for the eighth-grade. There were 101 college students from a university in China participating in this rating process. More detailed demographic information was shown in Table 1. The incomplete rating design was adopted, in which each rater rated a subset of the responses on some items (Wind & Jones, 2019b).
Demographic Statistics of Raters.
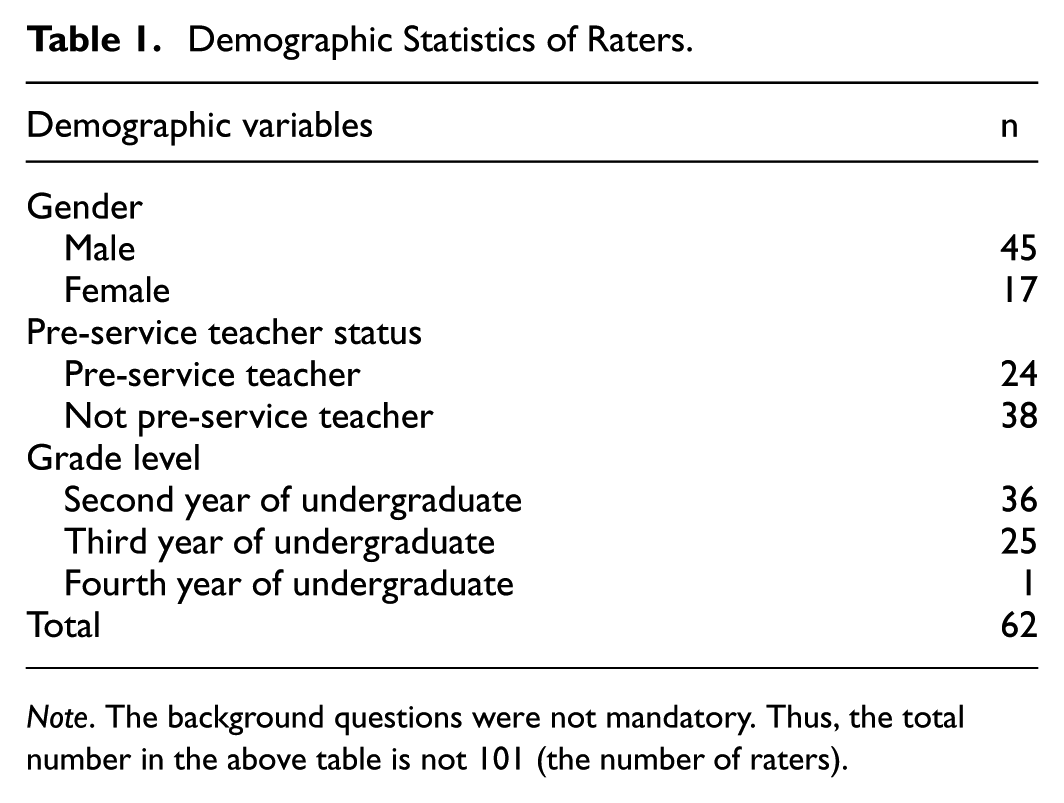
Note. The background questions were not mandatory. Thus, the total number in the above table is not 101 (the number of raters).
Before the formal rating, all raters were trained to ensure their familiarity with the rating rules and proficiency in operating the rating system. They were required to practice to assign appropriate ratings to selected students’ responses based on the rating manual. Each student’s response on each item was rated by two separate raters. If both ratings were the same, that rating was adopted as the final rating for that student on that item. If the two ratings differed, a third rater would be assigned to provide his rating, and the majority among the three ratings determined the final rating. In cases where all the three ratings were different, a fourth rater, typically an expert in the field of mathematics education or the designer of the rating criteria, was appointed to arbitrate, and his rating would be the final rating. Raters were required to achieve a rating adoption rate of 95% or higher during the training to qualify for the formal rating process; those who did not achieve this threshold remained in continued training.
Following the training, raters were invited to answer four questions voluntarily about whether they had participated in similar rating tasks before (whether they had previous rating experience), their perceived clarity of rating criteria, understanding of rating criteria, and satisfaction with rating training. The first question was scored using a dichotomous scale (1 = had previous experience, 2 = did not have previous experience). The other three questions were scored on a five-point scale. Higher scores on the three questions suggested lower perceived clarity of rating criteria, understanding of rating criteria, and satisfaction with rating training, respectively. To facilitate interpretation, responses on the four questions were reverse-coded. Then, the formal rating was conducted. Its process was identical with the training, and both were completed on the computer.
All procedures performed in the present study were in accordance with the recommendations of the Research Ethics Committee of the authors’ institution and with the 1964 Helsinki declaration and its later amendments or comparable ethical standards. Written informed consent was obtained from the participants.
Data Analysis
Prior to the main analysis, the pattern of missing data for rater demographics was examined by conducting independent samples t-tests. The results revealed no significant differences in rater severity (t(99) = −0.53, p = .60, Cohen’s d = −0.11) and rating adoption rates (t(99) = −1.30, p = .20, Cohen’s d = −0.27) between raters with complete and incomplete demographic information. This pattern is consistent with data missing completely at random (MCAR), reducing concerns that the data missing would systematically bias results.
Moreover, in order to differentiate between rating consistency and adoption rates, correlation analysis was conducted between rating consistency and rating adoption rates. The results (Table S1 in the Supplemental Material) showed that among the 45 items, the absolute values of the correlation coefficients exceeded .50 in 14 items, and only 4 items showed statistically significant correlations (p < .05). The significant correlations were positive in 2 items and negative for the others. The results regarding correlations between rating consistency and adoption rates indicated their differences.
Then, the many-facets Rasch model (MFRM) was performed utilizing the TAM package in R 4.4.1 to estimate rater severity (Linacre, 1989). It was an extension of the Rasch model (Rasch, 1980), frequently employed in rater-mediated assessments. It aligned variables of interest (e.g., raters, ratings, scores) onto a common interval scale, facilitating meaningful comparisons among them (Eckes, 2015). Myford and Wolfe (2003) suggested that there would be voluminous output in conducting MFRM. Moreover, the presence of extensive missing data poses significant threats to the implementation of MFRM through two mechanisms: (1) error propagation when incorporating partially observed items, and (2) non-convergence risks arising from information matrix singularity (De Silva et al., 2021; Dwivedi et al., 2020). The incomplete rating design adopted in the current study leads to a large proportion of missing values in the rater-item matrix. In that case, conducting a multi-item MFRM could become challenging, which would threaten the stability of parameter estimation. The single-item MFRM offers a more stable and parsimonious estimation of rater severity, under conditions of sparse data by treating all items as measures of a single underlying construct. While using a single-item MFRM yields a unique severity estimate for each rater on each item, this does not imply that rater severity is considered to be an unstable trait. These estimates reside on different measurement scales and are therefore not directly comparable across items. In this study, the primary purpose of these item-specific severity values is to determine a rater’s relative position (i.e., leniency or strictness) compared to other raters on the same specific item. Examinations at the individual item level could provide essential information about the data involved (Engelhard & Wind, 2013). Therefore, a single-item data fit to the MFRM was employed to estimate rater severity on each item. The model fit indices were present in Table S2 in the Supplemental Material. The single-item MFRM can be expressed as:

In the Formula 2,
Next, the hierarchical linear model (HLM) was employed to contextualize the data analyses within a multilevel framework (Raudenbush et al., 2004; Woltman et al., 2012). It partitions the total variance of the outcome variable into within- and between-group components (item as the group variable in the current study). The HLM was conducted utilizing the lm4 package in R 4.4.1. The null model was conducted to calculate the intraclass correlation coefficient (ICC), with no explanatory variables included. Higher ICC usually suggests a more pronounced nested structure within the data. The null model in the current study can be shown by the following formulas:


In the above formulas, level 1 refers to the rater level, and level 2 refers to the item level.
In contrast to the null model, the full model included the linear and quadric terms of rater severity, raters’ characteristics (gender, pre-service teacher status, grade level, rating experience, perceived clarity of rating criteria, understanding of rating criteria, and satisfaction with rating training). Additionally, item types and average difficulty were controlled as covariates in the current study. The full model can be expressed as:
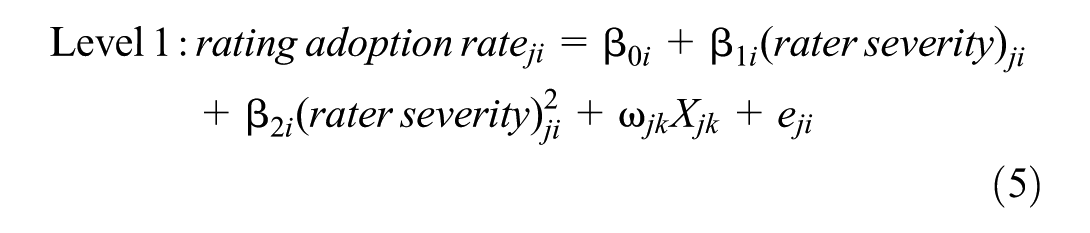



In the full model, item types and average difficulty are the level 2 (item level) variables, and rater severity (standardized) is the level 1 (rater level) variable.
Similarly,
Because of the incomplete rating design in the data, each rater was responsible for evaluating only a portion of items and a portion of students’ responses on these items. The number of raters for each item is shown in Table S3 (in the Supplemental Material). Each student’s response on each item would be rated by two raters, resulting in direct or indirect (through other raters) connections between the raters. The network graph (Figure 1) displays the connections between some raters on one item based on partial data. In Figure 1, the different four-digit numbers in the nodes represent different raters. The edges between the nodes indicate that two raters have rated the same students’ responses on an item. The greater the number of edges between two raters, the higher the volume of co-rated responses. In general, the overlap in students assessed by any two raters on an item constituted only a small fraction of the total students (M = 0.14%, SD = 0.44%).
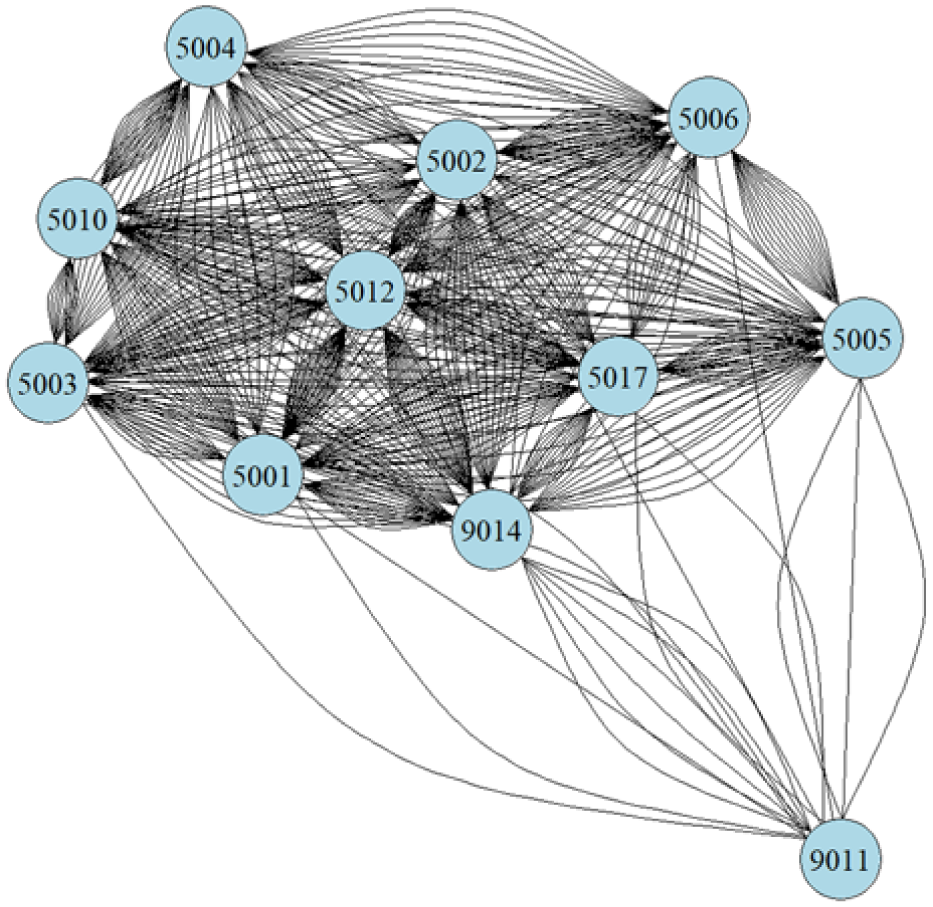
The connections between raters on one item (partial data).
To determine whether the missing values resulting from this rating design were completely at random, a Little’s Missing Completely at Random (MCAR) test was conducted. The result indicated that the data was not MCAR (χ2(101) = 519.27, p < .001). This necessitated consideration of the correspondence between items and raters. Accordingly, the weights between each item and rater according to the rater-item matrix were computed based on the previous study (Hill & Goldstein, 1998), which were incorporated into the HLMs subsequently.
Results
Preliminary Analysis Results
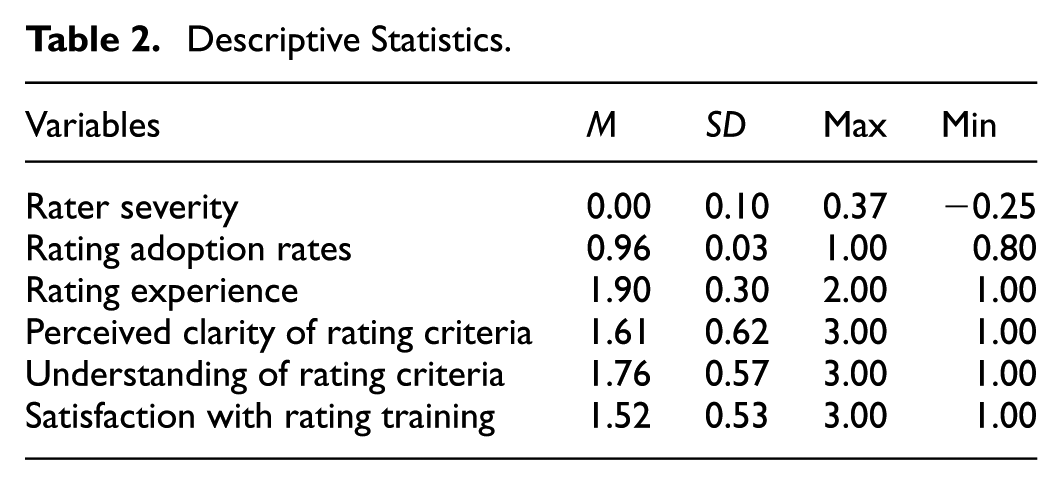
Tables 2 and 3 present the descriptive statistics and correlations of main variables, respectively. Rating adoption rates were negatively associated with both the linear (r = −0.28, p < .01) and quadratic terms of rater severity (r = −0.20, p < .01). This lays the foundation for subsequent exploration of the quadratic relationship between rater severity and rating adoption rates. Among the raters’ characteristics, there were moderate and positive correlations among perceived clarity of rating criteria, understanding of rating criteria and satisfaction with rating training (r = 0.41–0.62, p < .001). Rating adoption rates had positive correlations with perceived clarity of rating criteria (r = .38, p < .01), and satisfaction with rating training (r = .31, p < .05). This indicates that raters with higher levels of perceived clarity of rating criteria and satisfaction with rating training tend to have higher rating adoption rates.
Descriptive Statistics.
Bivariate Correlations.
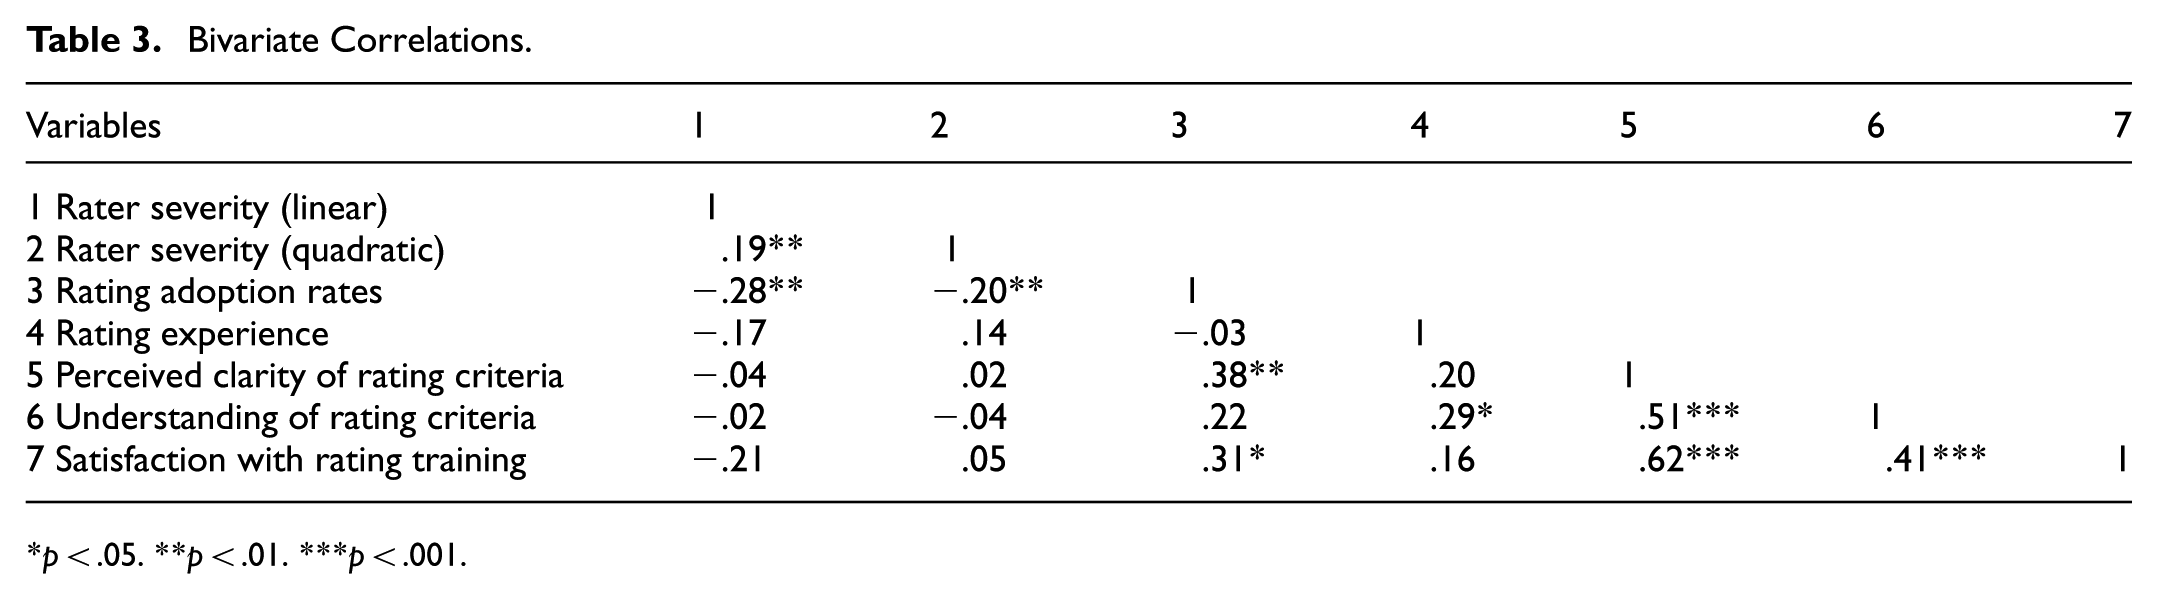
p < .05. **p < .01. ***p < .001.
As bivariate correlations may obscure the structure of data, scatterplots were drawn across items. The relationship between rater severity and rating adoption rates by items was depicted in Figure 2. To test the possible inverted U-shaped relationship, model comparisons were conducted between the model including the quadratic term of rater severity and the model not including that term.
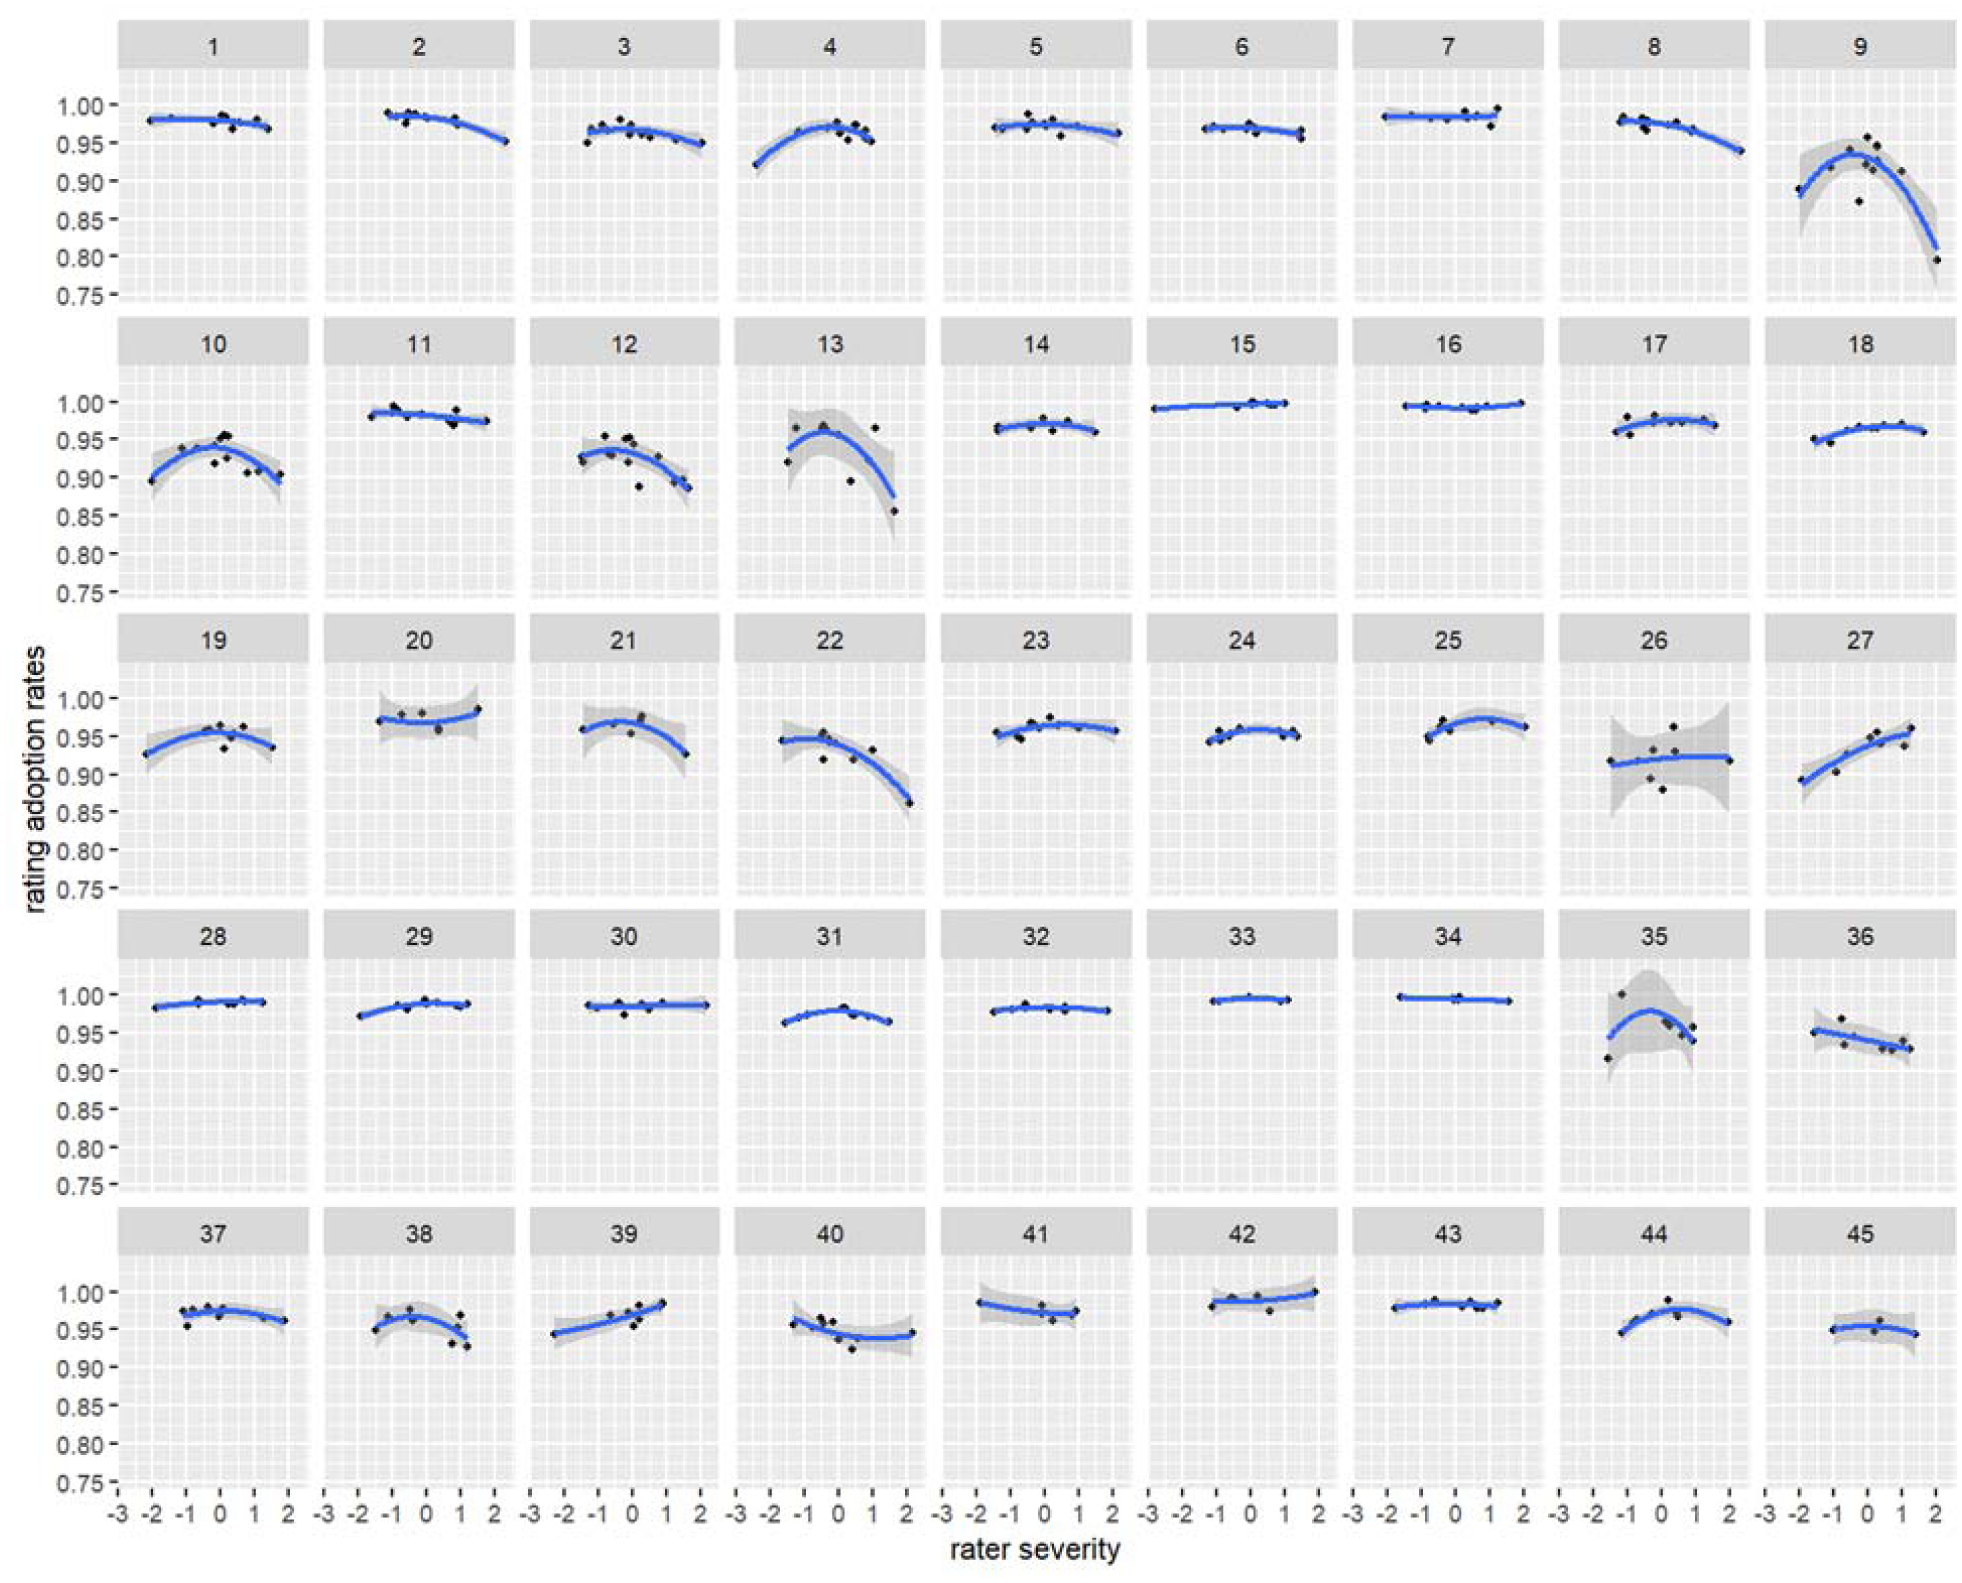
The scatter plot between rater severity and rating adoption rates across items.
Multilevel Analysis Results
A null model was initially specified and estimated to facilitate multilevel analysis investigating the association between rater severity and rating adoption rates. The ICC was 0.634 exceeding 0.1, indicating the appropriateness of conducting HLM analysis (LeBreton & Senter, 2008). Four models were established to explore the relationship between rater severity and rating adoption rates. The linear relationship between rater severity and rating adoption rates was investigated in Model 1. And the quadric term of rater severity was introduced into Model 2 to examine the quadratic relationship. Moreover, Model 3 included the random effects of rater severity across different items. Furthermore, the interactions between rater severity and item features were considered in Model 4.
Likelihood ratio tests were conducted for model comparison. The results (see Table 4) indicated that the multilevel model incorporating the quadratic term outperformed the model not including that term (χ2(1) = 37.25, p < .001). This was also evidenced by smaller values of AIC, BIC, and deviance (Vrieze, 2012). Moreover, the model consisting of random effects of rater severity (Model 3) had better explanations of the data (χ2(6) = 55.26, p < .001). These findings revealed the inverted U-shaped relationship between rater severity and rating adoption rates, as well as the random effects of rater severity across different items. The interaction model (Model 4) did not have better explanation than Model 3 (χ2(4) = 2.90, p > .05). Therefore, Model 3 demonstrated the best fit to the data. This suggests that the model incorporating the quadratic term of rater severity and random effects demonstrates greater explanatory power.
Results of Model Comparisons.
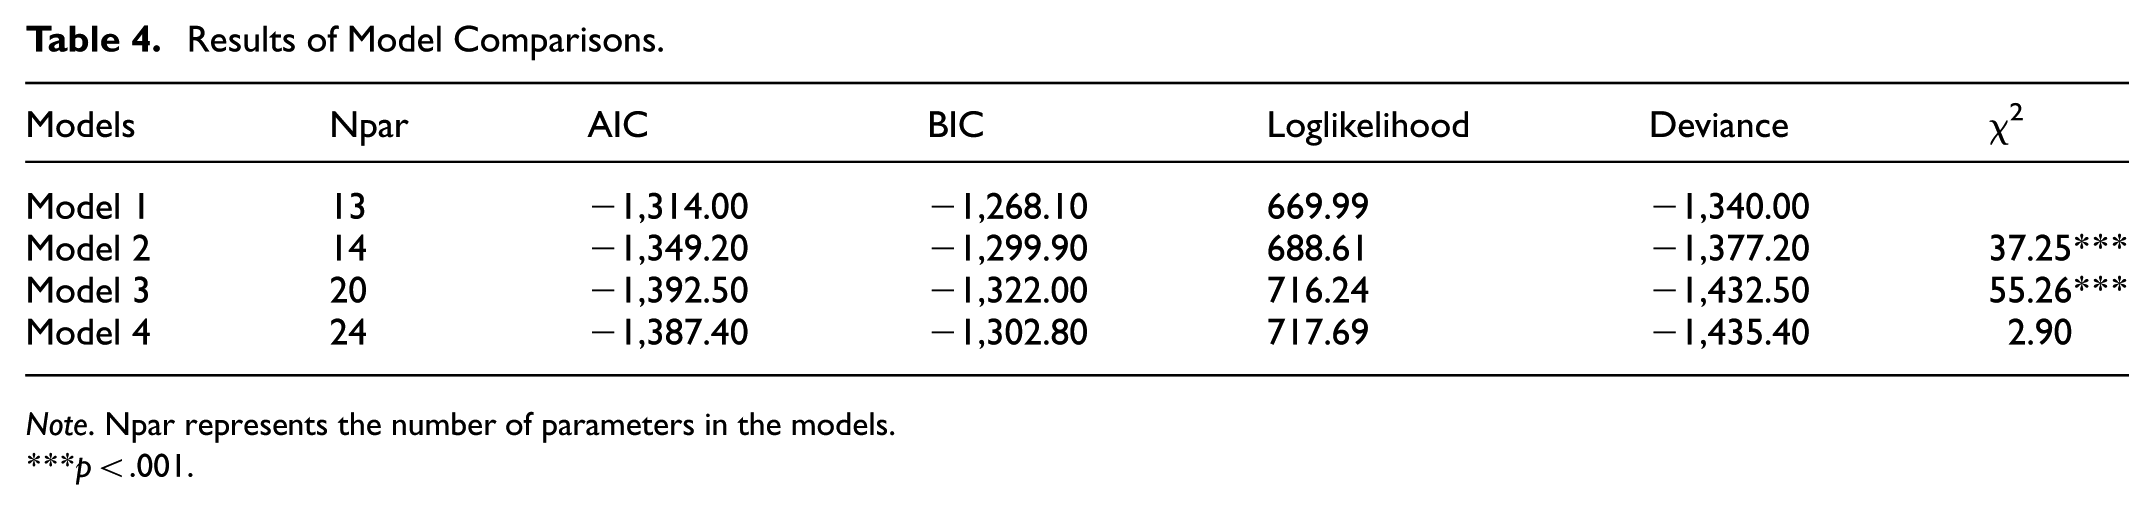
Note. Npar represents the number of parameters in the models.
p < .001.
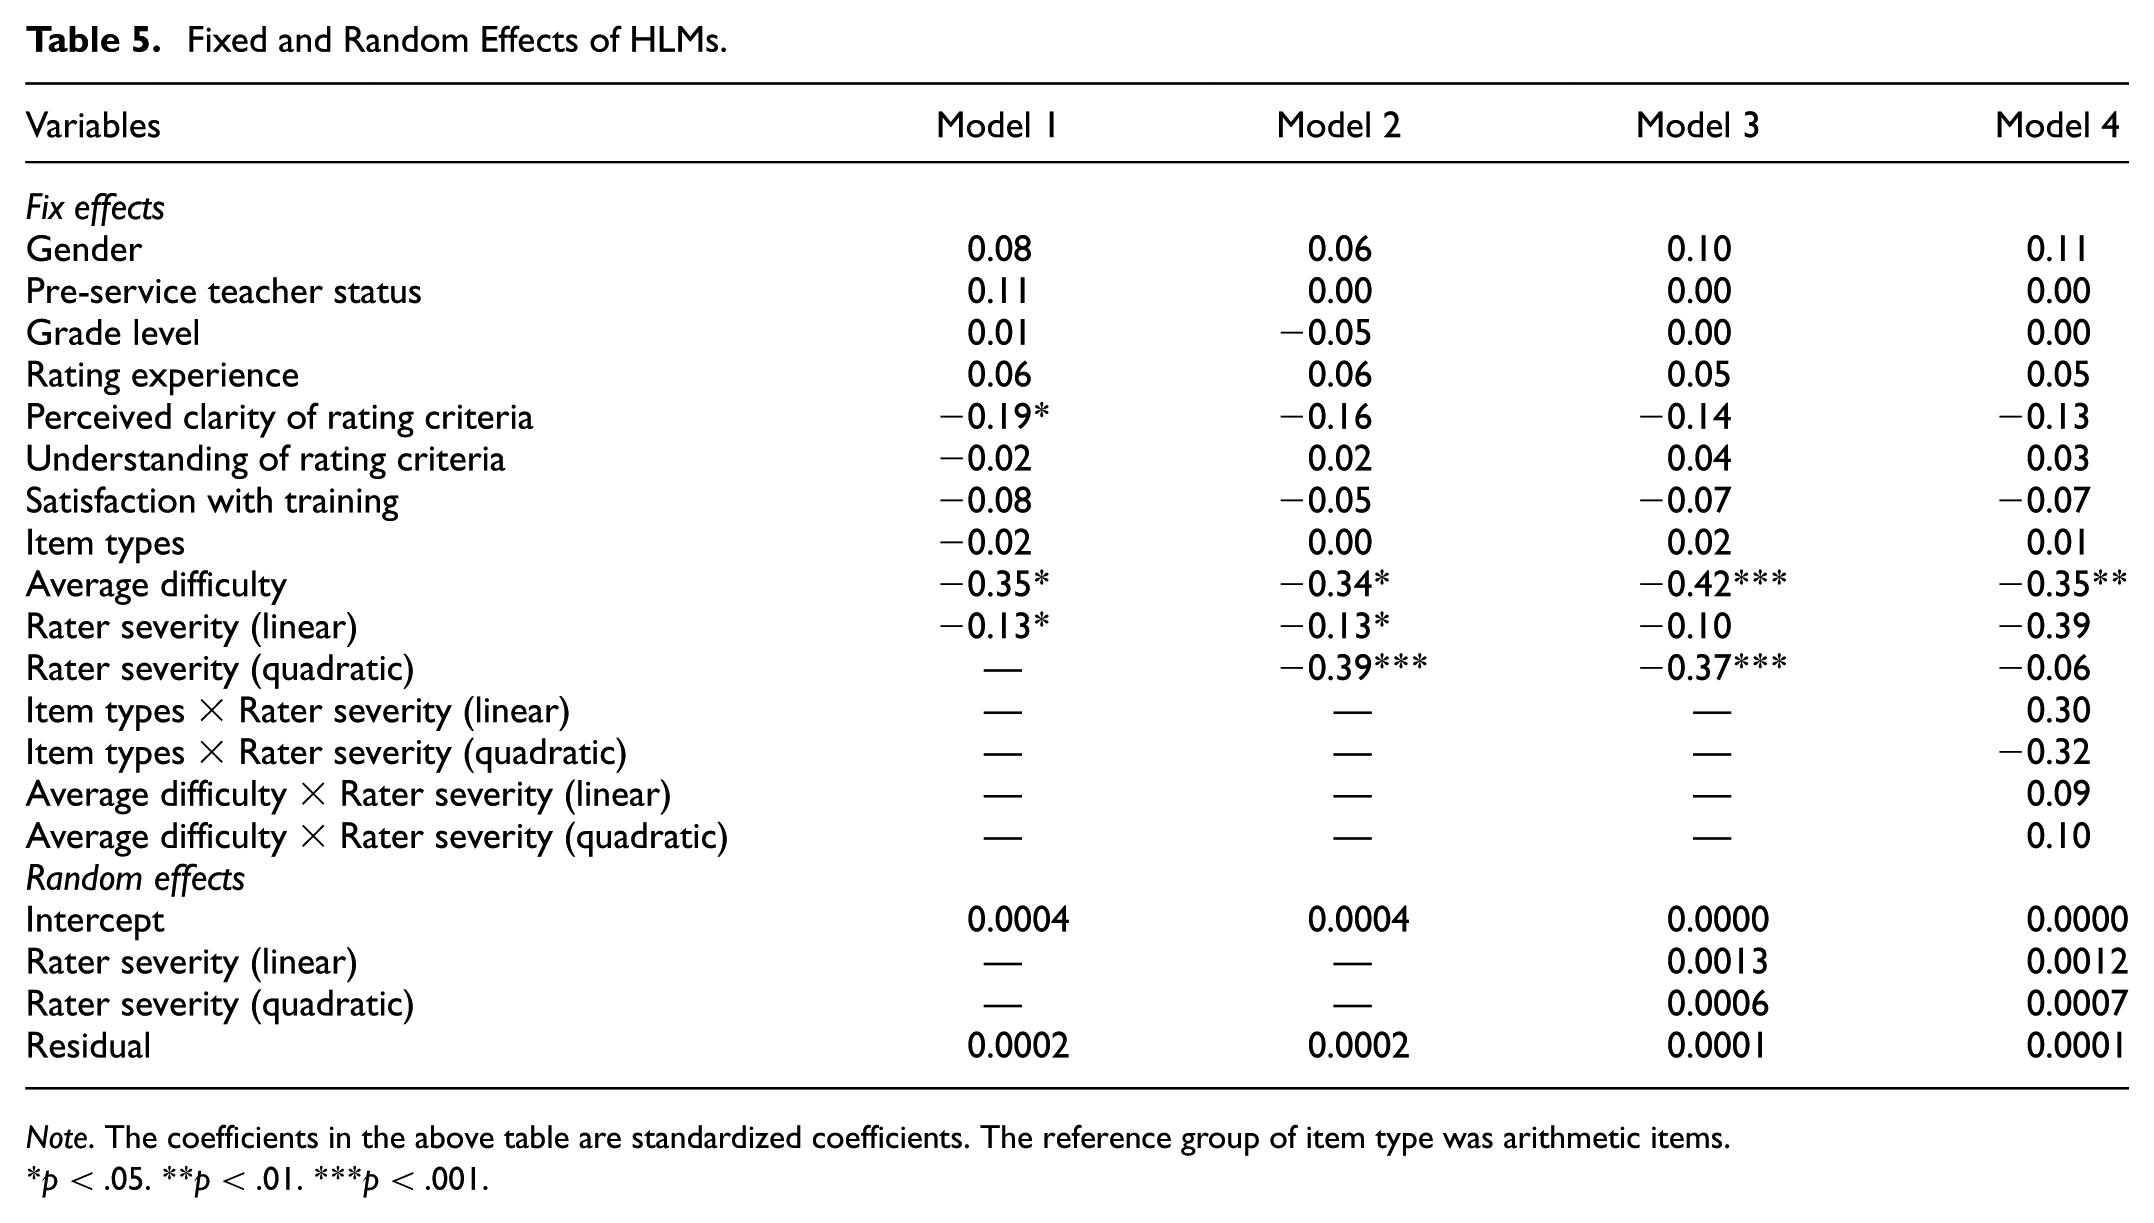
Table 5 presents the standardized regression results of HLMs. In Model 3, which considering the random effects of rater severity, the linear effect of rater severity was not significant (p > .05), while the quadratic effect was negative (β = −0.37, p < .001). The negative quadratic effect of rater severity on rating adoption rates indicated the inverted U-shaped relationship between them. This suggests that both excessively high and low severity levels lead to lower adoption rates, while moderate severity levels typically correspond to higher adoption rates. Based on the unstandardized results, it was found that when the rater severity was −0.16, the highest rating adoption rates would be achieved.
Fixed and Random Effects of HLMs.
Note. The coefficients in the above table are standardized coefficients. The reference group of item type was arithmetic items.
p < .05. **p < .01. ***p < .001.
Moreover, regarding the predictions of item features on rating adoption rates, the average difficulty was associated with rating adoption rates in Model 3 (β = −0.42, p < .001). This suggests that raters would have lower adoption rates on the items with higher difficulty. The predictions of item types and the raters’ characteristics were insignificant (p > .05) when taking the quadric and random effects of rater severity into consideration. The results indicate that the adoption rates remain relatively consistent regardless of variations in item types or rater characteristics in the current study.
Discussion
This study investigated the relationships between rating adoption rates, rater severity, and rater characteristics, controlling for item features (item types and average difficulty). Results showed that there was an inverted U-shaped relationship between rater severity and rating adoption rates on some items. And the effects of raters’ characteristics on rating adoption rates were not significant.
The Relationship Between Rater Severity and Rating Adoption Rates
In fact, the lenient raters and severe raters tend to adhere to their own criteria, which may be distinct from the standard rating criterion (Myford & Wolfe, 2003). Rater severity has a direct impact on ratings, meaning that extreme severity is a threat to the validity and reliability of the ratings (Neittaanmäki & Lamprianou, 2024). However, the majority of prior research has concentrated on describing rater severity patterns (e.g., Hoskens & Wilson, 2001; Leckie & Baird, 2011; Myford & Wolfe, 2004), there remains a paucity of empirical evidence examining the relationship between rater severity and rating consistency. This study extends the conceptualization of rating agreement by operationalizing rating adoption rates as a rater-specific consistency indicator. The current study revealed an inverted U-shaped relationship between rating adoption rates and rater severity on some items. This suggests that both excessive leniency and severity were detrimental to the rating (Lim, 2011). Consequently, ratings provided by either lenient or severe raters may not accurately reflect candidates’ traits or performance. The observed inverted U-shaped relationship implies the potential adverse effect of rater severity. Thus, rater severity serves as an indicator to be considered cautiously when evaluating rating quality.
It is evident that the relationship between rater severity and rating adoption rates varied across different items. For some items, the relationship did not adhere to an inverted U-shaped curve. The regression lines for some items were relatively flat (e.g., items 6 and 7 in Figure 2), suggesting that there might be no significant correlation between rating adoption rates and rater severity for such items. In the interaction analysis (Model 4), item types and average difficulty did not explain the variation of the relationship between rater severity and rating adoption rates. This indicates that the relationship between rater severity and adoption rates remain stable in this study. This evidence supports that rater severity is a cross situational judgment style rather than a context dependent rating strategy.
However, the limited types of items and the limited number of raters on each item in the study might be the potential factors influencing the current results. This study is based on mathematical items (arithmetic and word problem-solving items), the rating criteria of which would be relatively different from previous research that focused on writing and oral assessments (e.g., Attali, 2016; Huang et al., 2018; Park, 2020). Future research may consider other mathematical item features, such as the length and style of the item description, or items in other domains, which would provide new understanding about the relationship between rater severity and rating adoption rates.
The Effects of Raters’ Characteristics on Rating Adoption Rates
Raters play an important role in rater-mediated assessments (Lumley, 2005). They usually bring subjectivity and undesirable variance to the rating process. Qiu et al. (2022) considered that rater effects might be linked to the characteristics of raters, and that has been demonstrated in previous study (Mohd Noh & Mohd Matore, 2022). For example, rating experience (Davis, 2016; Lim, 2011), interpretation and the application of rating criteria (Barkaoui, 2010; Weigle, 2002), and teaching experience (Bonk & Ockey, 2003), are the possible factors that would cause rater effects.
The current study had examined the effects of raters’ characteristics (gender, pre-service teacher status, grade level, rating experience, perceived clarity of rating criteria, understanding of rating criteria, and satisfaction with training) on rating adoption rates. While these effects all were not evident. The potential reason of the divergent patterns from the previous studies maybe the distinct subjects or the contexts of rating. For example, there was no significant gender difference on the ratings under the context of oral proficiency assessment (Bijani & Khabiri, 2017). While the gender difference was discovered in the context of management (Furnham & Stringfield, 2001) and clinical training evaluation (Cullen et al., 2023), both showing that female usually provide lower scores than male. It seems that when there are clear rating criteria, gender differences are not significant, which needs more evidence to support.
Moreover, there were mixed conclusions regarding raters’ experience. Alp et al. (2017), Ahmadi Shirazi (2019), and Park (2020) reported that raters’ experience did not have significant effect on ratings. However, other studies observed difference on ratings when raters with different experience rated the same candidates (Davis, 2016; Huang et al., 2018; Kim & Lee, 2015). Both kinds of conclusions have supportive evidence in writing and speaking assessments (e.g., Attali, 2016; Huang et al., 2018; Park, 2020). Lamprianou et al. (2023) suggests that rating experience is multifaceted, continuous, shared and temporal in nature. Experience may be perceived as a continuous and cumulative construct, and it can become temporally bounded and rapidly obsolete when contextual conditions change (Lamprianou et al., 2023). Thus, the role of rating experience could be explored deeply in further research.
Furthermore, the current study also explored the effects of other characteristics, such as pre-service teacher status, grade level, perceived clarity of rating criteria, understanding of rating criteria and satisfaction with training. Their effects on rating adoption rates were not significant. The effects of interpretation and application of rating criteria were reported under the writing context (Barkaoui, 2010; Weigle, 2002). The different rating contexts might be an import factor that should be considered when examining rating quality. In this study, all raters have participated in the standardized rating training, which enhanced the homogeneity of the rater pool and likely attenuated the influence of pre-training individual differences (e.g., prior rating experience, pre-service teacher status) on their rating performance. Furthermore, the rating adoption rates represent that how effectively a rater’s ratings are adopted. Among such trained raters, variance in this metric is more likely attributable to nuanced, in-the-moment judgment differences than to the demographic variables. In general, the findings about the relationships between raters’ characteristics and rating adoption rates provide new understandings on mathematics rating.
Implications
The findings of this study have several implications. First, this study enriches the understanding of rater agreement, by putting forward rating adoption rates as a representative indicator. It can be monitored in real-time based on an online rating system, aligning more closely with practical application scenarios. And new indicators with good representativeness of rating quality need to be developed. Moreover, the study revealed the inverted U-shaped relationship between rating adoption rates and rater severity. This provides new evidence regarding the relationship between rating agreement and rater severity. Furthermore, the current study recommends that raters’ characteristics are not very important, when the training is compulsory. Finally, future rater training systems could incorporate data-driven, personalized feedback to help raters understand their own severity tendencies and make timely adjustments. On the other hand, introducing the inverted U-shaped relationship between rater severity and rating adoption rates as a theoretical module in training would enhance raters’ awareness of the consequences of their rating judgments, thereby systematically improving the rating quality and the overall validity of assessment outcomes.
Limitations and Future Directions
There are some limitations that need to be acknowledged. Firstly, this study was limited to arithmetic and word problem-solving items. The items were rated on a three-point scale (0 for completely incorrect, 1 for partially correct, and 2 for completely correct). In the future, it may be possible to consider increasing the rating categories, types of items, as well as different subjects, which would help clarify their effects on rating quality.
Secondly, the raters in this study were not professional raters but college students, who received brief training before formal rating. This constraint warrants caution in the interpretation and generalizability of the findings. A worthwhile direction for future research would be to compare the performance of briefly trained raters with that of expert raters, thus enabling a comprehensive investigation of brief training as a viable alternative to expert assessment. Moreover, training will familiarize raters with rating rules and provide more appropriate ratings (Davis, 2016; Seker, 2018; Tajeddin & Alemi, 2014). The rating adoption rates can be generally high in the current study, for that raters were all trained with high rating adoption rates in training before they entered the formal rating. This hinders the examination of some certain questions under untrained conditions. For example, whether the distribution of rating adoption rates would be more varied, or if there would be a more significant discrepancy in the relationship between rating adoption rates and rater severity. In the future, raters can be divided into training and non-training groups to investigate the role of training.
Thirdly, demographic data for a portion of the sample were unavailable. While preliminary analysis results showed that raters with missing data did not have systematical difference on severity and adoption rates, potential missing-not-at-random mechanisms cannot be definitively ruled out. Future research should collect comprehensive raters’ background information to allow for direct modeling of these potential covariates.
Fourthly, this study employed the single-item MFRM method due to the incomplete rating design. While this approach provides an overall estimate of rater severity, it inherently limits the direct comparison of severity parameters across different items and also hinders the evaluation of the severity trait. Future research, utilizing datasets with a fully crossed design, could employ multidimensional models to investigate the consistency of rater severity across distinct item types or content domains.
Lastly, the inverted U-shaped relationship between rating severity and rating adoption rates did not exist in every item. Item types and average difficulty could not provide significant explanations. It suggests that some other potential item factors should be considered. Due to test security, accessing to the item content to extract more item features is difficult. It would be better to incorporate these related components in future research to provide evidence about the influence of item features on the relationship between rater severity and rating adoption rates.
Conclusion
The study explored the relationships between rating adoption rates, rater severity and raters’ characteristics in the context of mathematical tests, by conducting HLMs after controlling item features (item types and average difficulty). The inverted U-shaped relationship between rating adoption rates and rater severity was discovered on some items. This enriches the evidence on the relationship between rating adoption rates and rater severity. Moreover, rating adoption rates have practical value in conducting online rating system. Further research is warranted to explore new indicators of rating quality. Besides, the results offer insights that rater characteristics are not very important in mathematical rating, when the training is compulsory.
Supplemental Material
sj-docx-1-sgo-10.1177_21582440261466029 – Supplemental material for The Relationships Between Rating Adoption Rates, Rater Severity, and Raters’ Characteristics: A Multilevel Analysis
Supplemental material, sj-docx-1-sgo-10.1177_21582440261466029 for The Relationships Between Rating Adoption Rates, Rater Severity, and Raters’ Characteristics: A Multilevel Analysis by Jiaqi Yang, Yingbin Zhang, Yehui Wang, Yuze Deng and Yimei Zhang in SAGE Open
Footnotes
Acknowledgements
We are really grateful to the participation of the raters in this study.

Ethical Considerations
No human or animal experiments were conducted in this study. All procedures performed in the present study were in accordance with the recommendations of the Research Ethics Committee of the Collaborative Innovation Center of Assessment for Basic Education Quality at Beijing Normal University and with the 1964 Helsinki declaration and its later amendments or comparable ethical standards.
Consent to Participate
Written informed consent was obtained from the participants.
Author Contributions
Conceptualization, Jiaqi Yang, Yingbin Zhang and Yehui Wang; methodology, Jiaqi Yang and Yingbin Zhang; software, Jiaqi Yang and Yingbin Zhang; validation, Jiaqi Yang, Yingbin Zhang and Yehui Wang; formal analysis, Jiaqi Yang, Yingbin Zhang, Yuze Deng and Yimei Zhang; investigation, Yehui Wang; resources, Yehui Wang; data curation, Yehui Wang; writing—original draft preparation, Jiaqi Yang; writing—review and editing, Jiaqi Yang, Yingbin Zhang and Yehui Wang; visualization, Jiaqi Yang and Yingbin Zhang; supervision, Yehui Wang. All authors have read and agreed to the published version of the manuscript.
Funding
The authors received no financial support for the research, authorship, and/or publication of this article.
Declaration of Conflicting Interests
The authors declared no potential conflicts of interest with respect to the research, authorship, and/or publication of this article.
Data Availability Statement
The original data are available on reasonable request from the corresponding author.*
Supplemental Material
Supplemental material for this article is available online.
References
Supplementary Material
Please find the following supplemental material available below.
For Open Access articles published under a Creative Commons License, all supplemental material carries the same license as the article it is associated with.
For non-Open Access articles published, all supplemental material carries a non-exclusive license, and permission requests for re-use of supplemental material or any part of supplemental material shall be sent directly to the copyright owner as specified in the copyright notice associated with the article.
