
Abstract
Antisense oligonucleotides (ASOs) are chemically modified single-stranded oligonucleotides used to modulate the expression or processing of a target RNA transcript. The development of ASOs to treat human disease requires extensive preclinical studies in animal models. A critical component of these studies is determining the concentration of the ASO in tissues and biofluids, which are used to estimate the distribution, half-life, and dose-response relationship. The methods used to quantify ASOs are often constrained by low sensitivities, poor dynamic ranges, and the use of highly specialized equipment. Here, we describe the development of a Splint-Ligation-based quantitative PCR assay to measure the concentration of ASOs in nonhuman primate (NHP) tissues and biofluids. Our results show that the Splint Ligation Assay was highly sensitive across central nervous system (CNS) tissues and biofluids (as low as 100 pM in NHP CNS tissue and 1 pM in NHP plasma), with broad linear dynamic ranges. Overall, our results show that the Splint-Ligation PCR Assay is a reliable, sensitive, and feasible method of ASO quantification.
Introduction
Antisense oligonucleotides (ASOs) are chemically modified single-stranded oligonucleotides that modulate the expression of a gene upon hybridizing to a complementary RNA sequence. The phosphorothioate (PS) modification, a substitution of a non-bridging oxygen atom with a sulfur atom in phosphodiester bonds, is a near-ubiquitous feature of ASOs, increasing the resistance of the molecule to degradation by nucleases1,2 and binding to plasma proteins.3,4 2′-ribose modifications to nucleosides, such as the locked nucleic acid (LNA), 2′-O-Methyl (2′-OMe), 2′-O-Methoxyethyl (2′-MOE), increase nuclease resistance and affinity to the target sequence.5,6 Gapmer ASOs contain a ≥4nt long, unmodified DNA sequence (gap) flanked by chemically modified nucleosides on the 3′ and 5′ ends (wings) and repress the expression of a gene by inducing RNase H-mediated degradation of the target RNA transcript. 7 Steric hindrance ASOs contain chemical modifications to all their nucleosides and therefore do not recruit RNase H, instead hindering the binding of molecules to the RNA sequence, often being used to redirect splicing.8,9
There is notable interest in developing ASOs to treat genetic disorders of the central nervous system (CNS). 10 Preclinical nonhuman primate (NHP) studies of ASOs are a critical stage of research and development for novel therapies to characterize the pharmacological properties of investigational molecules in an animal closely related to humans. Results from these studies are used to determine the pharmacodynamic (PD) and pharmacokinetic (PK) properties of the ASO, which inform safety, dosages, and administration methods in subsequent human trials. PK studies evaluate the absorption, distribution, metabolism, and elimination of a drug and, therefore, rely on accurate measurements of ASO concentration in tissues and biofluids.
Existing ASO quantification methods are often limited by low sensitivity, narrow dynamic ranges, specialized instrumentation, the need to redevelop the assay for each ASO, and the use of large amounts of tissue. Because available assays often lack sufficient sensitivity, dynamic range, or accessibility for the quantification of ASO concentration in CNS tissues, elements of valuable PK studies of this type in NHPs can be limited, for example, by lacking PK and PD data for all brain regions due to small sizes of samples, fewer brain regions being assessed, or lacking ASO concentration data.
Shin et al. recently developed a SplintR-Ligation PCR assay to quantify 2′-MOE-modified ASOs in mouse serum and tissues. 11 Here, we developed a modified Splint-Ligation PCR assay to quantify the concentration of an LNA gapmer in NHP CNS tissues, plasma, and cerebrospinal fluid (CSF).
Materials and Methods
Oligonucleotide synthesis
ASOs and Splint Probes were purchased from Integrated DNA Technologies (Coralville, IA) with a standard desalting purification method and resuspended in nuclease-free water (Invitrogen, Waltham, MA, Cat: 10977015) to a concentration of 1 mM. TaqMan Assay was purchased from Thermo Fisher Scientific (Waltham, MA), using sequences obtained from The Jackson Laboratory’s Protocol #22182 (Supplementary Table S1).
Animal use and sample collection
Mouse brain tissue was sampled from an individual that was euthanized by asphyxiation via CO2 and then decapitated. The study was approved by the Texas A&M Institutional Animal Care and Use Committee. Following euthanasia, the cerebellum was collected, then the remaining brain was laterally bisected, and the hippocampus and cortex from each side were collected. Tissues were flash frozen in liquid nitrogen and stored at −80°C.
NHP CNS tissues were sampled from a cynomolgus macaque used as a control animal in a study performed by Charles River Laboratories (CRL; Montreal, Canada). The study was approved by the CR MTL Institutional Animal Care and Use Committee. During the study, the care and use of animals were conducted with guidance from the guidelines of the U.S. National Research Council and the Canadian Council on Animal Care. Following euthanasia, the brain was removed and cut coronally into 4 mm thick slices using a brain matrix. Tissue punches were taken from slices using 4 mm biopsy punches corresponding to specific brain regions (Supplementary Fig. S1). The spinal cord was also removed, along with the dorsal root ganglia, and cut into cervical (C6 to C7), thoracic (T1 to T4), and lumbar (L6 and L7) sections. All samples were flash-frozen in liquid nitrogen before storing at −80°C. NHP biofluids were sampled from a cynomolgus macaque used as a control animal in a study performed by Shin Nippon Biomedical Laboratories (SNBL; Kagoshima, Japan). The study was approved by the SNBL Institutional Animal Care and Use Committee. During the study, the care and use of animals were conducted in accordance with the animal welfare bylaws of SNBL. CSF was collected from the lumbar catheter, placed into sterile tubes, and kept on ice. Samples were then centrifuged at 13,400g at 2°C to 8°C for 1 min. Samples were placed on dry ice until frozen and stored at −80°C. Blood was drawn from the femoral artery into a chilled sodium fluoride/potassium oxalate blood collection tube. These were then mixed by inversion six to eight times and held on ice until centrifuged. Samples were centrifuged within 30 min of collection, at 1,000g at 4°C for 10 min. Within 30 min of completion of centrifugation, plasma was pipetted out of the blood tube into a new tube containing 5% cold phosphoric acid (1:10 [acid:plasma]). These were then mixed by inversion at least 3 times and frozen on dry ice in a −80°C freezer, where they were stored until use.
Sample and standard curve preparation
Assay buffer was made up in nuclease-free water (Invitrogen, Waltham, MA, Cat: 10977015), containing 10 mM Tris-HCl (pH 7.4), 150 mM NaCl, 1% NP-40, 0.5% sodium deoxycholate, 0.1% sodium dodecyl sulfate, 5 mM Ethylenediaminetetraacetic acid, and 1 mM ethylene glycol-bis(2-aminoethyl ether)-N,N,N′,N′-tetraacetic acid, and adjusted to pH 7.4.
To prepare homogenate with which to make standard curves in mouse brain tissue, a sample of control mouse cortex was weighed to within 0.1 mg. The sample was transferred to a 2 mL locking lid microcentrifuge tube, along with a 5 mm stainless steel bead (Qiagen, Hilden, Germany, Cat: 69989). Three microliters of assay buffer per 0.1 mg of tissue were added to the tube. The sample was then disrupted via Tissuelyser II (Qiagen, Hilden, Germany, Cat: 85300) at 30 Hz for a total of 4 min (2 × 2 min, rotating cassettes 180° and swapping sides between runs), repeating if full homogenization did not occur.
When comparing spiking methods in mouse brain tissue, once the tissue sample had been homogenized in the step above, the dilution curves were made via two methods. When “spiked post-processing,” the disrupted tissue samples were incubated on ice for 60 min, vortexing occasionally, then centrifuged at 16,000g at 4°C for 30 min, and lysate was collected. Following this, ASO was spiked into the processed lysate, and a serial dilution was made. When “spiked pre-processing,” ASO was spiked into the sample immediately following disruption with the Tissuelyser, and the dilution series was then made using more unprocessed lysate. These samples were then incubated on ice for 60 min, vortexing occasionally, then centrifuged at 16,000g at 4°C for 30 min, and lysate was collected.
The standard curves in mouse tissue made to determine the slope and dynamic range of the assay were generated by spiking the ASO into sample homogenate immediately after disruption (ie, pre-processing), at a concentration of 100 µM (1 dilution step higher than the greatest concentration in the standard curve). This spiked sample was then serially diluted 1:3.16 or 1:10 (½Log10 or Log10, respectively) into more tissue homogenate, down to 1 pM. Each dilution was mixed by pipetting to minimize foaming-related pipetting error. The spiked tissues were then incubated on ice for 60 min, vortexing occasionally, then centrifuged at 16,000g at 4°C for 30 min. The supernatants were collected and dispensed into a new 1.6 mL microcentrifuge tube, then aliquoted into 10 µL volumes and stored at −80°C.
To prepare homogenate with which to make standard curves in NHP brain tissue, NHP tissue punches were cut into two to four roughly equal pieces, with one piece being retained for the use of this assay. The mass of the sample was measured to within 0.1 mg. Please note that, to prepare a 10-fold dilution standard curve spanning 1 µM to 1 pM, at least 405 µL of lysate is required, corresponding to 13.5 mg of tissue per ASO. Each sample was then transferred to a 2 mL locking lid microcentrifuge tube on dry ice, along with a 5 mm stainless steel bead (Qiagen, Hilden, Germany, Cat: 69989). Following the weighing of all samples, tubes were removed from dry ice. Three microliters of assay buffer per 0.1 mg of tissue were then added to each tube. Tissues were disrupted via Tissuelyser II (Qiagen, Hilden, Germany, Cat: 85300) at 30 Hz for a total of 4 min (2 × 2 min, rotating cassettes 180° between runs), repeating if full homogenization did not occur.
Standard curves in NHP tissue were generated by spiking the ASO into sample homogenate immediately after disruption (ie, pre-processing), at a concentration of 10 µM (10-fold higher than the greatest concentration in the standard curve). The spiked sample was then serially diluted 1:10 into more tissue homogenate to 10 pM. These dilutions were made by pipetting 5 µL of the sample into 45 µL of control homogenate to avoid inaccuracy associated with pipetting smaller volumes. Each dilution was thoroughly mixed by pipetting (25 plunges at ½ reaction volume), as vortexing causes foaming, which can affect pipetting accuracy. The spiked tissues were then incubated on ice for 60 min, vortexing occasionally, then centrifuged at 16,000g at 4°C for 30 min. The supernatants were collected and dispensed into a new 1.6 mL microcentrifuge tube, then aliquoted into 10 µL volumes and stored at −80°C. Biofluids were not processed, so standard curves were prepared in thawed CSF and plasma with no further steps.
Ligation and hybridization reactions
The hybridization master mix was prepared (per sample) with 2 µL 5′ Splint-Probe (100 nM), 2 µL 3′ Splint-Probe (100 nM), 2 µL 10X SplintR Ligase buffer (New England Biolabs, Ipswich, MA, Cat: M0375), and 4 µL H2O. Ten microliters of hybridization master mix were then pipetted into 0.2 mL PCR tubes. Two microliters of supernatant from each sample or standard were then pipetted into the PCR tubes. Samples were mixed by pipetting, as before, to minimize foaming-related pipetting error, and briefly spun down. This mix was placed in a thermocycler and heated to 95°C for 5 min, then cooled to 37°C at a rate of 0.1°C per second. The ligation master mix was then prepared (per sample) with 1 µL of SplintR Ligase Enzyme (New England Biolabs, Ipswich, MA, Cat: M0375) and 7 µL of H2O, which were added to a microcentrifuge tube, resulting in 25 U of enzyme per reaction. This was then mixed, and 8 µL was added to each PCR tube after the hybridization reaction was complete. This was mixed thoroughly by pipetting, briefly spun down, heated to 37°C for 30 min, then heat inactivated at 65°C for 20 min.
Quantitative PCR
Standard curves run on the same plate in the PCR reaction underwent hybridization and ligation reactions in the same thermocycler run, using the same master mixes. Each quantitative polymerase chain reaction (qPCR) reaction was run in technical triplicate (three reaction replicates from the same sample). Results from each technical replicate of a sample were plotted individually and used to construct a single, average standard curve. PCR master mix was made up of 0.167 µL 60X TaqMan assay and 10 µL 2X TaqMan Gene Expression Master Mix (Applied Biosystems, Waltham MA, Cat: 4369016). 76.67 µL of nuclease-free water was added to each of the 20 µL products of the ligation reaction, mixed thoroughly by pipetting, then briefly spun down. 10.3 µL of PCR master mix was added to the wells of a 96-well, skirted, PCR plate with solid white wells (Bio-Rad Laboratories, Hercules, CA, Cat: HSP9655), followed by 9.7 µL of the diluted standards in technical triplicate. The PCR plate was sealed with optically clear adhesive film (Bio-Rad Laboratories, Hercules, CA, Cat: MSB1001), briefly centrifuged, very gently mixed via vortexing, then briefly centrifuged again. qPCR reactions were run on a CFX96 Optical Reaction Module for Real-Time PCR Systems (Bio-Rad Laboratories, Hercules, CA, Cat: 1845097) on a C1000 Touch Thermal Cycler Chassis (Bio-Rad Laboratories, Hercules, CA, Cat: 1841100), under the following conditions: 50°C for 2 min, 95°C for 10 min, and 39 cycles of 95°C for 15 s and 60°C for 1 min with plate read. Results were analyzed using CFX Maestro software (Bio-Rad Laboratories, Hercules, CA, Cat: 12013758).
Statistical analysis
For comparisons between standard curves in NHP tissues, reactions were performed on four tissues at a time to ensure all reactions would fit on a single PCR plate. Each qPCR reaction’s relative fluorescence unit (RFU) threshold was set to a value that generated the highest average R2 for each of the four standard curves on the PCR plate. All Splint-Ligation PCR reactions contained either frontal cortex or motor cortex standard curves, made from the same dilution series. To normalize plate-to-plate variability, we computed, for frontal and motor cortex, the mean fold-change in Cq relative to the first reaction run and applied this to the other Cq values from that qPCR plate to generate normalized Cq values. When determining average Cq for the frontal cortex and motor cortex, in order to determine the normalization factor, outliers were removed when percent coefficient of variation (%COV) of 2Cq exceeded 15% by excluding the replicate farthest from the median. Statistical analyses were performed using JMP Pro 16 and GraphPad Prism 9. The dynamic ranges of all tissues were determined as the broadest concentration range with an R2 > 0.980 (mixed-effects linear regression, α = 0.05) between ASO concentration and Cq value. Statistical significance when comparing standard curves was performed by linear mixed-effect regression model. Fixed effects used were tissue (or plate, when assessing plate effect), concentration, and interaction between the covariates (interaction was never found to be significant). Sample ID was included as a random variable to account for repeated measures when performing technical replicates. Technical replicate variation was higher than expected due to the nature of pipetting CNS homogenates and edge effects on PCR plates, necessitating outlier rejection on occasion (Supplementary Table S2). Reactions containing outlier replicates were determined by having a %COV of 2Cq >10%. In these cases, the Cq value furthest from the median was rejected.
Results
Splint-Ligation Assay design
The Splint-Ligation Assay involves two oligonucleotide probes [Splint Probes 1 (57 nucleotides) and 2 (56 nucleotides)], corresponding to the 5′ and 3′ends of the enhanced GFP (eGFP) cDNA template sequence, plus 9 to 10 nucleotides of complementary sequence to the 5′ or 3′ end of the ASO (Supplementary Fig. S2). eGFP was chosen because it can be easily amplified by qPCR using different commercially available assays and because it is not expressed in mammalian cells. If needed, the Splint Probes can be designed using a different TaqMan assay. The Splint Probes are added to a sample containing the ASO, where the hybridization reaction is performed (Fig. 1A). The Splint Probes hybridize to the ASO (Fig. 1B), where they are ligated together by the SplintR ligase (Fig. 1C). The concentration of the ligated probes, proportional to the ASO concentration in the sample, is then quantified by qPCR using a commercially available eGFP TaqMan assay [Fig. 1D, (Supplementary Table S1)]. The TaqMan assay is specific to the Splint Probes, allowing the use of the same assay across ASOs.
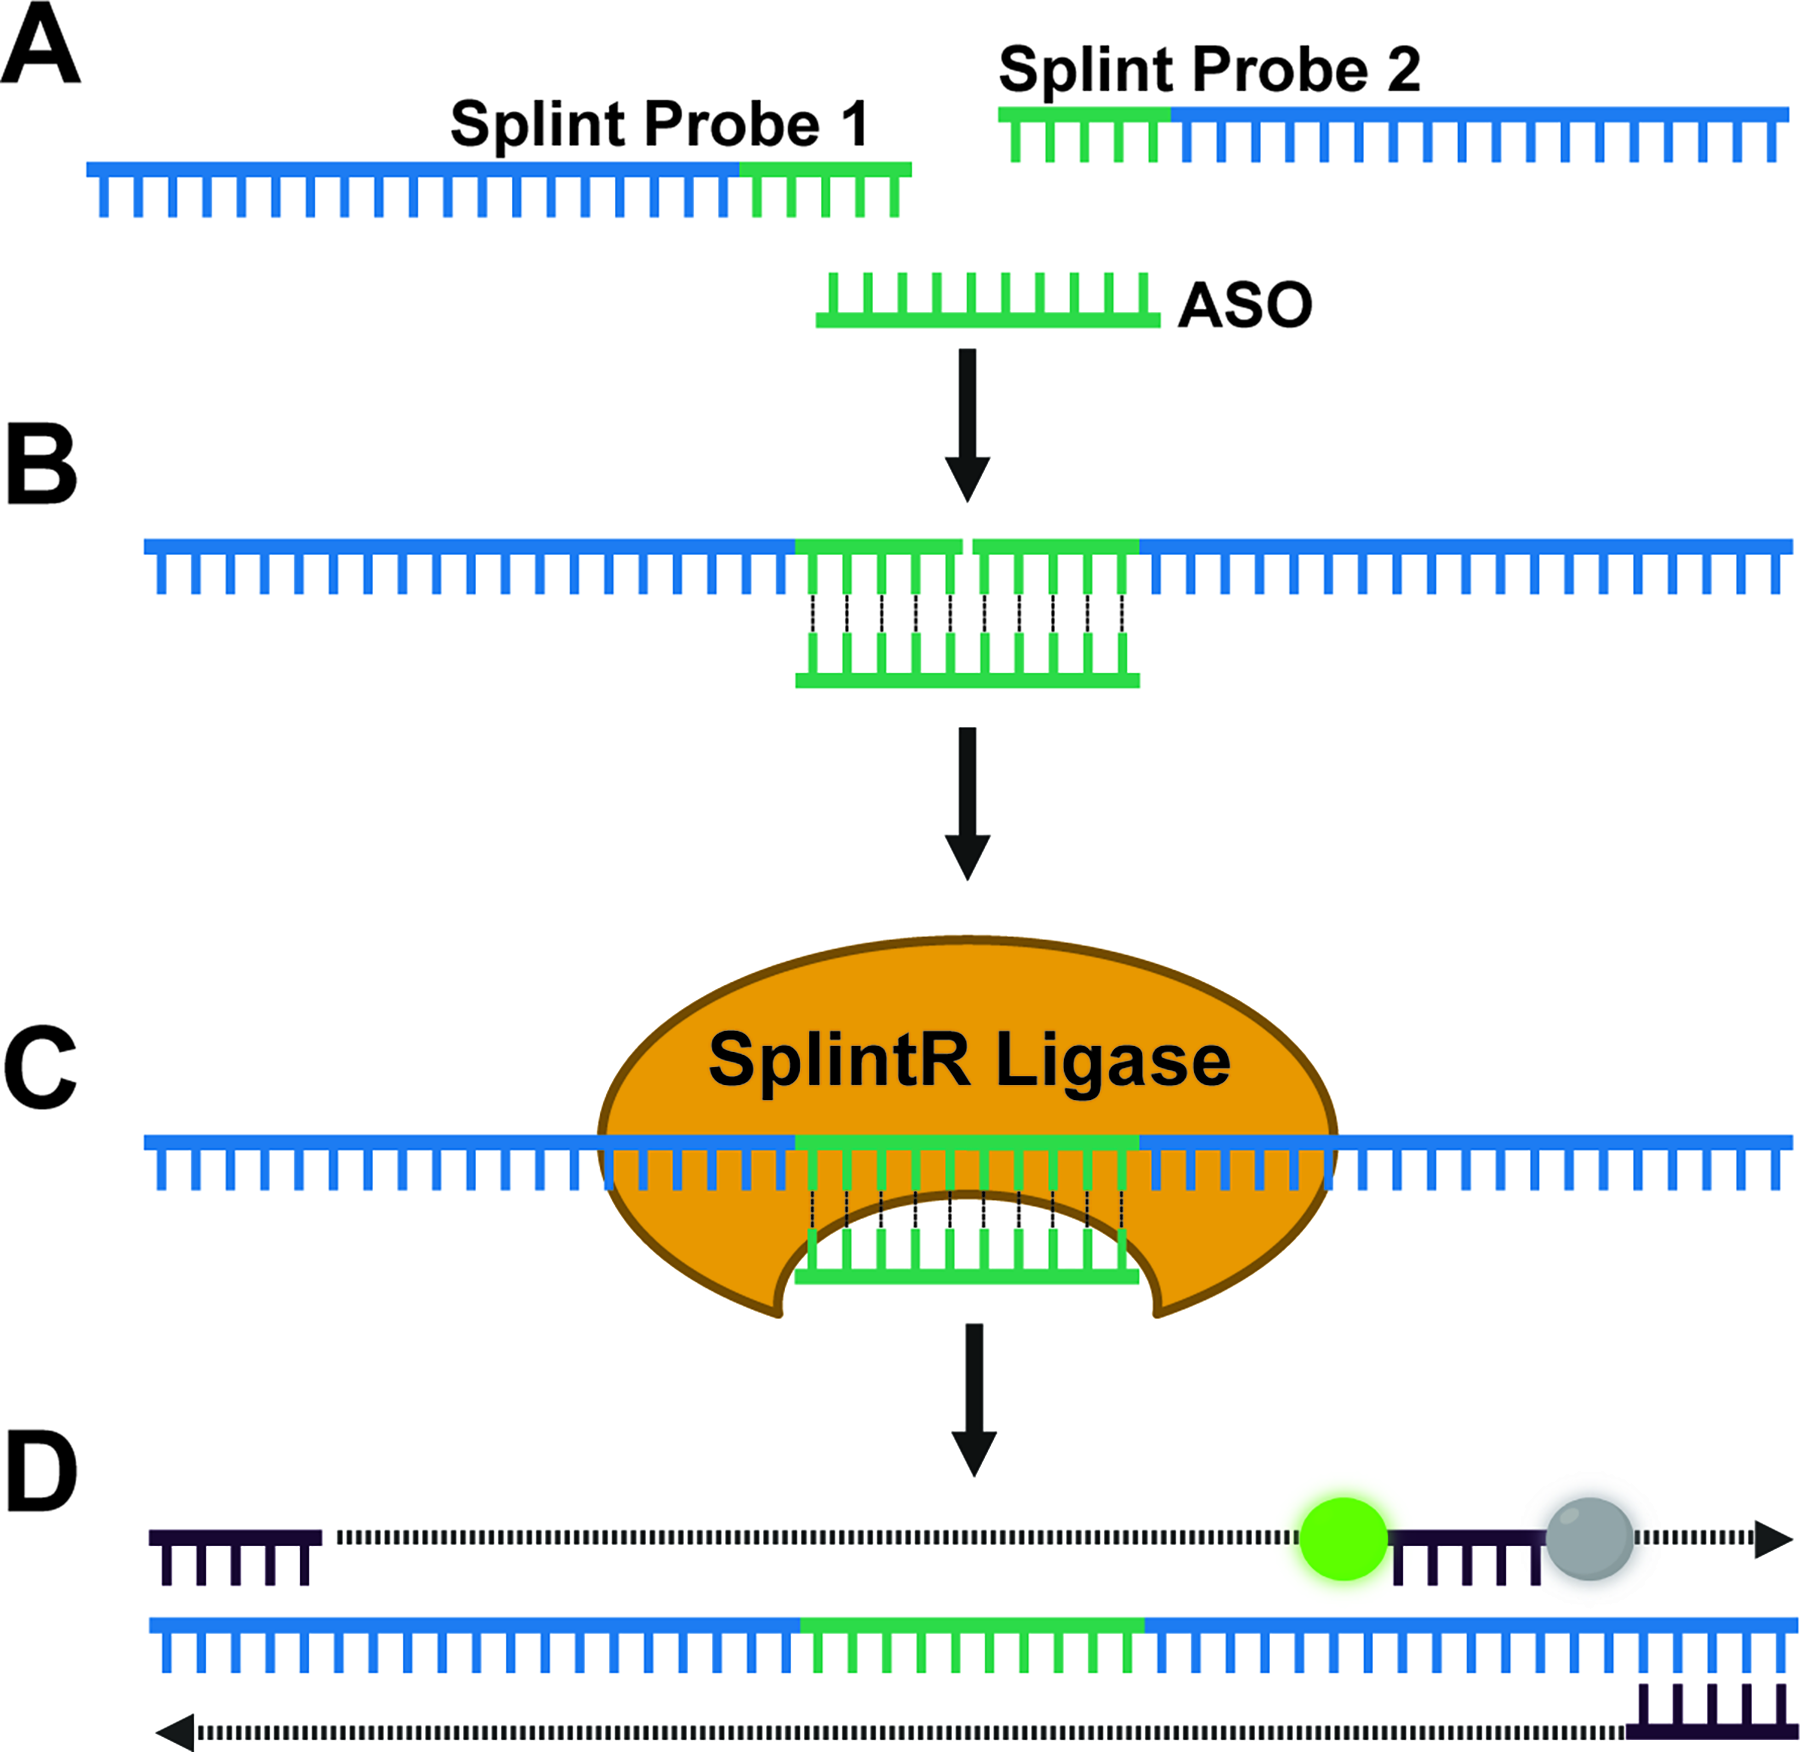
Schematic illustrating the Splint-Ligation PCR Assay for detection of ASO.
Splint-Ligation in mouse brain tissue
To evaluate the utility of the Splint-Ligation Assay, we created an assay for an LNA gapmer ASO (18-mer, 3-11-4 wing-gap-wing, full PS backbone) from a previous study 12 [LNA Gapmer 1, (Supplementary Table S1)]. The assay was first tested using a dilution series of LNA Gapmer 1 in water (1 pM, 3.16 pM, 10 pM, 31.6 pM, 100 pM, 316 pM, 1 nM, 3.16 nM, 10 nM, 31.6 nM, 100 nM, 316 nM, 1 µM, 3.16 µM, and 10 µM; [n = 3 technical replicates]). There was a strong correlation (R2 = 0.992) between the ASO concentration and Cq values across the linear dynamic range (31.6 pM to 31.6 nM) (Fig. 2A). A low level of ligated Splint Probes was detected (Cq = 29.22) in the negative control, indicating that the ligation reaction can occur without the ASO template.

= spiked before,  = spiked after.
Standard curves are generated by spiking known concentrations of an ASO into a control tissue homogenate. Following disruption of the tissue, the homogenate can be spiked with an ASO before or after the subsequent processing steps (ie, incubation and centrifugation). It is unclear whether some portion of the ASO is lost during this processing. To test this, we performed the Splint-Ligation Assay on a dilution series of LNA Gapmer 1 (100 pM, 1 nM, 10 nM, 100 nM, and 1 µM; [n = 3 technical replicates]) in mouse brain homogenate under two conditions: adding ASO to the tissue 1) pre- or 2) post-processing (see Methods). Cq values generated were significantly different between methods (mixed-effects linear regression, P < 0.001 [Fig. 2B]), resulting in approximately 15-fold more ligated probe detected in the samples spiked after processing than those spiked before. These findings indicate that a portion of the ASO is lost during processing (eg, by binding to cellular debris or insoluble proteins) and that spiking the tissue after processing underestimates the ASO concentration of samples calculated using the standard curve.
To determine the dynamic range of the assay in the mouse brain, we performed the Splint-Ligation Assay on a broader dilution series of LNA Gapmer 1 (10 pM, 31.6 pM, 100 pM, 316 pM, 1 nM, 3.16 nM, 10 nM, 31.6 nM, 100 nM, 316 nM, 1 µM, 3.16 µM, 10 µM, and 31.6 µM; [n = 3 technical replicates]) in whole mouse brain homogenate, spiked before processing. There was a strong linear correlation (R2 = 0.994) between ASO concentration and the Cq values across a broad dynamic range [31.6 pM to 1 µM (Fig. 2C)].
Previous studies have shown that standard curves generated using a splint-ligation assay for detecting ASOs with identical sequences but different nucleoside chemistries (LNA gapmer, 2′-OMe gapmer, 2′-MOE gapmer, 2′-MOE fully modified) have different dynamic ranges and slopes. 11 To evaluate the effect of ASO sequence on the Splint-Ligation Assay performance, we tested the assay using a dilution series of two LNA ASOs [LNA Gapmer 1 and LNA Gapmer 2 (Supplementary Table S1)] in water (1 pM, 10 pM, 100 pM, 1 nM, 10 nM, 100 nM, 1 µM, and 10 µM; [n = 3 technical replicates]). LNA Gapmer 1 and LNA Gapmer 2 differ in sequence but share a 3–11–4 LNA wing-gap-wing configuration and a full PS backbone. There was a strong linear correlation between ASO concentration and Cq value across a broad dynamic range for both LNA Gapmer 1 (R2 = 0.980, 100 pM to 100 nM) and LNA Gapmer 2 (R2 = 0.984, 1 pM to 1 µM) (Supplementary Fig. S3A). When analyzed within their overlapping dynamic range (100 pM to 100 nM), the standard curves for the ASOs in water have significantly different Cq values (Student’s T, P < 0.05) but do not have significantly different slopes (analysis of means with Nelson’s adjustment, P > 0.05). To evaluate this effect in mouse CNS samples, we tested the assay using a dilution series of the two LNA gapmers (1 pM, 10 pM, 100 pM, 1 nM, 10 nM, 100 nM, 1 µM, and 10 µM; [n = 3 technical replicates]) in whole mouse brain homogenate, with ASO spiked before processing. There was a strong linear correlation between ASO concentration and Cq value across a broad dynamic range for both LNA Gapmer 1 (R2 = 0.986, 100 pM to 10 µM) and LNA Gapmer 2 (R2 = 0.990, 1 pM to 100 nM) (Supplementary Fig. S3B). When analyzed within their overlapping dynamic range (100 pM to 100 nM), the standard curves for the ASOs have significantly different Cq values (mixed-effects linear regression, P < 0.0001) but do not have significantly different slopes (analysis of means with Nelson’s adjustment, P > 0.05).
Splint-Ligation Assay in NHP CNS tissues
Mammalian brains are comprised of regions that differ in cellular composition, cytoarchitecture, myelination, and extracellular matrix composition.13–16 Preclinical studies of CNS-targeted ASOs in NHPs often assess the pharmacological properties of the molecule in different CNS regions. We hypothesized that the efficiency of the Splint-Ligation Assay varies across CNS regions due to their different cellular and extracellular composition. To test this, we compared the dynamic range, efficiency [slope of linear regression], and Cq values using a dilution series of LNA Gapmer 1 (10 pM, 100 pM, 1 nM, 10 nM, 100 nM, and 1 µM; [n = 3 technical replicates]) in 16 cynomolgus macaque CNS regions [cerebellum, cerebellar nuclei, caudate nucleus, cortical white matter, frontal cortex, globus pallidus, hippocampus, motor cortex, medulla, pons, putamen, thalamus, temporal lobe, cervical spinal cord, lumbar spinal cord, and thoracic spinal cord (Supplementary Fig. S2)].
Comparing standard curves across 16 CNS regions requires ligation and PCR reactions on multiple 96-well plates. As an absolute difference in Cq values generated by the same template input is expected between separate reactions, 17 we examined the variability across plates (ie, plate effect) by comparing the dynamic range, efficiency, Cq values, and percent coefficient of variation (%COV) of three standard curves for motor and frontal cortex. The splint-ligation reaction was repeated from the serial dilutions each time in order to account for variability from both this reaction and the qPCR. The efficiencies were similar and not significantly different [analysis of means with Nelson’s adjustment, P > 0.05 (Supplementary Fig. S4A)]. The Cq values were not significantly different across the reactions and the plates for frontal cortex but were significantly different for motor cortex (mixed-effects linear regression [frontal cortex, P > 0.05; motor cortex, P < 0.0001]). The %COV of 2Cq values was low across technical replicates per reaction (mean frontal cortex = 4.23%; mean motor cortex = 6.55%) but high across plates [mean frontal cortex = 15.1%; mean motor cortex = 54.21% (Supplementary Table S3)]. These results indicate that the qPCR reaction can be variable across plates, and, therefore, reactions performed on different plates must be normalized to a standard curve from the same splint-ligation and qPCR reactions (see Methods). After normalization, Cq values did not differ significantly across reactions or plates (mixed-effects linear regression, [frontal cortex, P > 0.05; motor cortex, P > 0.05]). The %COV of 2Normalized Cq values was low across plates [mean frontal cortex = 8.84%; mean motor cortex = 9.53% (Supplementary Table S4 and Supplementary Fig. S4B)].
Next, we compared the dynamic ranges, efficiencies, and normalized Cq values of the standard curves across the 16 CNS regions. The dynamic ranges were different among brain regions and reactions (Fig. 3): 100 pM to 1 µM (cerebellar nuclei, cerebellum, cervical spinal cord, globus pallidus, lumbar spinal cord, medulla, thoracic spinal cord, temporal lobe) and 1 nM to 1 µM (caudate nuclei, cortical white matter, frontal cortex, hippocampus, motor cortex, pons, putamen, thalamus). The highest concentration (1 µM; 180,000 ng/g) examined was within the dynamic range, so the upper limit of quantification was not determined. Analysis of the overlapping dynamic range across regions (1 nM to 1 µM) indicated that the efficiencies were not significantly different [analysis of means with Nelson’s adjustment, P > 0.05 (Supplementary Fig. S5)]. In contrast, the normalized Cq values were significantly different (mixed-effects linear regression, P < 0.0001) across the brain regions. Pairwise comparisons of normalized Cq values revealed 3 Tissue Groups that are similar and not significantly different (Table 1, Supplementary Table S5). The Tissue Groups consisted of the following CNS regions [Tissue Group 1: frontal cortex, motor cortex, caudate nucleus, cortical white matter, hippocampus, medulla, pons, putamen, thalamus, temporal lobe; Tissue Group 2: globus pallidus, cervical spinal cord, thoracic spinal cord; Tissue Group 3: cerebellum, cerebellar nuclei (Table 1)]. Collectively, these findings indicate that, although the CNS regions have similar efficiencies (slopes) and dynamic ranges, the Cq values of the curves are different between several regions. The CNS regions with similar efficiencies and Cq values can be assigned to groups and analyzed together via pooling control lysates and using this to make one standard curve. Mixed-effects linear regression analysis of tissue groups within their dynamic ranges revealed no significant difference in normalized Cq between tissues of the same tissue group (mixed-effect linear regression, [Tissue Group 1, P > 0.1; Tissue Group 2, P > 0.1; Tissue Group 3, P > 0.1]).
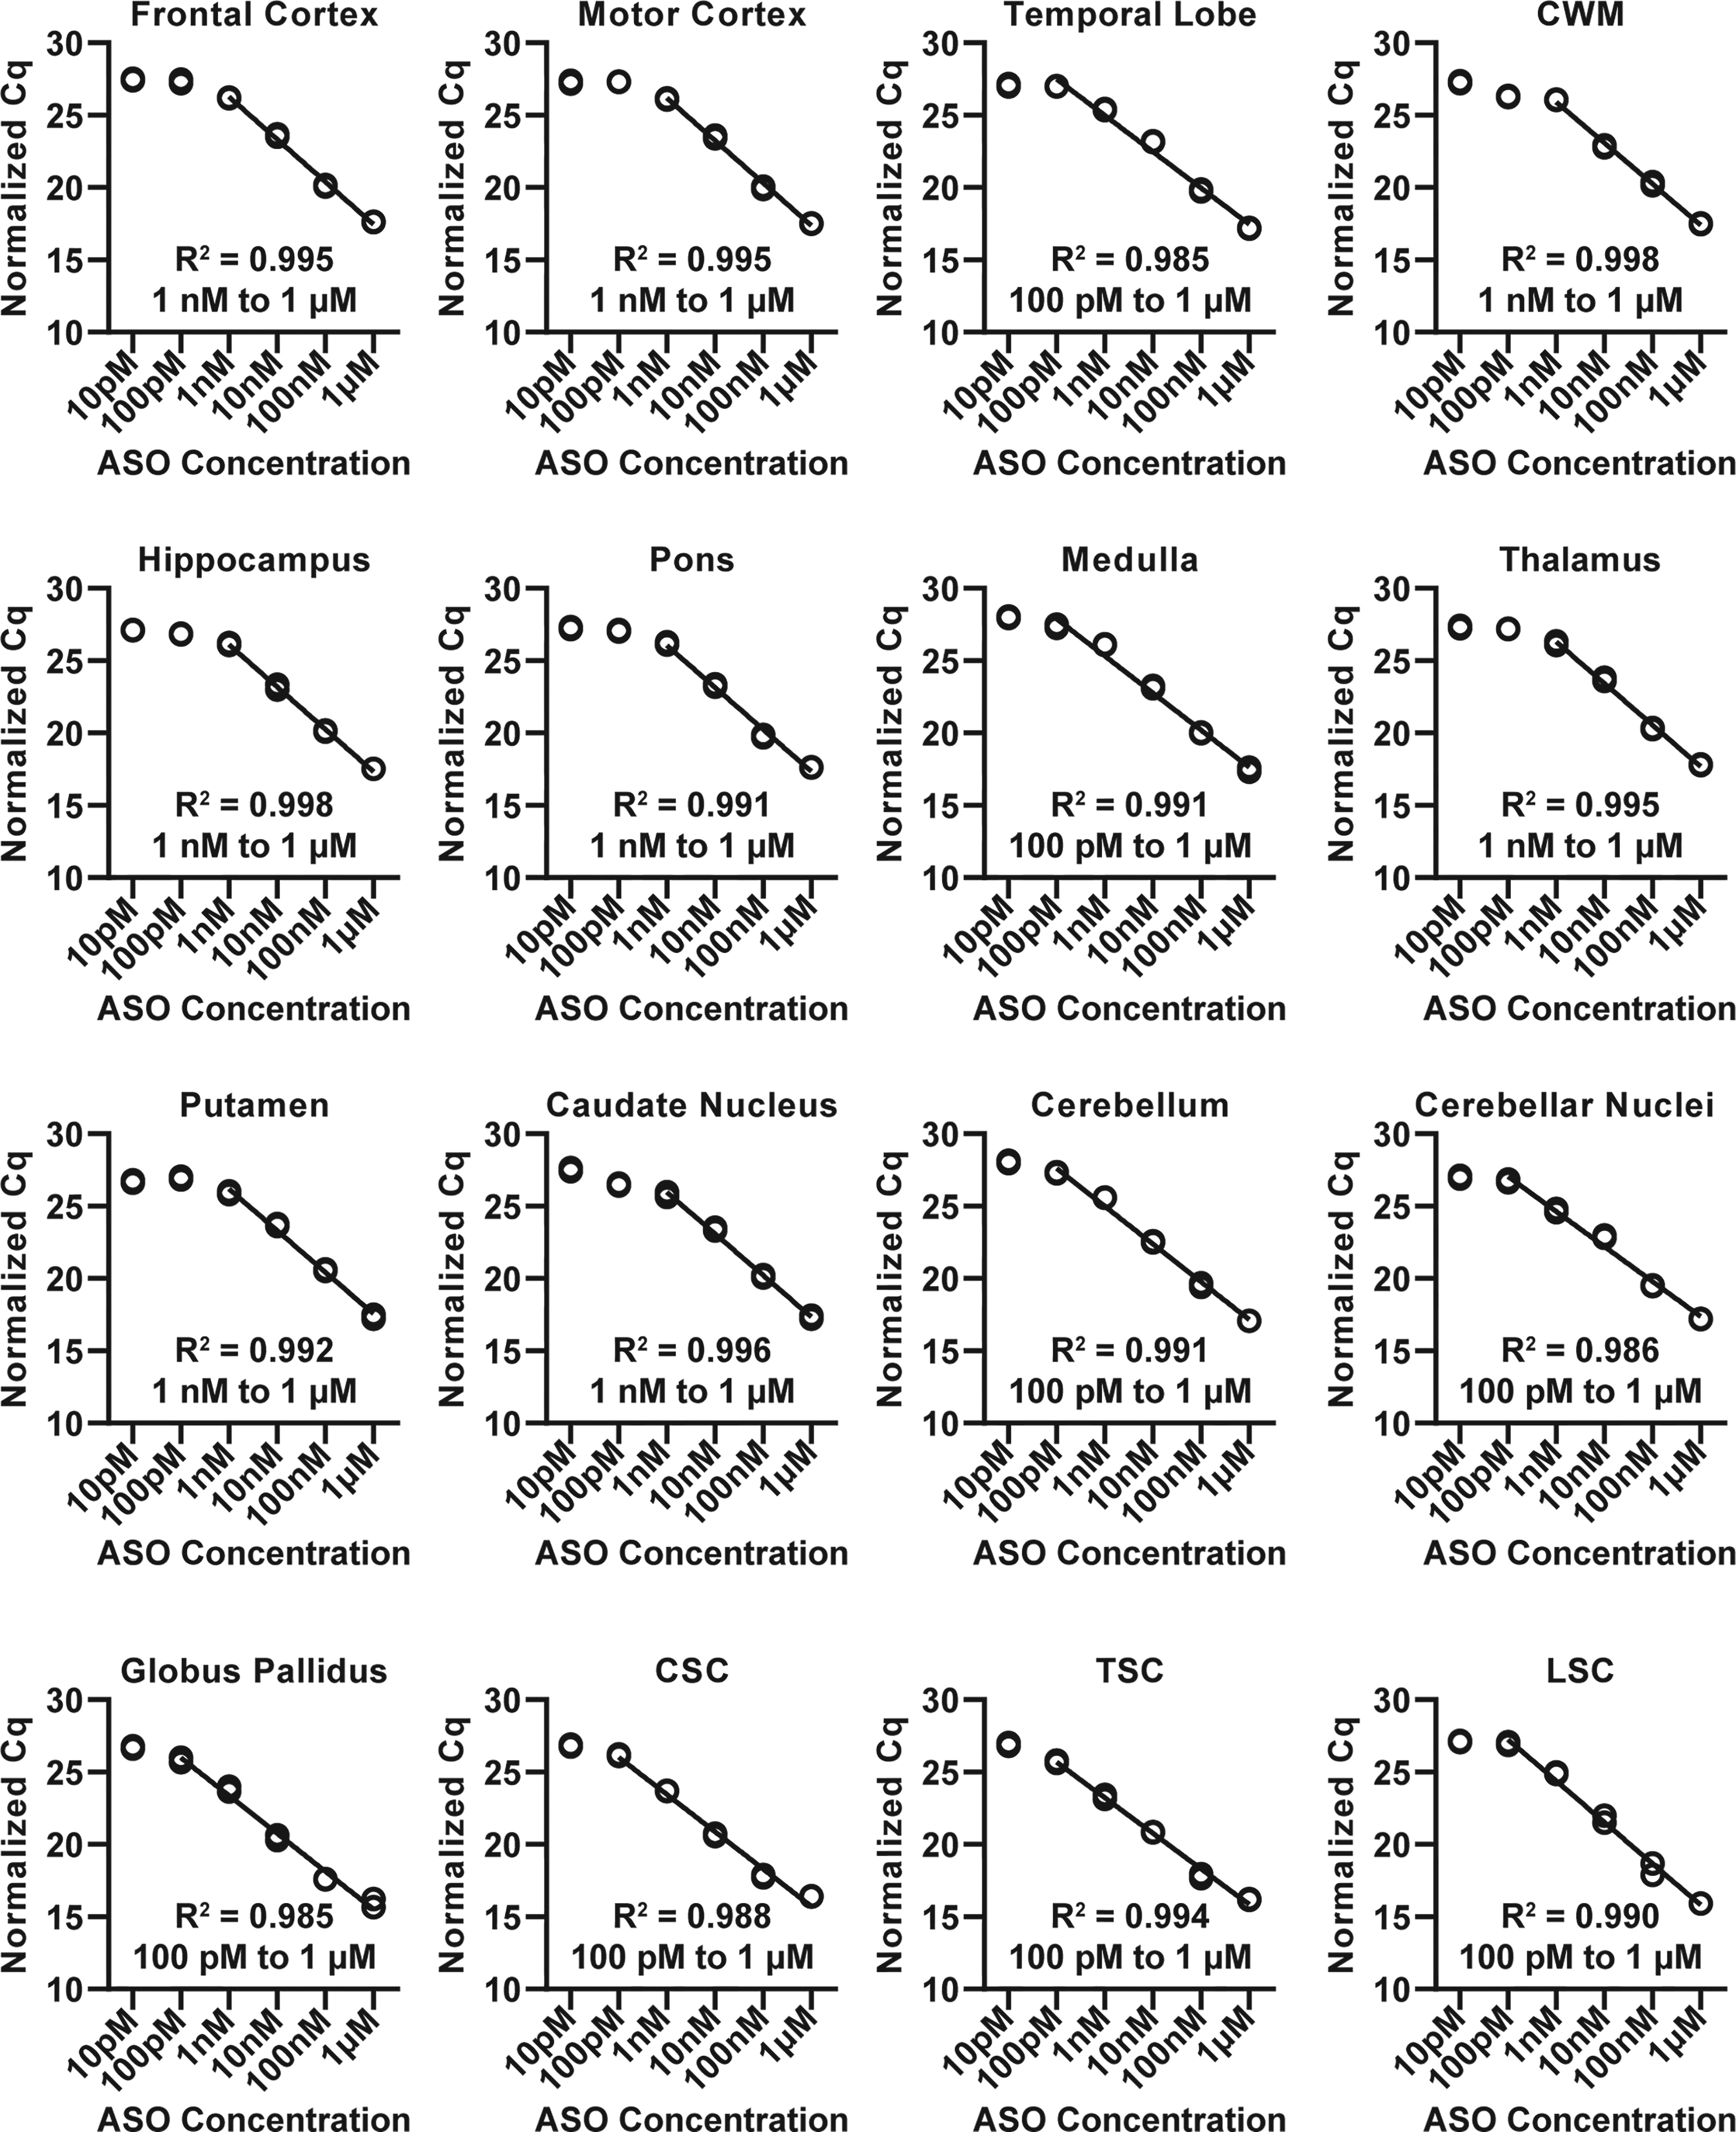
Splint-Ligation quantification of a dilution series of LNA Gapmer 1 (10 pM, 100 pM, 1 nM, 10 nM, 100 nM, 1 µM; [n = 3 technical replicates]) in 16 CNS region tissues (cerebellum, cerebellar nuclei, caudate nucleus, cortical white matter, frontal cortex, globus pallidus, hippocampus, motor cortex, medulla, pons, putamen, thalamus, temporal lobe, cervical spinal cord, lumbar spinal cord, thoracic spinal cord) of a cynomolgus macaque. ASO was spiked into tissue lysates following disruption and prior to homogenate incubation and centrifugation. ASO concentration plotted against normalized Cq values. Each technical replicate is plotted individually. CNS, central nervous system; CSC, cervical spinal cord; CWM, cortical white matter; LSC, lumbar spinal cord; TSC, thoracic spinal cord.
NHP Tissue Group Dynamic Ranges
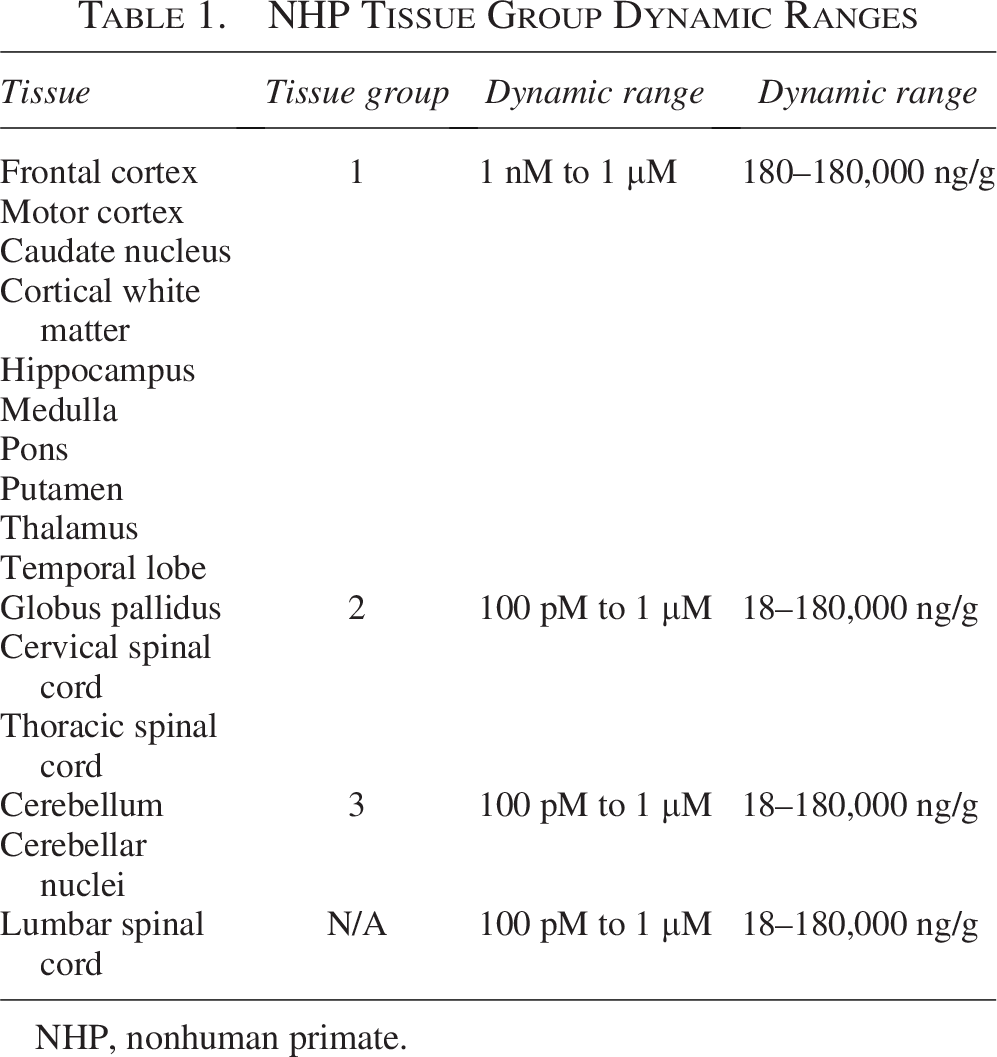
NHP, nonhuman primate.
Splint-Ligation Assay in NHP biofluids
To evaluate the Splint-Ligation Assay in NHP biofluids, standard curves of LNA Gapmer 1 (1 pM, 10 pM, 100 pM, 1 nM, 10 nM, 100 nM, and 1 µM; [n = 3 technical replicates]) were generated in cynomolgus plasma and CSF. The assay exhibited broad linear ranges in plasma [1 pM to 1 µM, R2 = 0.994 (Fig. 4A)] and CSF [100 pM to 1 µM, R2 = 0.984 (Fig. 4B)].
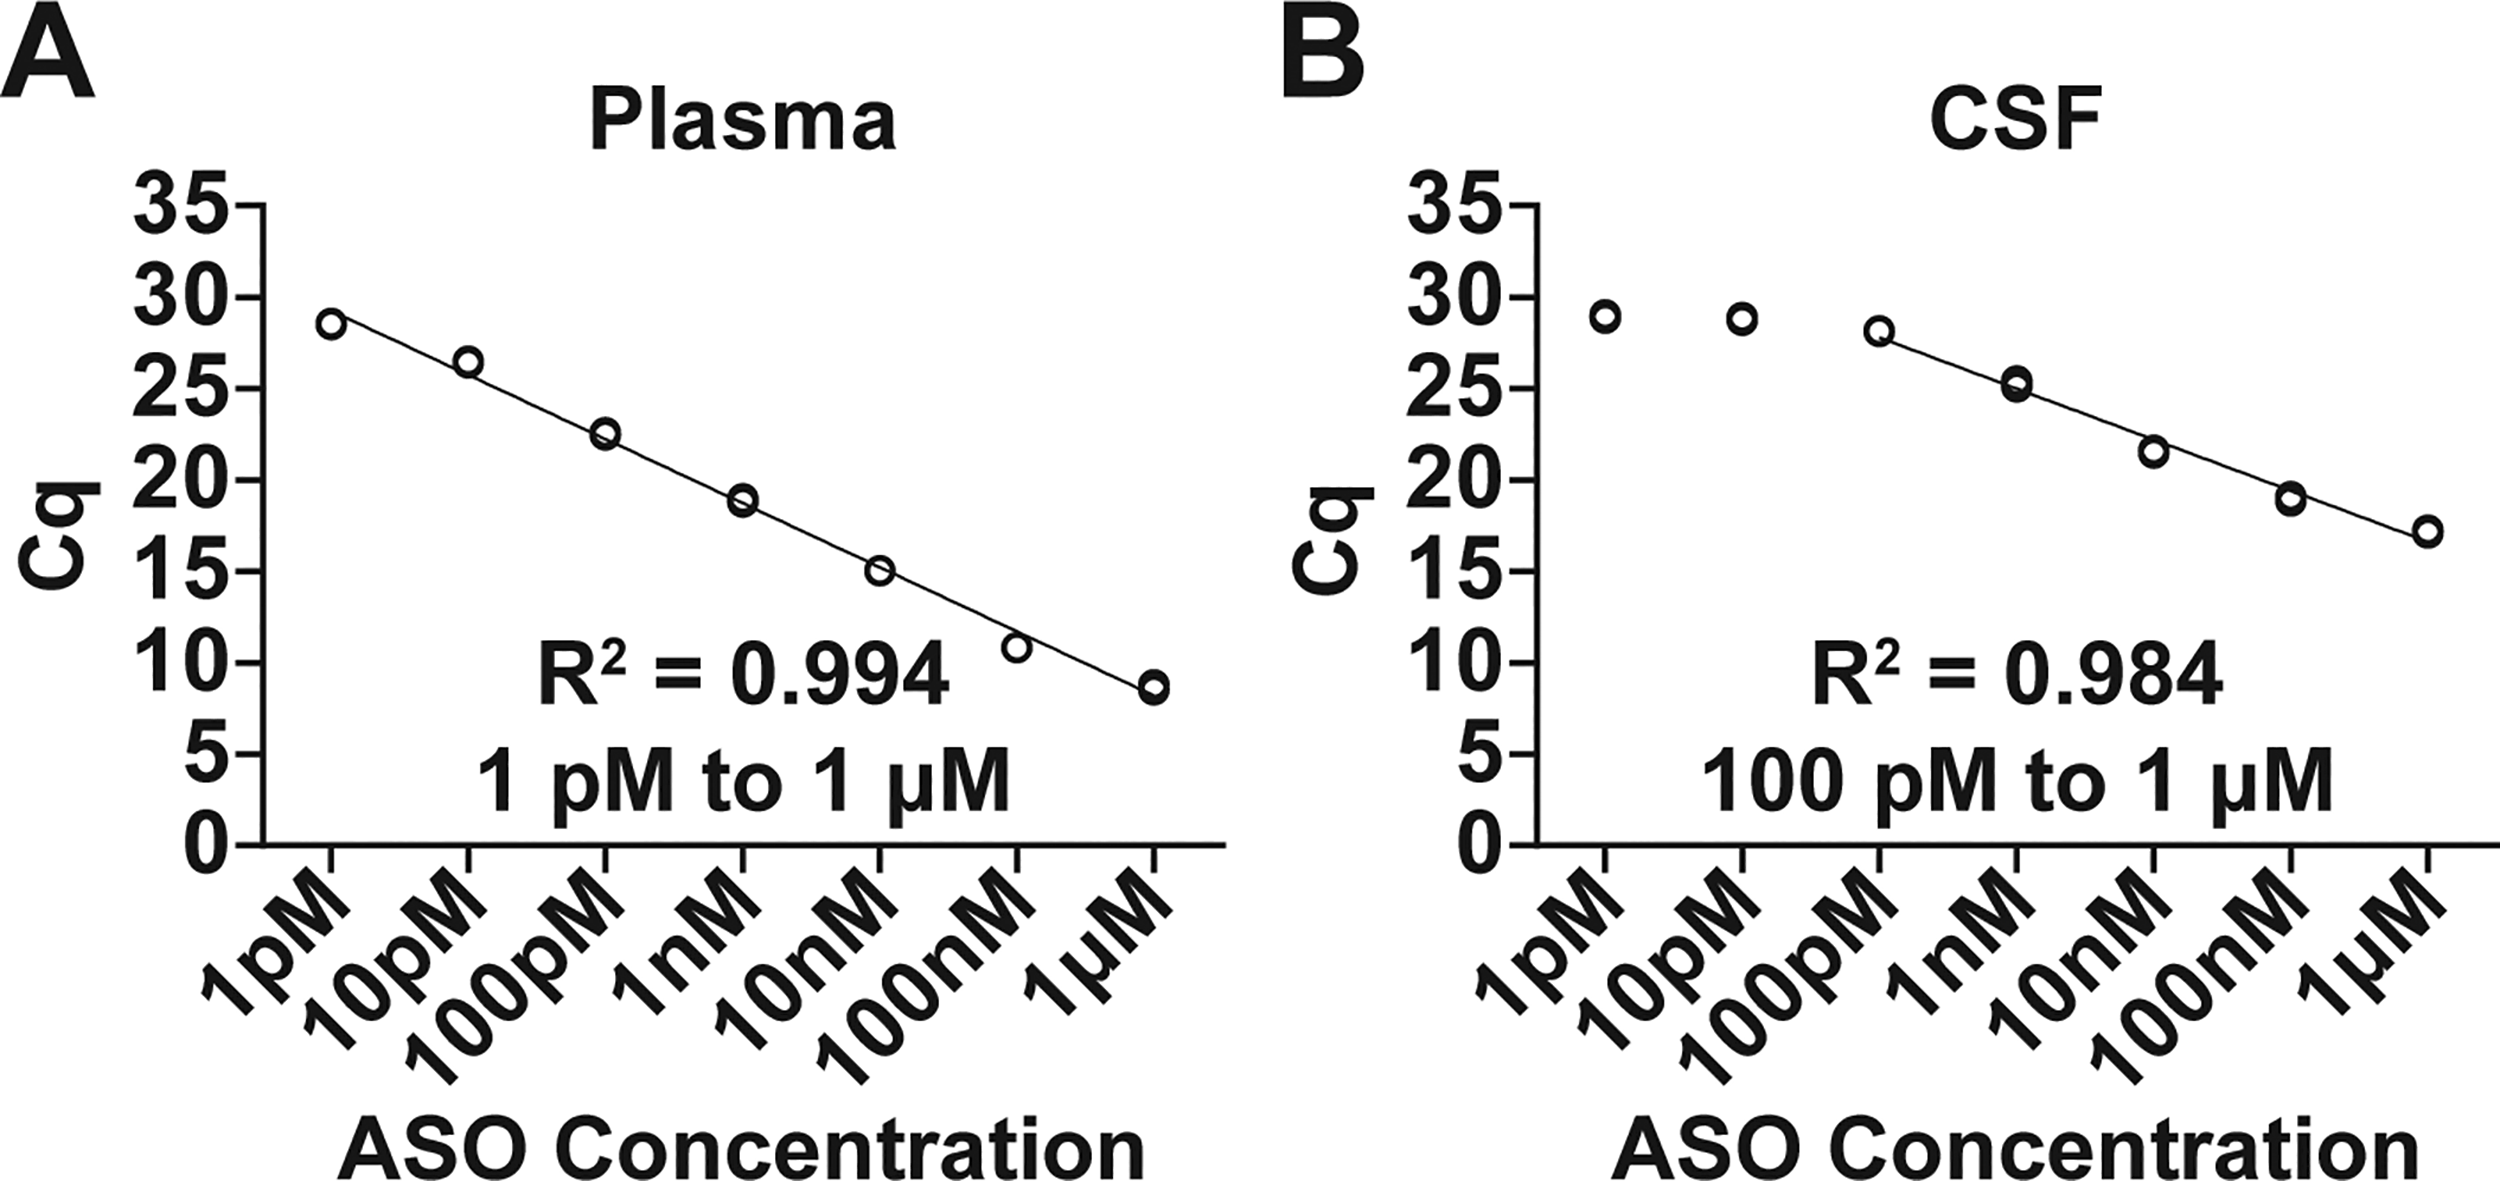
Splint-Ligation quantification of a dilution series of LNA Gapmer 1 (1 pM, 10 pM, 100 pM, 1 nM, 10 nM, 100 nM, 1 µM; [n = 3 technical replicates]) in NHP
Discussion
In this study, we show that the Splint-Ligation PCR Assay is a sensitive, simple, and accurate method for ASO quantification in NHP CNS tissues and biofluids. The design of the Splint Probes allows for using a single TaqMan assay to detect any ASO, reducing development time and complexity. We determined that controlling for matrix composition alone would not allow for accurate ASO quantification; therefore, the standard curves must be made in tissue homogenate pre-processing to avoid underestimation of sample ASO concentrations. We show that standard curves in 16 different NHP CNS tissues do not have a uniform relationship between ASO concentration and Cq value. However, we identified three groups of tissues with similar standard curves, allowing for the creation of standard curves in pooled control samples, minimizing the number of standard curves required to analyze different brain regions. Results from standard curves in NHP CNS tissues show a strong correlation between Cq values and ASO concentration within a linear dynamic range of up to 100 pM to 1 µM (18–180,000 ng/g). The Splint Ligation PCR Assay also demonstrated high sensitivity and a broad dynamic range in plasma (1 pM to 1 µM; 0.18–180,000 ng/mL) and CSF (100 pM to 1 µM; 18–180,000 ng/mL).
To control for the difference in matrix composition between samples and standards in ASO Splint-Ligation reactions, it was unclear whether ASO retrieval needed to be accounted for. Phosphorothioate ASOs bind to proteins,3,4 which make up a large proportion of the cellular debris that is removed from the samples by centrifugation during processing. We showed that a significant amount of the ASO is not retrieved when a sample is processed. By making serial dilutions via spiking the ASO into unprocessed homogenate immediately after tissue disruption and processing them in the same manner as the samples, we generate a standard curve that more accurately reflects the Cq values generated by a particular concentration of ASO in a sample.
When measuring ASO quantity in tissues from treated animals, we have observed that standard curves for different ASO sequences and chemistries can have different slopes and dynamic ranges. It is known that, when quantifying ASOs using splint-ligation assays, the number and type of nucleoside modifications to an ASO influence the slope and dynamic range of the generated standard curve. 11 Likewise, our results indicate that ASOs with different sequences but the same type and pattern of nucleoside modifications can produce standard curves with different dynamic ranges, and that this difference is observed when dilutions are made in both water and brain lysate.
For ethical and economic reasons, it is common to use relatively few control animals in NHP studies, often leading to a small number of control samples being available. We sought to mitigate the effect of this limit in the available control tissue matrix with which to make standard curves, as well as the time and resource burden imposed by running separate standard curves for every CNS region. By determining which groups of tissues can and cannot be run alongside each other with the same standard curves, we minimize the tissue burden per control animal, reagents, labor, and plate space associated with running separate curves for every brain region, while ensuring that invalid comparisons are not made. We identified three tissue groups, within which there are no significant differences between tissues in slope and Cq response to initial ASO concentration. As well as these broad groups, we show that it is possible to share standard curves between many smaller groups of tissues.
The assay is highly sensitive in NHP CNS samples, detecting down to 100 pM concentrations, approximately 18 ng of ASO per 1 g of tissue. This allows for less tissue to be used per sample, as balance sensitivity is more likely to constrain the mass of tissue required (<10 mg) than the sensitivity of the assay. It is therefore possible to use the same 4 mm biopsy punch (∼40 mg) for both PD and PK assays, allowing accurate determination of the dose-response relationship by measuring protein, nucleic acid, and ASO concentrations from the same sample. Refining of reaction conditions and equipment used could likely lower the lower limit of quantification (LLOQ).
This assay addresses several drawbacks of common ASO quantification methods. High-performance liquid chromatography and capillary gel electrophoresis methods used in PK studies have been shown to have LLOQs as high as 200 ng/mL in plasma and 600 ng/mL in tissues, 18 154 ng/mL with a 25% COV in plasma, 19 and 10 nM in plasma (standard curve 1: 10–500 nM, R2 = 0.962; standard curve 2: 0.5–20 µM, R2 = 0.998). 20 Hybridizing Enzyme-Linked Immunosorbent Assay (ELISAs) have achieved much greater sensitivities, with examples of LLOQs in tissues from studies including 1.52 ng/mL 21 and 0.77 ng/mL, with a 25% COV 19 in plasma. However, hybridizing ELISAs have limited dynamic ranges and require extensive sample processing. The Splint-Ligation PCR Assay has a low LLOQ and a broad dynamic range in plasma, with reliable detection demonstrated from 0.18 ng/mL to 180 µg/mL. The Splint-Ligation PCR Assay also has a low LLOQ and broad dynamic range in CNS tissue, reliably detecting as low as 18–180 ng/g and as high as 180 µg/g, with an average %COV between three splint-ligation and qPCR reactions each of frontal and motor cortex of <10%.
Drawbacks of this assay include higher than usual technical replicate variation, seemingly due to the viscosity and tendency to foam of the lysate, a phenomenon previously observed with this type of reaction, particularly for brain tissue. 11 Several strategies described in the Methods section aim to mitigate the impact of reduced pipetting accuracy associated with lysate properties. For instance, samples are mixed thoroughly by pipetting rather than vortexing to minimize reagent foaming. Ten-fold serial dilutions are prepared by adding 5 µL of sample to 45 µL of diluent, reducing pipetting error when generating the standard curve compared with using a smaller volume. In addition, qPCR reaction volumes were increased from 10 µL to 20 µL to improve pipetting precision and to reduce the proportion of lysate in each reaction, minimizing issues related to viscosity and foaming. A remaining limitation is the plate effect, necessitating inclusion of at least one standard curve per qPCR plate. We attempted to ameliorate this by using a 384-well plate format. However, both with and without the use of a liquid handler, the technical replicate variation remained higher than acceptable. Instead, by defining tissue groups, we increase the number of samples that can be compared against a single standard curve per plate.
In conclusion, we have developed a Splint-Ligation PCR Assay for the accurate quantification of ASOs in NHP CNS tissues and biofluids. The assay uses standard laboratory equipment and relatively inexpensive reagents, allowing it to be run in any lab with access to a qPCR thermocycler. The ability to design the Splint Probes around any available TaqMan assay, and only requiring a single TaqMan assay to detect any ASO, expedites the analysis of ASOs. The assay does not have to be redeveloped between ASOs, besides evaluating dynamic range. This method requires very small quantities of tissue (<10 mg) and does not compromise on the sensitivity of results compared with alternative methods. The assay also has a broad dynamic range and is therefore less likely to require dilutions and reruns, making it a very efficient assay to assess ASO concentration in limited samples. A limitation of this study is that we do not report data from treated animals. Future applications of this assay in samples from ASO-treated animals, to determine PK parameters in preclinical studies, could lead to a greater throughput of data, due to the increased speed, availability, and performance relative to other available methods, at a lower financial and time cost, leading to more efficient pharmacological studies for the treatment of genetic disorders of the CNS using ASOs.
Footnotes
Acknowledgments
Non-author contributors. The authors are grateful to Ashley Coffell, Tim Chiu, Luke Myers, Taira Saracco, and Alasdair Taylor for their valuable advice and critical feedback regarding this work.
Author Disclosure Statement
S.V.D. has an equity interest in Ultragenyx Pharmaceutical and is an employee of Ultragenyx Pharmaceutical.
Funding Information
This work was supported by Ultragenyx Pharmaceutical (to S.V.D.).
Supplemental Material
Supplemental Material
Supplemental Material
Supplemental Material
Supplemental Material
Supplemental Material
Supplemental Material
References
Supplementary Material
Please find the following supplemental material available below.
For Open Access articles published under a Creative Commons License, all supplemental material carries the same license as the article it is associated with.
For non-Open Access articles published, all supplemental material carries a non-exclusive license, and permission requests for re-use of supplemental material or any part of supplemental material shall be sent directly to the copyright owner as specified in the copyright notice associated with the article.