
Abstract
This study focused on the academic performance and use of disability support services (DSS) of students with different types of disabilities who attend a postsecondary education institution. Findings show different patterns of academic success over four semesters as well as different patterns of DSS usage. Students who requested support from DSS were more likely to demonstrate improved academic performance, but relatively few students sought such support. The authors discussed the implications for professionals in working with this population.
Increasing numbers of students with disabilities attend colleges and universities after graduation from high school (DaDeppo, 2009; Horn & Nevill, 2006; Snyder, Tan, & Hoffman, 2004; U.S. Department of Education, 2002), and research has shown that students with disabilities who have graduated are more likely to obtain professional employment after completing a university degree (Flannery, Slovic, Benz, & Levine, 2007; National Council on Disability, 2003; Stodden, Dowrick, Anderson, Heyer, & Acosta, 2005). The successful completion of a university degree is closely dependent on students’ academic performance.
Research on the academic performance of students with disabilities shows a bleak picture. Most of the research in the area has focused on students with a learning disability (LD), and the consensus is that these students enter college as many as three years later than students without a disability (Wolanin & Steele, 2004), lag behind academically, and fail to progress and complete their programs at a level and a timeframe comparable with their peers without disabilities (Murray, Goldstein, Nourse, & Edgar, 2000; Public Accounts Committee, 2008; Stodden, Whelley, Chang, & Harding, 2001; Wagner, Newman, Cameto, Garza, & Levine, 2005). For example, Murray et al. (2000) found that only 24% of students with learning disabilities had graduated from a university compared with 45.5% of their peers without disabilities.
Although students with learning disabilities comprise a significant percentage of university students with disabilities, students with other types of disabilities (i.e., sensory or orthopedic, neurological, or psychological disabilities) also increasingly attend postsecondary education institutions, given advances in medical, educational, and environmental technologies and federal laws mandating improved access to postsecondary education (National Center for Education Statistics, 1999; Skinner, 2004). The percentage of high school graduates with various disabilities who enroll in postsecondary educational institutions recently doubled, according to Newman (2005), showing a need for expanding the focus of studies from those with learning disabilities to including those with other disabilities.
To investigate academic performance for those with a disability at a university, researchers have studied aptitude and cognitive factors such as SAT scores and high school GPA scores (DeBerard, Spielmans, & Julka, 2004; Hall & Webster, 2008), previous junior university experiences (Johnson, Zascavage, & Gerber, 2008), metacognitive abilities (i.e., knowledge of learning strategies and the ability to use this knowledge; Hall & Webster, 2008), affective factors (i.e., self-concept and self-worth), or behavioral factors (such as use of accommodations; Allsopp, Minskoff, & Bolt, 2005), locus of control and adjustment (Estrada, Dupoux, & Wolman, 2006), and level of self-determination (Hong, Ivy, Gonzalez, & Ehrensberger, 2007).
Another area that has received attention is the degree to which students are academically and socially integrated on campus (DaDeppo, 2009). Tinto’s (1975, 1993) theoretical model of integration shows that students’ academic performance and retention in college are directly influenced by various factors such as individual characteristics (e.g., ability, social economic status, parents’ expectations), pre-college experiences (e.g., GPAs, academic and social attainments), and commitments (goal and institutional commitments). However, the model argues it is the individual’s integration into the academic and social systems of the college that most directly relates to his or her performance and persistence in college. Academic integration includes the individual’s grade performance and the individual’s intellectual development. Social integration involves notions of levels of integration and of degrees of congruency between the individual and his or her social environment. Academic and social integration for students with disabilities in postsecondary institutions is highly related to the university environment and resources available, such as students’ registration and utilization of the university’s disability support services (DSS).
The Rehabilitation Act of 1973 (P.L. 93–112) and the American with Disabilities Act of 2008 as amended for both statutes (P.L. 110–325) mandate that universities provide accommodations to individuals with disabilities. DSS on campus serve to reduce or mitigate the academic and social obstacles encountered by students with disabilities in postsecondary education (Komives, Woodard, & Associates, 2003). Komives et al. (2003) and Troiano, Liefeld, and Trachtenberg (2010) asserted that engagement with university disability and academic support services greatly improves the social and academic integration for students with a disability, which in turn positively affects their academic performance.
Shepler and Woosley (2012) highlighted the need to examine the early integration experiences of students with disabilities transitioning from secondary education to postsecondary education. Particularly, there is a paucity of studies that compare the academic performance of students with disabilities who registered with DSS with that of students who did not (Rath & Royer, 2002). The few studies that have been conducted showed that higher levels of access to an academic support center were related to a higher overall GPA and rates of graduation (Getzel, McManus, & Briel, 2004; Trammell, 2003; Troiano et al., 2010). Hyde et al. (2009) found a higher graduation rate (47%) among students who accessed DSS on campus compared with those who did not (37%), and a higher withdrawal rate among students who did not access the service.
These studies have their limitations. They have small sample sizes and focused exclusively on students with learning disabilities. There is a need for studies with adequate sample sizes that explore the degree of support seeking of students with different types of disabilities and the relationship between accommodations and academic performance.
The purpose of this study was to examine the academic performance of students within various disability categories (e.g., cognitive, physical, psychological disabilities, and students without disabilities), whether students with different types of disabilities sought access to the campus DSS office, and the relationship between accommodations and academic performance during the first four semesters in a university.
This study intended to investigate the following three research questions:
Research Question 1: How do the academic performances vary by disability category across four semesters?
Research Question 2: What are the rates of requesting accommodations at DSS among students with various disability categories?
Research Question 3: How do the rates vary by disability category?
Research Question 4: What is the relationship between requesting accommodations and academic performance among students with disabilities by disability category across four semesters? Whether requesting accommodations was associated with improved academic performance among students with various disability categories across the first four semesters in a university?
Using Tinto’s model as a conceptual base, we defined being engaged with the campus community as seeking contact (i.e., registering) with the campus DSS office to receive accommodations and other services. The actual use of accommodations and services is beyond the scope of this study.
As only a few studies have examined the academic performance of students with different types of disabilities, we did not hypothesize on differential academic performance. We did hypothesize, however, that students who registered with DSS would perform better academically than those who did not, as has been shown in earlier studies (Getzel et al., 2004; Trammell, 2003; Troiano et al., 2010).
Method
Participants
The sample comprised incoming students who responded to an item on the survey requesting information about their disability category. It included the following options: (a) deaf/hard of hearing, (b) blind/severe visual impairment, (c) learning disabled, (d) medical/other, (e) physical disability, (f) attention deficit disorder, (g) attention deficit hyperactivity disorder, (h) psychological, (i) other, please specify, and (j) none of the disabilities. In the (i) category, “other, please specify,” respondents reported disabilities, including hemophilia, kidney transplant, high blood pressure, Asperger syndrome and asthma.
For this study, we collapsed LD, attention deficit disorder, and attention deficit hyperactivity disorder into a category we called cognitive disability, as these disabilities are known in the field to be related (Web Accessibility in Mind, 2010). For the analyses, we used psychological, cognitive, physical disability and no disability categories only, as the numbers in the remaining categories were too low to be analyzed.
The numbers of completed surveys for the yearly total groups were 3,340 for the year 2005–2006; 2,532 for the year 2006–2007; 1,807 for the year 2007–2008, and 1,226 for the year 2008–2009 (see Table 1). For the respective years, 38, 306, 625, and 765 participants did not respond to the question asking them about their disability category. Within the groups that responded, those who reported psychological disabilities across the years ranged from .8% to 3%, cognitive disabilities ranged from 2% to 5.2%, physical disabilities from 1.7% to 3.8%, and the percentages of those who indicated no disability ranged from 91.2% to 93.3%.
Self-Reported Type of Disability of Entering University Students.
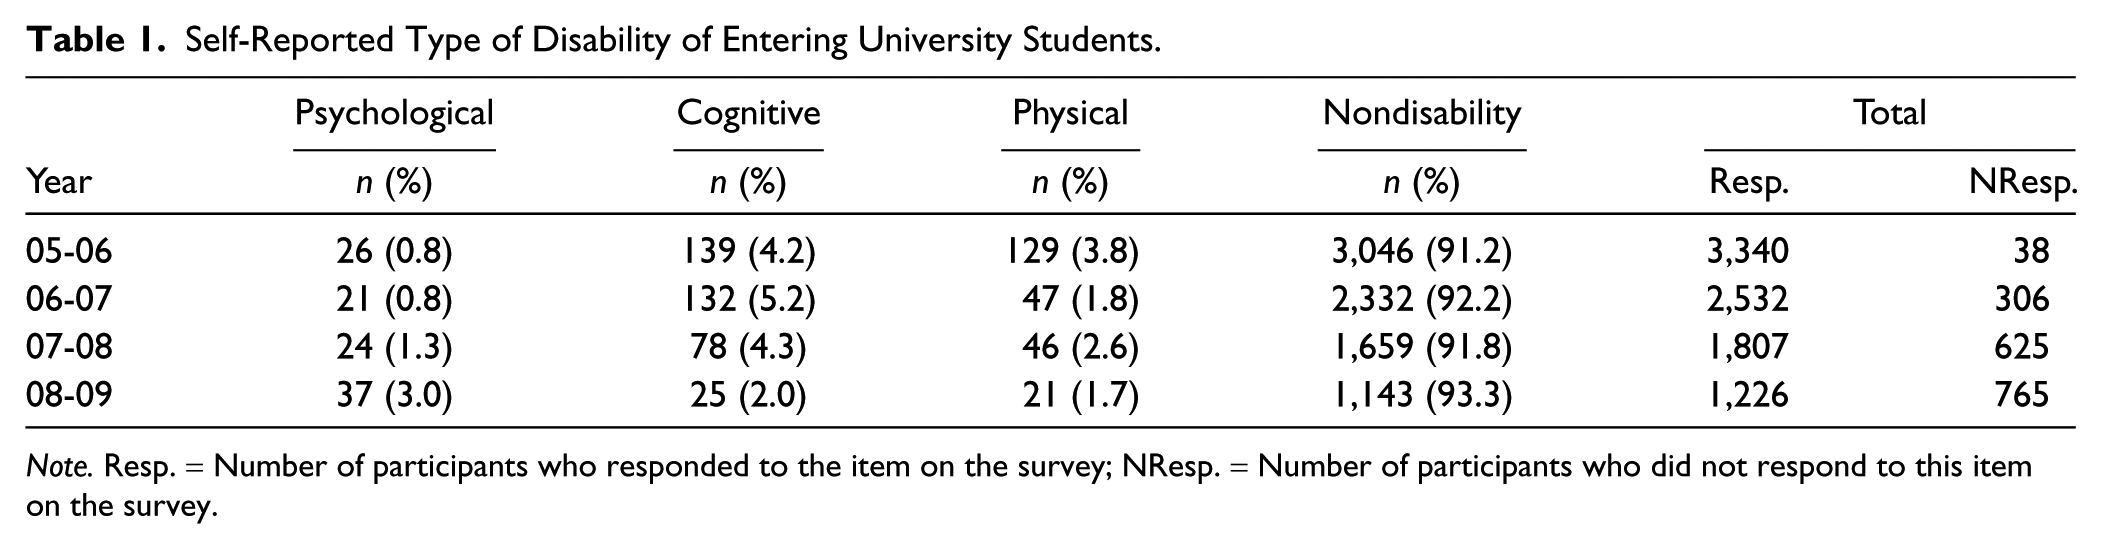
Note. Resp. = Number of participants who responded to the item on the survey; NResp. = Number of participants who did not respond to this item on the survey.
For the yearly total groups, the percentages of women ranged from 49.1% to 53.7% and of men from 46.3% to 50.9%, across the years. The data seem to be consistent with the trend reported in a National Longitudinal Transition Study (NLTS-2) study in that female students with disabilities were more likely to have been enrolled in a college (Wagner et al., 2005). The percentage of African American students ranged from 10.7% to 14.4%, Asian American students from 12.2% to 13.8 %, Latino/a from 4.3% to 7.3%, and Whites from 58.3% to 68%, across the years.
Procedure
We selected participants from the respondents of an online general survey given each year to incoming 1st-year students after completing their summer orientation program at the authors’ university. Students received an email inviting them to complete the survey and those who gave consent were directed to the online survey. Three rounds of follow-up emails were sent to those who did not respond to the survey. Participation was voluntary.
The survey consists of 200 items, including demographic questions such as gender, ethnicity, and disability category; and scales that explore attitudes and behaviors related to academic, relationship, and career-development issues. Some items were dichotomous; others were on a Likert-type scale. We obtained IRB approval before conducting the research and protected confidentiality by storing the data in a secure location such as a password protected computer and a locked cabinet in a locked office. To reach a sample size sufficiently large to do comparisons, we used participants from 2005 through 2009.
Data Analyses and Variable Operationalization
We compared self-reported disability category, including those who reported “no disability,” by gender and ethnicity using chi-square analyses and standardized residuals to determine contributors to significant χ2 values. Furthermore, we tracked the academic performance of students entering the years of 2005 and 2006 during four semesters at the university using university warehouse data, by disability category (n = 9,090). For those entering in 2007 and 2008, only the first and second semester academic performance data was available (n = 7,830). We operationalized academic performance as the following: (a) at the end of the semester registered as a student at the university and in good academic standing; (b) at the end of the semester registered as a student at the university and on academic probation (i.e., students whose cumulative GPA fell below 2.0); (c) at the end of the semester registered as a student at the university and academically dismissed (i.e., students who, following a probationary semester, had failed to attain a minimum semester GPA of 2.0); (d) or not registered at the end of the semester (including those who had not registered for classes or those who had registered but cancelled their registration or withdrew from classes during the semester).
We decided that using these categories for comparison would be more informative than comparing the different groups’ GPAs because attrition (i.e., students not registering for classes because of dismissal, or cancelling or withdrawing from classes during the semester, often because they experienced academic difficulties) would result in a number of students not being included in the analysis. Especially those who had academic difficulties would be excluded, because these students would not earn a GPA for that semester, making comparisons dubious.
Finally, for the different types of disability groups, including those reporting “no disability,” we examined whether requesting accommodations with the university’s DSS at least one semester was related to good academic standing. For this analysis, we used the variable “at the end of the semester registered as a student at the university and in good academic standing,” and called it “in good academic standing.” For all comparisons, we used chi-square analyses and standardized residuals to determine contributors to significant χ2 values.
Results
Table 1 shows that, among those who self-reported a disability when entering the university, most reported a cognitive disability. However, the numbers change over the years in that the percentages of those reporting a cognitive or physical disability decreased, whereas the percentage of those reporting a psychological disability showed a slight increase. In addition, over the years, more incoming students chose not to respond to the item on the survey requesting disability category (see Table 1).
Not shown in the tables, but our data showed that increasingly higher percentages of females compared with males report psychological disabilities each year (ranging from n = 15, 57.7% to n = 25, 67.6% for females vs. n = 12, 32.4% to n = 11, 42.3% for males). In addition, males reported cognitive disabilities significantly more often than females, ranging from n = 68, 49% to n = 20, 80% for males, versus n = 5, 20% to n = 71, 51% (χ2 = 28.26, 3, p < .01). In terms of ethnicity, Caucasians tended to cluster in the cognitive and psychological disability categories (χ2 = 95.13, 15, p < .01), but we found no other consistent trends in terms of ethnicity.
Academic Performance During Four Semesters by Disability Category
Psychological disability
As shown in Table 2, a significantly high percentage: 28.2%, χ2(n = 9,090, df = 6) = 37.92, p < .001, and 30.4%, χ2(n = 9,090, df = 9) = 36.772, p < .001, of students reporting a psychological disability, as compared with those with other disabilities or “no disability,” was not registered for classes at the end of the first and second semester. This trend did not continue into the third and fourth semester.
Academic Performance During Four Semesters, by Self-reported Type of Disability.
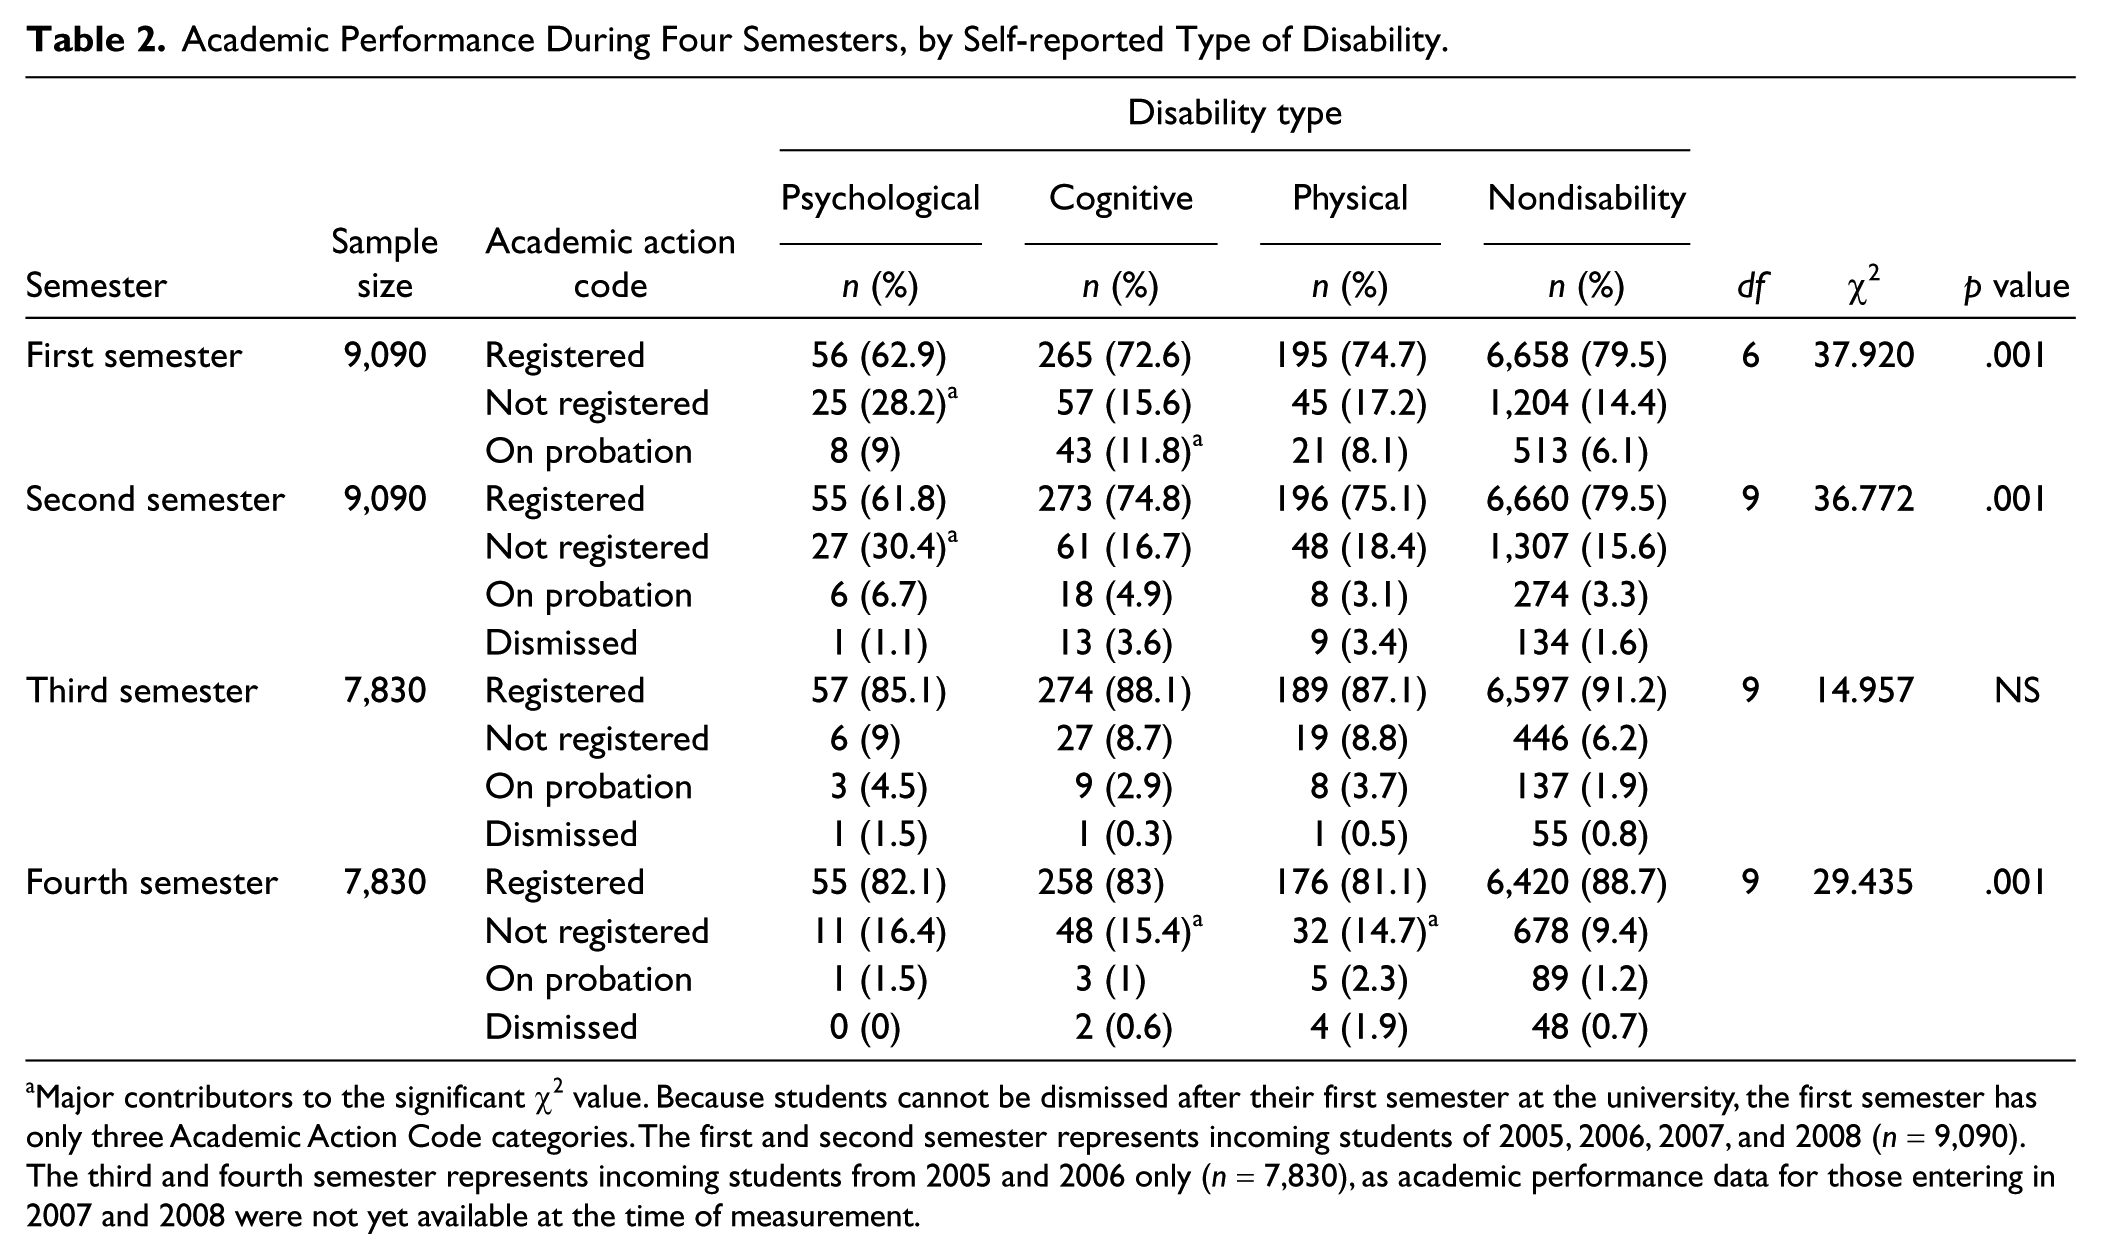
Major contributors to the significant χ2 value. Because students cannot be dismissed after their first semester at the university, the first semester has only three Academic Action Code categories. The first and second semester represents incoming students of 2005, 2006, 2007, and 2008 (n = 9,090). The third and fourth semester represents incoming students from 2005 and 2006 only (n = 7,830), as academic performance data for those entering in 2007 and 2008 were not yet available at the time of measurement.
Cognitive disability
A significantly high percentage (11.8%), χ2(n = 9,090, df = 6) = 37.92, p < .001, of students reporting a cognitive disability (including LD, attention deficit disorder and attention deficit hyperactivity disorder) was on academic probation at the end of the first semester or was not registered (did not register, cancelled or withdrew as a student) at the end of the fourth semester (15.4%), χ2(n = 7,830, df = 9) = 29.435, p < .001.
Physical disability
For those reporting a physical disability, a significantly high percentage (14.7%), χ2(n = 7,830, df = 9) = 29.435, p < .001, did not register for classes, cancelled, or withdrew at the end of the fourth semester (see Table 2).
Requesting Accommodations With DSS by Disability Category
Across the four semesters, compared with respondents reporting other or “no disabilities,” a relatively large percentage (n = 118, 32.3%) of students reporting a cognitive disability requested accommodations with DSS services. Figures for those reporting psychological and physical disabilities were 12.4% and 9.2%, respectively. About 1% of students who reported to have no disability at the time they entered the university (n = 55) requested accommodations with DSS within four semesters after starting college (see Table 3).
Status of Requested Accommodations at Disability Support Services by Self-Reported Type of Disability.
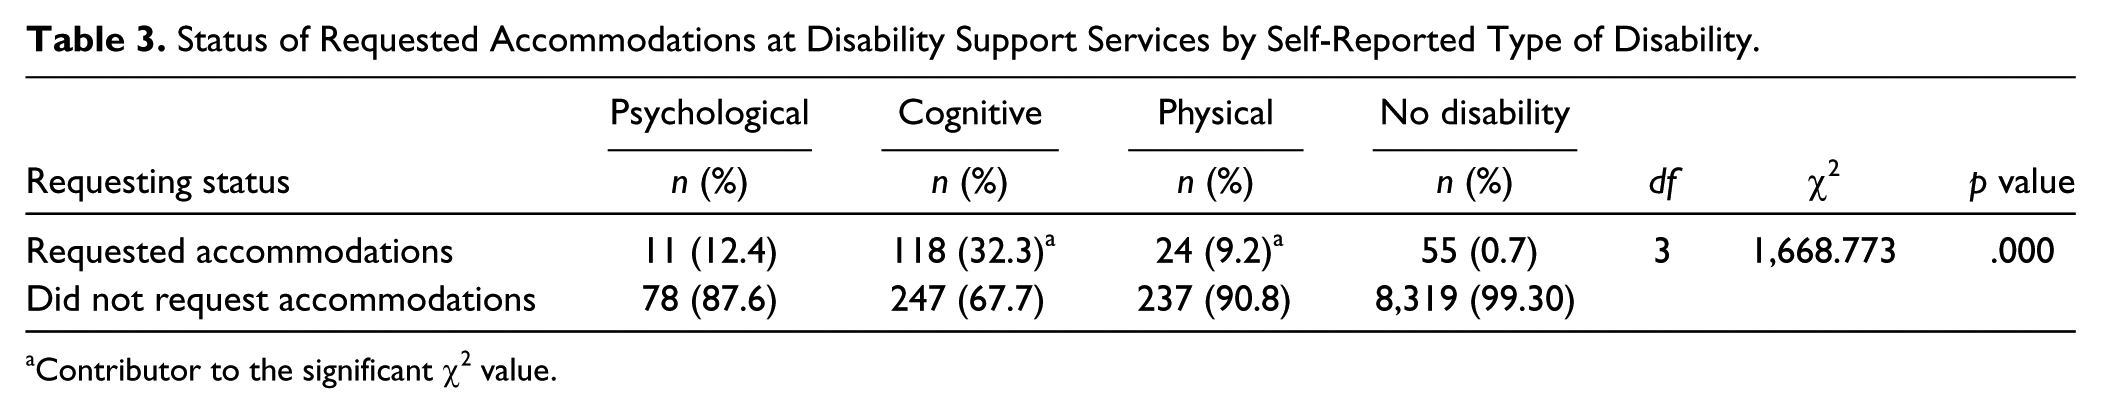
Contributor to the significant χ2 value.
Requesting Accommodations With DSS and Being in Good Academic Standing by Disability Category
For each disability category, the number of students who requested accommodations in the third semester was, in general, higher than those of the first two semesters. We compared “Being in Good Academic Standing” of those who requested accommodations with DSS across the four semesters with those who did not request accommodations, by disability category (see Table 4). More students who reported a cognitive or psychological disability tended to be in good academic standing if they had requested accommodations. The differences became significant in the third semester (90.9% vs. 60.3%), χ2(n = 89, df = 1) = 3.93, p < .05, for psychological disabilities, and 83.1% vs. 71.3%, χ2(n = 365, df = 1) = 5.94, p < .01, for cognitive disabilities. We did not find significant differences for those reporting a physical disability.
In Good Academic Standing and Requesting Accommodations With DSS, by Self-Reported Type of Disability.
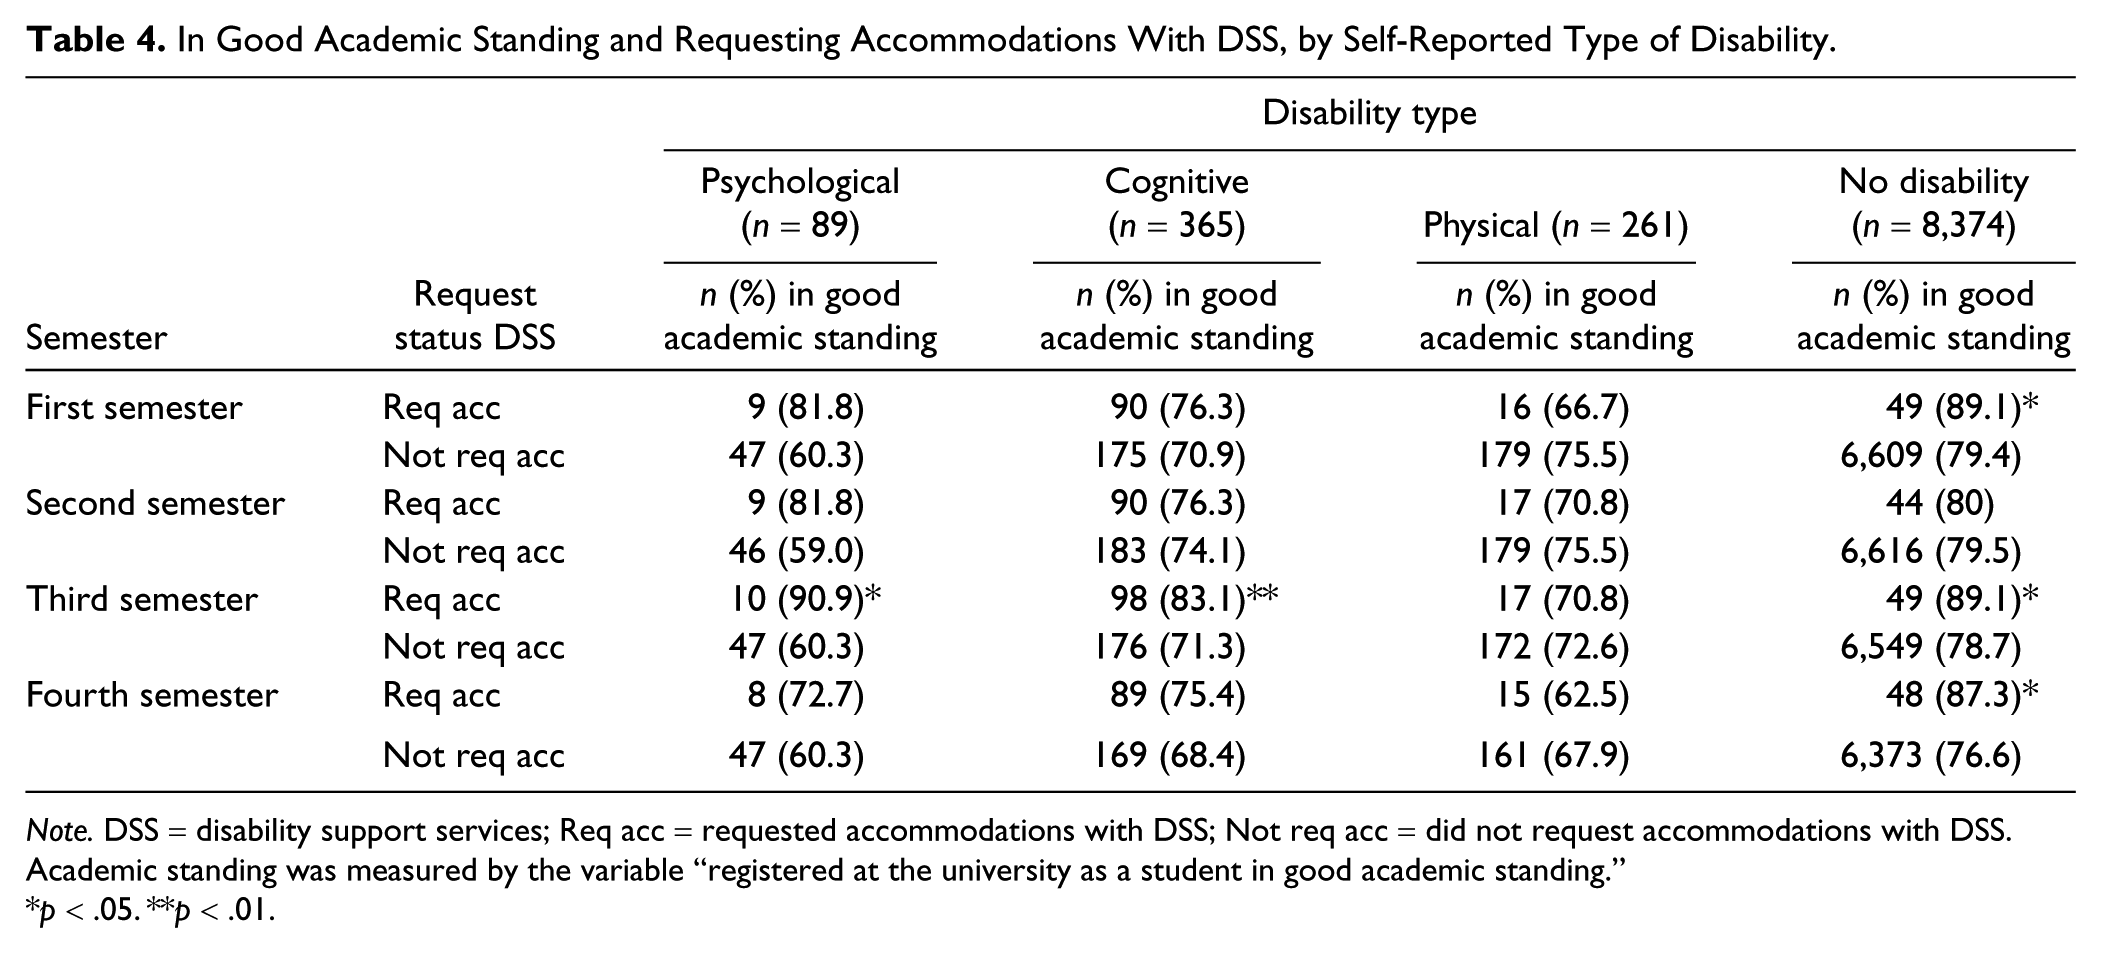
Note. DSS = disability support services; Req acc = requested accommodations with DSS; Not req acc = did not request accommodations with DSS. Academic standing was measured by the variable “registered at the university as a student in good academic standing.”
p < .05. **p < .01.
Those who reported having no disability at the time they entered the university but did request accommodations with DSS, were significantly more often in good academic standing compared with those who reported having no disability at the time they entered but did not request accommodations, during three out of four semesters. The respective statistics are as follows: (89.1% vs. 79.4%), χ2(n = 8,374, df = 1) = 3.12, p < .05; (89.1% vs. 78.7%), χ2(n = 8,374, df = 1) = 3.93, p < .05; (87.3% vs. 76.6%), χ2(n = 8,374, df = 1) = 3.48, p < .05.
Discussion
The findings in this study confirmed the academic performance issues faced by a number of students with cognitive disabilities found in previous studies (PAC, 2008; Stodden et al., 2001; Wagner et al., 2005). A relatively large percentage of those reporting cognitive disabilities when entering the university were on academic probation at the end of the first semester. At the end of the fourth semester, a significantly large percentage (15.4%) did not register for classes, cancelled their registration, or withdrew from classes. This group of students seems to need special attention when they enter the university, including an introduction to the diverse academic support services such as tutors and study skills counseling available on campus.
For students reporting psychological disabilities, a significantly high percentage did not register for classes, cancelled their registration or withdrew from classes at the end of the first and second semesters. Considering the fact that this group of students reported a psychological disability, they may have problems with the transition from a more structured secondary educational environment to a more unstructured postsecondary one. As shown in one study (Dong & Lucas, 2011), students with a psychological disability, more often than those with other disabilities, struggle with low self-esteem and high anxiety, so it is possible that this group of students’ anxiety or fear about the unknown made them reluctant to register for classes. Or their lack of self-confidence may have made them withdraw from the challenge to complete their semester’s courses. One possible explanation for these findings can be that an increasing number of female students with psychological attend college, as was found in this study, and this group may experience dual discrimination in terms of gender and disability (Cory, 2011). This perceived discrimination may serve as a barrier for them to register for classes or seek DSS during the start of their postsecondary experience.
For students with physical disabilities, differences emerged at the fourth semester: A significantly high percentage failed to register for classes or withdrew or cancelled registration at that time. This finding cannot easily be explained and calls for additional research. Future students could explore, using qualitative methods, how students with a physical disability experience attending classes, finding places to study, and joining campus organizations.
As mentioned in the introduction, many factors affect students’ academic performance and persistence. DaDeppo (2009) pointed out that academic and social integrations were unique predictors of students with learning disabilities to persist in postsecondary education. Tinto’s construct of engagement with the campus predicts that students’ academic success and retention in college are directly influenced by the degree to which they become connected with their environment (e.g., interaction with administrative and supportive personnel and faculty not only enhances the individual’s social integration but also increases individual’s academic integration). Our findings confirmed our hypothesis that requesting accommodations from the campus DSS would be associated with academic success. Even though we were not able to assess whether students who requested accommodations actually used the services, our findings are consistent with those in previous studies (Allsopp et al., 2005; Hossler, 1996; Hyde et al., 2009; Pingry, 2007), which showed that utilization of DSS on a university campus facilitated students’ academic performance and graduation.
This study also found that the number of students in each disability category who requested accommodations in the third semester were higher than those during the first two semesters. This finding may be attributed to students choosing to elect to self-accommodate during the first one or two semesters. It is also possible that they were reluctant to disclose their disabilities due to actual and perceived stereotypes and discriminations related to their disability.
Despite the benefits of requesting accommodations, request rates were low in our study. Approximately 1 out of every 10 students reporting physical and psychological disabilities requested accommodations, and one third of those reporting cognitive disabilities did. This finding is consistent with those in other studies in that university students with disabilities tend to be reluctant to seek academic support (American College Health Association, 2008; Blanco et al., 2008; Eisenberg, Golberstein, & Gollust, 2007; Troiano et al., 2010). In a NLTS-2 study, Wagner et al. (2005) found that about two thirds of postsecondary students with disabilities received no accommodations from their universities.
The relatively high number of requests for accommodations from students with a cognitive disability (including LD) in our study may be related to a relatively high level of awareness of issues related to LD among students, parents, and teachers. A small number of students who reported having “no disability” when entering the university chose to request accommodations with the campus DSS later, which may point to students’ possible reluctance to disclose a disability initially or difficulties adjusting to the identity of being a student with a disability.
Recommendations
The findings in this study confirm and refine what is known about the experience students with different types of disabilities have on a university campus. A significant percentage of those with a psychological and a cognitive disability struggle academically, at least during the first four semesters. Considering the importance of students’ requesting accommodations from the university DSS and the service’s role in keeping students academically and socially involved, we propose the following suggestions for professionals who work with students with disabilities who transition from high schools to universities.
First, as suggested by Stodden, Conway, and Chang (2003), improve collaboration and alignment of support and services between secondary and postsecondary systems. Black, Smith, Chang, Harding, and Stodden (2002) found that 4-year postsecondary institutions, as compared with those of 2-year postsecondary institutions, were significantly lower in outreach services for students with disabilities such as connecting with high school counselors or transition coordinators, special education teachers, rehabilitation professionals, and parent and family organizations. Students and their families should be informed about differences of instructional and legal mandates between secondary and postsecondary education settings, so expectations will be clear, and attention should be given to the development of necessary skills such as appropriate disclosure, identifying needs, conflict resolution, and self-advocacy (Palmer & Roessler, 2000), especially for students with a psychological disability. Disability support professionals in secondary and postsecondary educational institutions need to be updated about the outcomes of studies like this, and inform their students accordingly. They also need to train students on the benefits and risks of disclosing and requesting accommodations and on the importance of keeping disability documentation updated, and provide strategies in combating stereotypes and discrimination.
Second, university professionals in DSS may want to share the findings of the current and related studies with incoming students and their families. They need to educate the students and their families on academic challenges students with different types of disabilities may encounter, especially during the first few semesters in college. The professionals should work with the students and their families to identify the institutional supports, and student organizations at the university (Shepler & Woosley, 2012). Learning about the positive impact utilization of support services may have, as well as learning about academic support services and psychological counseling services available will provide a safety net for students at risk of academic difficulties. Furthermore, professionals should help the students to familiarize themselves with services and accommodations to increase their chances of academic success (O’Neill, Markward, & French, 2012). It is crucial that professionals in different support services communicate with one another, so that services for incoming students, especially those with disabilities, are integrated.
As shown in the current research project, some who have a disability do not report having one, and those who do report a disability often do not register with the university DSS. Therefore, our third suggestion is to provide training for faculty and staff regarding the identification of different categories of disabilities and the process of referring a student to the appropriate campus agency. Janiga and Costenbader (2002) found that the majority of referrals to university support services were from parents or self-referral prior to admission. Faculty need to use group announcements or one-on-one communication to advise students about a range of campus resources, including DSS. The desire of faculty and staff to help the student achieve academically will have to be balanced with the student’s need for privacy about disclosing a disability. Given the advances in instructional technology and the fact that fewer students with disabilities seek out the DSS, faculty need to increase the use of universal design in the course of planning and delivering courses.
Finally, professionals can do much to advocate for and support students, but ultimately students must learn to advocate for themselves. This is especially important at the university level, as there is “no educational entitlement beyond high school” (Edgar & Siegel, 1995, p. 260). Students with psychological and cognitive disabilities, especially some subgroups (e.g., female or minority students with disabilities) need training in self-determination and self-advocacy (Astramovich & Harris, 2007; Field, Martin, Miller, Ward, & Wehmeyer, 1998). This sense of self-determination will help students take advantage of services offered on campus facilitating academic success (Furth, 2007).
Limitations
Even though we know the percentages of students who requested accommodations from the campus DSS, we do not know how many actually used the provided accommodations, which was beyond the scope of this study. This lack of data is a major limitation.
Generalization of the findings in this study is a concern, as, across the years studied, an increasing number of students chose not to respond to the survey’s item asking them about their disability category. This is a worrisome trend, as it suggests a possible increase in sensitivity towards stigmatization, making it difficult to know the representativeness of the sample.
Another concern about generalization is the fact that low numbers in different categories forced us to combine those reporting LD, attention deficit disorder, and attention deficit hyperactivity disorder, into a cognitive disability category. Even though these types of disabilities are similar in many ways, they also have unique characteristics. Cautions need to be made when generalizing the results.
In addition, the findings of this study relied on self-reported data, which may not have been accurate. It is possible that students may not have reported their disability accurately (e.g., reported a psychological disability for a LD), and it is also possible that students no longer want to see themselves as having a disability, or know their documentation needs to be updated, all of which could result in data that might be invalid.
Future Research
This study answers some questions, but raised additional areas to be explored. We learned that students with different types of disabilities experience unique difficulties, and that those who seek support services tended to do better academically. However, we do not know about how students experience the challenge of succeeding at a university, and we know little about causal aspects and students’ motivation. We have to speculate about the barriers students experience when seeking help from DSS, and how students experience such obstacles. It is important to investigate whether those who seek support feel, more than others, connected with their environment, as suggested by Tinto’s model. Future research needs to compare the academic performance between students who requested and actually used the accommodations and those who only requested but did not use the accommodation, and explore the reasons why students did not use the accommodations.
We do not know the factors that cause some students who did not report a disability when entering the university to seek disability services during the subsequent semesters. Learning more about their developmental processes, possibly qualitatively by means of journaling, might provide some answers. In addition, we have to guess about why, over the years, increasingly fewer students respond to the survey question asking about having a disability, which could also be studied by aforementioned techniques, or by means of focus groups.
Finally, and most importantly, a high percentage of students reporting various disabilities do well academically. How are those who experience academic difficulties different from those who do not? What are the characteristics of those students who attain satisfactory academic performance? More research is needed to illuminate students’ functioning on campus and clarify the differences.
The results of this study show that students who are integrated into the university environment through registering with DSS perform better. However, the registration rate is low. Professionals who work in disability service office and student affairs should work with students, families, and the entire institution in offering support, opportunities, and adequate funding to serve the mission of the university to retain all students and help them meet their academic and personal goals.
Footnotes
Acknowledgements
The authors would like to express their appreciation for feedback on this article by anonymous reviewers in the course of writing this article.
Declaration of Conflicting Interests
The author(s) declared no potential conflicts of interest with respect to the research, authorship, and/or publication of this article.
Funding
The author(s) received no financial support for the research, authorship, and/or publication of this article.