
Abstract
We conducted an exploratory study to investigate the relation between nonacademic behavior constructs measured by the Transition Assessment and Goal Generator (TAGG) and postsecondary education and employment outcomes for 297 high school leavers who completed the TAGG during their high school years. Four of eight TAGG constructs predicted postsecondary educational outcomes: (a) Interacting With Others, (b) Student Involvement in the Individualized Education Program (IEP), (c) Support Community, and (d) Goal Setting and Attainment. Four constructs predicted postsecondary employment outcomes: (a) Employment, (b) Student Involvement in the IEP, (c) Support Community, and (d) Interacting With Others. The addition of student grade point average (GPA) strengthened some of the models. The findings appear to add predictive validity evidence to support use of TAGG results to assist with transition planning.
Keywords
The Standards for Educational and Psychological Testing (American Educational Research Association [AERA], American Psychological Association [APA], and National Council on Measurement in Education [NCME], 2014) indicate when making important educational decisions, such as planning for students’ futures, assessments need ample validity evidence supporting use of their results. Axiomatically, transition assessments special educators must use to write transition sections of students’ Individualized Education Programs (IEPs) need ample validity evidence supporting their use.
Special educators use numerous transition assessments with and without ample validity evidence supporting use of their results, including teacher-made tools, online assessments, and those distributed by publishers (Thoma & Tamura, 2013). Prince, Plotner, and Yell (2014) analyzed federal district court decisions involving transition assessment cases. The findings prompted Prince et al. (2014) to strongly recommend special educators use formal transition assessments, which are those with ample validity evidence supporting use of their results, as part of a comprehensive transition assessment battery.
When using transition assessment results to assist planning students’ futures, educators, parents, students, and other IEP team members need to know whether assessment results predict post–high school outcomes, or, as the Standards state, “how accurately do test scores predict criterion performance” (AERA et al., 2014, p. 17). The need makes establishing test-criterion relations, historically known as predictive validity, a critical piece of validity evidence. However, J. D. Martin (2014) found most of the transition assessments used by special educators lacked predictive or other types of validity evidence.
McConnell (2012) studied the validity evidence of 10 commonly used transition assessments and found half of these assessments had no validity evidence supporting their use and several others only had minimal validity evidence. Because IEP teams use results of transition assessments to prepare students for life after high school, transition assessments need predictive validity evidence to support use of the results for transition planning (i.e., AERA et al., 2014). One assessment lacking predictive validity evidence to support its use for transition planning is the Transition Assessment and Goal Generator (TAGG; J. E. Martin, Hennessey, McConnell, Terry, & Willis, 2015).
The TAGG is a multiple-version online transition assessment for use by transition-aged youth with disabilities, their parents, and special educators. TAGG constructs and items derived from research-identified, nonacademic student behaviors associated with or predictive of post–high school employment and education (McConnell et al., 2013). The TAGG consists of Professional, Student, and Family versions users complete for an identified student. The Student Version (TAGG-S) consists of 31 three-point Likert-type scale items and three yes or no items across seven constructs: Strengths and Limitations/Support Community, Disability Awareness, Persistence, Interacting With Others, Goal Setting and Attainment, Employment, and Student Involvement in the IEP. The Professional (TAGG-P) and Family (TAGG-F) versions contain the same 34 items to measure the same constructs as does the TAGG-S plus one additional construct. Strengths and Limitations and Support Community exist separately as they did not collapse into one construct as they did in the student version (Hennessey, Terry, Martin, McConnell, & Willis, 2017). The TAGG-P and TAGG-F contain 31 five-point Likert-type items and three yes or no items.
Numerous studies contributed validity evidence to support using TAGG results for transition planning. McConnell et al. (2013) provided content validity evidence by describing research-identified behaviors associated with or predictive of further education and employment outcomes. Hennessey, Terry, et al. (2017) established through one national sample, then confirmed with two more independent national samples, TAGG’s acceptable and firm factor structure and psychometrically sound results. To examine relations to other variables, Hennessey, Herron, Herron, Metcalf, and Martin (2017) found SES of students’ families had no meaningful impact on TAGG scores. Student grade point average (GPA) and percent of time students received instruction in general education had no meaningful effect on TAGG scores (McConnell, Martin, & Hennessey, 2015). Last, students’ gender had no overall effect on TAGG results, but gender did impact a couple constructs, including employment, likely because males had more employment experiences than females (McConnell, Martin, Herron, & Hennessey, 2016).
We conducted this exploratory study to determine whether TAGG results predict post–high school education and employment outcomes of former high school students with disabilities. Specifically, do construct scores across Student, Professional, and Family TAGG versions predict postsecondary education and employment outcomes of former high school students with disabilities who completed the TAGG years earlier while in high school? Secondarily, do high school GPAs of these former students add incremental evidence to predicting postsecondary education and employment outcomes?
Method
Participants
Participant selection
Over three academic years, 2,310 participants (172 professionals, 847 family members, and 1,291 students) from 42 states and 162 rural, urban, and suburban schools completed the TAGG Professional, Family, and Student versions to assist with TAGG development (Hennessey, Terry, et al., 2017). We used two methods to contact former students. First, we asked students’ high school special educators who participated in the TAGG study to contact their former students who had completed the TAGG when in high school. Twenty-five educators assisted 146 students to complete the follow-up survey. We provided participating educators US$30 per completed survey to compensate for their time. Second, we attempted to contact the remaining students by email, phone, through social media, and text, and by contacting their parents. This approach resulted in 151 more former students who completed the follow-up survey. These two methods enabled us to receive follow-up surveys from 23% (n = 297) of the former students who completed the TAGG during their high school days. We mailed US$10 gift cards to thank these former students for completing the follow-up survey. Our university’s Institutional Review Board approved this study, and all participants provided consent or assent.
Students
The 297 former high school students with disabilities, who had education and/or competitive employment postsecondary goals, had been out of high school from 9 months to 4.5 years. On average, students completed the TAGG-S while in high school at age 18 (SD = 1.1), and their average age when completing our post–high school follow-up survey was 20 (SD = 1.3). Ninety-five percent of the participants graduated from high school, and the other 5% had dropped out. Fifty-five percent of the sample were male, 40% Caucasian, 17% African American, and 6% were Native American. The disability categories included 52% specific learning disability, 18% intellectual disability, 11% other health impaired, and 8% autism. When in school, 59% of these former students were eligible for free and reduced lunch.
Family
Of the 297 former high school students in our follow-up survey sample, 191 of their family members had previously completed the TAGG-F version when their children were in high school.
Professionals
Our sample of 297 former high school students had the TAGG-P completed by 78 special educators, resulting in 297 TAGG-P versions to use in our analyses.
Responders versus nonresponders
Due to the 23% response rate to the TAGG follow-up survey, we wanted to determine why the participants were missing. Although unlikely, the participants could be Missing Completely at Random (MCAR). If true, we can assume no nonresponse bias and could analyze only the complete dataset, which would produce unbiased estimates of effect sizes in our logistic regression models. Second, the outcomes could be Missing at Random (MAR), which implies the missing participants’ outcomes are related to a subset of our collected information. If MAR holds for our data, simply including the subset of auxiliary variables (variables which are not a focus of the study) that predict the missingness response as covariates in the complete models will produce unbiased effect sizes, albeit with larger standard errors (Gelman & Hill, 2006). However, if the outcomes are Missing Not at Random (MNAR), the missing outcomes are most likely related to the values of the outcomes themselves and are not predictable using collected information. In this case, little can be done besides including as many variables as possible to get as close to the MAR assumption as possible (Gelman & Hill, 2006).
Following the suggestions of Gelman and Hill (2006), we evaluated the MCAR assumption by assessing whether 21 auxiliary demographic measures predicted missingness. We dummy coded the missingness outcome as 1 when an outcome was present for an individual and dummy coded it 0 when missing. Subsequently, we conducted a backward logistic regression with “responded to survey” as the outcome modeled, using the 21 demographic variables as predictors. All demographic variables were reported from when the student took the TAGG assessment (see Burnes, 2015, for a comparison of responders to nonresponders). If the student completed the TAGG more than once, we used the demographic data from the last time it was completed. As expected, the resulting prediction of missingness retained five significant variables (see Table 1), suggesting the outcomes are not MCAR. The missingness model suggests students who are English language learners or eligible for free lunch were less likely to respond to the follow-up survey. Moreover, students who received instruction in disability awareness were more likely to respond. Finally, when compared to students with specific learning disabilities, those with intellectual disabilities or autism were more likely to respond.
Fit Statistics for Missingness Model.
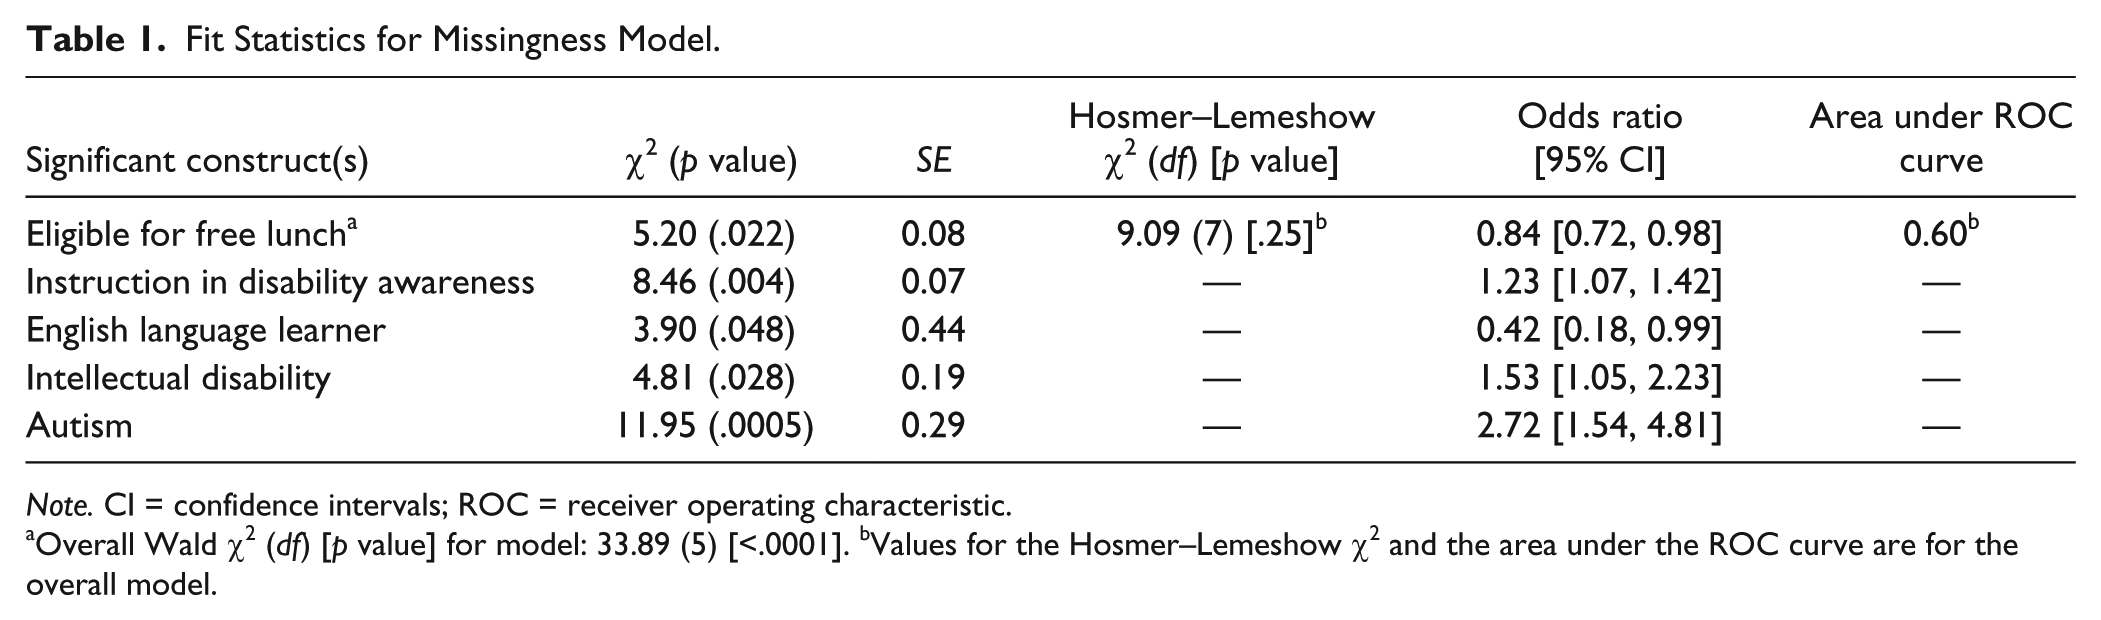
Note. CI = confidence intervals; ROC = receiver operating characteristic.
Overall Wald χ2 (df) [p value] for model: 33.89 (5) [<.0001]. bValues for the Hosmer–Lemeshow χ2 and the area under the ROC curve are for the overall model.
Although the results suggest outcomes analyzed are not MCAR, they are somewhat predictable from a subset of the 21 demographic variables included in the dataset. We included these demographic variables when conducting our logistic regressions to make analyses more likely to meet the MAR assumption. Although no specific test for the MNAR assumption exists, in order for the MNAR assumption to be true, other nonobserved variables in our dataset would have to be minimally correlated with the subset of 21 measured demographic variables, and these would also need to be incrementally and uniquely predictive of the missing outcome (Gelman & Hill, 2006). Because we included numerous auxiliary demographic variables in our analysis, we believe this is unlikely to be the case. The only remaining possibility is a missing outcome (success or failure) would be directly related to missingness and not otherwise predictable from the wealth of information included in our analytic models. While this is possible, it is more plausible that missingness would be somewhat predictive from our demographic variables.
TAGG Follow-Up Survey
Through an iterative process, we developed a comprehensive TAGG Follow-Up Survey by selecting questions from the National Post-School Outcome Center’s Post-School Outcome Data Collection Protocol (NTACT; 2010) Sample Indicator 14 follow-up survey questions. When completed, the results gave a detailed look at how the students finished high school; their educational, employment, and living history; use of adult services; and updated demographic information. After refining and then piloting the items, we entered the questions into a web survey platform that used skip logic to guide students through the survey. Due to the skip logic, not all respondents were presented with all questions. This resulted in varying N counts for each of the outcomes measured in this analysis.
From this larger TAGG follow-up survey, we selected answers to six questions targeting former students’ postsecondary education and employment outcomes since graduating or leaving high school to use in this study (see Table 2). Two questions examined postsecondary education outcomes, while four determined postsecondary employment outcomes. Five of the questions required a yes or no answer. The sixth asked how many education or training programs the student had been enrolled in after high school, with a choice of answers from 0 to 10+. We recoded this to yes if the former students with disabilities chose one or more; if zero was selected, we entered a no response.
Six Further Education and Employment Follow-Up Survey Outcome Items That Former TAGG Participants Answered and Percent Responding.
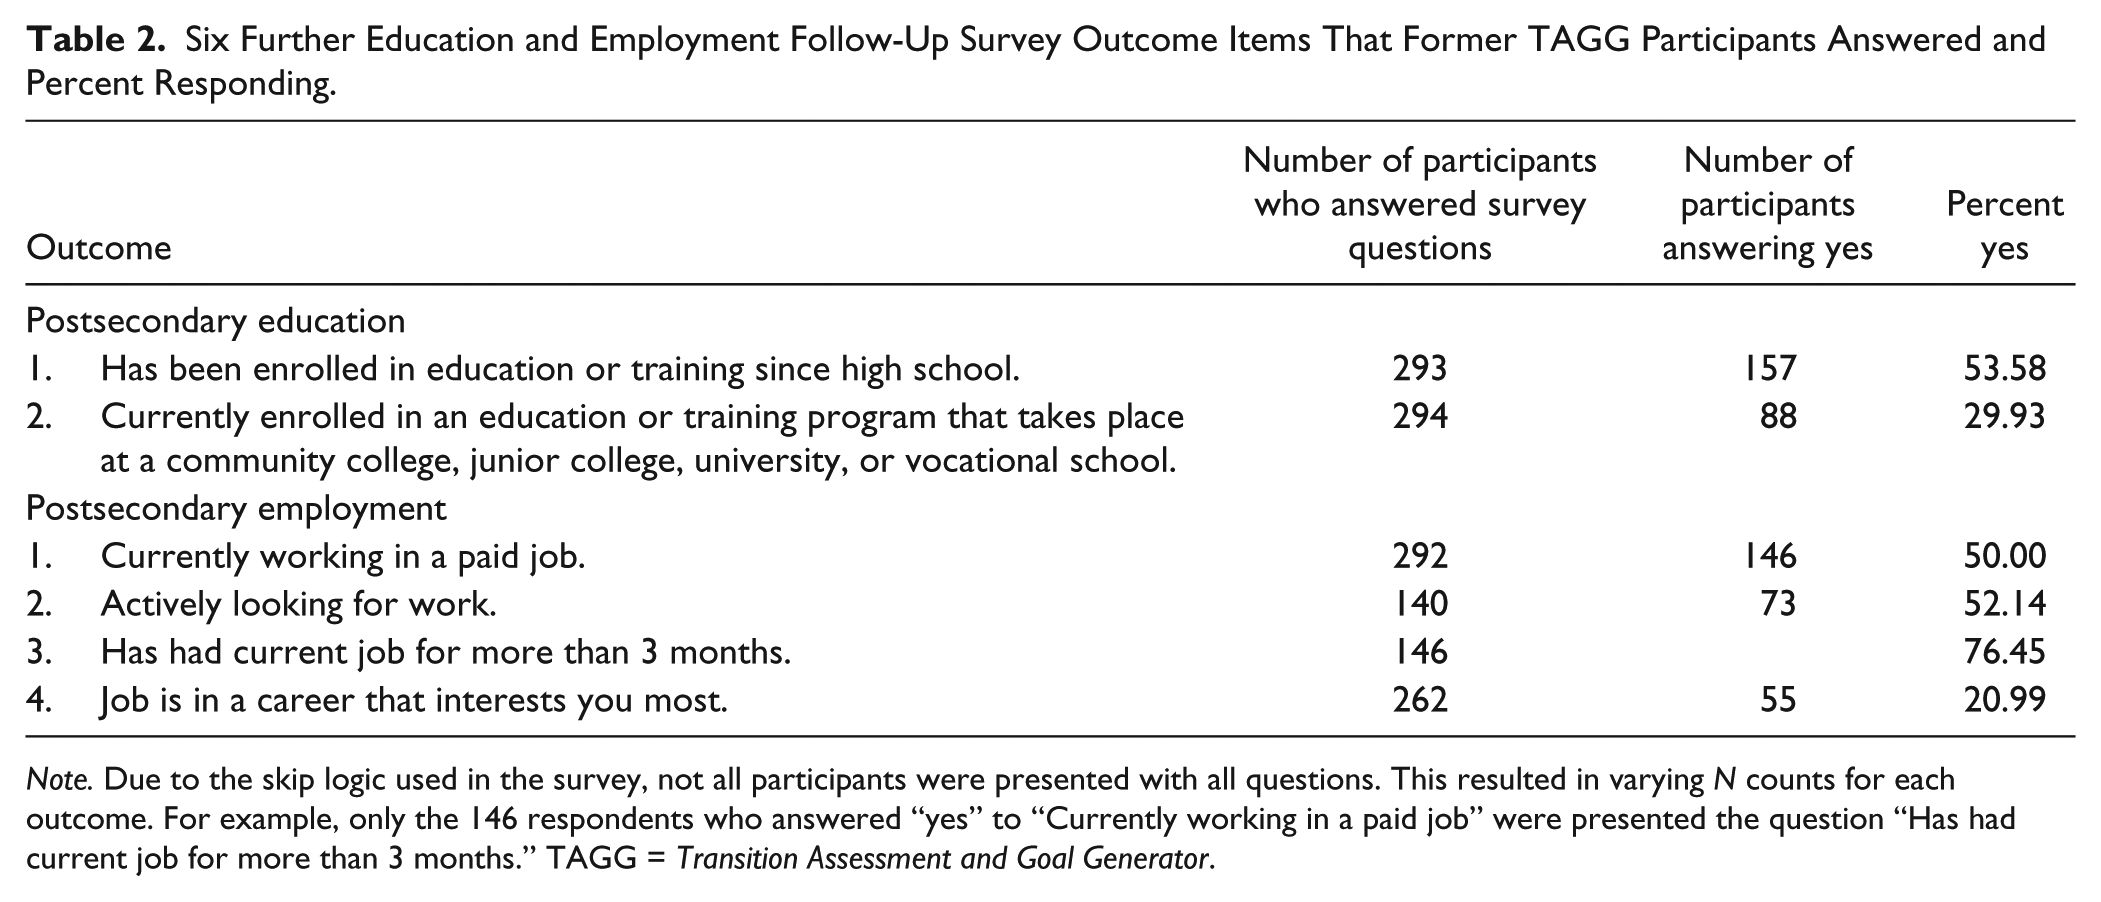
Note. Due to the skip logic used in the survey, not all participants were presented with all questions. This resulted in varying N counts for each outcome. For example, only the 146 respondents who answered “yes” to “Currently working in a paid job” were presented the question “Has had current job for more than 3 months.” TAGG = Transition Assessment and Goal Generator.
Student GPAs
We calculated GPA data directly from student transcripts, then verified the calculation, for 270 of the 297 students for whom we had transcripts. An independent rater used a random number generator to select 30% of the transcripts to determine GPA calculation agreement, and obtained an exact agreement percentage of 96% with the original rater. The few disagreements were mutually resolved. See McConnell et al. (2015) for more detailed explanation of how overall GPA was calculated and reliability established.
Data Analysis
We used logistic regression with the scaled scores for each construct of each TAGG version analyzed separately as the independent variables to determine whether TAGG nonacademic constructs predicted postsecondary education and employment outcomes. We first examined each independent variable (TAGG-P and TAGG-F: eight constructs each for each of the six outcomes for 48 univariate logistic regressions; TAGG-S: seven constructs and 42 univariate logistic regressions) in the univariate model for each postsecondary education and employment outcome. Following Hosmer and Lemeshow’s (2000) variable selection procedures, we considered any variable with a Wald χ2 p value < .25 for the full model. We then used backward logistic regression with all potential predictors included in the initial model for each TAGG version and all outcomes (a total of 18 logistic regression models evaluated). We report below on overall goodness of fit test statistics, the Hosmer–Lemeshow test statistics, and associated p values with all significant models. Finally, because this is the first exploratory study of the TAGG’s value in predicting outcomes, we valued minimizing Type II error over Type I error and did not adjust alpha levels to control for overall Type I error rates.
When considering models with GPA, we examined likelihood-ratio χ2 tests when adding GPA to models built from TAGG constructs to evaluate the importance of GPA in the model. We also used two indices, the odds ratio and the area under the receiver operating characteristic (ROC) curve, to depict effect sizes when examining the logistic regression models.
Odds ratios are defined as the increase in odds of the outcome happening when a one-unit increase on the predictor variable occurs (Tabachnick & Fidell, 2013). The ROC curve plots the probability of detecting a true occurrence (sensitivity) against the probability of a false occurrence (1 – specificity) and suggests the probability of a randomly selected pair of cases from each outcome category being correctly classified. The area under the ROC curve is a measure of the ability of the model to discriminate between the subjects who experience the outcome of interest from those who do not, with results ranging from 0.5 to 1 (Hosmer & Lemeshow, 2000). The minimum ROC value for an “acceptable” model varies depending on the content and context of the study (Environmental Protection Agency, n.d., para. 6). Given this study involves the behavior of adolescents and young adults, it is reasonable to expect the discriminatory power not to be in the higher ranges. Thus, we set an a priori acceptable value under the ROC curve at 0.65 and greater, with values below this indicating less favorable model discrimination.
Results
Postsecondary Education Outcomes Predictors
Currently enrolled in postsecondary education
For the follow-up survey item “the student is currently enrolled in an education or training program that takes place at a community college, junior college, university, or vocational school,” TAGG-P yielded three significant predictors: Interacting With Others, Student Involvement in the IEP, and Support Community. The area under the ROC curve for this model was 0.76, which suggests excellent model discrimination. The odds ratio for each predictor indicated an increase of the odds of the outcome with an increase in that predictor’s scaled score when other predictors were constant, with Support Community yielding the greatest increase in odds (93%). The nonsignificant Hosmer–Lemeshow test (χ2 = 5.03, df = 8, p < .75) indicated good model fit.
The TAGG-F yielded one significant predictor, Goal Setting and Attainment. The odds ratio indicated a 62% increase in the odds of the outcome with a unit increase of the scaled score. The Hosmer–Lemeshow test (χ2 = 6.79, df = 7, p < .45) suggested good model fit. Though the area under the ROC curve (0.61) was just below the threshold of acceptable model fit, it does suggest the model has some discriminatory power. The TAGG-S yielded one significant predictor, Interacting With Others. The odds ratio of 1.96 indicated an almost 100% increase in the outcome with a unit increase of the scaled score. The Hosmer–Lemeshow test (χ2 = 3.08, df = 3, p < .38) suggested good model fit, though the area under the ROC curve (0.62) was just below the threshold of acceptable model fit. When considering all measures together, this model has moderate discriminatory power. See Table 3 for complete statistics.
Multivariate Backward Logistic Regression Statistics for Significant Models.
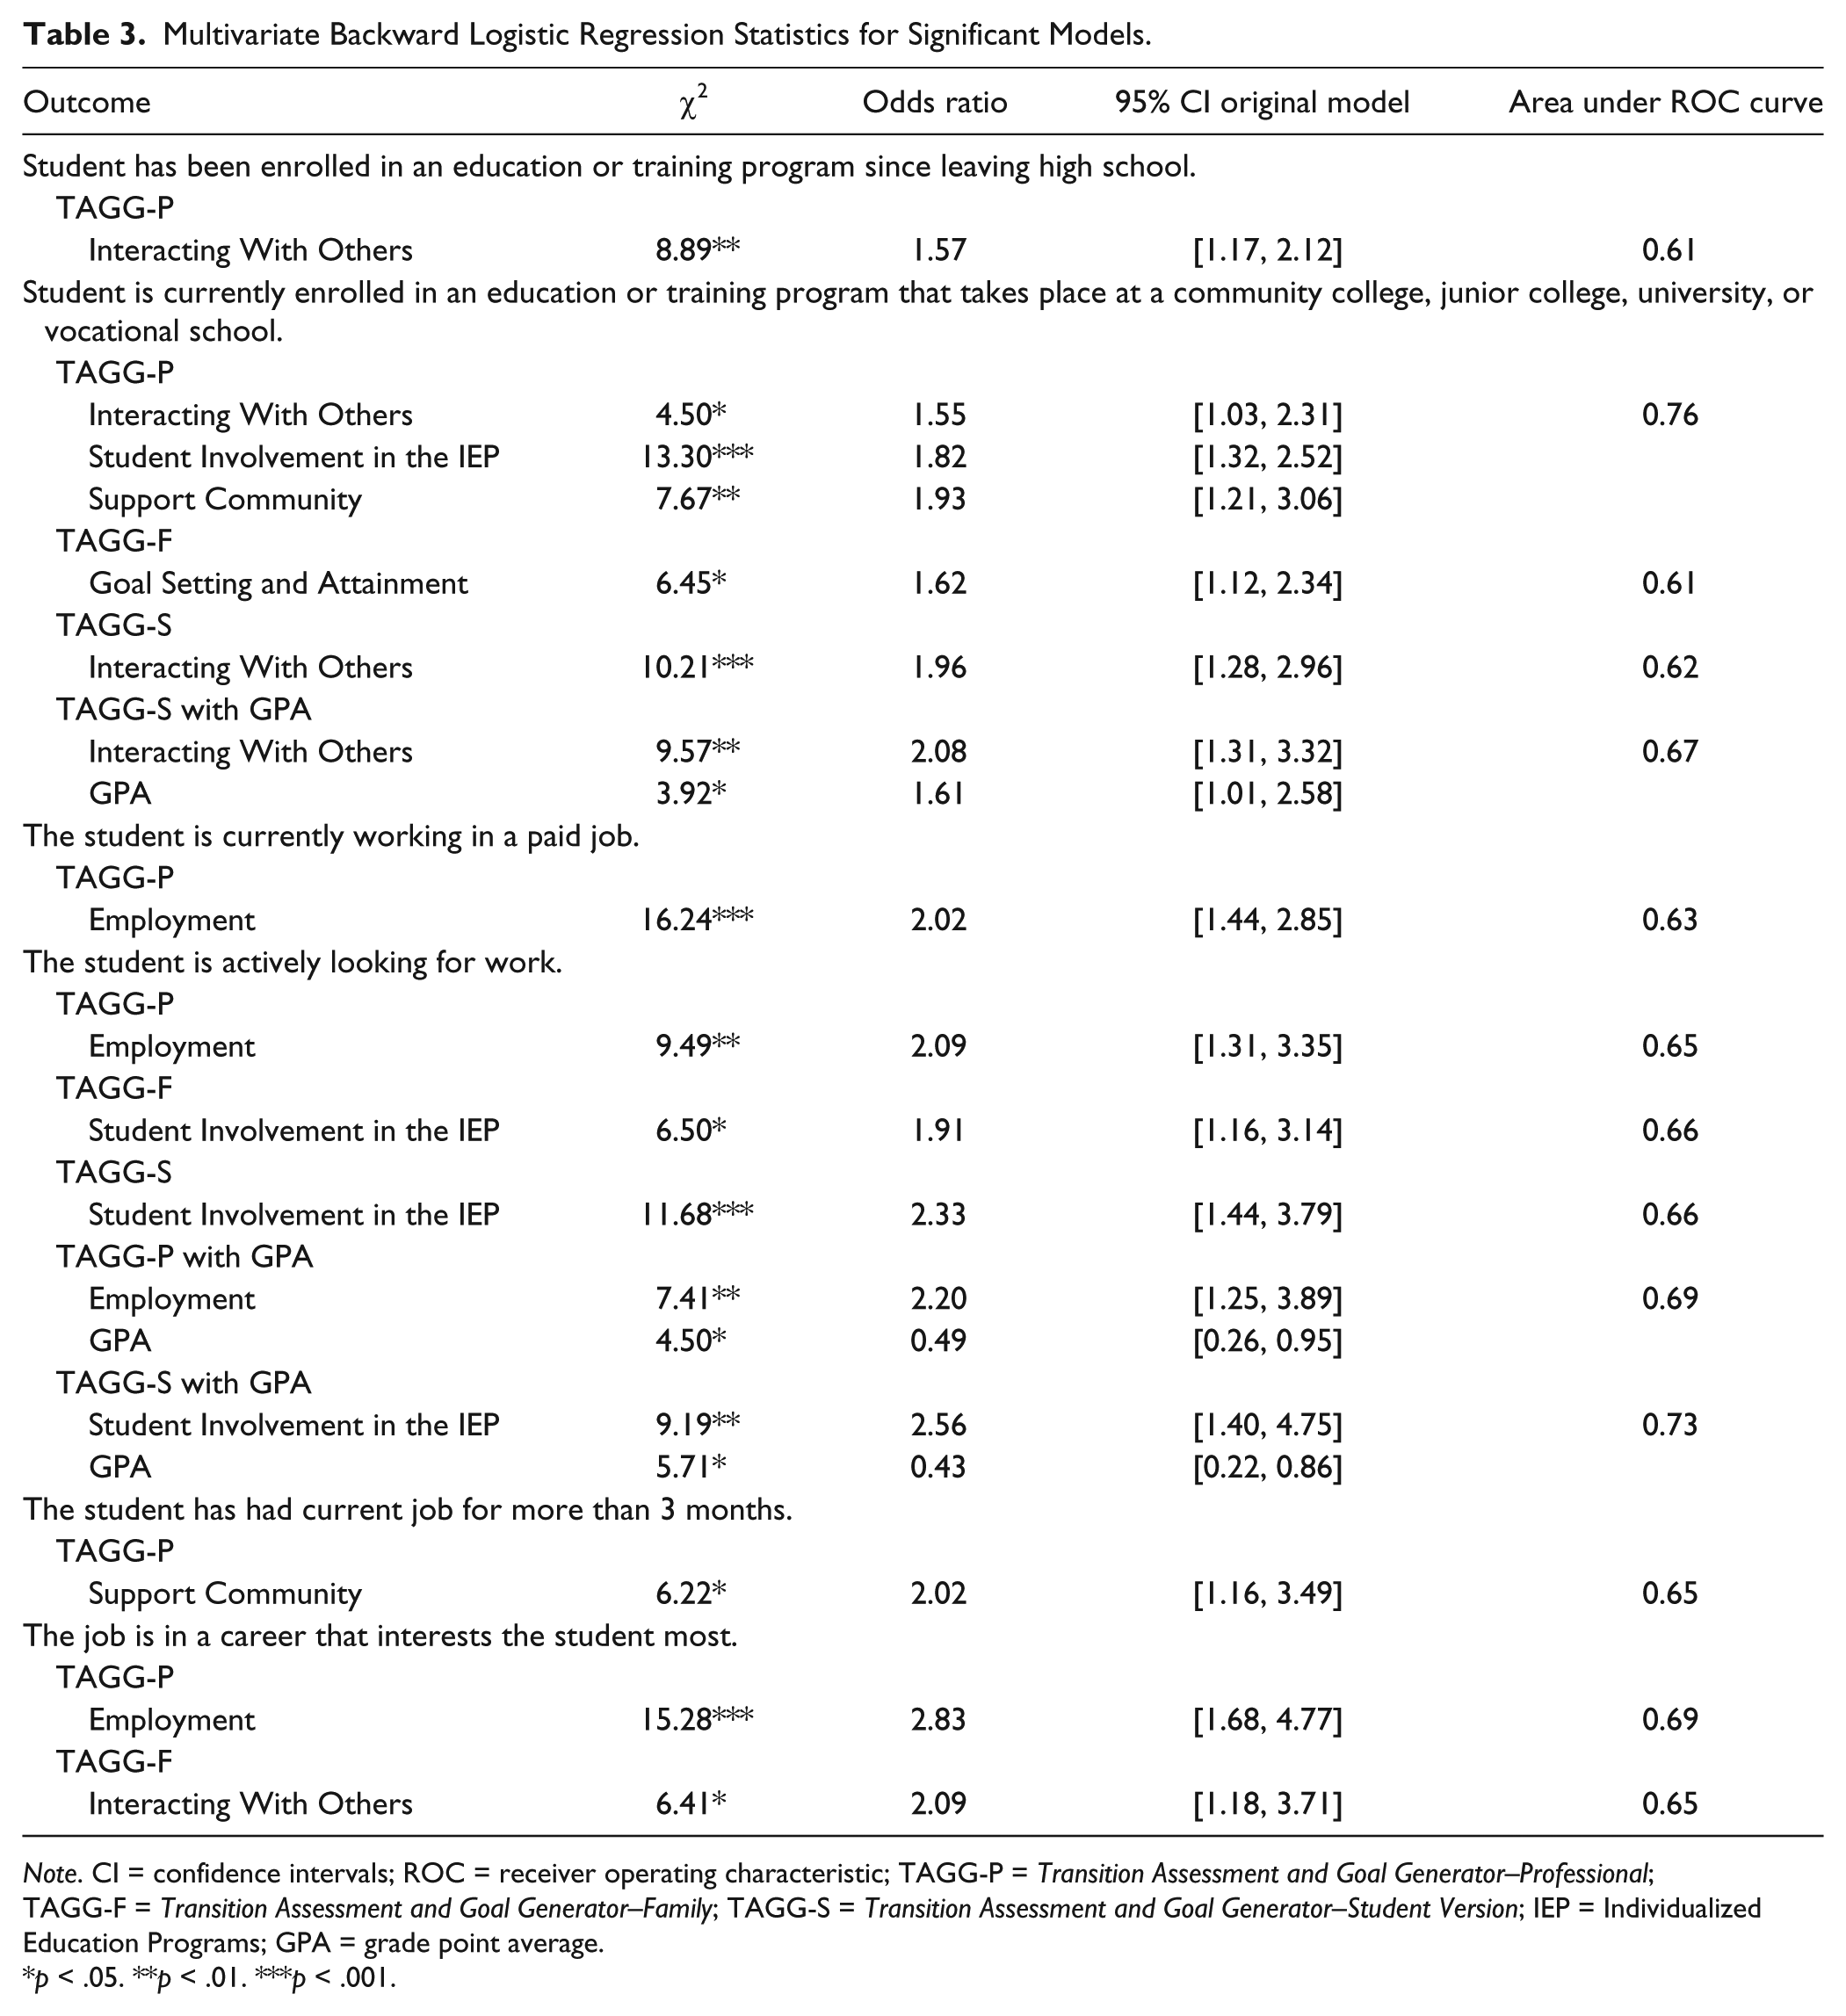
Note. CI = confidence intervals; ROC = receiver operating characteristic; TAGG-P = Transition Assessment and Goal Generator–Professional; TAGG-F = Transition Assessment and Goal Generator–Family; TAGG-S = Transition Assessment and Goal Generator–Student Version; IEP = Individualized Education Programs; GPA = grade point average.
p < .05. **p < .01. ***p < .001.
Has been enrolled in postsecondary education
For the outcome “has been enrolled in education or training since high school,” the TAGG-P yielded one significant predictor, Interacting With Others (see Table 3). The odds ratio indicates a 57% increase of the odds of the outcome occurring with a unit increase of the scaled score. The Hosmer–Lemeshow test (χ2 = 12.46, df = 7, p < .09) suggested good model fit, though the area under the ROC curve (0.61) was just below the threshold of acceptable model fit. When considering all measures, this model has moderate discriminatory power.
Additive Effect of GPA to Postsecondary Education Predictors
Has been enrolled in postsecondary education
When adding GPA as a predictor with Interacting With Others to the TAGG-S model for the postsecondary education outcome question “the student is currently enrolled in an education or training program,” the model was significant. When comparing the difference of the −2 log likelihood of the model with GPA to the model without, there was a significant difference, Δ−2LL = χ2(1) = 83.56. Thus, adding GPA was a significant addition to the model. The odds ratio of 2.08 indicated a unit increase in the scaled score of Interacting With Others results in a 108% increase of the odds of the outcome occurring when GPA was held constant. The Hosmer–Lemeshow test (χ2 = 11.35, df = 8, p < .18) suggested good model fit, and the area under the ROC curve (0.67) suggested good model discrimination. Adding GPA to the TAGG-P and TAGG-F models did not result in significant models. See Table 3 for complete statistics.
Postsecondary Education Outcomes Summary
Taken together, these results provide sufficient evidence of the following constructs predicting further education (a) Interacting With Others, (b) Student Involvement in the IEP, (c) Support Community, and (d) Goal Setting and Attainment. Odds ratios ranged from 1.55 to 1.96 across both outcomes, with the area under the ROC curve values ranging from 0.61 to 0.76. Though three of the areas under the ROC curve values were less than 0.65, each of these models does have discriminatory power. Adding GPA to the one significant TAGG-S model increased the odds ratio to 2.08 and the area under the ROC curve to 0.67. The TAGG-P provided the most predictive evidence of postsecondary education outcomes.
Postsecondary Employment Outcomes Predictors
Currently working in a paid job
For the question “the student is currently working in a paid job,” the TAGG-P yielded one significant predictor, Employment. The Hosmer–Lemeshow test (χ2 = 3.94, df = 4, p < .42) indicated good model fit. The odds ratio indicated a 102% increase in the odds of the outcome occurring with a unit increase in the scaled score, though the area under the ROC curve (0.63) was just below the threshold of acceptable model fit. Together, these data suggest the model does have moderate discriminatory power. The TAGG-F and TAGG-S models did not yield any significant predictors. See Table 3 for complete statistics.
Actively looking for work
For the item “the student is actively looking for work,” the TAGG-P yielded one significant predictor, Employment. The Hosmer–Lemeshow test (χ2 = 1.43, df = 5, p < .92) suggested good model fit. The odds ratio indicated a 109% increase in the odds of the outcome with a unit increase in the scaled score. The area under the ROC curve (0.65) indicated acceptable model discrimination.
Student Involvement in the IEP was significant in the TAGG-F and TAGG-S models. For the TAGG-F model, the odds ratio indicated a 91% increase in the odds of the outcome occurring with a unit increase in the scaled score, while the area under the ROC curve (0.66) suggested acceptable model discrimination. The Hosmer–Lemeshow test (χ2 = 3.87, df = 8, p < .87) suggested good model fit. The odds ratio for the TAGG-S indicated a 133% increase in the odds of the outcome occurring, and the area under the ROC curve (0.66) suggested acceptable model discrimination. The Hosmer–Lemeshow test (χ2 = 2.08, df = 6, p < .91) also suggested good model fit. See Table 3 for complete statistics.
Held current job for more than 3 months
For the item “the student has had current job for more than 3 months,” the TAGG-P yielded one significant predictor, Support Community. The odds ratio indicated a 102% increase in the odds of the outcome for a unit increase in the scaled score for Support Community. The Hosmer–Lemeshow test (χ2 = 11.30, df = 6, p < .08) indicated good model fit, while the area under the ROC curve (0.65) suggested acceptable model discrimination. The TAGG-F and TAGG-S models did not have any significant predictors for this outcome. See Table 3 for complete statistics.
Current job interests me
For “the student has a job in a career that interests you most,” the TAGG-P yielded one significant predictor, Employment. The odds ratio indicated a 183% increase in the odds of the outcome with a unit increase in the Employment scaled score, and Hosmer–Lemeshow test (χ2 = 3.01, df = 4, p < .56) indicated good model fit. The area under the ROC curve (0.69) suggested acceptable model discrimination. The TAGG-F yielded one significant predictor, Interacting With Others. The odds ratio indicated a 109% increase in the odds of the outcome occurring with a unit increase in the construct scaled score. The Hosmer–Lemeshow test (χ2 = 3.80, df = 6, p < .70) indicated good model fit, with an ROC value of 0.65.
Additive Effect of GPA to Postsecondary Employment Predictors
Looking for work
When adding GPA as a predictor with Employment to the TAGG-P model for the postsecondary employment outcome question, “the student is actively looking for work,” the model was significant. When comparing the difference of the −2 log likelihood of the model with GPA to the model without, there was a significant difference, Δ−2LL = χ2(1) = 52.65. Thus, adding GPA was a significant addition to the model. The odds ratio indicated a 120% increase in the odds of the outcome when the scaled score for Employment increased by one unit and GPA was constant. The area under the ROC curve (0.69) indicated strong discrimination. Adding GPA as a predictor to the TAGG-S model for this outcome also resulted in an improved model, Δ−2LL = χ2(1) = 53.86. The odds ratio indicated an increase of 156% of the outcome occurring when there was a unit increase of the scaled score for Student Involvement in the IEP. The area under the ROC curve (0.73) indicated strong discrimination of the model.
Postsecondary Employment Outcomes Summary
Taken together, these results provide sufficient evidence the following TAGG constructs predict post–high school employment: (a) Employment, (b) Student Involvement in the IEP, (c) Support Community, and (d) Interacting With Others. Six of the odds ratios were greater than 2.0, indicating a greater than 100% increase in the odds of the employment outcome occurring. All but one of the area under the ROC curve values were equal to or greater than the threshold of 0.65. Clearly, the TAGG-P provided the most predictive evidence of employment outcomes, and the Employment construct was the most frequent significant predictor of employment outcomes. See Table 3 for complete statistics.
Secondary Analysis for Responders Versus Nonresponders
Seventy-seven percent of students who took the TAGG during high school did not respond to the follow-up survey 1 to 4 years after leaving high school. Following from the earlier discussion on responders versus nonresponders, we conducted secondary analysis using the five significant auxiliary demographic variables from the MAR analysis as covariates in a new set of logistic regression analyses to ascertain if the effects from the complete responder dataset would be affected. Table 4 compares the odds ratios of the original model and the model with the MAR covariates. All the odds ratios were similar in range and magnitude to the original models with significant confidence intervals, except for the Interacting With Others construct on the TAGG-P for the outcome, “is currently enrolled in an education or training program.” The lower level of the odds ratio confidence interval was 0.96. Given these follow-up analysis results based on the MAR models, we conclude there was very little difference in the parameter estimates, thus lending some support to the idea of there being minimal effects of nonresponse bias.
Conducting a Sensitivity Analysis of Responders Versus Nonresponders by Comparing the Odds Ratios of the Original Models to Models With MAR Noted Covariates.
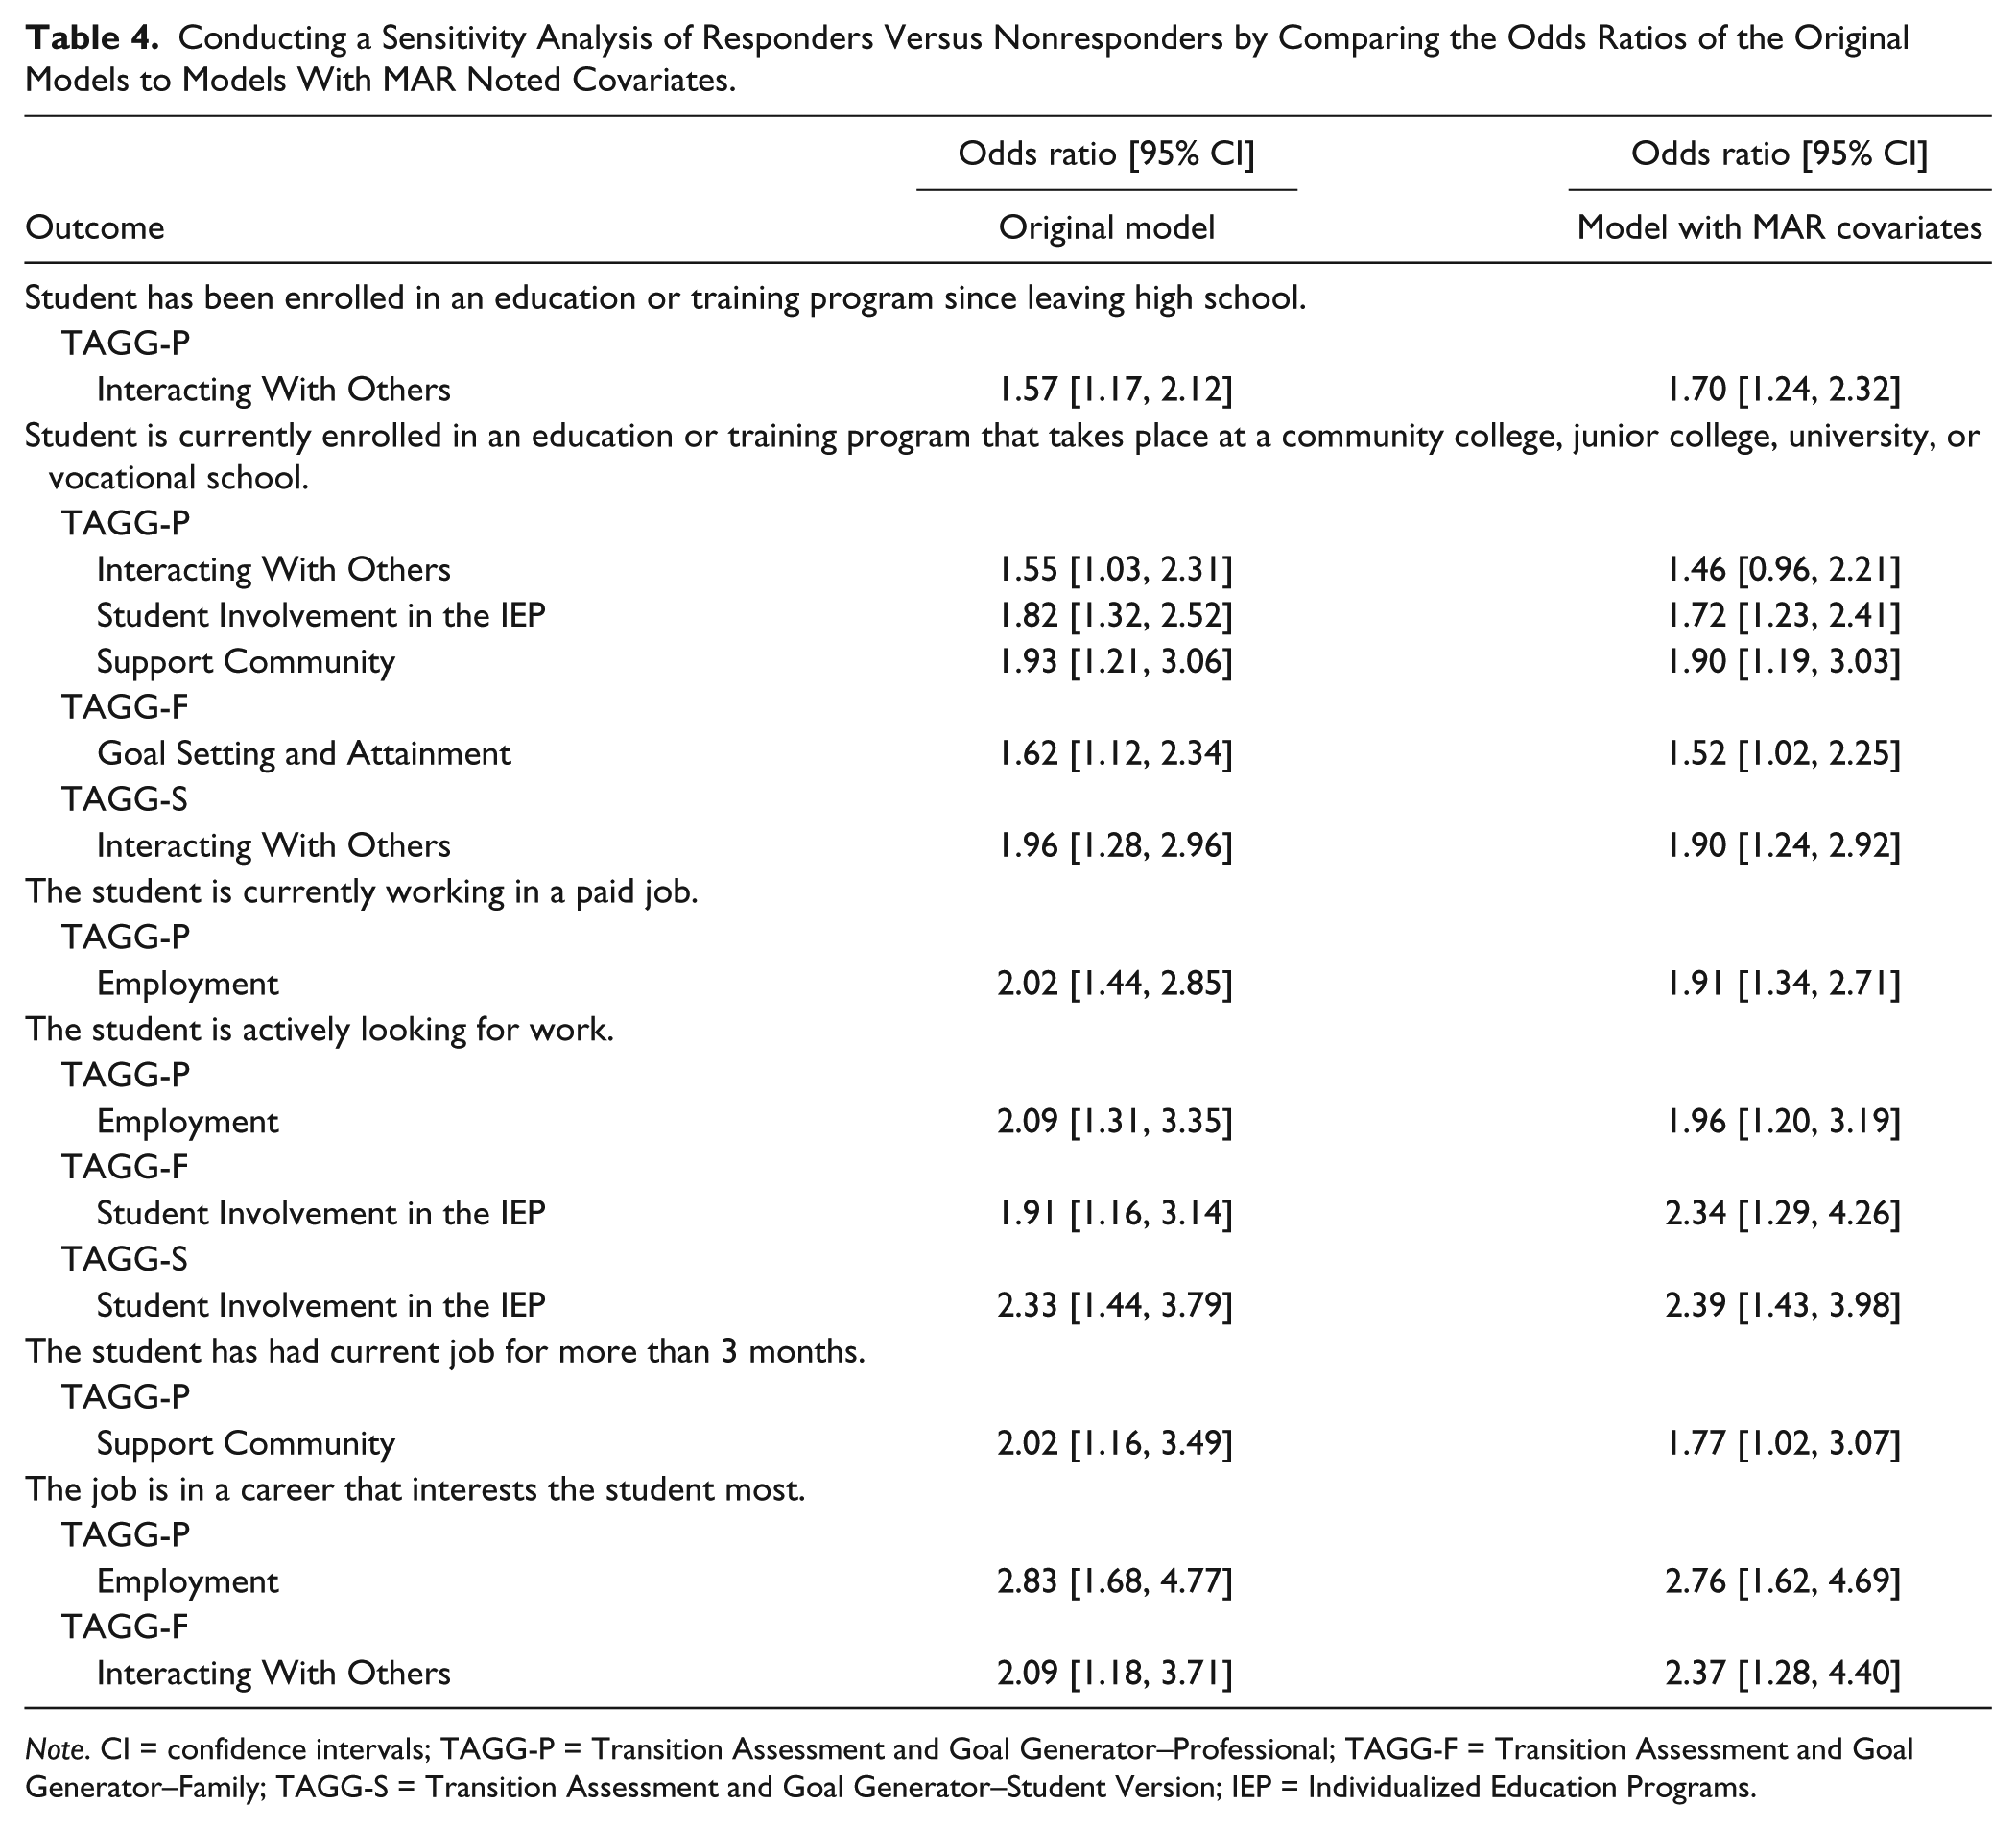
Note. CI = confidence intervals; TAGG-P = Transition Assessment and Goal Generator–Professional; TAGG-F = Transition Assessment and Goal Generator–Family; TAGG-S = Transition Assessment and Goal Generator–Student Version; IEP = Individualized Education Programs.
Discussion
The results indicate five of eight TAGG constructs predicted postsecondary education and employment: (a) Student Involvement in the IEP, (b) Employment, (c) Interacting With Others, (d) Support Community, and (e) Goal Setting and Attainment. Specifically, Student Involvement in the IEP, Interacting With Others, Support Community, and Goal Setting and Attainment constructs predicted postsecondary education outcomes. Employment, Student Involvement in the IEP, Support Community, and Interacting With Others TAGG constructs predicted postsecondary employment outcomes. The addition of student GPA strengthened three of the prediction models. Together, these findings add critical predictive validity evidence supporting the use of TAGG results in transition planning discussions and in developing students IEPs.
Constructs Predicting Both Postsecondary Education and Employment Outcomes
Three TAGG constructs (Interacting With Others, Student Involvement in the IEP, and Support Community) predicted both postsecondary education and employment outcomes for students with disabilities.
Interacting With Others
Students who demonstrated the ability to successfully interact with individuals in their school and home life, as well as other adults in the community, scored highly on this construct. These students participated in projects in small groups and were involved in school or community organizations. Our analysis shows Interacting With Others to be a significant predictor of the outcome “has been enrolled in an education or training program since leaving high school” for the TAGG-P and the outcome of “currently being enrolled in an education or training program” for the TAGG-P and TAGG-S. When looking at postsecondary employment, this construct predicted the outcome of “being employed in a career that interests you most” for the TAGG-F.
We found Interacting With Others predicted more outcomes than other constructs. It makes sense that one’s ability to work well with others across educational and employment settings would lead to positive postsecondary outcomes. We live in a social world where group projects in educational and employment settings are commonplace. The highest odds ratio among the significant models was 1.96 on the TAGG-S, meaning the odds of the student achieving the outcome of current enrollment in an education or training program approximately 2 years after leaving school increased by 96% for a unit increase in the Interacting With Others scaled score. Though the other odds ratios are not as large, the frequency this construct appeared in this analysis suggests the importance of being able to positively interact with others to improve chances for postsecondary education and employment success.
Student involvement in the IEP
Students who are actively engaged in their IEP meeting through meaningful participation or by leading their IEP meeting scored highly on this construct. These students stated their present levels of performance and postsecondary goals, and discussed how their IEP plan will facilitate transition goal attainment. Student Involvement in the IEP was a significant predictor of the outcome of “currently enrolled in an education or training program” on the TAGG-P, as well as the outcome of “actively looking for work” on the TAGG-F and TAGG-S. These results indicate that when the other significant constructs in the model on the TAGG-P are constant, a unit increase in the scaled score of Student Involvement in the IEP results in an 82% increase in the odds of the student being enrolled in an educational program 2 years after leaving school. The odds of the outcome occurring are highest on the TAGG-S; a unit increase in the Student Involvement in the IEP scaled score results in a 133% increase.
Student Involvement in the IEP is one of two constructs appearing as a predictor across all three TAGG versions, which adds to its strength as a predictor. On both the Family and the Student versions, this construct significantly predicted if the student is actively looking for work.
Support community
This construct identifies whether the student knows people who positively influence him or her from those who do not, and if the student can accept help from supports as needed, not just to get out of doing a task. It also assesses whether the student can utilize community agencies for help. This is a significant predictor on the TAGG-P for the education outcome of being “currently enrolled in an education or training program,” and for the employment outcome of “has had current job for more than 3 months.” This may imply the interactions of students with disabilities that professionals observe in the school environment are indicative of whom the students might surround themselves with beyond high school, which can influence whether they enroll in a postsecondary educational program or seek meaningful employment. Students who demonstrated success in postsecondary settings have attributed these skills to supportive people in their network, such as others who have similar disabilities or their family (Skinner, 2004; Thoma & Getzel, 2005); thus these findings solidify previous research.
Construct Only Predicting Postsecondary Employment Outcomes
Employment
Students who had a paid job during high school were more likely to be employed after leaving high school. Employment appeared as a predictor in models for three postsecondary employment outcomes on the TAGG-P. For a unit increase in the Employment scaled score, the odds of the student “currently working in a paid job” increased by 102%. The odds of the student who is not otherwise employed, but is “actively looking for work” increased by 109% with a unit increase in the Employment scaled score. The odds of the student working in a career that interests him or her most increased by 183% for a unit increase in the Employment scaled score. The fact the Employment construct predicted three of four of the employment outcomes further supports the importance of employment for students with disabilities before they leave high school.
Construct Only Predicting Postsecondary Education Outcomes
Goal setting and attainment
Students who set realistic goals and attained them, and those who broke long-term goals into smaller, more manageable steps while monitoring their progress toward goal attainment, and adjusted their goals when something was not working scored higher on this construct. Our analysis found Goal Setting and Attainment to be a significant predictor for the outcome of “current enrollment in an education or training program that took place at a community college, university, or vocational school” on the TAGG-F.
College students with disabilities recognize the importance of setting goals with high expectations to achieve their dreams (Thoma & Getzel, 2005). Adults with disabilities who had success at goal setting carried this skill into postsecondary education, employment, and social areas, while adults who struggled to find success typically did not know how to set realistic and attainable goals, resulting in failure (Goldberg, Higgins, Raskind, & Herman, 2003). Thus, it makes sense Goal Setting and Attainment predicts postsecondary education enrollment.
Good Model Fit With Predictive Value
Taken together, the results provide sufficient evidence the following TAGG constructs predict further education or employment: (a) Interacting With Others, (b) Student Involvement in the IEP, (c) Support Community, (d) Employment, and (e) Goal Setting and Attainment. Nine of the 16 construct odds ratios were greater than 2.0, indicating a greater than 100% increase in the odds of the outcome occurring, while most of the ROC values indicated model discriminatory power greater than random. The TAGG-P provided the most predictive evidence of postsecondary education and employment outcomes, and the Interacting With Others, Student Involvement in IEP, and Employment constructs predicted outcomes with the most frequency.
Limitations and Areas for Future Research
On average, we collected post–high school follow-up data 2 years after students exited high school. As demonstrated by secondary analyses of the National Secondary Transition Longitudinal Follow-Up Study II dataset (Sanford et al., 2011), students’ outcomes tend to change the greater the number of years they have been out of high school. Thus, future follow-up studies of this sample or studies conducted by other researchers examining TAGG results over a longer time period may find different results. For instance, constructs that did not predict outcomes in our study may very well play a role the longer students are in higher education and/or working. Future research needs to replicate these results and extend the length of the follow-up study to 3, 4, 5, or more years after students exited high school.
We relied upon self-report data of former high school students with disabilities to state their post–high school education and employment status. Self-reports may provide false data, and to collect more reliable data, employee supervisors need to verify student self-reports or provide the primary follow-up data. Doing so was not possible in this study as the extant dataset did not contain employer contact information, nor did our follow-up survey ask participants to provide this information.
It is possible our logistic regression results are biased due to having an unrepresentative sample. We attempted to control for this by including demographic variables into our models to approximate a MAR condition. The missingness in our dataset may still depend upon unobserved predictors or the missing data themselves. Furthermore, the magnitude of the missing outcomes greatly reduced our sample size, and thus our study is largely exploratory. This means we could not properly control for Type I error rates due to the smaller than expected follow-up sample.
Implications for Practice
Despite limitations, the results of our study suggest three important applied practice implications. First, special educators face increasing calls to use transition assessments with ample validity evidence supporting their use. Because educators use transition assessment results to prepare students for post–high school education and employment outcomes, special educators need additional transition assessments with predictive validity evidence to add usefulness and credibility to the transition planning process. The results of this study indicate several TAGG constructs predict educational and employment outcomes of former high school students with disabilities. These findings will enable the IEP team members to identify with confidence student needs, which when incorporated into annual transition goals and then learned, will increase the likelihood of postsecondary educational and employment outcomes.
Second, this study establishes evidence of predictive validity supporting the use of TAGG results to assist with transition planning. Five of the eight constructs predict postsecondary education or employment outcomes. Although three constructs, Persistence, Disability Awareness, and Strengths and Limitations, did not predict further education or employment outcomes within the study’s time frame, this finding does not diminish the importance of teaching these behaviors as previous research found these constructs associated with or predictive of postschool education and employment (i.e., McConnell et al., 2013). With limited teaching time left when students reach transition age, special education professionals need to focus on the constructs research found predict postsecondary education and employment outcomes, including Persistence, Disability Awareness, and Strengths and Limitations skills.
Third, and perhaps most important, the results of this study may enable special educators to realize behaviors predicting postschool education and employment outcomes need to be assessed. If needs are identified, these must be included in annual transition goals, because when learned, these generalizable behaviors will facilitate students attaining almost any postsecondary education and employment goals. Rather than thinking all behaviors are equal, IEP teams need to assess generalizable behaviors, or those found to predict post–high school outcomes, to determine transition strengths and needs. When identified as needs, these generalizable behaviors when learned will increase the likelihood of students attaining a meaningful education or employment post–high school outcome.
Footnotes
Declaration of Conflicting Interests
The author(s) declared no potential conflicts of interest with respect to the research, authorship, and/or publication of this article.
Funding
The authors disclosed receipt of the following financial support for the research, authorship, and/or publication of this article: This research was supported by a grant from the Institute of Education Sciences, National Center for Special Education Research (Grant Award No. R324A100246).