
Abstract
This study explored teacher perceptions of their ability to implement the Self-Determined Learning Model of Instruction (SDLMI) with fidelity and the impact of these perceptions on student self-determination outcomes on the Self-Determination Inventory: Student Report (SDI:SR). Using a piece-wise growth model, we found stability in teacher perceptions of their implementation over a 2-year period even with the introduction of a second transition-focused intervention to a subset of the sample. Using a mediation model, we then found a complex relationship between teacher perceptions of fidelity and student outcomes on the SDI:SR. We found that teacher-perceived fidelity over the course of the year was influenced by students’ beginning of the year self-determination status and that teacher-perceived fidelity then affected students’ end of the year self-determination status. The findings suggest an interactive relationship between teacher perceptions of implementation and student outcomes. Implications for research and practice are discussed.
Establishing the efficacy of instructional practices alone is insufficient to address the research-to-practice gap (Fixsen, Blase, Duda, Naoom, & Van Dyke, 2010). Implementation science has emerged in response to this need and is defined as “the scientific study of methods to promote the systematic uptake of research findings and other evidence-based practices into routine practices” (Eccles & Mittman, 2006, p. 1). To study implementation, it is necessary to analyze the factors that enable the sustained use of an evidence-based practice (EBP) given that implementation of a practice is different than choosing or establishing the evidence for a practice (Fixsen et al., 2010). One factor that influences the impact and sustainability of an adopted intervention on outcomes is the degree to which interventionists are able to implement the practice with fidelity (Cook & Odom, 2013). The assessment of fidelity is often, particularly in research studies, completed by external observers to document that degree to which interventions are implemented as intended. However, implementer self-perceptions of their implementation derived from self-monitoring data provide another perspective that has been, in a limited body of research, shown to be correlated with changes in implementation and outcomes (Rispoli et al., 2017). As such, more work is needed to examine the degree to which implementers perceive themselves as capable of implementing complex interventions, the factors that influence self-perceptions, and the association of these perceptions with student outcomes as this could have implications for training and coaching supports for implementers.
Fidelity of implementation is generally understood to be composed of multiple dimensions, including adherence, exposure, quality, participant responsiveness, and program differentiation and information (Dane & Schneider, 1998; Durlak & DuPre, 2008; Dusenbury, Brannigan, Falco, & Hansen, 2003). A variety of means to promote fidelity have been described in the literature, including high-quality training on implementation procedures, a clear implementation manual, self-monitoring of implementation, and instructional coaching (Sanetti & Collier-Meek, 2015). While evaluating the impact of training and instructional coaching on fidelity has received significant attention, the role of teacher self-monitoring of their own fidelity of implementation has received less attention, particularly in regard to the association of teacher perceptions with student outcomes, despite research suggesting that self-monitoring can positively affect implementation (Rispoli et al., 2017).
In the context of transition education, the Self-Determined Learning Model of Instruction (SDLMI; Shogren, Raley, Burke, & Wehmeyer, 2018) has been identified as an EBP (National Technical Assistance Center on Transition, 2016) to enhance in-school and post-school outcomes for students with a range of disability labels (Hagiwara, Shogren, & Leko, 2017). However, questions about implementation and scaling-up of the SDLMI remain, particularly in terms of supports needed by teachers to sustain the SDLMI as a part of ongoing instruction over time and as other interventions are introduced. Researchers have begun to define and examine the impact of an SDLMI coaching model (Hagiwara, Shogren, Lane, Raley, & Smith, in press; Shogren et al., 2019) as well as online supports or online plus coaching supports for implementation of the SDLMI (Shogren, Wehmeyer, Lane, & Quirk, 2017) to explore the impact of these factors on adoption. Although research has generally suggested adequate fidelity of implementation in large-scale studies (Burke, Shogren, Antosh, LaPlante, & Masterson, 2019; Shogren, Raley, et al., 2018), less is known about how teachers perceive their ability to implement the SDLMI with fidelity, and the degree to which these perceptions are stable over time and/or shaped by the introduction of other intervention and instructional demands. Furthermore, the relation between teacher perceptions of implementation of the SDLMI and student outcomes has never been explored.
Exploring teacher perceptions of their fidelity of implementation may be particularly important for the SDLMI given that it is a complex intervention that is designed to be a model of instruction, not a curriculum. Using the SDLMI framework, teachers are trained to integrate a focus on student-directed learning into their instruction. Teachers must identify ways to overlay the SDLMI on their existing instructional activities, requiring that they plan and problem-solve for how to individualize the SDLMI to their specific instructional area and focus (Burke et al., 2019; Shogren, Raley, et al., 2018). As such, it is central to the ongoing development and evaluation of implementation supports to understand how teachers perceive their ability to implement the SDLMI and the association of these perceptions with outcomes, particularly given research in other fields suggesting a potential impact of self-monitoring on fidelity of implementation (Rispoli et al., 2017).
The purpose of this article, which is part of a line of work focused on scaling-up the use of the SDLMI by special education teachers working with transition-age youth with intellectual disability in the state of Rhode Island (RI; Burke et al., 2019; Shogren, Burke, et al., 2018; Shogren et al., 2019), was to explore teacher perceptions of their ability to implement the SDLMI, the changes in these perceptions over time and with changing instructional demands, and the degree to which teacher perceptions of their fidelity mediate growth in student self-determination outcomes. We first examined teacher reports of their implementation of the SDLMI over a 2-year period, exploring if there was stability or change over time and if the introduction of a second transition-focused intervention to a subset of the sample (more fully described in the “Method” section) had an impact on their perceived fidelity of implementation. Second, we explored the degree to which teacher self-reported fidelity over the 2-year-period-mediated student growth in self-determination.
Over 2 years of implementation of the SDLMI, did teacher perceptions of their fidelity of implementation remain stable or change? Was this influenced by the introduction of an additional transition-focused intervention for a subset of the sample in 2016 to 2017 that was introduced to the entire sample in 2017 to 2018?
Did teacher perceptions of their fidelity of implementation of the SDLMI mediate the relationship between self-determination scores at the beginning and end of the school year for students with intellectual disability?
Method
Study Context
The sample and data utilized for this study are part of a multi-year project in the state of RI (initiated in 2015 and ongoing) focused on enhancing school-based transition services to promote greater post-school-integrated employment outcomes for students with intellectual disability. The project emerged after the state of RI entered into a Consent Decree with the U.S. Department of Justice (USDOJ) resulting from violations of Title II of the Americans with Disabilities Act (ADA) as interpreted in Olmstead v. L.C. (1999). The Olmstead decision emphasized that supports and services must be provided in the “most integrated setting feasible” (527 U.S. 581). In RI, the USDOJ found that the state had an “unnecessary and over-reliance upon segregated sheltered workshops and facility-based day programs,” which violated the focus on the “most integrated setting feasible.” The Consent Decree identified transition-age youth with intellectual disability as a target population. It was assumed that the overreliance on segregated options did not simply emerge in adulthood and was shaped during the transition-planning process, particularly given the existing beliefs that segregated sheltered workshops and facility-based day programs were the primary post-school option for students with intellectual disability. The Consent Decree named the Paul V. Sherlock Center on Disabilities at Rhode Island College (RIC) as the “Conversion Institute,” and the Sherlock Center identified enhancing the capacity of secondary special education teachers to promote self-determination as a change strategy, given the established relationship between enhanced self-determination and post-school employment outcomes (Shogren & Shaw, 2016; Shogren, Wehmeyer, Palmer, Rifenbark, & Little, 2015; Wehmeyer & Palmer, 2003; Wehmeyer & Schwartz, 1997).
In 2015 to 2016, targeted teachers of students with intellectual disability in the state of RI engaged in training and coaching (described below) and began to implement the SDLMI in the context of transition planning, and data were collected on goal attainment and changes in student self-determination (see Shogren et al., 2019 for more information). The project expanded in subsequent years to explore the impact of additional supports for transition planning on self-determination and post-school outcomes. In 2016 to 2017, a cluster randomized controlled trial (C-RCT) was initiated where half of the districts (n = nine districts, 31 teachers, and 167 students) were randomly assigned to implement Whose Future Is It? (WF; Wehmeyer & Palmer, 2011), a technology-based, scripted curriculum that addresses transition planning, in addition to the SDLMI. The other half of the districts (n = eight districts, 27 teachers, and 173 students) continued implementation of the SDLMI only. The purpose was to examine if exposure to more time- and content-intensive transition-planning instruction further enhanced student self-determination outcomes (Shogren, Burke, et al., 2018), and results after 1 year of implementation were mixed. Students in the SDLMI-only group reported greater changes in their self-determination, but teachers reported greater changes in student self-determination in the SDLMI + WF group.
The purpose of the present analyses differs from the previous work focused on examining student outcomes and instead explored teacher perceptions of their implementation of the SDLMI during the 2016 to 2017 and 2017 to 2018 project years (data from 2015 to 2016 on teacher implementation were collected using a different tool and could not be included in the analyses; see “Limitations” section). Furthermore, we explored the degree to which these perceptions mediate student self-determination scores from the beginning to the end of the 2017 to 2018 implementation year.
Sample
Across the 2016 to 2017 and 2017 to 2018 school years, 64 special education teachers participated in the project and completed at least one measure of their perception of their fidelity of implementation. Of the 64 teachers, 59 were female and five were male. Teachers average age was 43.28 years (SD = 14.35) and knew students for an average of 1.89 years (SD = 1.62). The student sample, which provided the self-determination outcome data on the SDI:SR in the 2017 to 2018 school year, included 359 transition-age students served under the educational classification of intellectual disability in 17 school districts in RI. Both students and teachers reported student demographic information, and teacher responses were used when student responses differed or were missing. The sample included 211 male students, 106 female students, and two gender non-binary students. Information on gender was not available for 40 students. Students ranged in age from 11 to 20 years (M = 16.68, SD = 2.04). The two largest race/ethnicity groups were White (n = 139) and Hispanic/Latino (n = 89). In addition to intellectual disability, 101 students had secondary disability classifications. Table 1 provides additional demographic information.
Student and Teacher Gender and Race/Ethnicity.
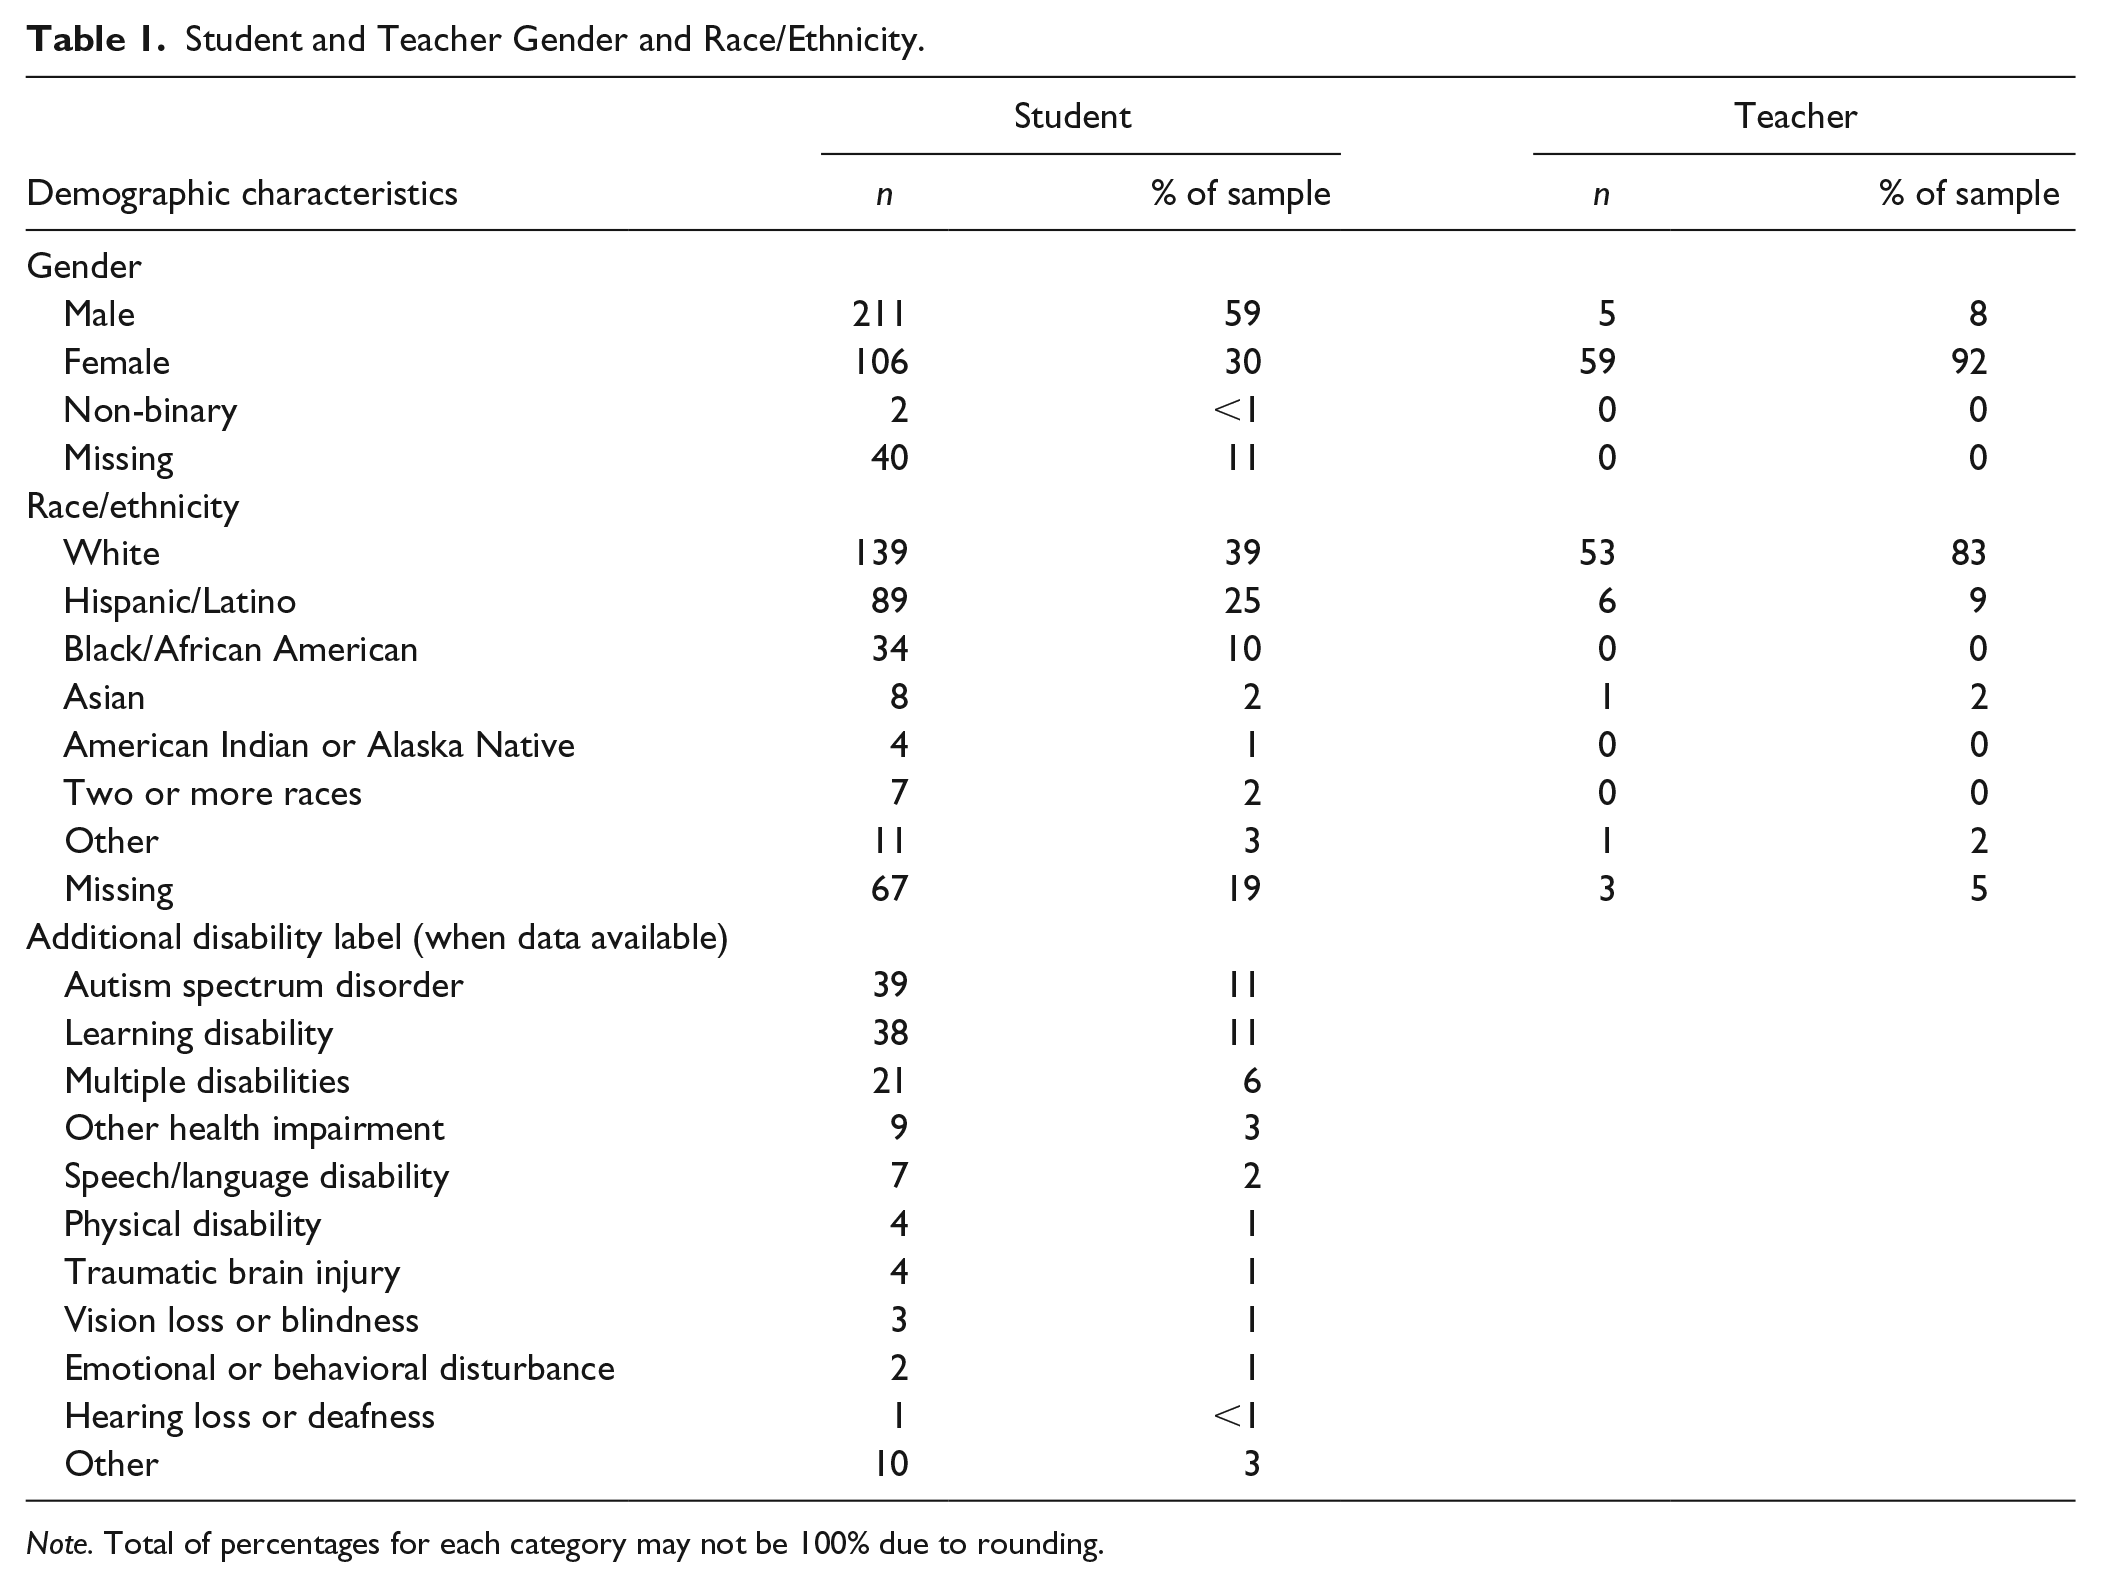
Note. Total of percentages for each category may not be 100% due to rounding.
Procedures
We provide a general overview of the training and coaching procedures in the following sections to further elaborate on the context within which teachers implemented the SDLMI.
Training on the SDLMI
In 2015, a one-and-one-half day training on the SDLMI led by University of Kansas (KU) researchers and organized by the Paul V. Sherlock Center at RIC was delivered to teachers (n = 40) in districts across the state. All trained teachers then implemented the SDLMI in 2015 to 2016 (Shogren et al., 2019) and received ongoing coaching, described below. As mentioned in 2016 to 2017, a C-RCT was implemented to examine the differential impacts on student outcomes when exposed to more intensive interventions (Shogren, Burke, et al., 2018). KU researchers conducted an additional one-half day training for approximately half of the teacher sample (selected by random assignment at the district level) on a structured, transition-planning curriculum, WF (Wehmeyer & Palmer, 2011). During this year, all teachers continued to implement the SDLMI with coaching supports, and the randomly assigned half of the sample also began implementing WF. In the 2017 to 2018 school year, the half of the sample that did not use WF in 2016 to 2017 received training, so that the entire sample of teachers implemented the SDLMI and WF in 2017 to 2018. No additional SDLMI training was provided, although coaching continued throughout the life of the project, specific to the SDLMI.
Coaching
All teachers received ongoing coaching supports on SDLMI implementation from trained district coaches beginning in the 2015 to 2016 school year. Coaches visited teachers’ classrooms a minimum of three times per year of implementation for approximately 45 to 60 min each. These visits were coordinated between coaches and teachers based on scheduling and occurred approximately every 3 months. Coaches conducted fidelity observations, using the same tool that teachers used for self-report (described subsequently), and this was used to structure discussions between coaches and teachers on areas of strength and areas in need of supports for implementation. Based on these conversations, additional resources were identified and shared to enhance ongoing implementation. Coaches participated in monthly in-person problem-solving and professional development meetings with staff from KU and the Sherlock Center at RIC to continue enhancing their supports for teachers over the course of the project.
Interventions
As described, teachers in all participating districts implemented the SDLMI only in 2015 to 2016. In 2016 to 2017, teachers in half of the participating districts were randomly assigned to implement the SDLMI + WF, whereas teachers in the other half of the districts implemented the SDLMI only. In 2017 to 2018, teachers in all participating districts implemented the SDLMI + WF. In this article, our primary focus is on fidelity and outcomes related to the SDLMI, although both interventions are described below to give the full context of the project.
The SDLMI
The SDLMI (Shogren, Raley, et al., 2018) is an evidence-based teaching model intended to be used by educators to enable students to self-direct and self-regulate their actions in pursuit of their goals through a goal setting and attainment process. Teachers implemented the SDLMI with the objective of individualizing supports for students to set and work toward three or more goals during each year. Students set and worked toward goals related to transition and employment (e.g., career exploration, job shadowing, developing specific job-related skills, identifying internship or job opportunities), as well as other self-selected goals. The SDLMI has three distinct phases, which are each associated with a problem for the student to solve (Phase 1: What is my goal?, Phase 2: What is my plan?, and Phase 3: What have I learned?). Each phase has four Student Questions, and the Student Questions lead students through a problem-solving sequence to solve the problem posed in that phase. Teacher Objectives are linked to the Student Questions and serve as a roadmap for what teachers want to achieve in supporting students to answer questions. Teachers individualized instruction and supports for students to engage with the Student Questions (e.g., verbal and visual methods or behavioral indicators and observations), along with modifications (e.g., alternate methods of communication or content presentation) based on their expertise and knowledge of student needs. Teachers also provided direct instruction on skills embedded in the SDLMI (i.e., antecedent cue regulation, choice making, communication, decision-making, goal attainment, goal setting, problem solving, self-advocacy, self-assessment, self-awareness, self-instruction, self-monitoring, and self-scheduling) approximately twice per week using the Educational Supports defined in the model. Teachers integrated students’ goals and action plans into ongoing curriculum and instruction, as outlined in the SDLMI Teacher’s Guide (Shogren, Raley, et al., 2018).
WF
Beginning in 2016 to 2017, the teachers assigned as part of the C-RCT to the SDLMI + WF group implemented WF along with the SDLMI, and all teachers implemented both the SDLMI and WF in 2017 to 2018. WF is an evidence-based transition-planning curriculum that addresses specific self-determination skills associated with transition planning (Wehmeyer & Palmer, 2011). The curriculum is available in both digital and print format and utilizes features of universal design (e.g., multiple means of representation, action and expression, and engagement), along with accessibility features such as read-aloud narration and embedded vocabulary definitions. There are 15 chapters divided among three sections: Getting to Know Your IEP, Decisions and Goals, and Your IEP Meeting. The WF materials include an Instructor’s Guide, a Student Reader, and a Student Workbook. Teachers supported students to access scripted content through the Student Reader and engage in the Student Workbook activities linked to each chapter. Teachers designated specific time for students to engage in WF activities approximately three times a week for 45 min, and teachers worked with students one-on-one, in small groups, or with a whole class with the target of progressing though all 15 chapters over the school year.
Measures
SDLMI fidelity of implementation
Over the course of the project, refinements were made to the Shogren, Wehmeyer, Antosh, and Naoom (2015), with a pilot version being used in 2015 to 2016. Data from the pilot version in 2015 to 2016 were used to update the tool that was used in 2016 to 2017 and 2017 to 2018. The SDLMI Teacher Fidelity Measure was designed in consultation with experts in implementation fidelity to align with the dimensions associated with effective measurement of fidelity: adherence, exposure, quality, participant responsiveness, and program differentiation. The teacher and observer (used by coaches in RI) versions of the tool were developed to parallel each other so that they could be used during coaching conversations to promote problem solving related to the issues of implementation (Hagiwara et al., in press). Our focus in the present analysis was on teacher-reported fidelity perceptions; however, future work is needed to explore coaches’ ratings of fidelity, the association of these ratings with teacher ratings, and the impact of these ratings on student outcomes (see “Discussion” section). During 2016 to 2017 and 2017 to 2018, teachers reported on their fidelity at three time points during each year, aligned with coaching observations. The SDLMI Teacher Fidelity Measure included five items unique to each Phase of the SDLMI, designed to assess adherence, exposure, and quality of implementation for each of the Teacher Objectives associated with the SDLMI and responsiveness of students to the Student Questions, along with the degree to which the aligned Educational Supports were used appropriately. Teachers rated items on a four-point scale (0 = not at all, 1 = somewhat, 2 = mostly, 3 = completely). Sample items for the Teacher Objectives aligned with Student Question 1 included: “Did the student identify what they want to learn (i.e., identify strengths and needs, communicate preferences, interests, beliefs, and values, prioritize needs)?” The measure also included a checklist to indicate which specific Educational Supports were used, as well as an open response item for additional notes or comments. For analysis purposes, we calculated average fidelity scores across the five items for each phase and conceptualized the expected level of fidelity to be around the average of the scale, given the complexity of the SDLMI activities.
Student self-determination
At the beginning and end of each school year, students completed the Self-Determination Inventory: Student-Report (SDI:SR; Shogren & Wehmeyer, 2017). The SDI:SR is a standardized measure of self-determination in which students rate their level of agreement with 21 statements about their ability to be self-determined (i.e., to make choices, set and attain goals, and make decisions). The SDI:SR was developed based on the Causal Agency Theory (Shogren, Wehmeyer, Palmer, Forber-Pratt, et al., 2015) and validated with more than 4,500 youth aged 13 to 22 years with and without disabilities (Shogren, Little, et al., 2018). Analyses suggest strong reliability of items and validity of scores including differentiation of scores in youth with intellectual disability (Shogren, Little, et al., 2018). Students completed the measure on a digital platform with teacher support, as designed. Items are worded in first-person voice as statements, such as “I figure out ways to get around obstacles.” Students indicated their responses to each item on a slider scale with anchors of disagree to agree. The computer system calculates scores on the slider scale, assigning values between 0 and 99. An overall self-determination score is computed by averaging responses across all marked items in the measure. In 2017 to 2018, teachers reported that the SDI:SR was not appropriate for 24 students at one or more time points because of the significance of their support needs.
Analysis
The methodological framework of Bayesian statistics was chosen for this analysis, rather than a traditional frequentist approach that uses null hypothesis significance testing. The Bayesian approach is increasingly favored in the social sciences and when researching development (Kaplan & Depaoli, 2013; van de Schoot et al., 2014). Benefits include the ability to statistically model prior beliefs about the observed data, reliable estimation when the sample is small (Lee & Song, 2004), and the capacity to model parameter uncertainty by means of a whole distribution, which differs from the maximum-likelihood approach of offering a single value denoting uncertainty. Bayesian inference also avoids potential errors surrounding null hypothesis significance testing and replication of results (Asendorpf et al., 2013). Specifically, Bayesian analysis (Gelman, Carlin, Stern, & Rubin, 2004; Jackman, 2009) necessitates not only the distribution of a parameter but also a distribution that outlines the prior belief about the parameter in question, colloquially referred to as “the prior.” The estimation process joins this prior with the new observed data, and the resulting combination forms a posterior distribution. This posterior is the target of statistical inference within a Bayesian design, and it is proportional to the likelihood multiplied by the prior distribution (i.e., the observed data multiplied by previous knowledge of what value the data can hold). Interpreting parameters of a Bayesian analysis are similar, but not identical, to a traditional design that uses p-values and maximum-likelihood estimation. In interpreting Bayesian parameters, we primarily interpret credible intervals (CIs), as they establish the probability that the interval surrounding a parameter of interest contains the true population value. For our purposes, we used these CIs to denote uncertainty around parameter estimates, or more concretely to draw conclusions about if the parameters suggest growth or stability of teacher fidelity over time.
To address our two research questions, we used a sequential approach within the Bayesian framework, and Just Another Gibbs Sampler (JAGS; Plummer, 2003) in R (R Core Team, 2003) was used for all analyses. To address Research Question 1, we examined if teacher self-reported fidelity changed across the six measurement time points (three in 2016–2017 and three in 2017–2018). This allowed us to address the question of if teacher perceptions of their ability to implement the SDLMI changed or remained stable. Furthermore, this enabled us to determine the best model to apply to the data to address Research Question 2, as a different model would be used if change was or was not present. To examine change, we utilized a piece-wise latent growth model (Chou, Yang, Pentz, & Hser, 2004) to test if there were differences from piece to piece (or measurement to measurement). This analysis allowed us to understand if there was change in fidelity over time and if the rate of change was influenced by intervention condition across the 2 years. The piece-wise growth model includes both a latent intercept (starting value) and a latent slope (growth) term for the years of the intervention. The intercept is interpreted as the average starting value of fidelity, and the latent slope is the average amount of change over time. These parameters, and how similar or different they are, inform whether there is change within and across groups over the 2 years.
To answer Research Question 2, we utilized the findings from the Bayesian piece-wise growth curve analysis for Research Question 1 to determine the best model. If a difference across years of teacher self-reported fidelity was found, then we would include the second latent slope as a piece-wise model. If differences were not found, then separation of fidelity across years with the second latent slope would not be required and we could use a traditional latent growth curve (LGC) as a portion of a larger mediation model (i.e., the relationship between teacher perceptions of fidelity and student outcomes on the SDI:SR). In contrast to a piece-wise model, an LGC estimates a single latent intercept and slope for all six measurement occasions rather than an intercept and slope for each year. The coding of time for the LGC was the first measurement occasion of fidelity in 2016 to 2017. Minimally informative prior distributions were used with a mean of zero for the intercept and slope parameters and uniform distributions for the error terms. This specification is consistent with other Bayesian approaches to modeling growth curves (Barnard, McCulloch, & Meng, 2000). In this case, the LGC is the mediation portion of the model, as it would be predicted by the initial student SDI:SR measurement occasion and then predict the later SDI:SR time point, allowing us to interpret the relationship between teacher perceptions and initial and later self-determination scores.
Results
As described, a sequential set of analyses was conducted to examine change in teacher self-reported fidelity over time and how that fidelity affects student self-determination.
Research Question 1—Change in Teacher Perceptions of Implementation
We first used a piece-wise growth model to determine if there was change or stability in teacher ratings of their fidelity of implementation over the 2 years and six measurement occasions. Table 2 reports the raw means of teacher self-reported fidelity by time point, and a count of teachers in each of the levels of implementation (SDLMI and SDLMI + WF). Table 3 shows the Bayesian CIs (i.e., the uncertainty around the mean of the parameter which is used to establish the probability that the interval surrounding a parameter of interest contains the true population value) for the intercept, latent slope factor of each year (2016–2017 and 2017–2018), as well as the impact of implementing WF on the slope during each year. To interpret the values in Table 3, we look at the 95% CI. When a CI includes zero (i.e., the lower interval equals a negative value and the upper interval equals a positive value), we cannot conclude that the true population value of the parameter differs from zero, or in the case of latent slopes, that there is any positive or negative change.
Mean Values and Counts of Teacher Fidelity by Measurement Occasion.
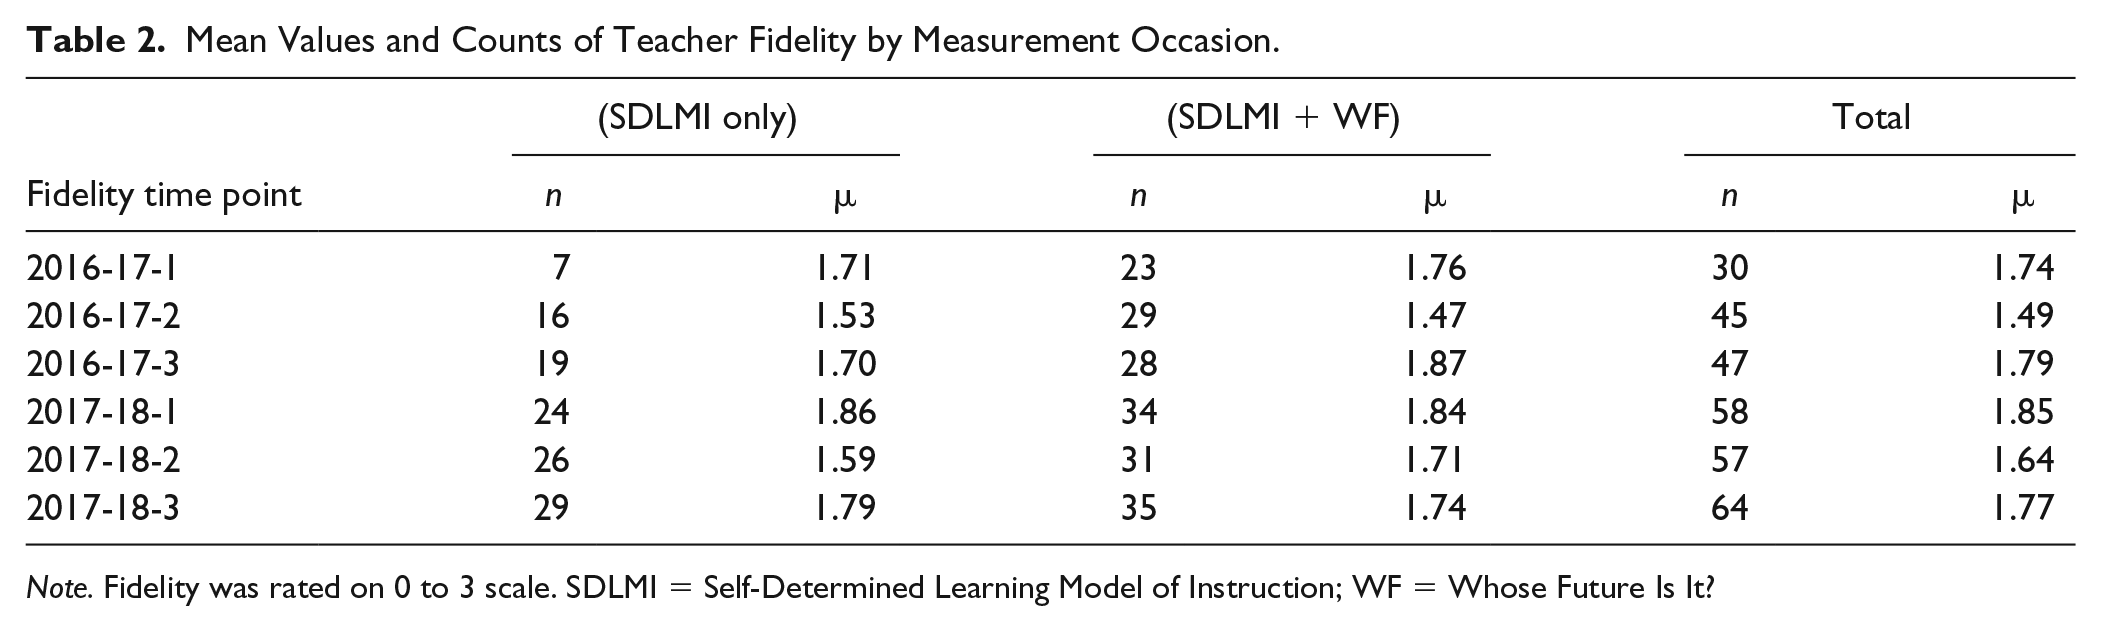
Note. Fidelity was rated on 0 to 3 scale. SDLMI = Self-Determined Learning Model of Instruction; WF = Whose Future Is It?
Mean and CIs From Initial and Final Models.
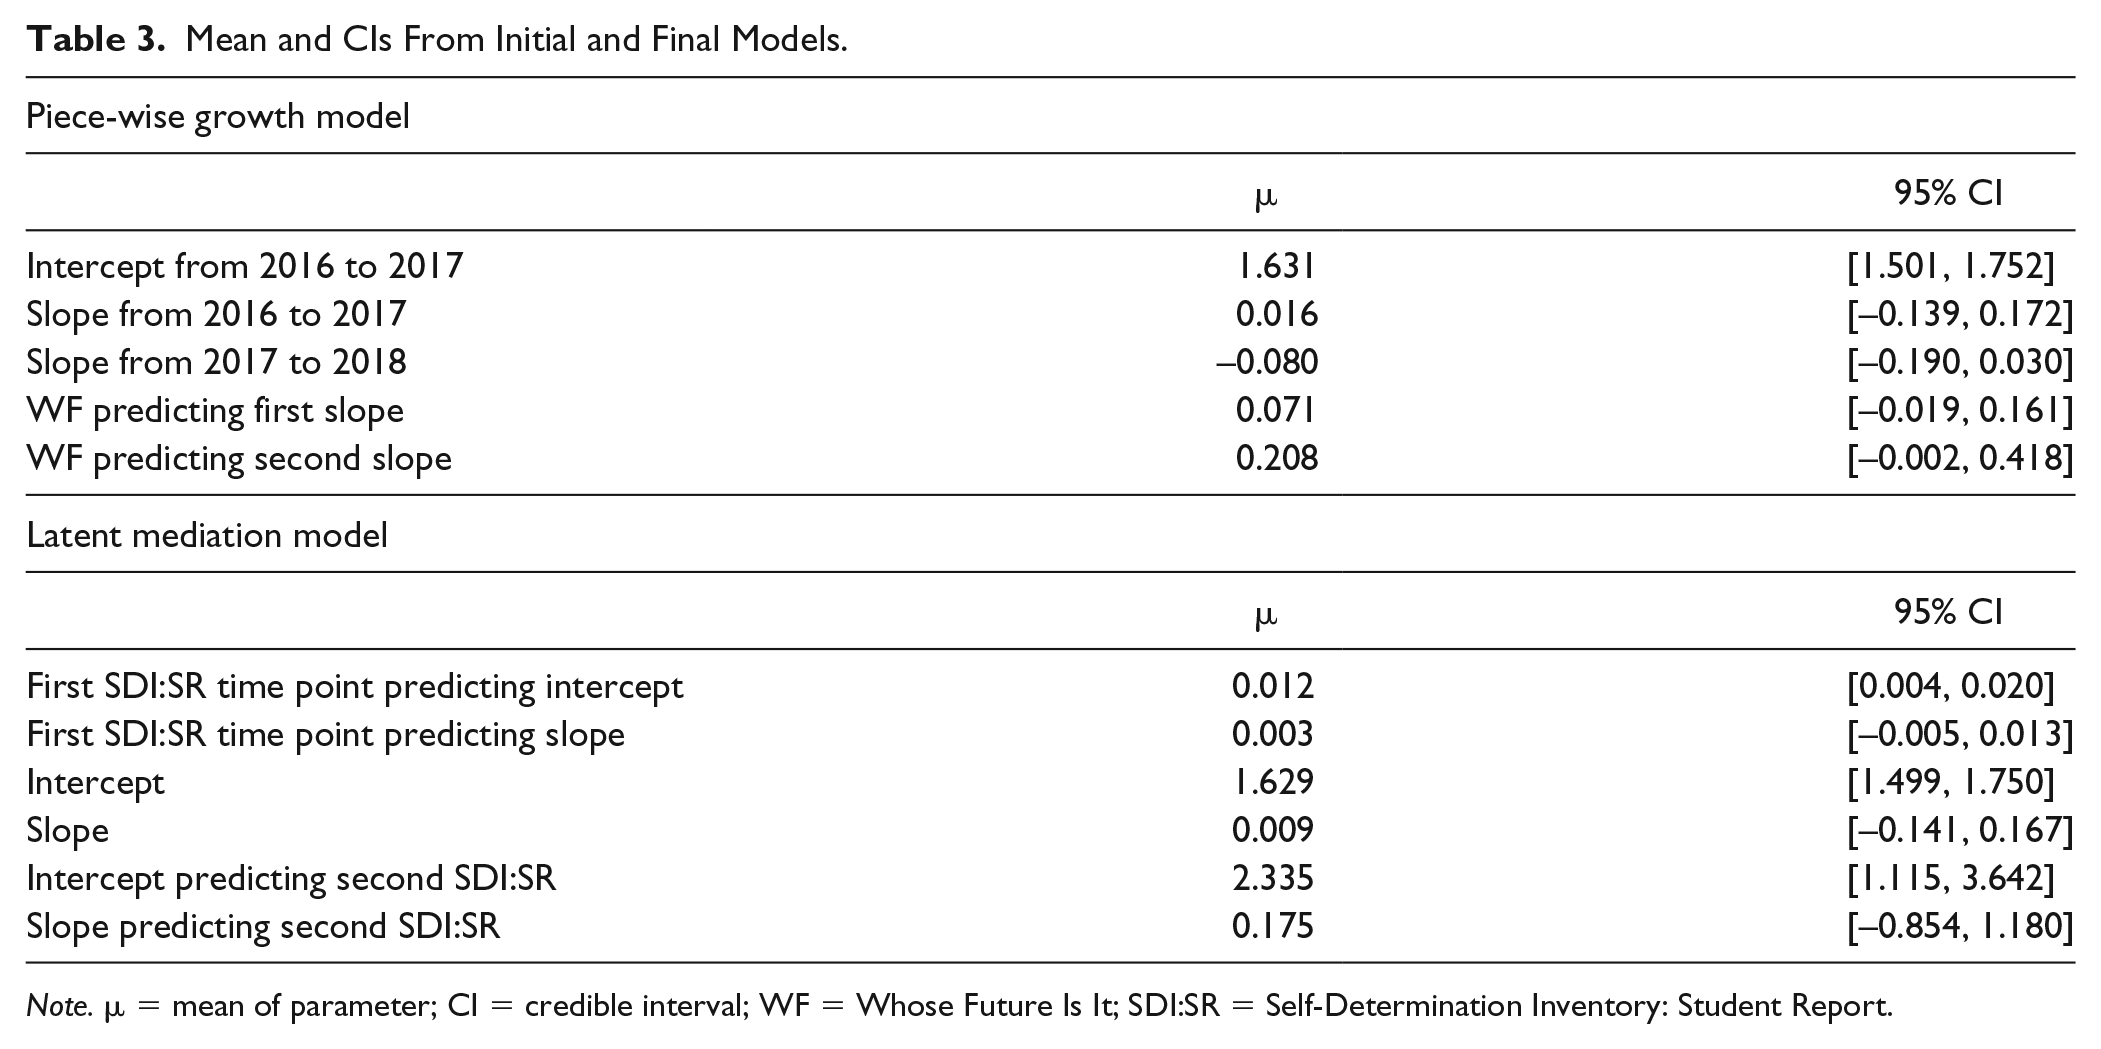
Note. μ = mean of parameter; CI = credible interval; WF = Whose Future Is It; SDI:SR = Self-Determination Inventory: Student Report.
What is notable for the slope parameters across years and implementation of WF is that the 95% CI includes zero, which indicates we cannot confidently state that the mean parameter value (µ in Table 3) is non-zero. This finding indicates the rate of change over time of teacher perceptions of SDLMI implementation is constant in both years and implementing WF does not affect the rate of change. Specifically, there is stability and limited change over time in teacher perceptions of their fidelity, and further there is limited impact on perceptions of SDLMI fidelity based on the use of WF. This finding not only has implications for understanding how implementation is perceived by teachers over time, as will be elaborated on in the “Discussion” section, but also influenced the structural design of the latent mediation model for Research Question 2.
Research Question 2—Impact of Teacher Perceptions on Student Outcomes
After establishing that there were no changes in teacher perceptions of their implementation over the course of the project and based on their use of WF in addition to the SDLMI, we moved forward with a traditional LGC with one intercept and one slope factor representing all fidelity measurement occasions to address Research Question 2. In this model, we used the LGC as the mediation piece between the two self-determination measurement points in 2017 to 2018 to determine if teacher perceptions of their fidelity influenced the growth in student self-determination scores during the year. The bottom half of Table 3 shows the parameter estimates for the final model, again in the form of Bayesian 95% CIs around the mean for each parameter. As described previously, to interpret these values, one examines whether the CI includes zero (a negative value in the lower bound and a positive value in the upper bound). If this is the case, then we cannot be confident that the true population value of the parameter is different than zero.
Generally, the final LGC model confirms the finding from the piece-wise growth model, namely, an intercept displaying average fidelity at the start of the study and a constant (neither increasing nor decreasing) slope. As an example, an increase in SDLMI fidelity over time would have been found if both ends of the CI were positive. The constant slope suggests stability in teacher self-reported fidelity scores over the course of the study even when modeled with one slope parameter. Next, when looking at the relationship between teacher self-reported fidelity and student self-determination at the beginning and end of the 2017 to 2018 school year, there is a positive relationship between teacher perceptions of their fidelity (i.e., the intercept parameter) and student self-determination scores at the beginning and end of the year (i.e., the 95% CI does not cover zero). Specifically, there is a positive relationship between student SDI:SR scores at the first time point and the teacher self-reported fidelity intercept, indicating that student self-determination capacities may influence teacher perceptions of their ability to implement the SDLMI with fidelity. In addition, there is a positive relationship between teacher self-reported fidelity and student end of the year self-determination scores, suggesting teacher perceptions of fidelity throughout the year predicts students’ end of the year self-determination scores. This suggests that greater fidelity of implementation, from the teacher’s perspective, leads to greater growth in student self-determination over the year. There is not a significant relationship between the slope (i.e., teacher change in fidelity) and self-determination; however, this is likely influenced by the fact that the slope was constant (i.e., teachers demonstrated stability, not growth, over time). Thus, the relationship was primarily between average teacher fidelity ratings over the course of the year and the self-determination of students at the beginning and end of the year, with self-determination scores at the beginning of the year predicting implementation and implementation then predicting self-determination scores at the end of the year.
Discussion
The sustained use of EBPs in schools is influenced by many factors, one of which is the degree to which interventionists can and believe they can implement the practice with fidelity in real-world settings (Fixsen et al., 2010). Measuring fidelity and its impact on outcomes is complex, particularly when considering the multiple domains of fidelity and the various factors that influence fidelity. In the context of transition services, promoting and enhancing self-determination are recognized as best practice (National Technical Assistance Center on Transition, 2016). The SDLMI has been identified as an EBP because of the accumulating research establishing a relationship between its implementation and student outcomes (Hagiwara et al., 2017), and yet limited research on implementation supports for teachers has been conducted. In our previous work, we have established that teachers perceive themselves as able to implement the SDLMI after training and with ongoing coaching (Shogren et al., 2019). However, the degree to which teachers perceive themselves as able to maintain fidelity of implementation over time, and as they are asked to implement other interventions to enhance transition outcomes, had never been examined, nor has the impact on student outcomes.
The findings suggest that (a) teachers perceived themselves as able to implement the SDLMI with fidelity over a 2-year period, even as they were asked to implement another intervention (WF) focused on promoting transition outcomes as part of the larger study, (b) teacher-perceived fidelity over the course of the year was influenced by students’ beginning of the year self-determination status, and (c) teacher-perceived fidelity affected students’ end of the year self-determination status. Essentially, this suggests that there is an interactive relationship between teacher perceptions of their implementation and student outcomes, with students influencing teachers and teachers then influencing students during the school year. This interaction between teacher perceptions and student outcomes should be further addressed in future research particularly as it suggests there may be a relationship between how teachers perceive their skills and abilities that contribute to more positive student outcomes. The findings also suggest that the addition of other interventions, namely WF, had limited impact of teacher perceptions of their ability to implement the SDLMI, which may have resulted from overlap between teacher skills in implementing the WF and the SDLMI or limited additional demands on teacher time as WF is computer-based and mainly self-directed.
Implications for Research and Practice
These findings have multiple implications for future research and practice, specifically related to implementation science and implementation supports. First, it is necessary to further examine the most effective ways to promote teacher fidelity of implementation of the SDLMI. As noted in the “Introduction” section, the SDLMI is a model of instruction, not a curriculum, which requires teachers to problem-solve to overlay the SDLMI on their existing curricular practices (Shogren, Raley, et al., 2018). Furthermore, implementation of the SDLMI requires changing from a primarily teacher-directed approach to setting curricular goals to a primarily student-directed approach. Teachers often must change the process they use to engage with students to set curricular goals, which may require specific supports for teacher change. Considering the most effective ways to support implementation through research on coaching (Hagiwara et al., in press) and other supports is necessary to inform practice and enhance student outcomes. The average self-reported fidelity ratings made by teachers ranged between 1.49 and 1.85 over the course of the study, on a 0 to 3 scale. In previous research, we have explored both teacher and coach ratings of fidelity, finding general congruence in mean ratings across teachers and coaches, although coaches tended to report slight increases in teacher fidelity over time, whereas teachers reported very slight decreases, although it is important to note that statistical differences were not explored in this study, necessitating ongoing work examining the relationship between self-monitoring and external observations (Shogren et al., 2019).
In this study, we did have data from coaches on teacher fidelity as previously noted and found that coaches made slightly higher ratings across observations than did teachers, although this varied over the study. Thus, future work is needed that explores (a) congruence between teacher and coach fidelity ratings, (b) the validity of coach fidelity ratings and the association with growth in teacher skills related to the SDLMI, (c) the association of coach (or any external rater) fidelity ratings with student outcomes, and (d) the necessary level of fidelity to influence outcomes. Such work could further inform implementation supports provided to teachers as well as further document the impact of implementing the SDLMI, with fidelity, on student outcomes. It is unclear what level of fidelity of implementation is needed to enhance outcomes, although this study documents that there is a relationship. We have repeatedly asserted that fidelity ratings on the SDLMI Teacher Fidelity Measure in the average range are acceptable (Shogren et al., 2019)—as found in this study—given the complexity of the SDLMI. Other research on implementation fidelity suggests that 100% or “perfect” fidelity is not a reasonable expectation, or a necessity to affect outcomes (Durlak & DuPre, 2008; Harn, Parisi, & Stoolmiller, 2013). However, ongoing work is needed to examine if there are supports that differentially affect fidelity and lead to greater sustained implementation (Breitenstein et al., 2010), and this will likely help elucidate other factors that affect implementation and inform practice.
Additional work is also needed to determine how frequently objective measures of fidelity should be collected or to what degree self-report of fidelity is congruent with and as informative as external observations. This is potentially impactful for several reasons, including the expense and time of outside fidelity observations in practice contexts. Furthermore, the degree to which independent observers versus trained coaches who also give instructional feedback can reliably conduct fidelity observations is needed as this may provide a more meaningful context for fidelity observations.
Limitations
In interpreting the findings and implications, it is necessary to consider the limitations to the present analyses. First, it is important to note that the data analyzed for this article are part of a larger project as described throughout this article and that many aspects of the larger project affected data collection and analyses. For example, implementation occurred rapidly in 2015 to 2016 in the context of changes mandated in the Consent Decree entered into by the state of RI. This led to not being able to link data from the 2015 to 2016 year to subsequent years of data collection because while data on fidelity of implementation were collected across all 3 years of the project, a pilot version of the SDLMI Teacher Fidelity Measure was used in 2015 to 2016 (Shogren et al., 2019). As such, we focused only on the 2016 to 2017 and 2017 to 2018 data in the present analyses, but different results could have been found if we had also been able to link to fidelity data from the first year. In addition, the introduction of WF occurred using a C-RCT in 2016 to 2017; the primary purpose was to analyze if more intensive interventions lead to enhanced student outcomes (Shogren, Burke, et al., 2018), not to examine impacts on teacher fidelity. Although the present analyses capitalized on this design, it is important to note that teacher fidelity was not a primary focus. For example, although teachers in the SDLMI + WF condition in the 2016 to 2017 year reported on both SDLMI and WF fidelity, during the 2017 to 2018 school year, when all teachers implemented the SDLMI + WF, ongoing WF fidelity was not collected to attempt to reduce the demands on teacher time and because the WF fidelity tool was primarily procedural in nature (e.g., did students complete the assigned chapter and assignments, given that WF is a self-directed, scripted, and technology-based curriculum). However, we do not know about the degree to which teachers regularly implemented WF with students during this time, which could have implications for variability in the SDLMI fidelity. Furthermore, we focused on teacher perceptions of their fidelity in the present analyses and not coaches observation. Future work is needed both to examine congruence in self-reported and coach-observed fidelity and explore if the same patterns of relationships to student outcomes are found.
In addition, the analysis of the student data was conducted disregarding any possible nesting effect that may have been present. Although this resulted in a more parsimonious mediation model, teacher- or school-level effects may explain some of the variations in self-determination and teacher fidelity. However, because of the sample size, accounting for this nesting was not feasible. We also did not look at whether students were consistent across teachers over the 2 years of the analysis, which may affect variation in teacher fidelity of implementation and student outcomes. Relatedly, detailed information on specific classroom setting (i.e., inclusive general education setting, separate special education setting) was not collected, which also may have explained some of the variations in self-determination and teacher fidelity.
Finally, we looked at data from the SDI:SR as our outcome measure, although data were also collected from the parallel Self-Determination Inventory: Parent/Teacher Report (SDI:PTR). As described previously, teachers reported that some students (n = 24) were unable to complete the self-report measure in 2017 to 2018 even with the built-in accessibility features and recommended teacher supports, because of the intensity of their support needs, meaning they were not included in the present analyses. This decision was made because of other research that has shown disparities in teacher and student reports on self-determination measures (Shogren, Anderson, Raley, & Hagiwara, 2018); however, future research is needed to examine the relationship between scores on the SDI:PTR and teacher-perceived fidelity, examining if similar patterns hold when teachers are reporting both on fidelity and student outcomes. Finally, we included all data on teacher perceptions of fidelity of implementation in 2016 to 2017 and 2017 to 2018, even if teachers only participated for 1 year due to attrition resulting from changes in teacher status (e.g., moved, retired, changes in assignment). And, we only examined student outcomes in 2017 to 2018. Future work is needed to explore specific teacher and student trajectories over time, to examine if there are other contextual factors that influence fidelity outcomes, particularly factors that affect teacher fidelity over time and the relationship to longer-term student outcomes.
Footnotes
Declaration of Conflicting Interests
The author(s) declared no potential conflicts of interest with respect to the research, authorship, and/or publication of this article.
Funding
The author(s) disclosed receipt of the following financial support for the research, authorship, and/or publication of this article: The research reported here was supported by the Institute of Education Sciences, U.S. Department of Education, through Grant R324L160002 to the University of Kansas. The opinions expressed are those of the authors and do not represent views of the Institute or the U.S. Department of Education.