
Abstract
Using longitudinal data from early adolescence through young adulthood, this study examined the association between different types of postsecondary education (PSE), age of enrollment in PSE, and the trajectory of alcohol use for Canadian young adults (N = 521). Trajectories of alcohol use were compared across young adults at 2-year colleges, 4-year universities, transfer programs (started at a 2-year college and transferred to a 4-year university), and terminal high school graduates. While initial findings revealed significant differences in the drinking trajectories of 2-year college students and 4-year university students, all differences were accounted for by variability in the age of enrollment. Overall, there were few differences in heavy drinking across types of institutions, but younger students increased their alcohol use more than older students following enrollment. However, young adults who do not attend PSE may be at greatest risk for heavy drinking over time.
At the population level, alcohol use typically accelerates during the transition to adulthood, peaks around age 21, and then gradually declines (Maggs & Schulenberg, 2005; Thompson, Stockwell, Leadbeater, & Homel, 2014). Some research suggests that young adults who attend postsecondary education (PSE), particularly 4-year colleges, have steeper increases in alcohol use than young adults who do not attend PSE (Carter, Brandon, & Goldman, 2010; Dowdall & Wechsler, 2002; Jackson, Sher, & Park, 2005). However, it is unclear whether increases in alcohol use also occur for young adults who attend other types of PSE or whether increases in alcohol use are influenced by how old young adults are when they enroll. Moreover, research to date has almost exclusively been conducted with U.S. samples of young adults, limiting the generalizability of findings to countries with different education systems and alcohol regulations (i.e., legal drinking age). Using longitudinal data on Canadian youth from early adolescence to the mid-20s, this study investigated whether the trajectory of alcohol use varied as a function of type of PSE and age at the time of postsecondary enrollment. This is the first Canadian study to examine the longitudinal association between PSE and alcohol use.
The high levels of alcohol use and experiences of alcohol-related harms experienced by postsecondary students internationally are well recognized (Dantzer, Wardle, Fuller, Pampalone, & Steptoe, 2006; Gliksman, Adlaf, Demers, & Newton-Taylor, 2003; Jackson et al., 2005; Karam, Kypri, & Salamoun, 2007). However, the evidence documenting differences in levels of alcohol use between postsecondary students and same-aged peers who do not attend PSE is inconsistent. A review by Carter, Brandon, and Goldman (2010) summarized the findings from all 18 U.S. studies comparing drinking between PSE students and their age-matched peers. Across studies the level of alcohol use among PSE students has been found to be greater than (O’Malley & Johnston, 2002; Slutske et al., 2004), equal to (Chen, Dufour, & Yi, 2004; Gfroerer, Greenblatt, & Wright, 1997; Reifman, Ro, Barnes, & Feng, 2010; White et al., 2006), and less than (Lanza & Collins, 2006; Muthén & Muthén, 2000) nonattending peers. To our knowledge, only one study has been conducted outside the United States. This New Zealand study found that the prevalence of heavy drinking was significantly higher among university students compared to the same age-group in the general population (Kypri et al., 2009).
These mixed findings may reflect the considerable variability within this age-group not yet accounted for in previous studies including the following: (1) heterogeneity in the types of PSE pursued and (2) variability in the age of enrollment in PSE. Identifying how this diversity relates to trajectories of alcohol use will add clarity to the alcohol education literature and help identify whether prevention and intervention efforts need to be tailored to specific types of institutional settings that vary in drinking cultures and student body composition.
Heterogeneity in Educational Pathways
Failure to differentiate among types of PSE has been identified as a specific shortcoming of the alcohol education literature (Carter et al., 2010; Fleming, White, Haggerty, Abbott, & Catalano, 2012). Nearly 50% of Canadian postsecondary students (aged 18–26; Shaienks & Gluszynski, 2007) and 71% of U.S. students (aged 18–24; U.S. Department of Commerce, Census Bureau, 2012) attend a 4-year university. Thirty-three percent of Canadian students and 29% of U.S. student attend a 2-year community college. Approximately 8–10% of Canadian and U.S. students are transfer students who start at a 2-year community college and then transfer to a 4-year university (Association of Canadian Community Colleges, 2011; Cowin, 2013; Fleming et al., 2012; Provasnik & Planty, 2008; Shaienks, Gluszynski, & Bayard, 2008). However, few North American longitudinal studies have distinguished between different types of postsecondary pathways when examining changes in alcohol use (Carter et al., 2010).
Why might heavy drinking differ between young adults who pursue different educational pathways? Individuals who have different preexisting characteristics tend to select different educational paths. For example, research shows that women are more likely than men to attend PSE (Shaienks, Gluszynski, & Bayard, 2008). Students with higher levels of parent education and better high school grades are more likely to enroll in a university than a 2-year college (Shaienks & Gluszynski, 2007; Tomkowicz & Bushnik, 2003). Two-year college students are more likely to live with their parents compared to 4-year students (Paschall, Bersamin, & Flewelling, 2005; Velazquez et al., 2011). Research suggests that the student body composition of 2-year colleges is more diverse in terms of age, ethnicity, and life stage than university campuses (Shaienks & Gluszynski, 2007; Sheffield, Darkes, Del Boca, & Goldman, 2005; Velazquez et al., 2011). Further, transfer students tend to fall “in-between” university students and terminal high school graduates with respect to socioeconomic status (SES) and high school grades and often begin at a 2-year college because of lower tuition fees, smaller class sizes, and a failure to achieve the high school grades required for direct entry into university (Cowin, 2013; Provasnik & Planty, 2008). Thus, drinking may be different across postsecondary institutions because of differences in the characteristics of the students that enroll.
Drinking may also differ across educational settings because of variation in contextual factors, which expose individuals to different environmental experiences. Universities have a more well-defined campus culture than community colleges that provides greater access and more social-based opportunities for student drinking, such as living on campus in student housing, campus bars, and campus sporting events (Borsari & Carey, 2001; Reifman et al., 2010; Sheffield et al., 2005). Differences in drinking between types of education settings would suggest a need to target institution-specific risk factors to reduce drinking and related harms on postsecondary campuses.
Rates of drinking and alcohol-related harms are high among both community college students and university students (Jackson et al., 2005; Sheffield et al., 2005). However, only two studies have actually compared differences in drinking between community college students and university students (Timberlake et al., 2007; Velazquez et al., 2011). Following a sample of 7,082 adolescents (aged 13–24), Timberlake and colleagues (2007) found that 4-year students had the greatest increases in alcohol use and the highest drinking levels during young adulthood compared to 2-year college students, PSE dropouts, and individuals who never enrolled in PSE. In their cross-sectional study of 13,700 students, Velazquez et al. (2011) also found evidence that 4-year students, particularly males, had a higher prevalence of risky drinking compared to 2-year students. However, these differences were no longer significant after controlling for age, ethnicity, relationship status, dependent children, weekly hours worked, and living arrangement. Only one study has examined the trajectory of alcohol use for transfer students in comparison to other educational pathways. Using a community sample of 921 youth aged 15–23, Fleming, White, Haggerty, Abbott, and Catalano (2012) found that, at age 19, the 4-year university students had higher levels of heavy drinking compared to transfer students, but transfer students had significantly greater acceleration in heavy drinking after age 19. Overall, the findings suggest that dichotomizing young adults into “students” and “nonstudents” may conceal important subgroup differences. As a result, little is known about the trajectory of drinking for young adults who do not pursue a degree at a 4-year university. For example, do 2-year college students also experience steep increases in alcohol consumption after enrollment?
The Timing of Postsecondary Enrollment
Both alcohol use and enrollment in PSE are age related. Alcohol use increases most before and when individuals reach the legal drinking age, which coincides with average age of enrollment in PSE (Bozick & DeLuca, 2005; Hango, 2011; Maggs & Schulenburg, 2005; Thompson et al., 2014). However, not all youth enroll in PSE directly out of high school. In Canada, 50% of youth who enrolled in PSE did so within 3 months, 73% within 15 months, and 81% within 28 months (Hango, 2011). Similar rates are reported in studies using recent cohorts in the United Kingdom (Crawford & Cribb, 2012), the United States (Bozick & DeLuca, 2005), and Australia (Curtis, Mlotkowski, & Lumdsen, 2012). Moreover, the average age of enrollment in PSE differs across types of institutions. Findings from Canada and the United States show that students who attend university typically enroll within a few months of high school completion, whereas those attending colleges or other institutions are more likely to delay their enrollment (Bozick & Deluca, 2005; Cowin, 2013). Several U.S. studies have noted that university students are typically 2 to 3 years younger when they enter PSE compared to those attending other institutions (O’Rand, Hamil-Liker, & Elman, 2009; Velazquez et al., 2011).
Research to date has not examined the association between the age of PSE enrollment and alcohol use. However, there are several reasons to expect that those who are older when they enroll may not experience the same acceleration in their alcohol consumption as those who enroll immediately after high school. For instance, family and work commitment may compete with leisure time and alcohol consumption for older students (Bachman, Wadsworth, O’Malley, Johnston, & Schulenberg, 1997). Moreover, older students may have already reached their developmental “peak” in alcohol use (Thompson et al., 2014). Thus, it may be that previous differences in drinking identified between types of postsecondary institutions reflect the characteristics of the students who enroll, such as age of enrollment, rather than contextual differences in the campus environments. If so, institutions may require different strategies to address their students’ vulnerability to alcohol use and related harms. For example, younger students have less drinking experience and as a result may have lower levels of tolerance for intoxication and be more vulnerable to injury, whereas that may be less likely for older students who typically have more drinking experience.
The Current Study
This study extends the current literature in several important ways. First, we distinguish between several different types of educational paths including 2-year community college, 4-year university, and transfer programs, as well as include young adults who do not attend PSE. Second, this is the first study to consider how age of enrollment may relate to trajectories of alcohol use. Third, we extend the predominantly U.S. literature on alcohol use and PSE by using a Canadian sample. Using longitudinal data spanning from adolescence to the mid-20s, this study asked the following questions: (1) Does the trajectory of alcohol use before enrollment in PSE and after enrollment in PSE differ for young adults who enroll in different types of postsecondary institutions (2-year college, 4-year university, or transfer)? (2) Does between-person variability in age at the time of enrollment affect the trajectory of alcohol use and account for differences in alcohol use between educational settings? (3) How do the trajectories of alcohol use for the different types of postsecondary institutions compare with the trajectory of alcohol use for young adults who do not attend PSE?
Given that preexisting individual characteristics such as gender, parent education, high school grades, and living situation predict type of PSE and alcohol use (Bozick & DeLuca, 2005; Hango, 2011; Homel, Thompson, & Leadbeater, 2014; Tomkowicz & Bushnik, 2003), our models included these variables as both control variables and for substantive interest in their own right.
Method
Participants
The Victoria Healthy Youth Survey is a five wave multicohort study of young people aged between 12 and 27. Participants were recruited from a medium-sized Canadian city using random digit dialing of 9,500 private telephone listings. Of the 1,036 eligible households with an adolescent aged 12–18, 662 adolescents (M = 15.52; SD = 1.93; 51% female) agreed to participate (64%). Participants were assessed biennially between 2003 and 2011. Response rates were 87% at Wave 2, 81% at Wave 3, 70% at Wave 4, and 70% at Wave 5. Distribution by age cohort at Wave 1 was as follows: age 12, n = 83 (13%); age 13, n = 90 (14%); age 14, n = 104 (16%); age 15, n = 98 (15%); age 16, n = 104 (16%); age 17, n = 112 (17%); and age 18, n = 71 (11%). The sample was 85% Caucasian, 4% Asian, 4% mixed/biracial, 3% Aboriginal, and 4% other. Nineteen percent of fathers and mothers finished high school only, and 43% of fathers and 49% of mothers completed college or university training. Parents or guardians gave consent whether youth were under 18 and youth consented at each wave. Trained interviewers administered surveys and respondents received a $35 honorarium per interview. The living situation, parental education, and ethnicity reported by participating youth were almost identical to that of the population from which the sample was drawn (Albrecht, Galambos, & Jansson, 2007). The University of Victoria Human Research Ethics Board approved this study (protocol number 09-292).
Our analytic sample was restricted to 521 participants that had data at Waves 4 or 5 when detailed information about PSE was collected and college status could be determined. Seventy-two percent of the sample had five waves of data, 21% had four waves, and 7% had two or three waves. Compared to the 141 youth who had dropped out by Waves 4 or 5, our subsample of 521 participants reported higher grades at Wave 1 (M = 3.11 vs. 2.81), F(1, 657) = 17.01, p = .001 (d = 0.38), and higher levels of maternal education (M = 2.98 vs. 2.56), F(1, 641) = 9.79, p = .002 (d = 0.30). There were no differences in gender, χ2(1, N = 662) = 3.50, p = .06, age at Wave 1, F(1, 660) = 0.14, p = .71, and frequency of heavy episodic drinking (HED) at Wave 1, F(1, 659) = 0.09, p = .77.
Measures
Alcohol use was measured using frequency of HED (Thompson, et al., 2014). 1 Participants were asked to report “How often in the past 12 months have you had five or more drinks on one occasion?” The five possible response categories were as follows: 0 = never, 1 = a few times/year, 2 = a few times per month, 3 = once a week, and 4 = more than once a week.
Educational group
Participants were categorized into four groups. Two-year college (n = 124) included those who had enrolled in a subbaccalaureate program at a 2-year community college. Transfer (n = 88) included youth who reported being in a transfer program. In a transfer program, youth start their degree at a 2-year community college and transfer to a 4-year university to complete their degree. Four-year university (n = 180) included those who enrolled in a 4-year baccalaureate-granting university. Terminal high school graduates (n = 129) included participants who had not enrolled in any PSE by the final wave of the survey. Note that group membership was based on first enrollment rather than program completion, as many participants were still enrolled at the time of their last interview.
Age at the time of enrollment in PSE was calculated based on participants reported date of birth and the year they reported first enrolling in PSE.
Covariates included sex, maternal education, high school grades at Wave 1, and living arrangement at the time of PSE enrollment. Maternal education was a proxy for SES and had a 5-point scale that ranged from less than a high school diploma (=0) to finished college/university (=4). To assess high school grades, participants were asked, “In general, what are your grades right now?” with 5-point response options that ranged from 0 (mostly F’s) to 4 (mostly A’s). To assessment living arrangement, participants were asked to retrospectively provide data about which they were living with at each age. We matched participant’s living situation data to their reported age at the time of enrollment in PSE (and age 19 for the high school group). Living arrangement at the age of enrollment was categorized as “living with parents (0)” or “not living with parents (1).”
Data Preparation
To examine trajectories of alcohol use pre- and post PSE enrollment, we restructured the five waves of data to center the time metric on the event of enrolling in PSE. This allowed us to pinpoint the specific effect of going to PSE on the trajectory of drinking. For those who enrolled in a postsecondary institution by the end of the study (n = 392), zero was coded as the year participants reported enrolling in their first postsecondary institution. In the high school group, zero was age 19, which corresponded to the average age of PSE enrollment for the full sample. Although no single participant provided more than five repeated measures, our 521 participants provided a total of 2,366 observations to estimate a trajectory of alcohol use spanning 17 years (−8 years pre-enrollment to 8 years post-enrollment). However, 210 observations at the earliest and latest time points were dropped from the analysis due to poor model convergence yielding a total of 2,156 observations (N = 521). Eighty-seven percent of the sample (n = 457) had a least one data point pre- and post-enrollment in PSE.
Plan of Analyses
Piecewise latent growth curve models were used to model the trajectory of alcohol use over time (Li, Duncan, Duncan, & Hops, 2001). Slope pre described changes in alcohol use pre-entry into PSE (or pre age 19 for the high school group) and Slope post corresponded with changes in alcohol use post-entry in PSE (or post age 19 for the high school group). The intercept was centered on year of PSE entry (age 19 for the high school group). We used a piecewise approach instead of a growth curve with higher order polynomials because it allowed us to directly test the effect of going to PSE on changes in alcohol use and make comparisons across groups in alcohol use during different time periods of interest.
First, we ran an unconditional growth model (Model 1) to examine the means and variances of the growth factors of alcohol use over time for the whole sample. We then created dummy coding variables for the educational groups, which were regressed on each of the growth parameters to test group differences in the trajectory of alcohol over time (Model 2). Next, we included the covariates (Model 3). Finally, we examined the influence of age at the time of enrollment (Model 4). Model 4 excluded the high school group because they did not have an age of enrollment. Sex by education group interaction effects (Sex × Each Education Dummy) on the growth parameters were also tested, but were not significant and did not improve model fit (Δχ2 = 14.06, Δdf =12, p = .30). Initial models used the university group as the reference group. However, analysis were repeated using the high school group and the college group as reference groups to test contrasts between all different pairs of educational paths.
We used the full information maximum likelihood estimator with robust standard errors (MLR), implemented as MLR in MPlus 7.0 (Muthén & Muthén, 1998–2012). This approach uses data from all available time points for a given case under the assumption that data are missing at random (as would multiple imputation), which allows missingness to be related to variables included in the analyses (Little, 2013). MLR also offers protection against inflated α values as a result of incomplete data, nonnormality, and small sample sizes (Rhemtulla, Brosseau-Liard, & Savalei, 2012; Savalei, 2010). Model fit indices were evaluated by the criteria outlined by Hu and Bentler (1999) comparative fix index [CFI] ≥ .95, Tucker–Lewis Index ≥ .95, and root mean square error of approximation [RMSEA] ≤ .06).
Results
Characteristics of the Education Groups
Thirty-five percent of the sample enrolled in a university, 24% enrolled in a 2-year college, 17% enrolled in a transfer program, and 25% did not attend any type of PSE. Table 1 shows the descriptive characteristics for each educational group. The 2-year college group had a greater proportion of males compared to all other groups. The 4-year university group had the highest grades during high school, followed by the transfer group and 2-year college group. The high school group had the lowest high school grades, as well as the lowest levels of maternal education compared to all other groups. Transfer students were significantly more likely to be living with parents at the time of enrollment compared to the high school group. Finally, significant group differences were found in the average age of enrollment. The university group was the youngest when they enrolled and the college group was the oldest.
Characteristics of the Sample by Educational Pathway.
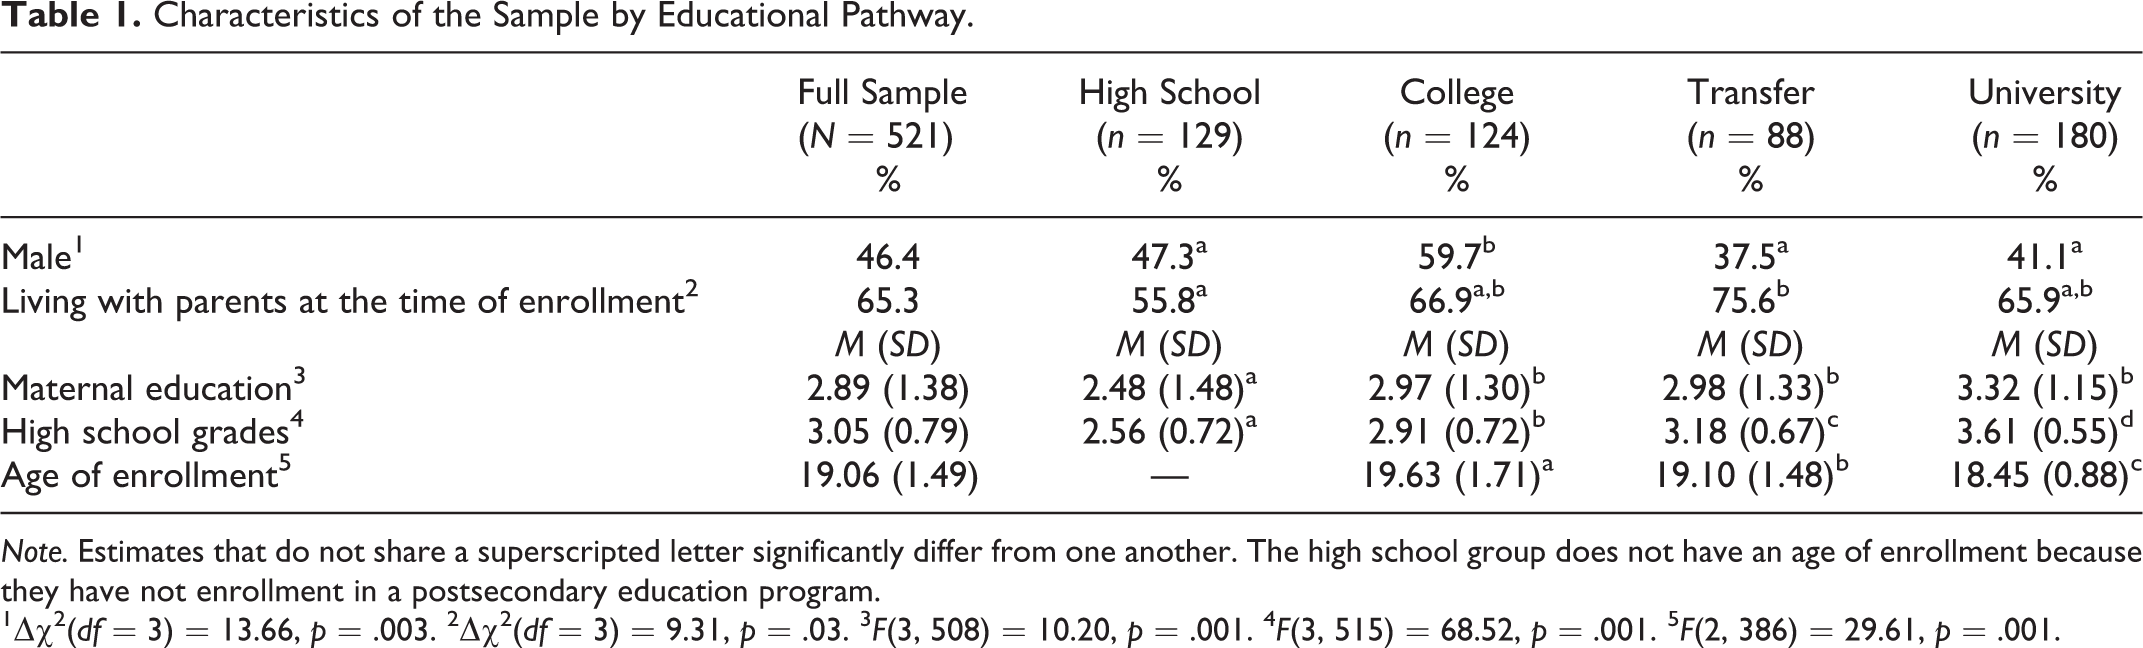
Note. Estimates that do not share a superscripted letter significantly differ from one another. The high school group does not have an age of enrollment because they have not enrollment in a postsecondary education program.
1Δχ2(df = 3) = 13.66, p = .003. 2Δχ2(df = 3) = 9.31, p = .03. 3 F(3, 508) = 10.20, p = .001. 4 F(3, 515) = 68.52, p = .001. 5 F(2, 386) = 29.61, p = .001.
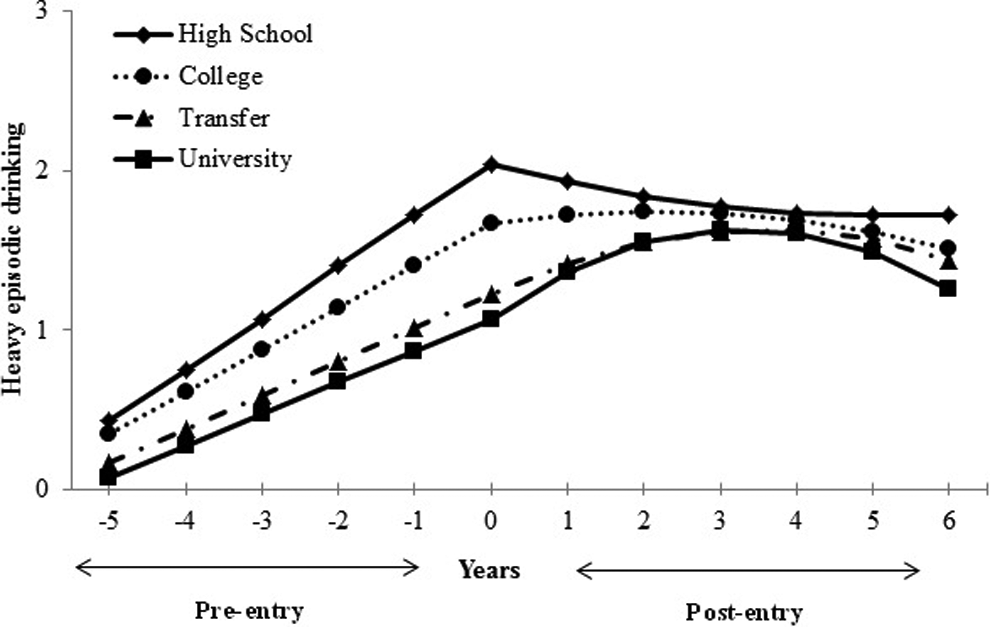
Figure 1 plots the observed means of HED for the total sample and for each education group over time. Group differences in mean levels of heavy drinking were found pre-enrollment, at years: −3, F(3, 173) = 4.72, p = .003; −2, F(3, 199) = 10.27, p = .0001; −1, F(3, 214) = 6.64, p = .0003; 0, F(3, 260) = 8.46, p = .0001. Overall, the high school and 2-year college group had higher mean levels of HED compared to the transfer group and university group. Table 2 shows the correlations among HED and the covariates.
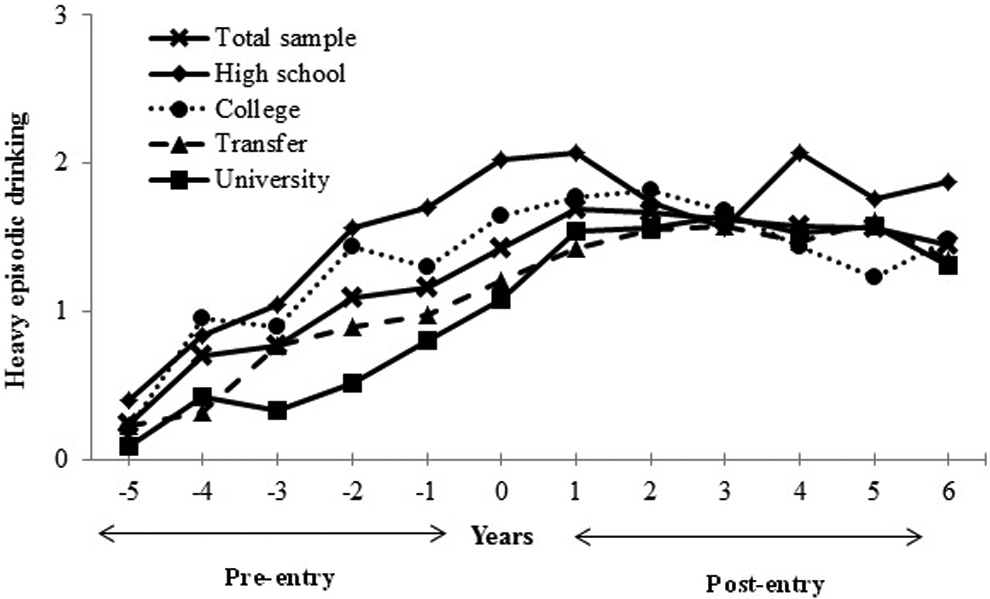
Observed means of heavy drinking for each education group over time (N = 521).
Correlations Between Heavy Episodic Drinking (HED) and Covariates.
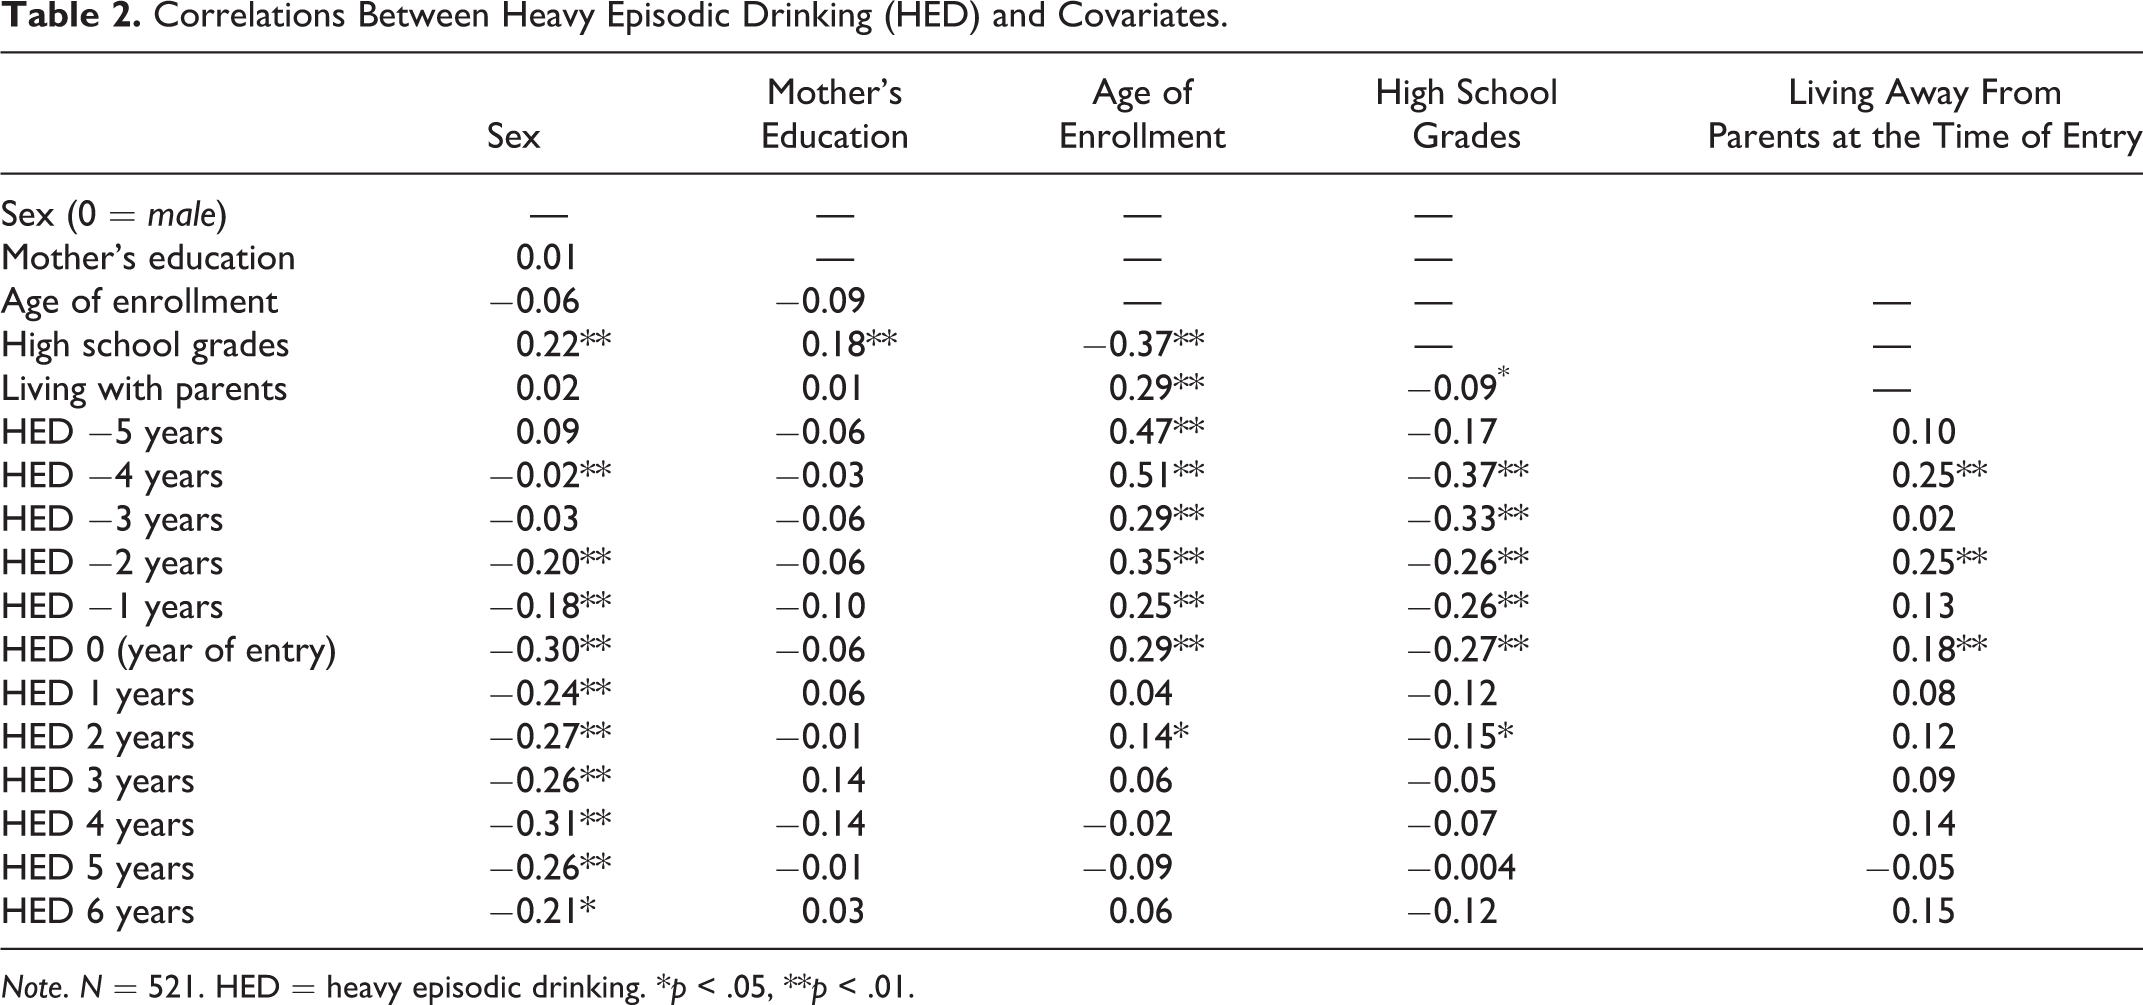
Note. N = 521. HED = heavy episodic drinking. *p < .05, **p < .01.
Group Differences in the Trajectory of Heavy Drinking
For the total sample, the frequency of HED significantly increased prior to PSE enrollment (Slopepre = 2.40, p < .001), increased immediately after PSE enrollment (Slopepost = 1.65, p < .001), peaked approximately 3 years post-enrollment and then significantly declined (quadratic = −2.75, p < .001; Table 3, Model 1). There was also significant between-individual variation in each of the growth factors.
Education Group Differences in Heavy Drinking Over Time.
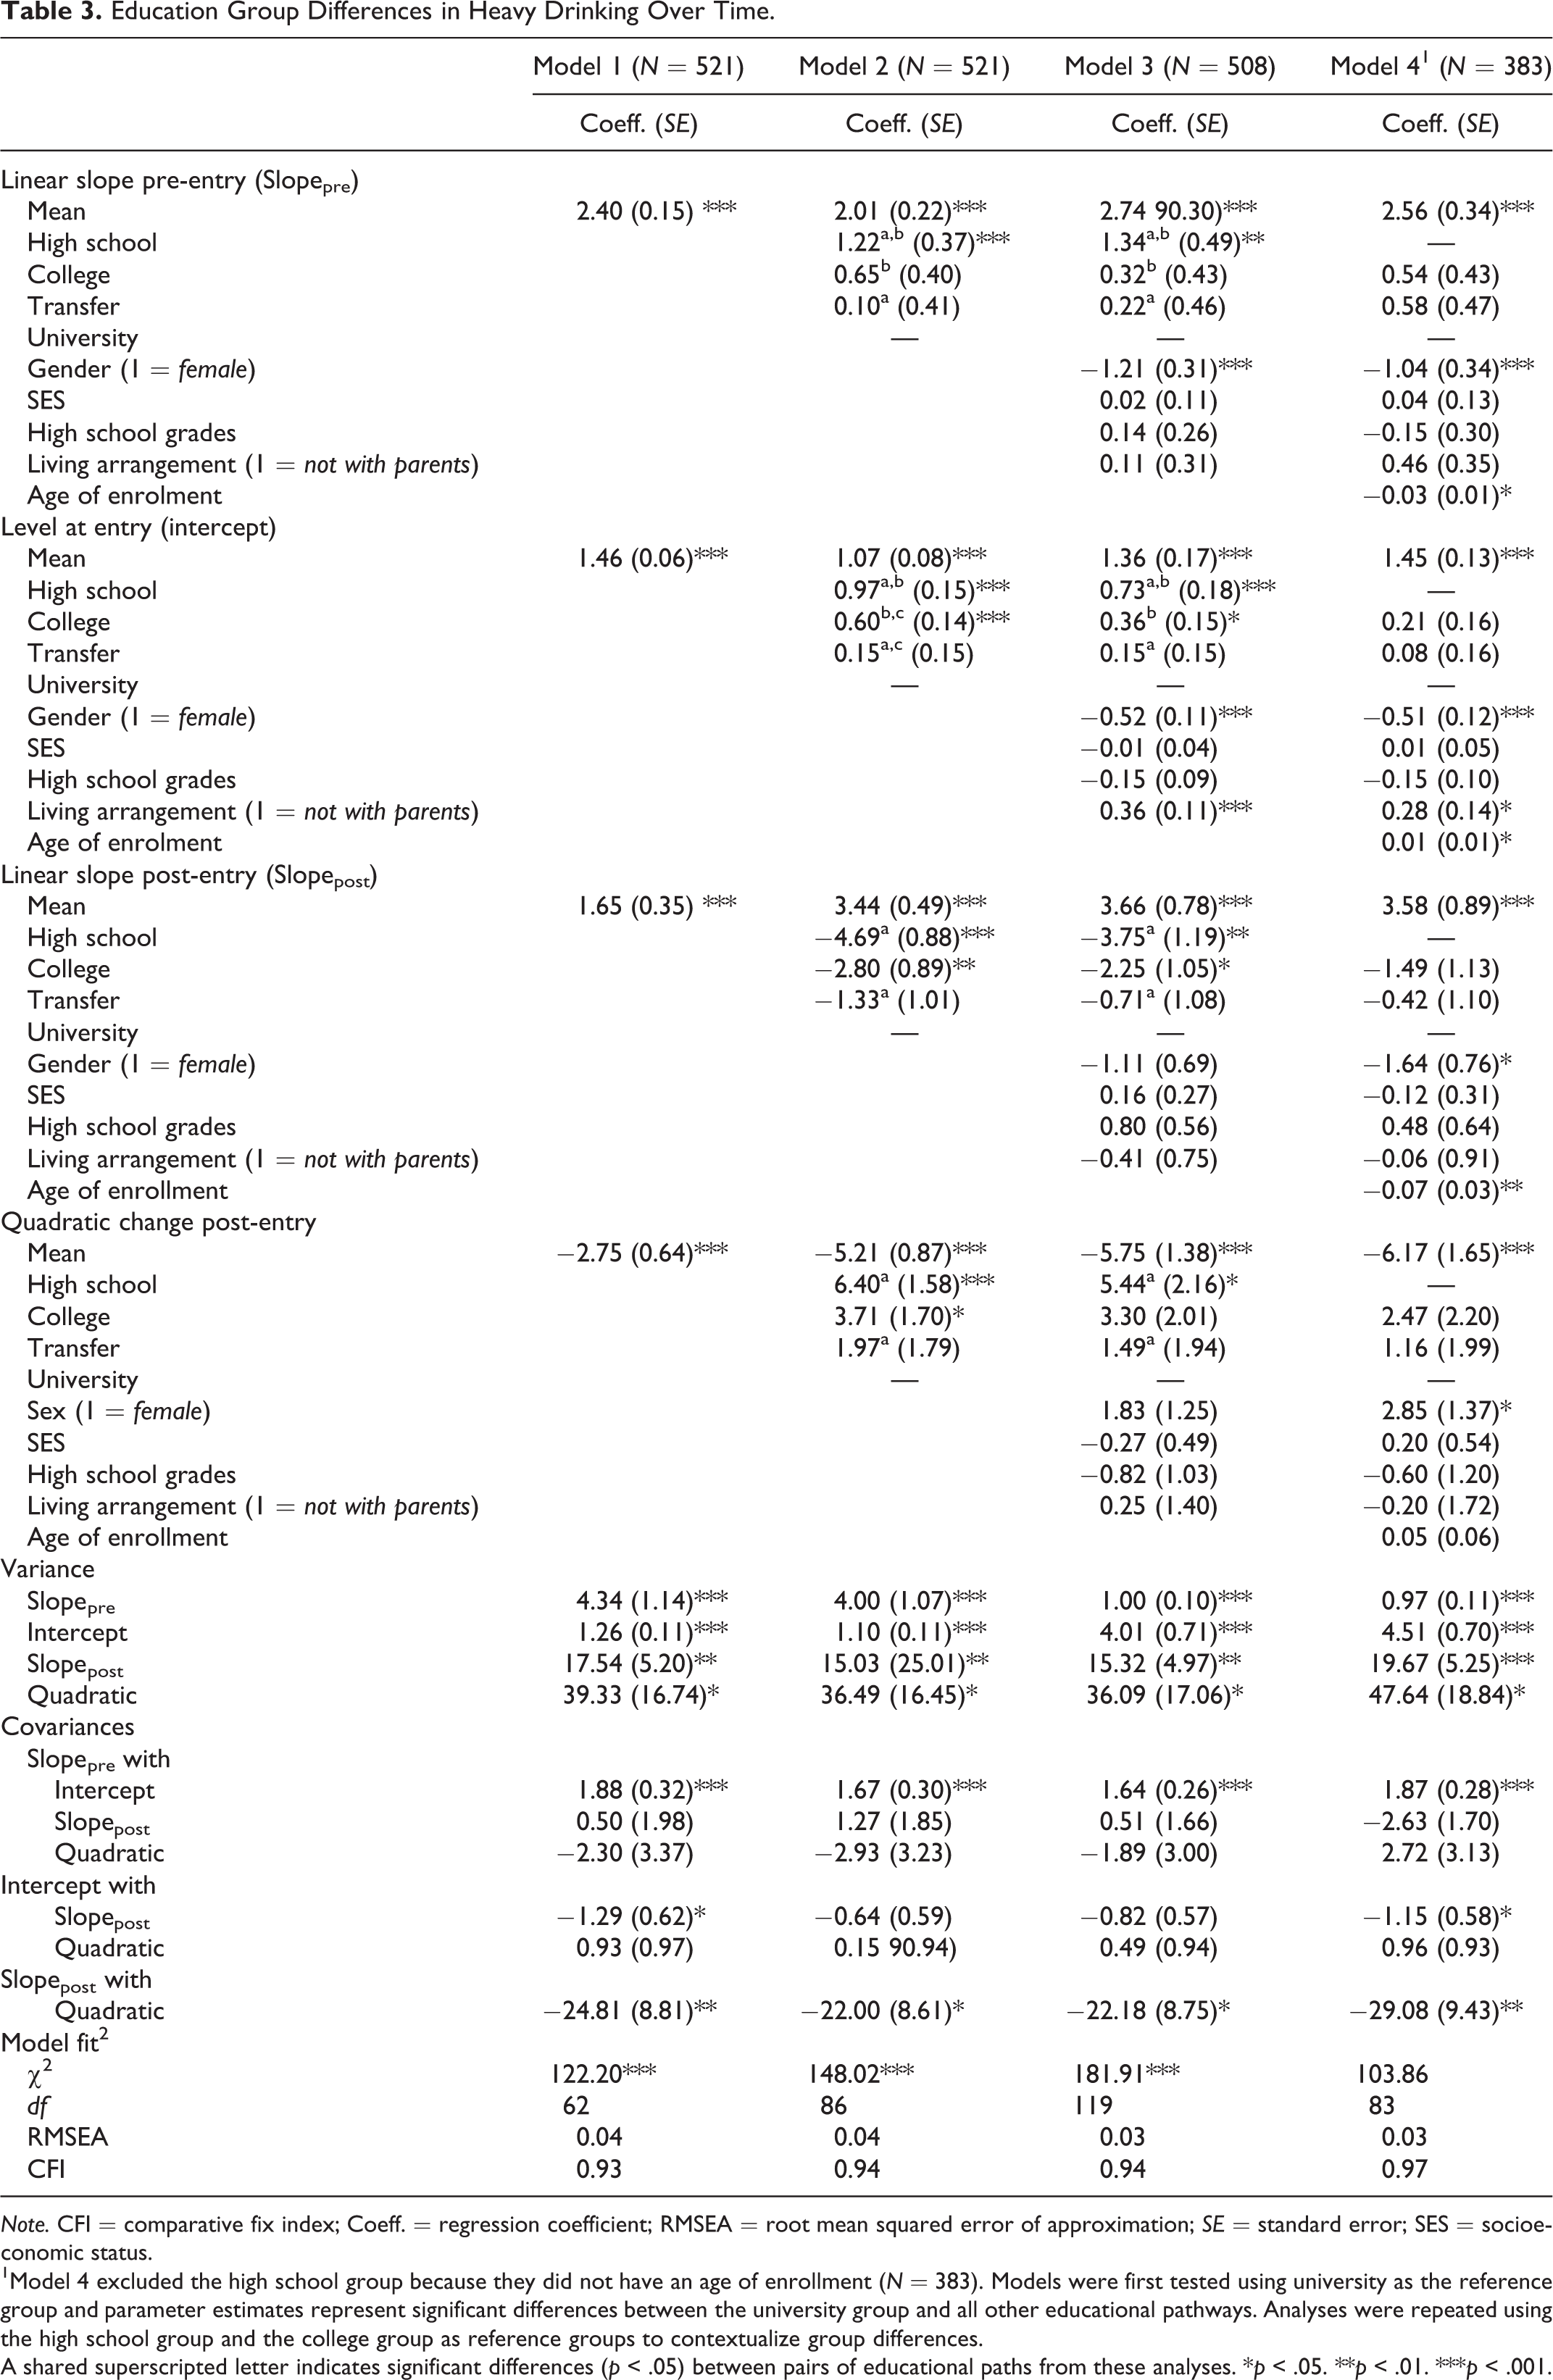
Note. CFI = comparative fix index; Coeff. = regression coefficient; RMSEA = root mean squared error of approximation; SE = standard error; SES = socioeconomic status.
1Model 4 excluded the high school group because they did not have an age of enrollment (N = 383). Models were first tested using university as the reference group and parameter estimates represent significant differences between the university group and all other educational pathways. Analyses were repeated using the high school group and the college group as reference groups to contextualize group differences.
A shared superscripted letter indicates significant differences (p < .05) between pairs of educational paths from these analyses. *p < .05. **p < .01. ***p < .001.
Figure 2 shows the estimated alcohol trajectories for the four educational pathways based on the parameter estimates from Model 2. All four groups significantly increased in the frequency of HED prior to enrollment. After enrollment in PSE, the high school group significantly declined in HED, the 2-year college group stabilized, and the transfer and university group significantly increased in HED.
Estimated piecewise growth trajectories of heavy episodic drinking (HED) for each education group (N = 521).
Model 2 reports on significant differences in HED trajectories among the four groups over time. The high school group had significantly faster increases in HED pre-enrollment (Slopepre) than the three postsecondary groups, but there were no differences in the rate of increase in HED pre-enrollment between college, transfer, and university students. At the time of enrollment (intercept), the high school group had significantly higher levels of HED compared to all three postsecondary groups, and the college group had significantly higher levels of HED compared to the transfer and university students. Post-enrollment (Slopepost), the university group and transfer group had significantly greater increases in HED compared to the college group and the high school group, but did not exceed the drinking levels of the college and high school group at any time. Rather, university and transfer students “catch-up” to the drinking levels of their college and high school group peers and drinking levels converge across groups. However, the university group did have significantly faster deceleration (quadratic) in HED than the college group and high school group approximately 3 years after enrollment. There were no significant differences in any of the growth parameters of HED between the university group and the transfer group.
Model 3 examined the associations between HED and sex, maternal education, high school grades, and living arrangement. There were few main effects of these covariates on the trajectory of heavy drinking. Males had steeper increases in HED pre-enrollment (Slopepre = −1.21, p < .001) and higher levels of HED at the time of enrollment compared to females (intercept = −.52, p < .001). Also, students who were living with their parents during their first year of enrollment in PSE had lower levels of HED at enrollment (Intercept = .36, p < .001). However, after accounting for the effects of these covariates, differences in rates of change and levels of HED among the four groups remained significant. The single exception was that the difference in level of HED (intercept) between the college group and transfer group was no longer significant (p = .07).
Does How Old You Are at the Time of Enrollment Matter?
Model 4 examined the association between age at the time of enrollment and heavy drinking. Youth who were older when they enrolled in PSE had slower increases in heavy drinking prior to enrollment (Slopepre = −.03, p = .02), higher levels of heavy drinking when they enrolled (Intercept = .01, p = .03), and slower increases in heavy drinking following enrollment (Slopepost = −.07, p = .007) compared to younger students. Age of enrollment was not significantly associated with deceleration (quadratic) in HED. After accounting for age of enrollment, differences in the trajectories of HED between the college, transfer, and university groups were no longer significant. As shown in Figure 3, the rate of change and level of HED were the same across college, university, and transfer students over time. Also, Figure 3 showed that HED continued to escalate in a linear way following enrollment, as opposed to the expected acceleration in the trajectory of HED precipitated by the transition into PSE.
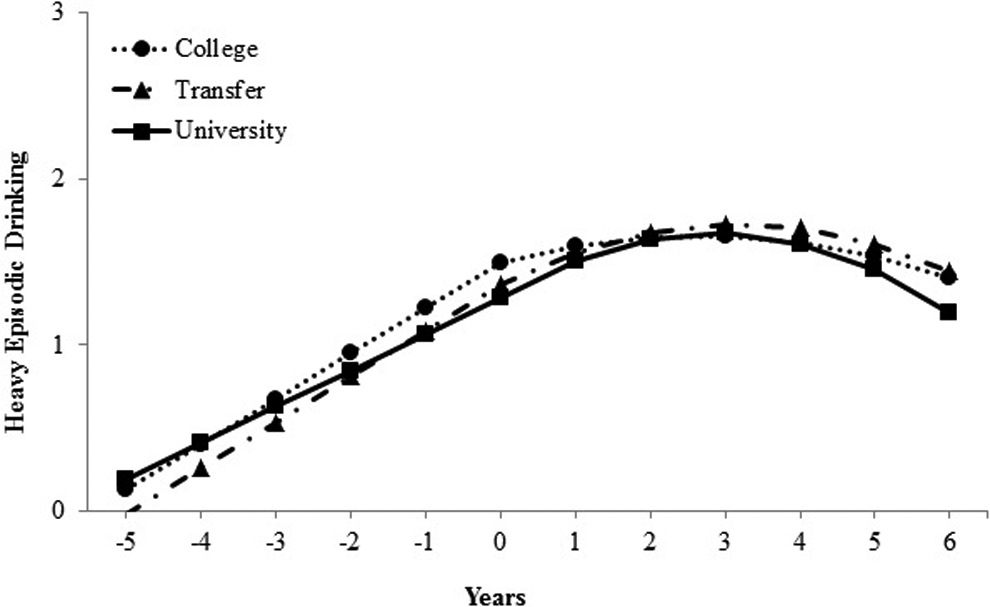
The estimated trajectory of heavy drinking for the college, transfer and university group after accounting for age of enrollment, high school grades, living arrangement, sex, and maternal education (Model 4, N = 383).
Discussion
Few other studies have investigated differences in heavy drinking between types of PSE, and this study is the first to examine how age of enrollment relates to trajectories of alcohol use. This study found that between-person differences in age of enrollment accounted for differences in the trajectories of HED between different types of postsecondary settings. Overall, heavy drinking continued to increase steadily after enrollment in PSE and increased similarly across the different types of postsecondary settings. However, students who enrolled at a younger age had steeper increases in heavy drinking after enrollment than older students. Nevertheless, the terminal high school graduates had the highest and most persistent levels of heavy drinking over time compared to 2-year college students, 4-year university students, and transfer students.
Are There Differences in the Trajectory of HED for Students Attending Different Types of Postsecondary Programs?
Prior to accounting for age of enrollment, there were differences among 2-year college students, 4-year university students, and transfer students in levels of heavy drinking at the time of enrollment, and differences in the rate of growth in heavy drinking after enrollment. Consistent with the few U.S. studies that have examined differences between types of postsecondary settings, 4-year university students had significantly greater increases in HED compared to 2-year college students during the transition to PSE (Paschall et al., 2005; Timberlake et al., 2007). However, the university students never exceeded the drinking levels of the 2-year college students, but rather just “caught-up” to the drinking level of college students approximately 3 years post-enrollment. Importantly however, differences in age at the time of enrollment completely accounted for differences in heavy drinking across the three education groups. Thus, rather than differences in heavy drinking between postsecondary settings reflecting contextual variations across institutions, the current findings suggest that individual differences in the age of students at these institutions may account for institutional variation in drinking patterns. Moreover, the findings provide little evidence that enrollment itself precipitates an increase in heavy drinking. Rather the trajectory of heavy drinking during college appeared to be largely a linear extension of the pattern of drinking established prior to enrollment, consistent with findings from Sher and Rutledge (2007).
In our sample, 2-year college students were on average 1.2 years older than 4-year university students and 0.5 years older than transfer students when they enrolled. Further, 2-year college students had the greatest variability in age of enrollment (range = 17 to 26 years of age). Thus, because 2-year college students tended to be older when they enrolled, they had higher levels of use at the time of enrollment and experienced less of an increase in heavy drinking following enrollment. The apparent “catching up” of 4-year university students drinking levels to their 2-year college peers reflected the younger average age at enrollment of the 4-year university sample. Overall, students who enrolled at a younger age experienced significantly steeper increases in heavy drinking, regardless of the type of PSE they enrolled in.
The effect observed for age of enrollment on alcohol use is largely consistent with the normative age-graded trend in alcohol use that typically peaks in the early 20s and then declines. Students who enter PSE directly out of high school simply have much further to go in their drinking to reach their “peak” than students who have delayed enrollment. Student who are older when they enroll are also more likely to be of legal drinking age and may be balancing other responsibilities, such as employment, marriage and parenthood, that attenuate the effect of enrollment on increases in alcohol use (Bachman et al., 1997, 2002; Oesterle, Hawkins, Hill, & Bailey, 2011). Our findings suggest that the steeper increases in consumption among 4-year students that have previously been noted (O’Malley & Johnston, 2002; Slutske et al., 2004), could reflect the fact that 4-year students are more likely to enroll in PSE at an age when their alcohol use is increasing anyway. However, given that age of enrollment has not been previously examined, more research is needed to confirm this hypothesis.
Given that little previous research has included transfer students, it is interesting to note that even before accounting for age of enrollment there were no differences in trajectories of HED between transfer students and 4-year university students despite that transfer students start out at a 2-year college. This finding is somewhat surprising given the different contextual environments of 2-year and 4-year institutions (i.e., residential housing) theorized to explain group differences (Carter et al., 2010). It may be that there are individual-level similarities between transfer and 4-year university students that outweigh these contextual differences. For example, transfer students and 4-year university students may have similar educational aspirations during adolescence that might explain some of the similarities in their alcohol trajectories over time (Provasnik & Planty, 2008). Overall, the finding suggests that transfer students may be qualitatively different from other 2-year college students and that differentiating between them may be important for understanding links between education and well-being in young adulthood.
Do Postsecondary Students Drink More Than Their Nonstudent Peers?
The three postsecondary groups showed increases in alcohol consumption after enrollment, essentially “catching up” but not surpassing their nonstudent peers. This finding is consistent with several U.S. studies that found the rate of HED of terminal high school graduates to be equal to or higher than postsecondary students (Bingham, Shope, & Tang, 2005; Lanza & Collins, 2006; Reifman et al., 2010). The trajectory of heavy drinking diverged for terminal high school graduates from an early age. This group showed much steeper increases in alcohol consumption across adolescence. Moreover, at the time when most young adults were entering PSE (age 19) and increasing their frequency of heavy drinking, these young adults had reached their peak level of consumption and were starting to reduce their heavy drinking. However, despite this decline, their levels remained higher than all three postsecondary groups over time.
These young adults are quite distinct from those who attend PSE. In our sample, they had the lowest high school grades, the lowest maternal education, and the highest mean levels of alcohol use during adolescence. These earlier risk factors may close off options for pursuing higher education and lead to the early adoption of other adult roles (i.e., full-time employment) that are associated with decreases in alcohol use during young adulthood (Bachman et al., 1997). Given their early startup and persistent heavy drinking over time, this group of young people should be an important target for intervention efforts during the high school years as well as during young adulthood.
Limitations
This study used a random community sample and the ethnic makeup and economic diversity of our participants is consistent with the population sampled (Statistics Canada, 2001). Further, the prevalence of alcohol-related problems and alcohol use are similar to other Canadian studies (Health Canada, 2005). However, cross-cultural variations in macro-contextual factors, such as the legal drinking age and variations in structures of educational systems, need to be kept in mind when considering our findings and their implications. We need more international studies to improve our understanding of the link between alcohol and PSE during the transition to adulthood.
Despite examining dimensions of heterogeneity in educational paths that have received little attention in prior research, we opted not to further subdivide participants on the basis of other dimensions that may also be important (i.e., part-time or full-time status or dropouts vs. completers) due to the small percentage of part-time students and dropouts in each of the education groups. A larger sample size would facilitate examination of how heavy drinking is additionally influenced by these dimensions. Moreover, other factors such as whether students work full-time or part-time while attending PSE or whether they are married or have children could influence the relation between PSE and substance use and should be considered in future studies.
Additionally, many of the participants attended the same schools. Of those who attended a community college, 79% attended the community college in the city from which the sample was drawn. The majority (86%) of transfer students also started at this community college. Further, approximately 58% of the university group attended the same university. Students clustered in the same schools may confound the effects of pursuing different educational paths. There is a danger of attributing, for example, a 2-year community college effect to what may be a local effect. However, the proportion of our sample attending PSE (75%) and the proportion in each education groups were similar to national averages (Shaienks & Gluszynski, 2007). Nonetheless, we encourage further investigation of the relation between educational paths and alcohol use using youth from multiple institutions to improve the generalizability of findings. Also, future research might consider using nested models to account for the nesting of students within schools. Finally, the pairwise contrasts between education groups were determined using a dummy variable approach, rather than a multiple-group approach, because of the small sample size of the education groups. However, we caution that this approach could have resulted in alpha inflation and the findings should be replicated using larger samples.
Implications and Conclusions
It is clear that heavy drinking is not limited to a particular subset of young adults, such as those who go to university. Rather, our concern about heavy drinking and associated problems should be broader, recognizing the potential threat of alcohol misuse to all adolescents and young adults. Thus, community-based policy changes that strengthen enforcement of the legal drinking age, reduce the availability and access to low-cost alcohol, and limit exposure to alcohol marketing may be viable strategies for reducing alcohol use and related harm among this population (Gruenewald, 2011; Paschall, Grube, Thomas, Cannon, & Ryan, 2012). Also, given the strong pattern of continuity in drinking patterns following enrollment in PSE and the greater risk for younger students, interventions aimed at reducing heavy drinking and related harm may be most effective prior to or immediately following enrollment (i.e., during on-campus orientation activities) (Doumas, Kane, Navarro, & Roman, 2011; Sher & Rutledge, 2007).
Additionally, while the current findings show similar increasing trends in alcohol use across types of institutions, the factors associated with these increases may be quite different. For example, whereas increased alcohol use among 4-year university students may relate to living on-campus, this may not be relevant for understanding the drinking patterns of Canadian community college students who are largely nonresidential (Sheffield et al., 2005). Moreover, variability in student body composition, particularly in terms of age, may require that the design and delivery of interventions be sensitive to characteristics of particular subgroups or settings. For example, while campus-wide initiatives may be useful on 4-year university campuses where there is a well-defined campus culture, they may not be applicable to community colleges where students spend less time on campus. Future work is needed to identify the unique individual and contextual factors that predict increases in alcohol use across subgroups of young adults and to identify optimal implementation strategies for delivery of interventions in different environmental contexts (i.e., college vs. university).
Conclusions
This is the first Canadian study to examine the longitudinal associations between PSE and alcohol use. The current findings suggest that the effect of PSE on increases in heavy drinking is largely contingent on the age of young adults at the time of enrollment, rather than the type of postsecondary setting they enroll in. However, the increase in heavy drinking following enrollment is still of concern. Steep increases in heavy drinking, particularly among younger students, may make it more likely that young people will experience injuries as a result of their drinking given their low levels of tolerance to high levels of intoxication. This study highlights the importance of age of enrollment on increases in drinking among students and it will be important for future research to consider how the timing of enrollment fits in with the larger social influences of attending PSE. Finally, we must not forget that terminal high school graduates appear to be the worst off given their high rates of early and persistent heavy drinking. We need to better understand how to engage with these young adults about alcohol use after they leave high school.
Footnotes
Declaration of Conflicting Interests
The authors declared no potential conflicts of interest with respect to the research, authorship, and/or publication of this article.
Funding
The authors disclosed receipt of the following financial support for the research, authorship, and/or publication of this article: This research was supported by grants (#838-20000-075, and #93533 to B. Leadbeater, PhD, #79917 to T. Stockwell, PhD, and #104612 to K. Thompson, PhD) from the Canadian Institutes for Health Research.