
Abstract
Recent research reveals that some variability in personality differences can be explained by contextual factors such as location. Although little research has systematically evaluated how such variables predict individual differences in Emerging Adulthood, Fosse and Toyokawa (2016) revealed that characteristics of one’s university such as selectivity and liberal arts classification did predict respondents’ perceived importance and attainment of milestones associated with adulthood. As a close replication of Fosse and Toyokawa (2016), the present findings supported our preregistered hypotheses that liberal arts status predicted decreased perceived importance and lower attainment of some constructs of markers of adulthood but did not support predictions that selectivity would also predict such differences. Our findings provide further evidence of the institutional effects that emerge in multisample individual difference studies and extend those findings with a broader and more diverse sample than was considered previously.
Keywords
The transition to adulthood, not just in legal terms but also central to self-concept, has been termed Emerging Adulthood (EA). Individuals experience this transition through uneven and continuous achievement of various markers of adulthood (MoA), instead of passing discrete milestones (Arnett, 1997, 2000). We examine whether differences in the importance and achievement of these MoA exist when comparing currently enrolled college students from different institutions. We further assess which EA markers may be related to institutional selectivity (proportion of rejected applicants) and institutional type (liberal arts vs. not), replicating findings of Fosse and Toyokawa (2016).
EA, typically defined as a phase of development between the ages of 18 and 25, coincides with the traditional age range of college attendance. Although higher education is commonly characterized as an “equalizer” in regard to social and professional mobility, research suggests differences in the transition to adulthood are associated with institutional contexts of selectivity and liberal arts status. For instance, Fosse and Toyokawa (2016) found that institutional selectivity (proportion of rejected students) and liberal arts status predicted differences in how students conceptualized the transition to adulthood, and our work investigates these hypotheses further.
Overview of Fosse and Toyokawa
Fosse and Toyokawa (2016) tested whether higher education context predicted differences in level of endorsement and attainment of different EA constructs. Framing their approach using Bourdieu’s cultural capital theory (Lamont & Lareau, 1988), Fosse and Toyokawa (2016) ascribed increased “institutional selectivity as a type of ‘horizontal stratification’ that differentiates individuals with the same level (i.e., ‘vertical stratification’) of educational achievement” (p. 143). Vertical stratification reflects individual-level status variables (e.g., education: highest degree earned or years completed), whereas horizontal stratification reflects the system-level differences of educational quality (e.g., education: selectivity or liberal arts status). As Gerber and Cheung (2008) note, horizontal stratification in educational quality could be affected by gender, race, and socioeconomic status with potentially large impacts on postgraduate earnings and occupational attainment. Horizontal stratification could influence perceptions that highly selective universities are “reproducing privilege” (Edsall, 2012) and perpetuating class inequities (Freedman, 2013) if students at selective universities are more economically advantaged. Institutional selectivity represents one form of educational horizontal stratification, and therefore, selectivity might be associated with markers of EA.
Liberal arts status may reflect a unique form of horizontal stratification distinct from selectivity. While liberal arts–focused schools vary in their acceptance rates, they do tend to value certain types of knowledge and basic study over trades and professional training. A 4-year curriculum that emphasizes humanities, arts, social, and natural sciences (i.e., the liberal arts) is purported to expose students to a broader range of educational best practices irrespective of precollege characteristics (e.g., academic ability or motivation) and to provide a better education compared to applied and professional programs (Pascarella, Cruce, Wolniak, & Blaich, 2004). Yet actual benefits are debated (Bennett & Wilezol, 2013; Zakaria, 2015) because graduates are not trained to go into specific careers. Regardless, liberal arts status may reflect differences at the institutional level in how concepts related to adulthood are valued. Fosse and Toyokawa (2016) found perceived importance and reported attainment of EA milestones to vary between institutions; they predicted this result as institutional selectivity and liberal arts status as two institutional characteristics that might contribute to students’ shared social identity. Fosse and Toyokawa focused on respondents’ endorsement of importance and attainment of 20 MoA items and their responses to the Inventory of the Dimensions of Emerging Adulthood 1 (IDEA; Reifman, Arnett, & Colwell, 2007).
Dimensions of MoA
Fosse and Toyokawa (2016) reduced 20 of the MoA identified by Arnett (1994, 1997) into 4 theoretically derived dimensions (role transitions, norm compliance, relational maturity, and independence) following previous work (Badger, Nelson, & Barry, 2006; Nelson et al., 2007; also see Fosse, Grahe, & Reifman, 2016). Because Faas et al. (2018) examine the psychometric properties of these items, and because our question is confirmatory rather than exploratory, we employed the constructs used by Fosse and Toyokawa (2016). However, the explicit items included in each dimension are described in the Materials section, and conceptual descriptions are provided here. Role transitions include items traditionally associated with signifying adulthood (Arnett, 1997) such as no longer living with parents. Norm compliance, identified by Nelson et al. (2007) using exploratory factor analysis (EFA), includes items that reflect avoiding risky behaviors. Relational maturity, identified by Badger, Nelson, and Barry (2006) using EFA, includes items related to how individuals interacted with family and other individuals. Fosse, Grahe, and Reifman (2016) labeled the final construct independence to reflect various items describing an individual’s self-reliance such as becoming financially independent.
In addition to demonstrating small interinstitutional differences, Fosse and Toyokawa (2016) found, after controlling for respondents’ biological sex and age, individuals at more selective institutions and liberal arts institutions reported less perceived importance and reduced likelihood of achieving norm compliance and relational maturity. Furthermore, individuals at more selective institutions also reported lower attainment of norm compliance but slightly higher attainment of relational maturity. These findings regarding institutional variability across many EA dimensions for individuals at selective and liberal arts institutions should receive further replication.
Institutional Context and Individual Differences
The present research helps address the call by Arnett (2016) for more studies that examine EA across diverse sample types to determine possible contextual predictors of EA such as geographical location or cultural differences. Although research into regional or institutional variation in EA characteristics specifically is limited, research implies that geographical regional variation (Jokela, Bleidorn, Lamb, Gosling, & Rentfrow, 2015; Rentfrow, Gosling, & Potter, 2008) and institutional characteristics (Corker, Donnellan, Kim, Schwartz, & Zamboanga, 2017) may explain variability in personality domains. Theoretical justification for location or institutional impacts on psychological constructs emerges from migration and socialization processes. Rentfrow, Gosling, and Potter (2008) argued that initial clusters of personality are due to migration of people into settlements causing founders’ effects (genetic and/or social) and establishing local norms that perpetuate. More recently, using data from the multisite MUSIC collaboration (Weisskirch et al., 2013), Corker, Donnellan, Kim, Schwartz, and Zamboanga (2017) demonstrated evidence for small differences in five-factor model personality characteristics in postsecondary students based on school features and geographical locations. Corker et al. (2017) suggested four central influences that may contribute to the interinstitutional variance: attraction, attrition, selection, and socialization. Attraction and attrition are the processes by which individuals choose and remain in environments, situations, and roles that favor their personality traits (Roberts, Wood, & Caspi, 2008). By contrast, selection reflects processes in which others choose individuals based on traits (Donnellan, Hill, & Roberts, 2015). Each of these mechanisms may act as high school students decide on universities they wish to attend and those institutions make admission decisions. After admission, institutional values and environments may shift individuals’ attitudes and behaviors, a process referred to as socialization (Looft, 1973).
To the degree that these four processes work together to produce personality differences at different institutions across the United States, they may also be associated with institutional clustering of other aspects of EA. Although prior research focused on personality traits, these mechanisms might influence how respondents conceptualize EA. Because potential associations between institutional characteristics and individual differences are otherwise understudied (Arnett, 2016), the present study offers a basic test replicating the only known previous study on this issue (Fosse & Toyokawa, 2016).
Emerging Adulthood Measured at Multiple Institutions 2 (EAMMi2): The Next Generation
The original EAMMI project (Grahe, Walker, Reifman, & Oleson, 2016) invited research methods instructors to collaboratively administer a survey. Instructors and their students administered this survey in Fall 2004 yielding 1,353 respondents from 10 institutions and resulting in 9 research reports (special issue, EA; Reifman & Grahe, 2016).
EAMMi2 (Grahe et al., 2016) replicated and extended EAMMI with only minor differences from the original. Once again, organizers invited contributors to administer a common survey either as a pedagogical activity or an independent research project (see Grahe et al., 2016, for details about measures, sampling, and procedures). Because the survey included the MoA and sampled from many institutions, it provided opportunity to replicate and extend the findings derived from the original EAMMI (Fosse & Toyokawa, 2016). Although theoretically driven, their findings were also exploratory, and an independent sample provides a prudent follow-up test. Their analysis relied on data collected in 2004 and replicating their findings with data from 2016 provides some evidence that effects are not isolated to a specific historical time frame. Following calls for replication in the field of psychology (e.g., Francis, 2012; Ioannidis, 2012; Makel, Plucker, & Hegarty, 2012; Nosek, 2012), we conducted a close replication of prior work to provide better estimates of the generalizability of this published effect.
Explicit Statement of Hypotheses
This study reports on five preregistered hypotheses to address the question of whether institutional variation in selectivity and liberal art status predict EA behaviors and beliefs.
Hypotheses 1 and 2 predict that students who attend more selective institutions (1) and students who attend liberal arts institutions (2) will report lower levels of importance for norm compliance and relational maturity.
Hypotheses 3 and 4 predict that students who attend more selective institutions (3) and students who attend liberal arts institutions (4) will report lower levels of attainment for norm compliance and relational maturity.
Hypothesis 5 predicts that effect sizes for associations between selectivity and liberal arts status with norm compliance and relational maturity importance and attainment will be larger than associations for selectivity and liberal arts status predicting role transitions and independence.
Method
Participants and Primary Data Cleaning
EAMMi2 included two phases of recruiting: first research contributors, then participants. Recruiting of contributors primarily occurred through public announcements in psychology-related professional organizations. Recruitment of participants most often occurred through an institutional participant pool and direct e-mail. For greater detail, see the EAMMi2 Development and Recruitment Plan, available on OSF (https://osf.io/5pdvy/). The project first received institutional review board’s (IRB) approval from Pacific Lutheran University. Contributors received sample specific links to the EAMMi2 Qualtrics survey after achieving local IRB approval (IRB documents: https://osf.io/teb9n/).
Figure 1 displays how we arrived at our final sample for analysis. Collaborators from 32 institutions 2 recruited 4,220 respondents to start the survey. The EAMMi2 Analytic Advisory Team members conducted preliminary data cleaning, removing respondents who failed to meet preregistered criteria: (a) completed survey in less than 10 min (N under10 min = 610), (b) failed the attention check (N failattention = 195), (c) completed less than 80% of the survey (N under80% = 258), and (d) demonstrated response bias by having identical answers on at least eight survey pages (N responseBias = 4). This yielded a combined data set for all project contributors to access (N = 3,153). Further investigation revealed an additional 19 cases that were believed to be repeat participants (i.e., identical demographics, very similar answers on open-ended questions). Although we did not preregister a plan to exclude these individuals, it seemed best to do so. This decision rendered N = 3,134 cases for analysis.
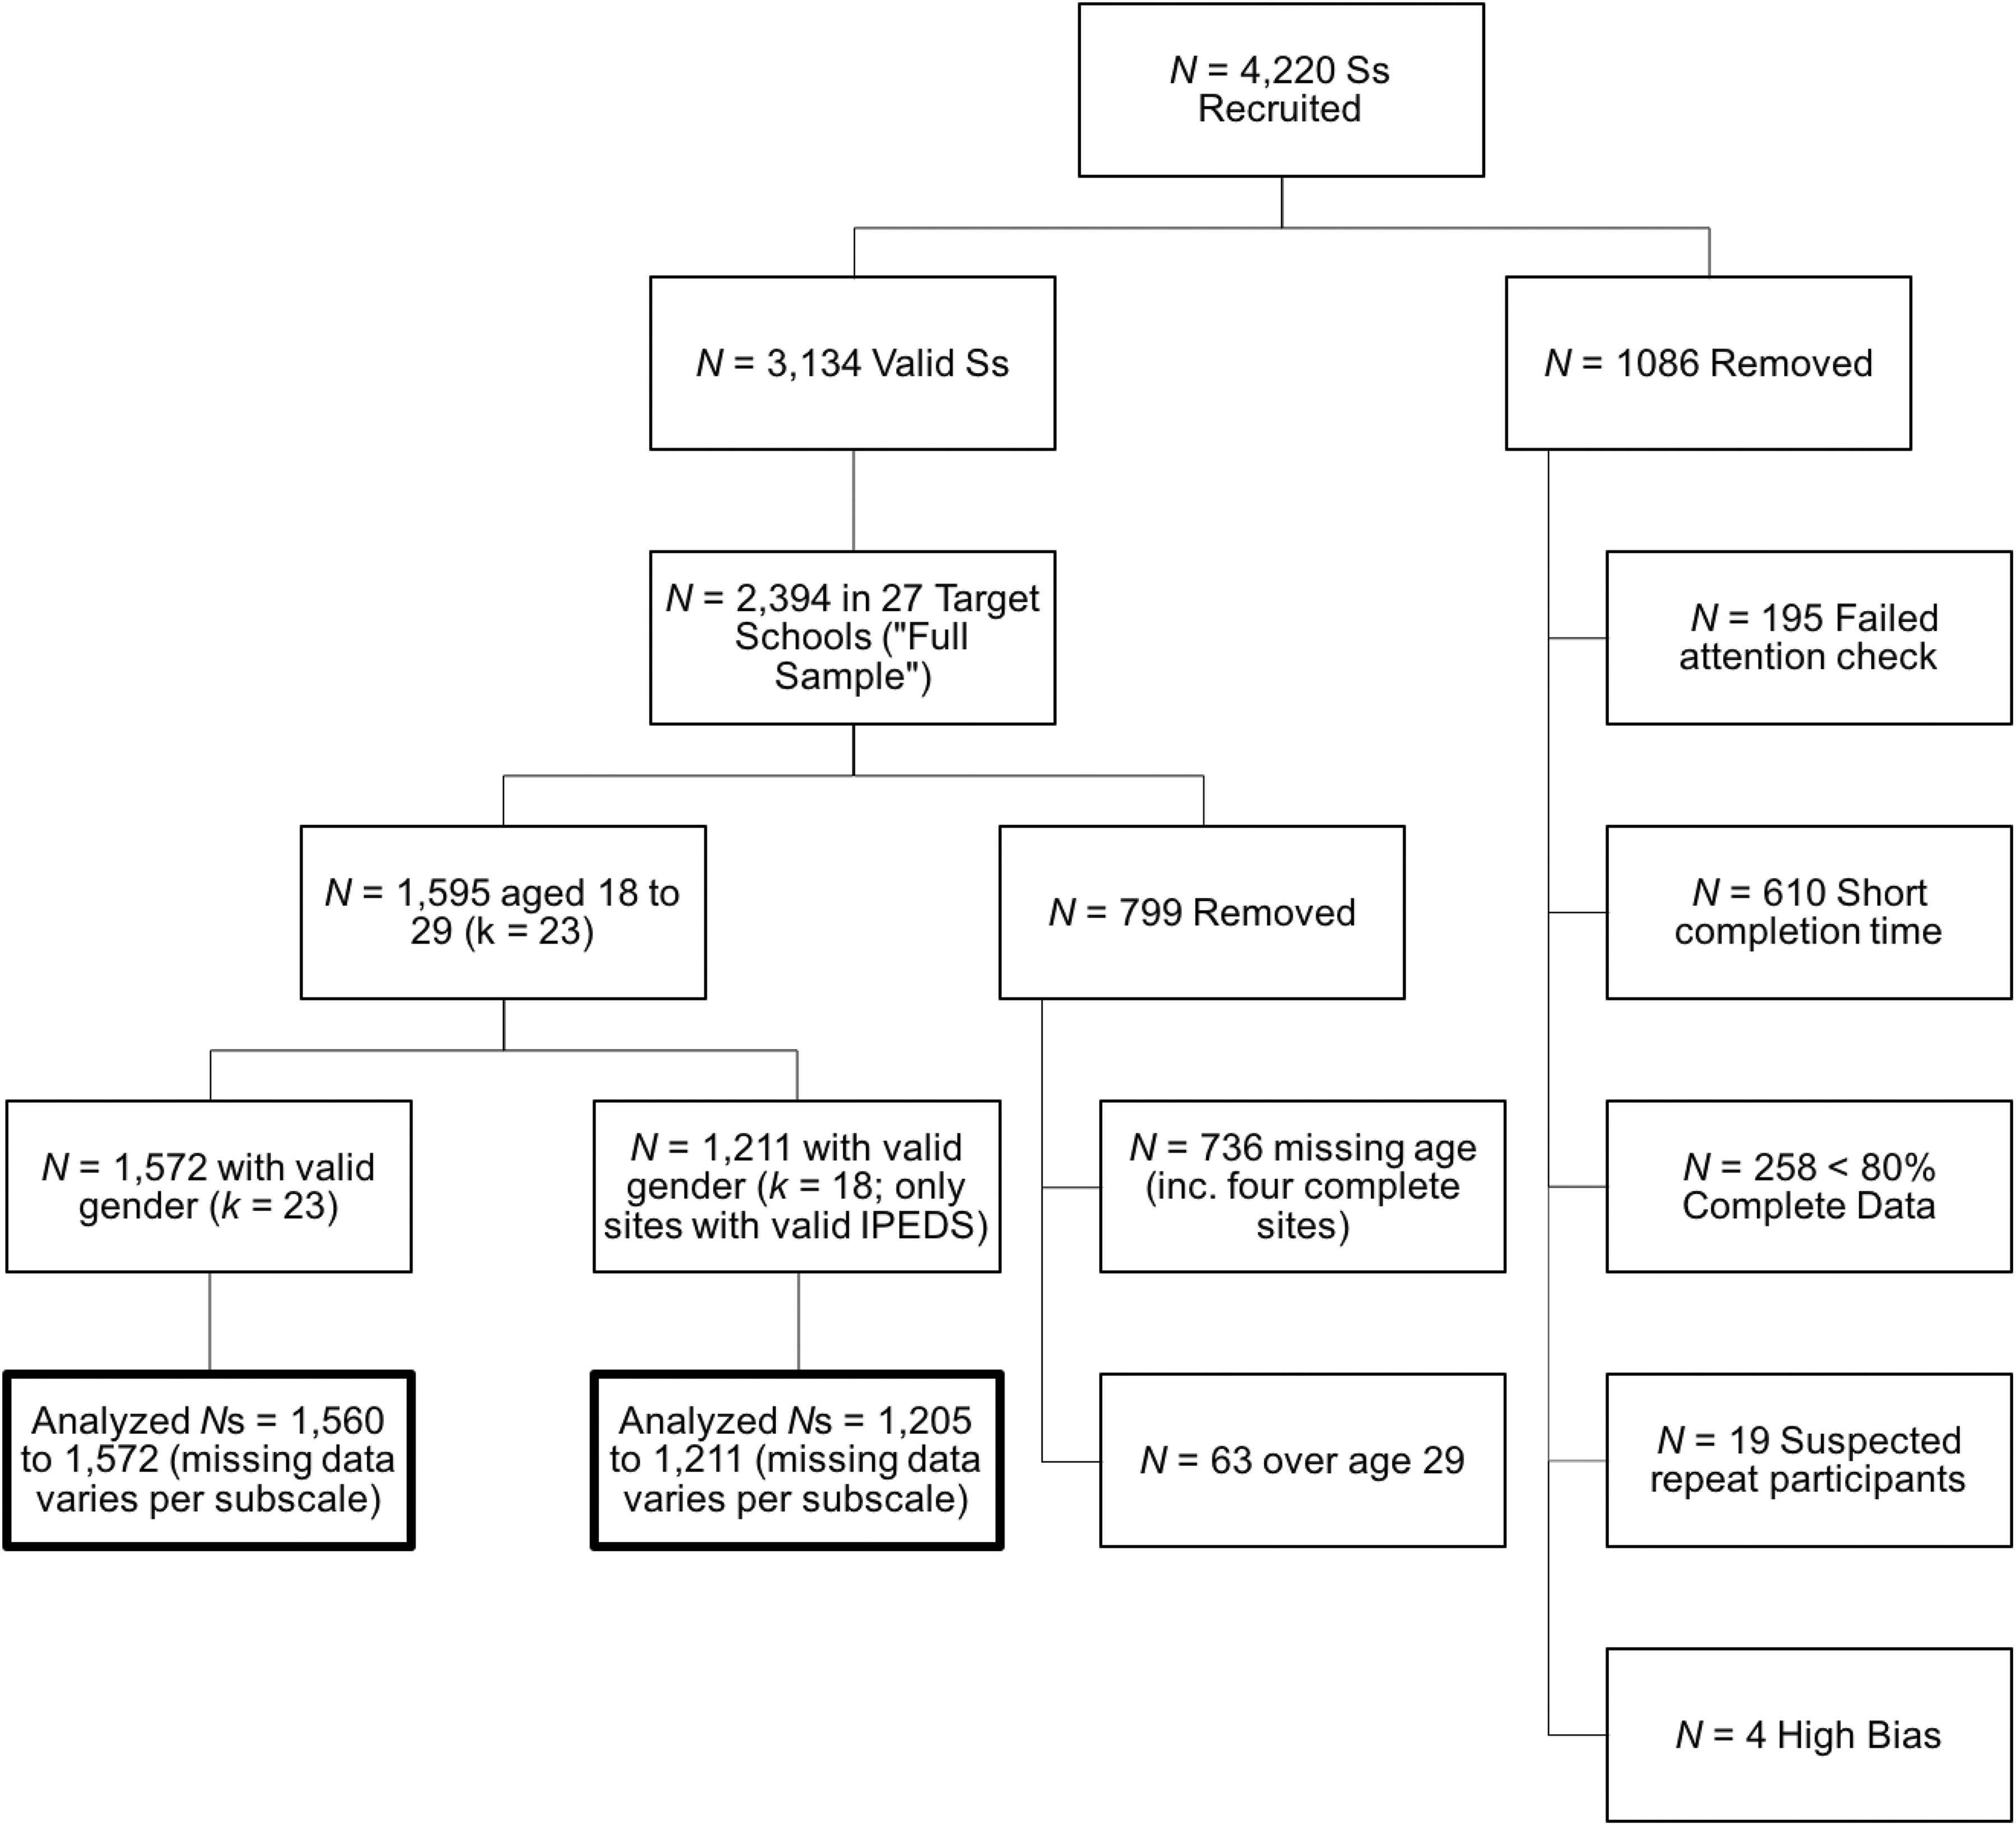
Data exclusions leading to full sample, demographic subsample, and Integrated Postsecondary Education Data System subsample.
Our research question required respondents to meet additional conditions to be included in our analyses, so we removed respondents following our study specific preregistered criteria. Of 3,134 individuals with valid data, 2,394 were students in one of the 27 U.S. colleges and universities that collected data from their own students. Of these participants, N = 63 were over age 29 and another N = 736 were missing age data (n.b., this excluded four schools from all analyses because they had missing age data for all of their participants). Of the remaining 1,595 participants, 1,572 also reported their gender. Finally, of the remaining (k = 23) colleges and universities, five schools had “open admissions” policies and were not required to report the number of applications they received and how many students they admitted as part of the Integrated Postsecondary Education Data System (IPEDS) database. This was unanticipated when we preregistered our analysis plan. We decided (independent of knowing the effect on the results) that for these five schools, we would code selectivity as 0 (least selective). Results for analyses excluding participants from these five schools are included in the Online Supplemental Tables as a robustness test.
We present analyses on the N = 1,572 students from 23 campuses (“demographic subsample”), and, where possible, we also added analyses from the N = 2,394 students from 27 campuses (“full sample”) in tables. A final subset (“IPEDS subsample”) consisted of N = 1,211 students from 18 campuses with IPEDS selectivity data (presented as Online Supplemental Tables). Analysis sample sizes varied slightly from subscale to subscale due to occasional missing data (see Figure 1).
Within this demographic subsample (N = 1572), there were 74.8% women (N women = 1,176, N men = 396) with an age range between 18 and 29 (M age = 19.91, SD = 2.06). Although the sample primarily comprises White/European American respondents (60.1%), many other ethnic/racial groups and participants reporting more than one category are represented (7.0% Black/African American, 11.6% Hispanic/Latino/Latina, 7.8% Asian/Pacific Islander, 0.5% Native American/Pacific Islander, 1.9% selected “Other,” two categories: 9.7%, and three or more: 1.5%).
Materials
For a list of measured variables on the EAMMi2 and the complete survey, see the preregistration of the full project (https://osf.io/yd4jx/) that occurred in July 2016. For the present study, we used only a limited set of these variables to test hypotheses including both sample and respondent characteristics as well as the MoA measure.
MoA
We measured 20 items associated with becoming an adult derived from Arnett (1997, 2000). Respondents reported both how important the items are to achieving adulthood on a 4-point scale (1 = not at all, 4 = very important) and the degree to which they had achieved that marker on a 3-point scale (1 = not at all, 2 = somewhat; 3, yes) for the four constructs identified by Fosse and Toyokawa (2016): role transition, normative compliance, relational maturity, and independence. For the scoring of achievement, we coded “achievement” as 1 and “not achieved” as 0. Partial achievement (“somewhat”) was coded as “not achieved,” consistent with Fosse and Toyokawa.
College and university characteristics
We retrieved data regarding institutional selectivity and liberal arts status from the National Center of Educational Statistics’ IPEDS from the most recent year of collection at the onset of data analysis (2014; https://nces.ed.gov/ipeds/datacenter/DataFiles.aspx). The following operational definitions represented each institution-level variable.
Selectivity = [1 – (So
/Sa
)] where Sa
was the total number of students who applied in 2014, and So
was the total number of students offered admission in 2014 regardless of decision to attend. For this variable, higher scores reflect more selectivity (fewer admissions offered). To ease interpretation of multilevel regression coefficients, scores on this variable were rescaled by dividing by 10. Unstandardized regression coefficients are therefore interpretable as a b unit change for every 10% change in selectivity. This variable was also grand-mean centered prior to analysis.
Liberal Arts (LA) Status—using CCIE2015 variable and label (CC2000, Carnegie Classification), we contrast coded the data (+0.5 = Baccalaureate Colleges, liberal arts, −0.5 = all other values). The Carnegie Classification website defines these as follows: “Baccalaureate Colleges—Liberal Arts:
3
These institutions are primarily undergraduate colleges with major emphasis on baccalaureate programs. During the period studied, they awarded at least half of their baccalaureate degrees in liberal arts fields….” (http://carnegieclassifications.iu.edu/downloads/2000_edition_data.xls)
The association between selectivity and liberal arts status (r = .11 for the k = 18 IPEDS subsample and r =.34 for the k = 23 demographic subsample) suggested modest overlap, with much distinction between these variables.
Participant characteristics
Analyses included age and gender as control variables. Participants recorded responses for each, which were coded as follows: age reported as continuous variable (grand-mean centered prior to analyses), and gender was coded such that men = 0.5 and women = −0.5.
Procedure
Contributors recruited respondents through e-mail invitation, by signing up through institutional participant pools, or snowball sampling via e-mail and social media invitations. Respondents completed the survey online, most frequently choosing their own setting without investigator presence. The survey took approximately 30 min to complete. Most respondents (N = 4,064) who completed the survey optionally qualified for a survey raffle (one US$25 gift card awarded per 50 responses). Remaining respondents received research credit or extra credit at their local institutions.
Results
Analysis Plan
Our analysis plan was preregistered (https://osf.io/wxkyj/) and any deviations are explicitly noted when presented. Hypotheses 1–4 each required correlation estimates after controlling for both the institution and individual variables. To accomplish this, we conducted a series of nested multilevel models using the R statistics program (R Core Team, 2016). A record of scripts used to compile the data and compute the results along with specific version information for R packages (version 3.3.2) is available in our analyses and results component (https://osf.io/egmm2/).
First, we fit a “null” model (Model 0), containing no predictors and not accounting for the colleges and universities that participants attended. Next, we added a random intercept for campus to the model (Model 1). This model allowed us to examine the magnitude of between-campus variability in the MoA subscales, including four importance subscales and four achievement subscales. Next, we added fixed effects for our planned demographic control variables (gender and age) to the model (Model 2). 4 Finally, we added the hypothesized campus-level predictors of liberal arts status and selectivity (Model 3). The main hypotheses were tested using estimates from Model 3.
To help conceptualize the samples and data, Table 1 provides details and descriptive statistics for each of the variables in the study for each of the samples. Table 2 contains the various model fit statistics and nested model comparisons for the demographic subsample necessary to consider the hypotheses. For comparison’s sake, similar analyses are reported for the IPEDS subsample in Online Supplemental Material (https://osf.io/egmm2/; “EAMMi2_IPEDSubsampleTables.docx”). Before considering the hypotheses directly, we first measured the magnitude of variability between locations.
Descriptive Statistics of Markers of Adulthood Constructs by Sample.
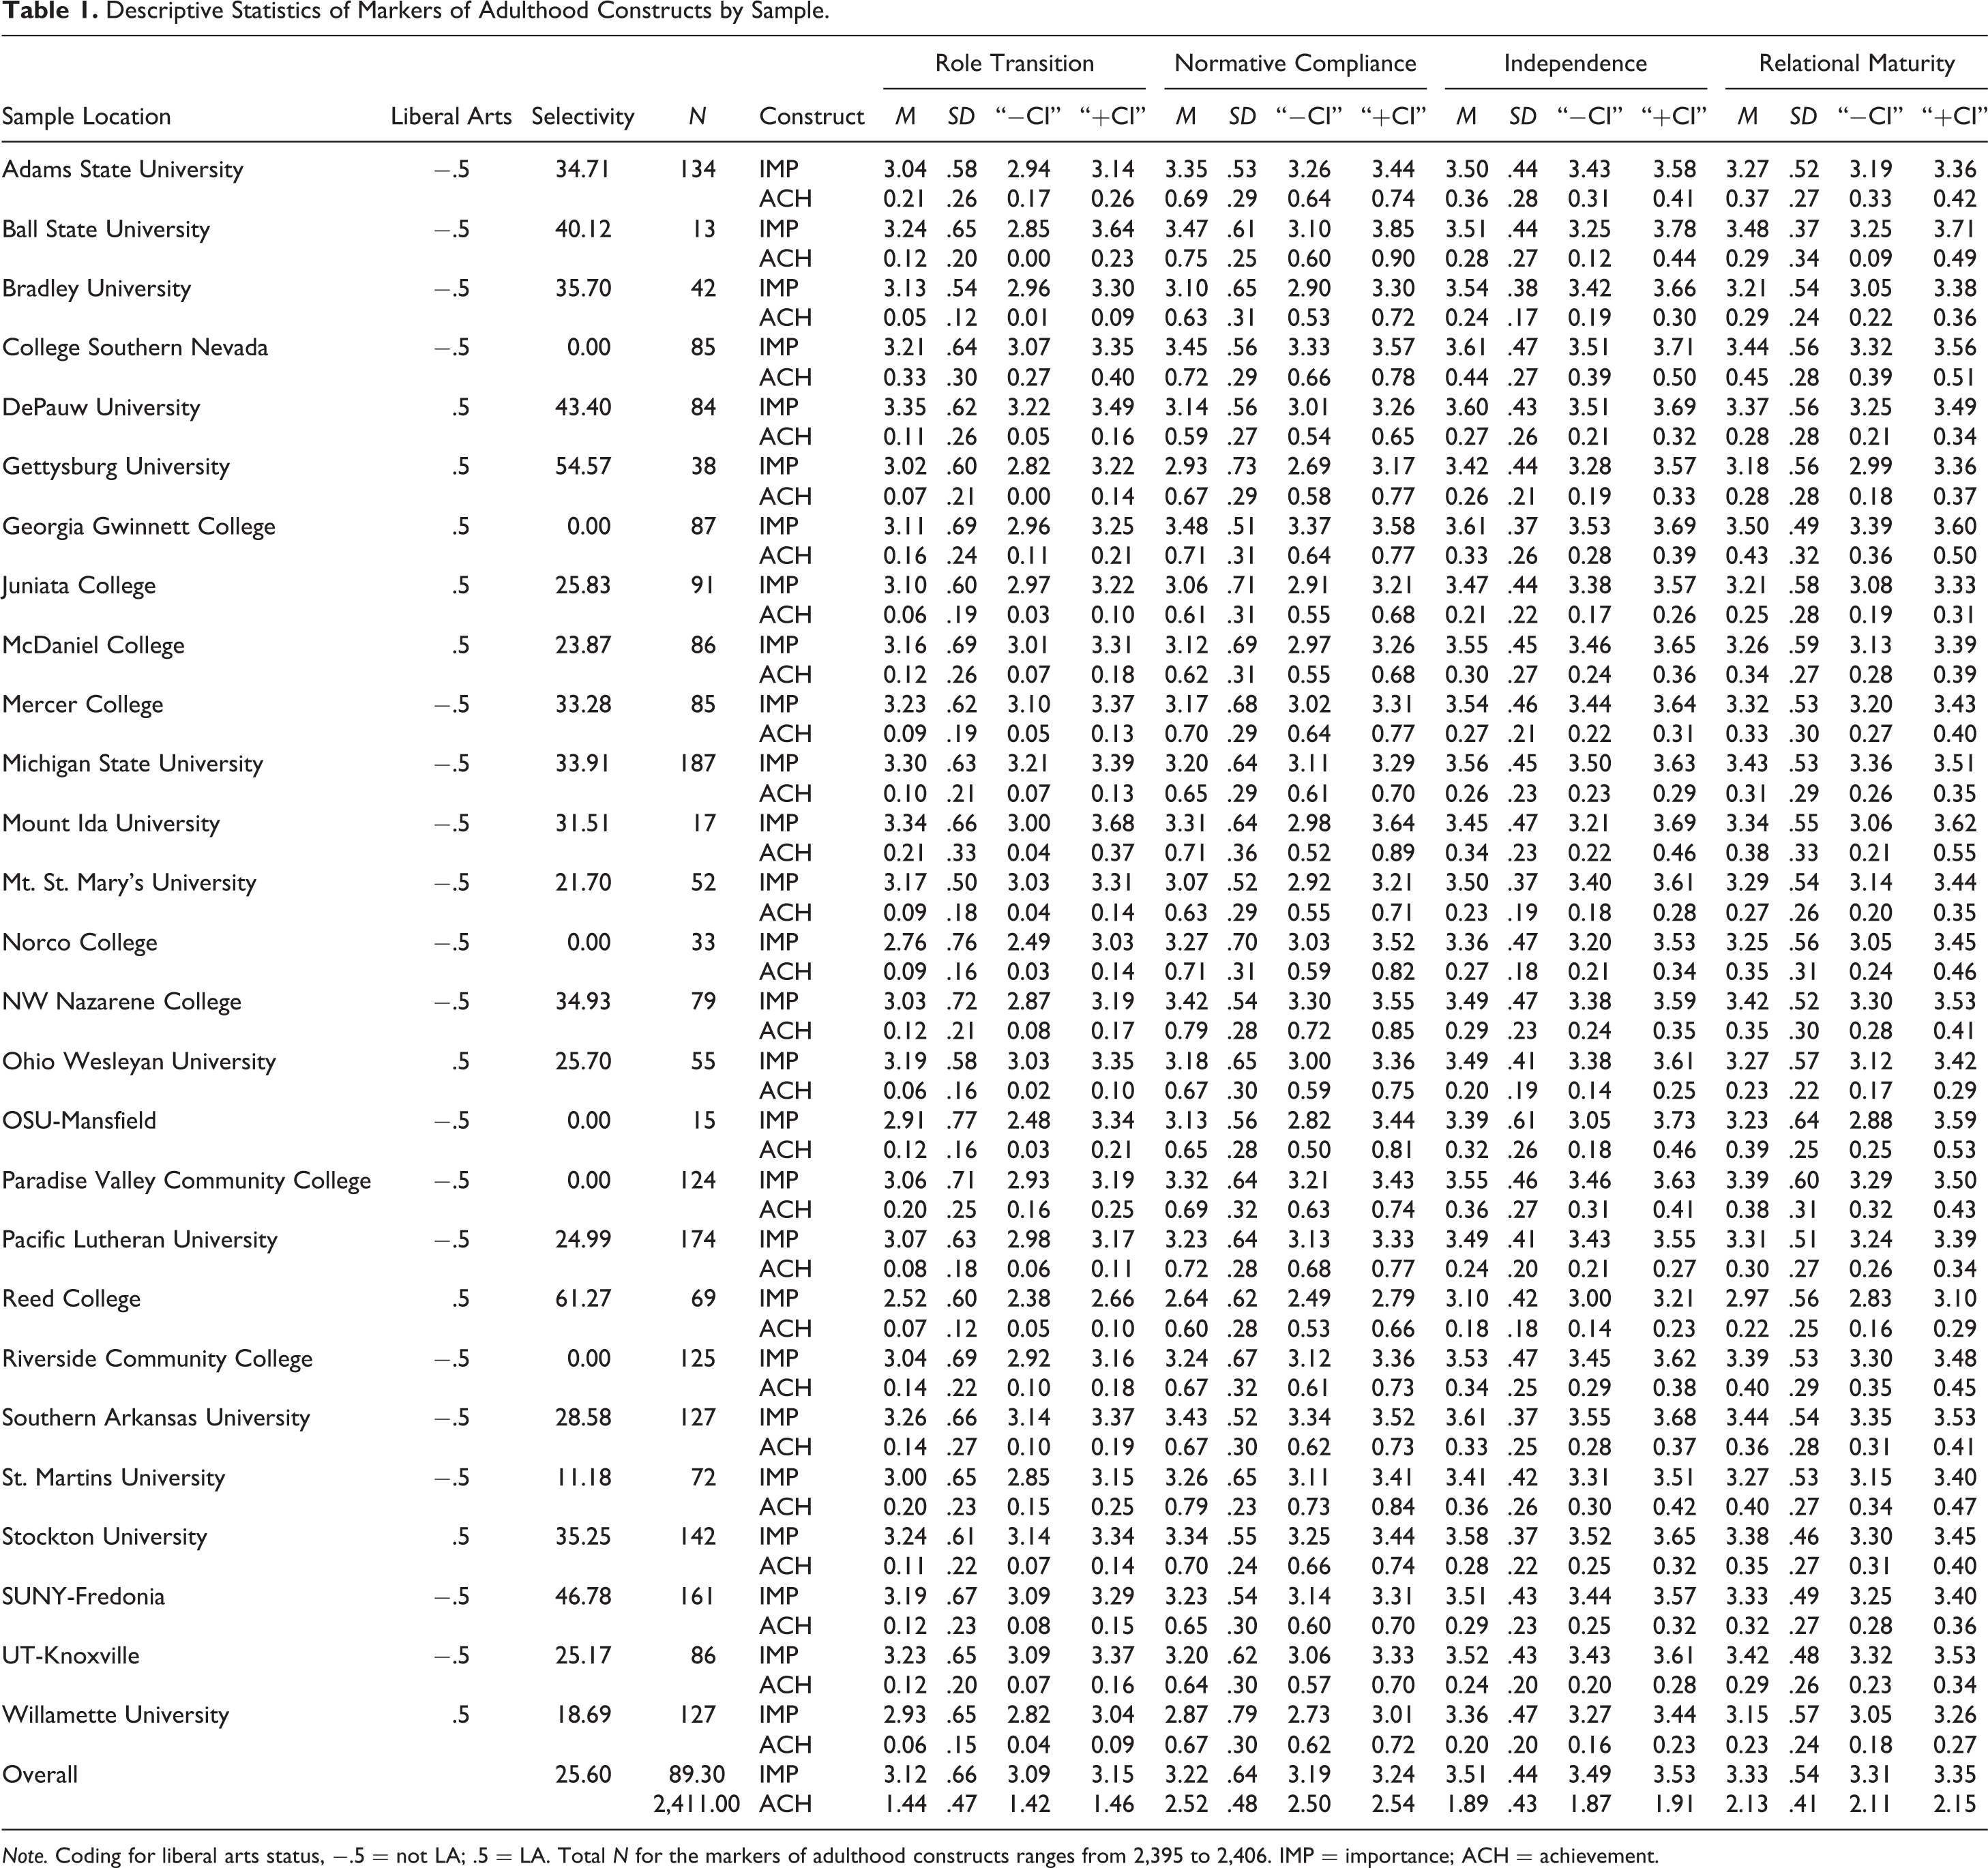
Note. Coding for liberal arts status, −.5 = not LA; .5 = LA. Total N for the markers of adulthood constructs ranges from 2,395 to 2,406. IMP = importance; ACH = achievement.
Nested Model Fit Statistics.
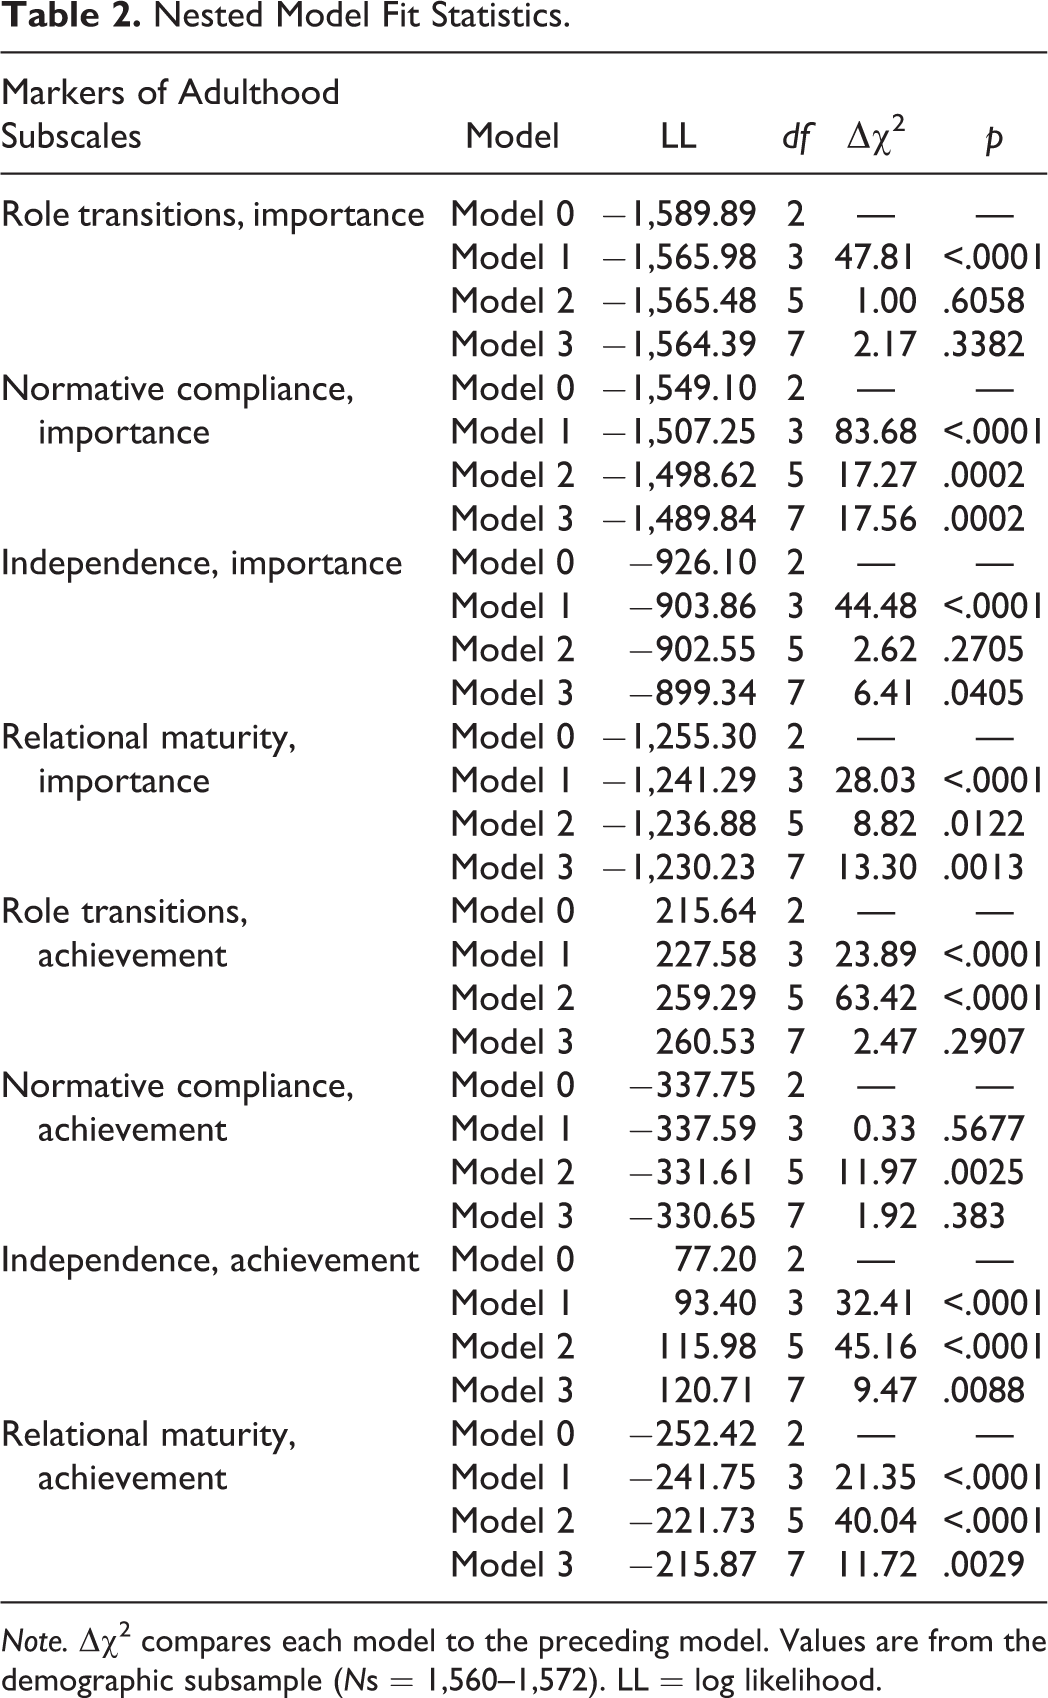
Note. Δχ2 compares each model to the preceding model. Values are from the demographic subsample (Ns = 1,560–1,572). LL = log likelihood.
Between-Campus Variability
All subscales with the exception of normative compliance (achievement) showed statistically significant between-campus variability (see Table 2, Model 1: all ps < .0001 for both the full sample and demographic subsample). ICCs, the proportion of variability in the scales that was explained by campus, for the statistically significant subscales ranged from 3.04% to 7.12% in the full sample and 2.96% to 7.58% in the demographic subsample (see Table 3). By contrast, normative compliance (achievement) had an ICC of 1.42% (full sample) or 0.27% (demographic subsample). For comparison, Corker et al. (2017) reported ICCs of 0.9–2.8% for the Big Five personality factors. Thus, MoA appeared to show somewhat more between-campus variability than personality traits, although the overall magnitude of variability could still be considered small. Table 3 also demonstrates the median Cronbach’s α (calculated separately for each school) for each subscale as well as the minimum and maximum αs. Schools with smaller samples tended to have αs that varied more from the median of that subscale.
ICC(1), ICC(2), and α Reliability for All Subscales.
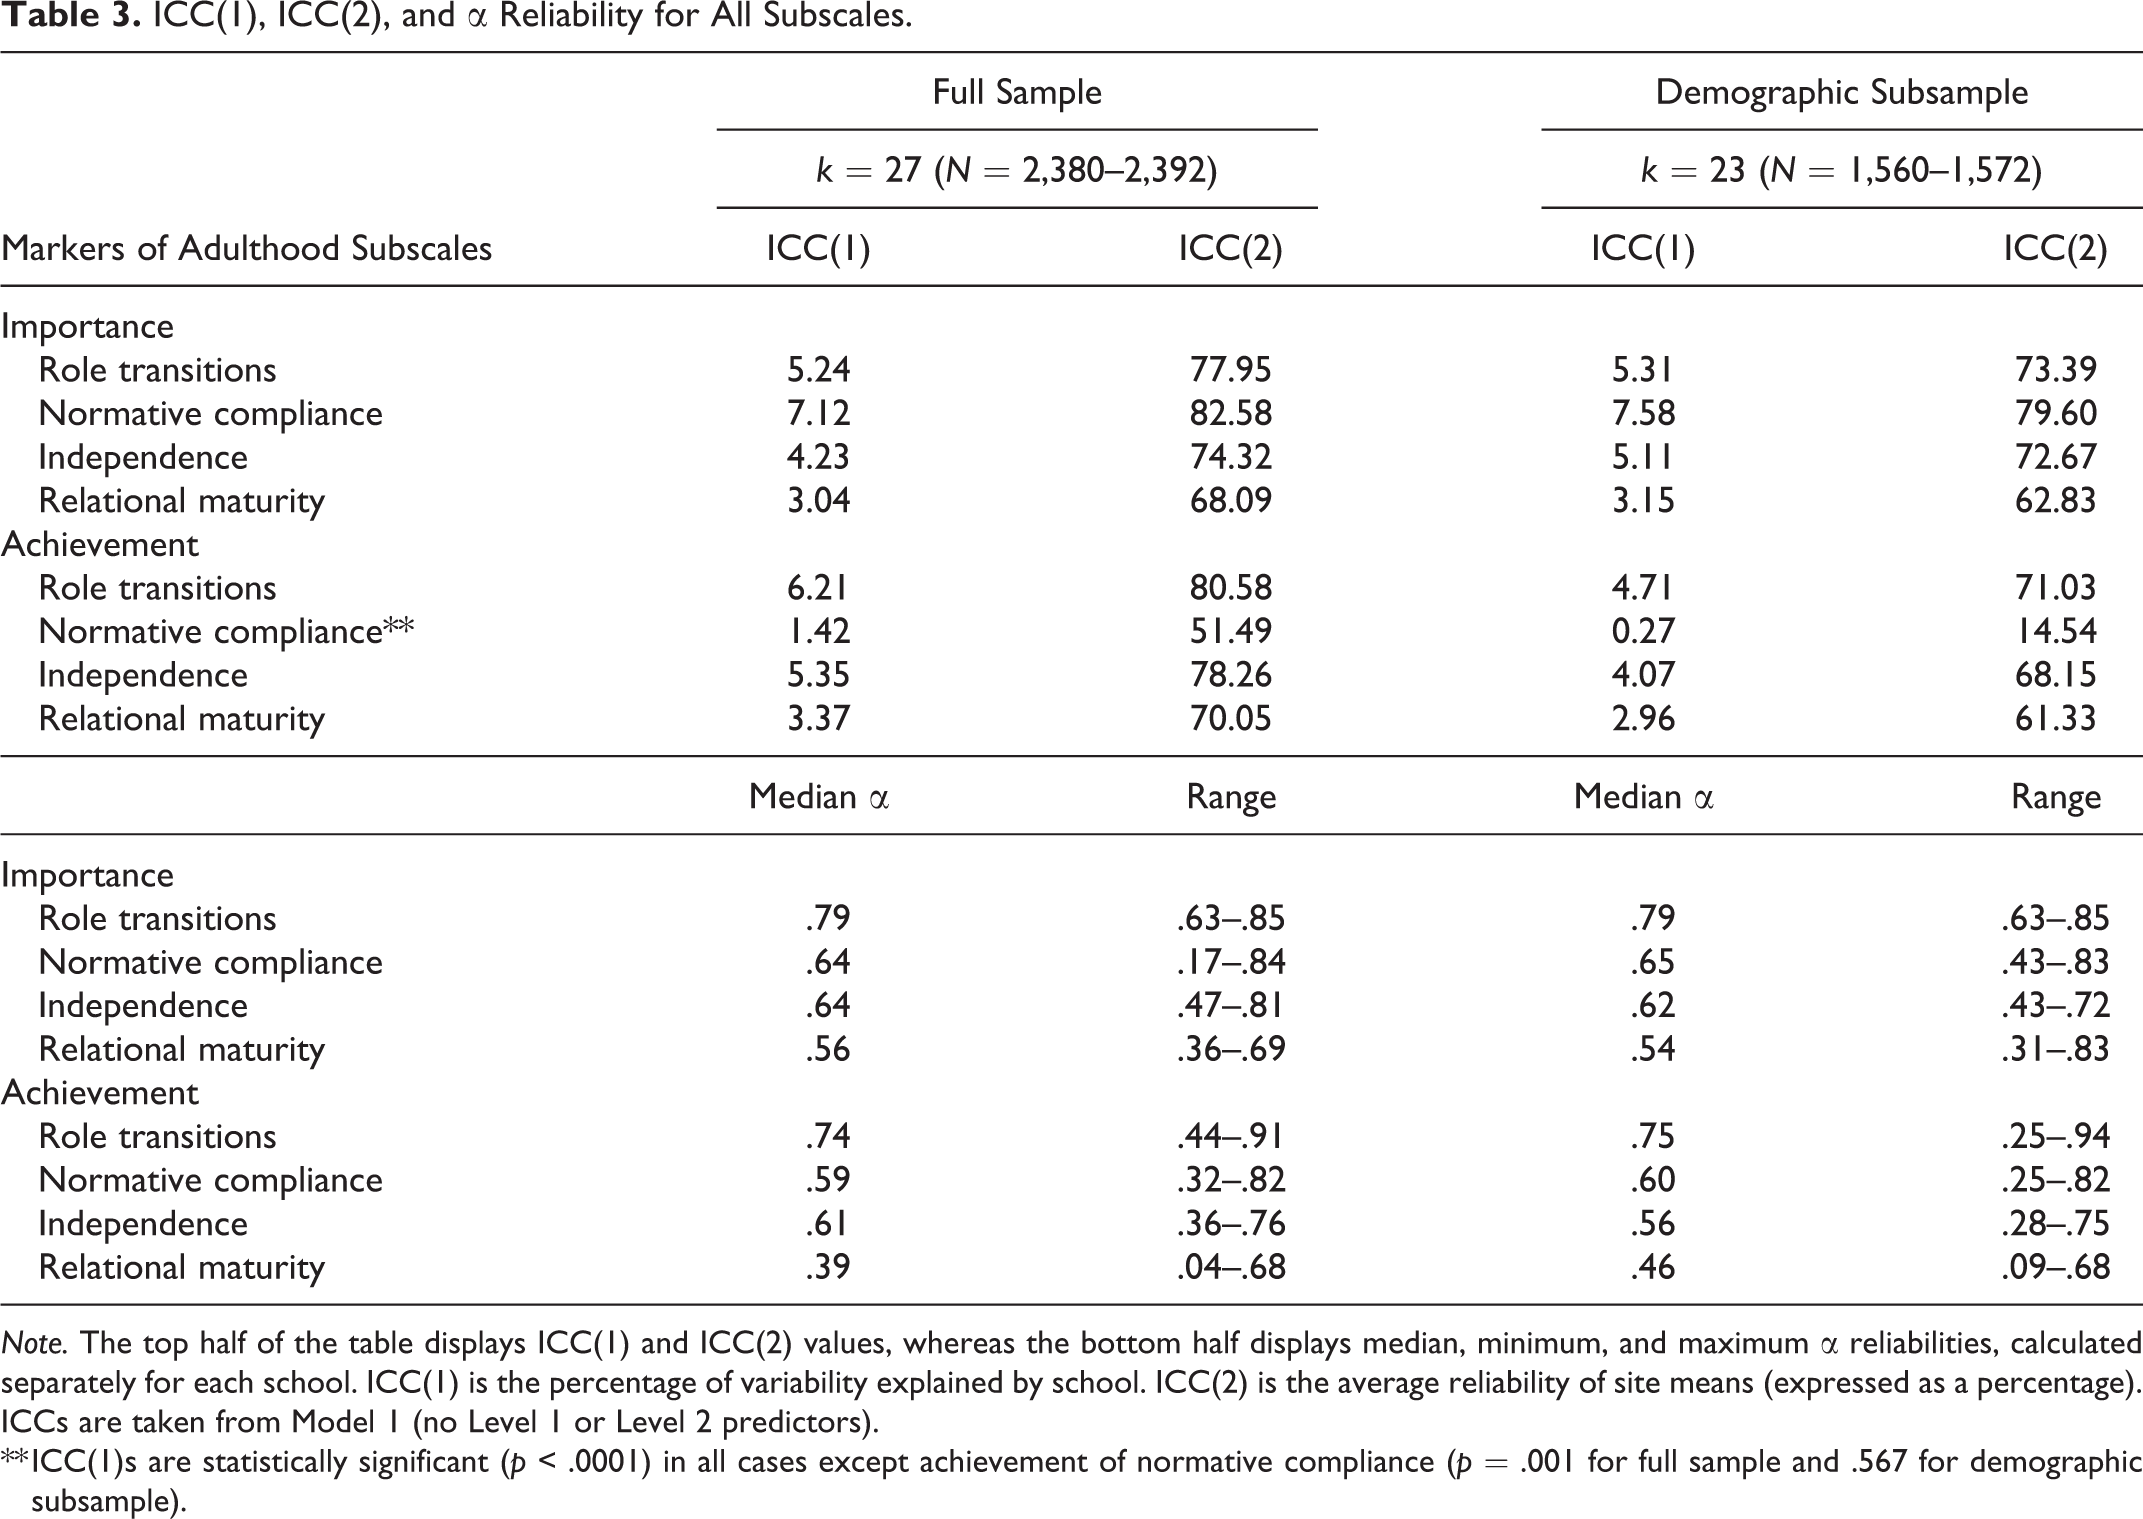
Note. The top half of the table displays ICC(1) and ICC(2) values, whereas the bottom half displays median, minimum, and maximum α reliabilities, calculated separately for each school. ICC(1) is the percentage of variability explained by school. ICC(2) is the average reliability of site means (expressed as a percentage). ICCs are taken from Model 1 (no Level 1 or Level 2 predictors).
** ICC(1)s are statistically significant (p < .0001) in all cases except achievement of normative compliance (p = .001 for full sample and .567 for demographic subsample).
Demographic Controls
Table 4 contains multilevel model coefficients and statistical significance tests for the demographic control variables, discussed here, as well as the campus-level predictors (presented subsequently) that provide evidence for our main hypotheses.
Multilevel Model Results.
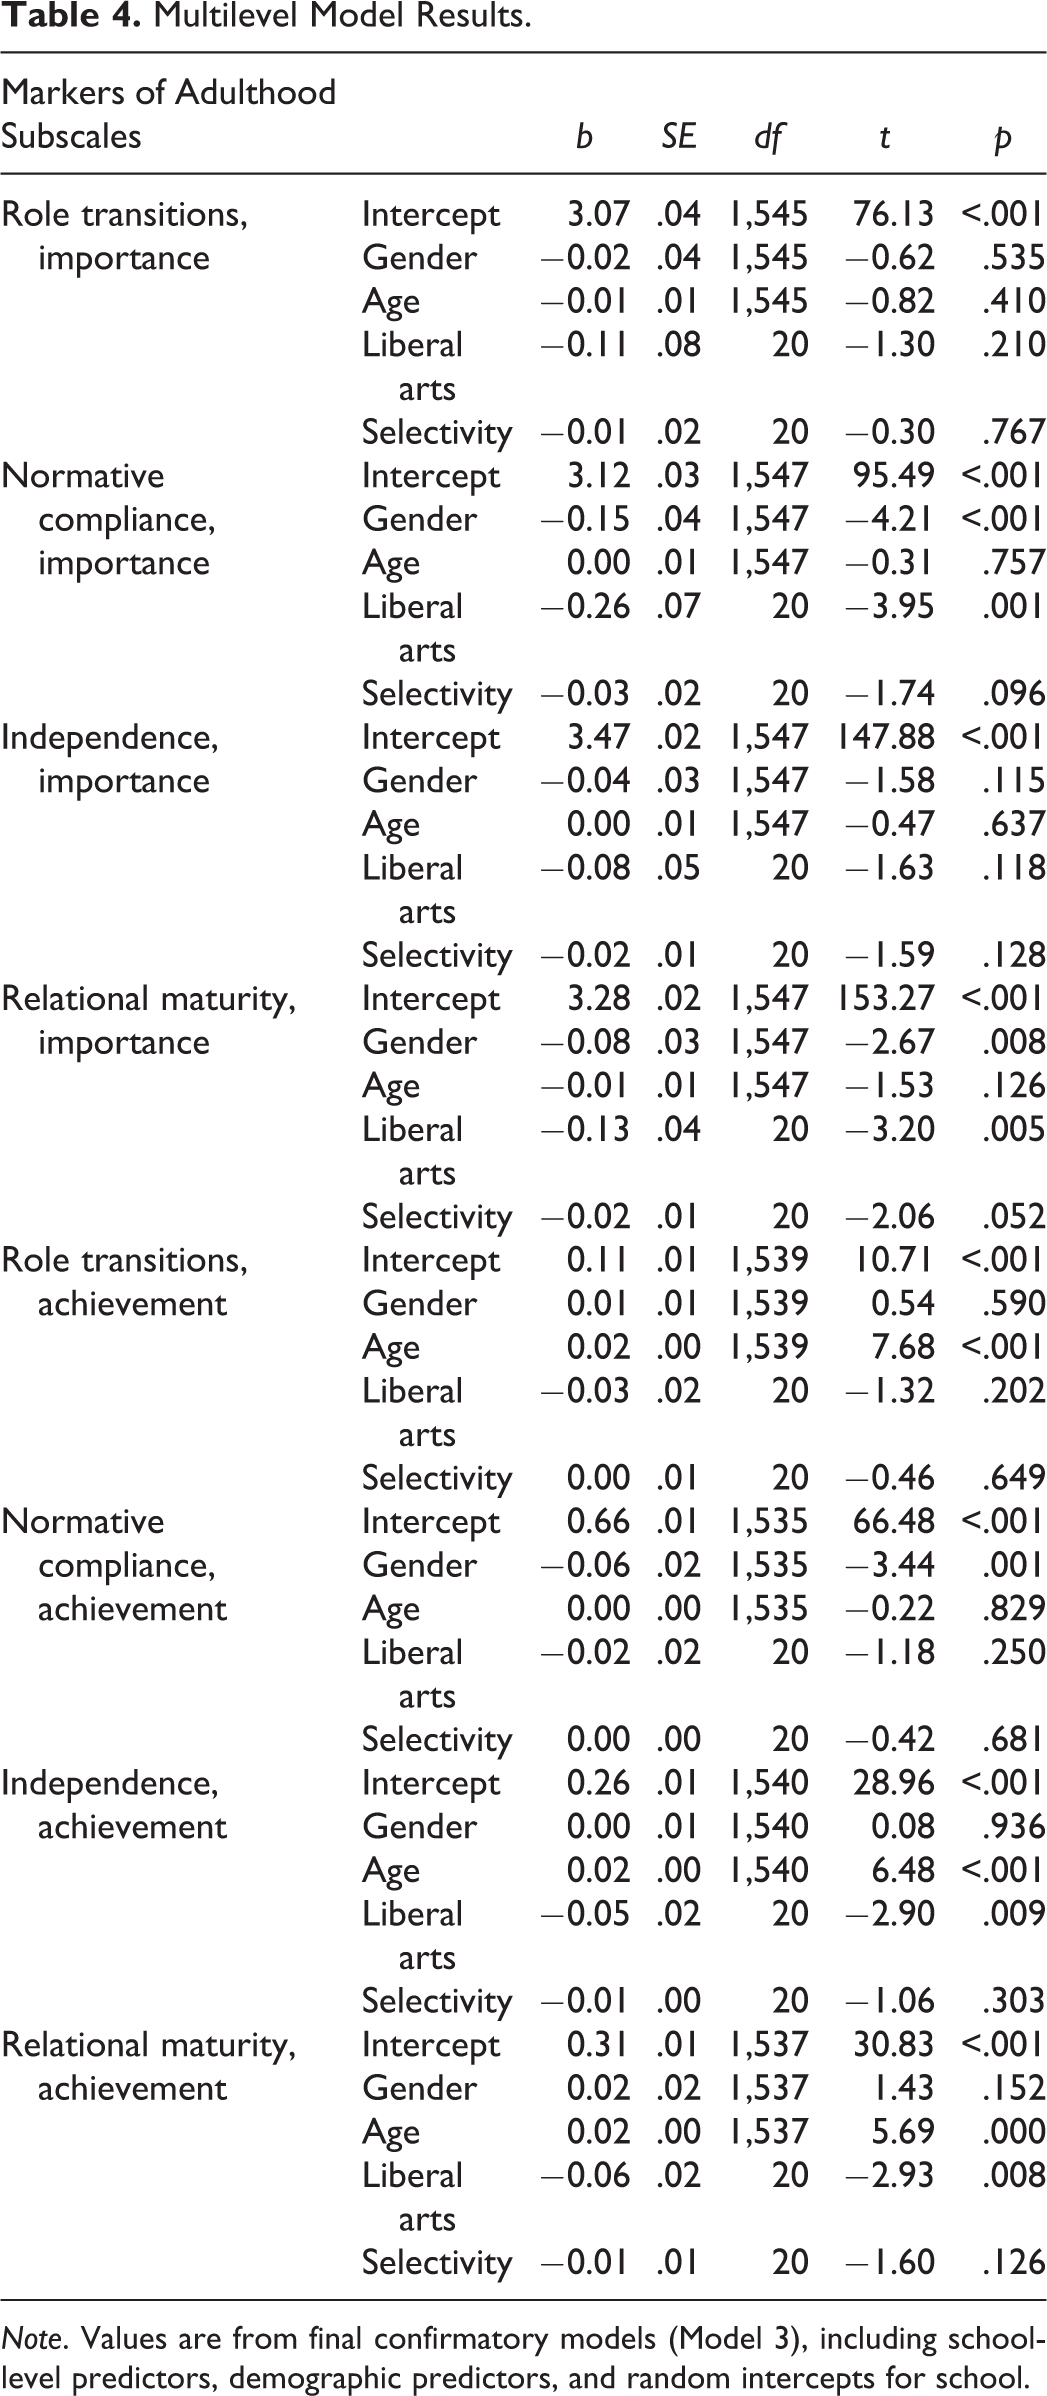
Note. Values are from final confirmatory models (Model 3), including school-level predictors, demographic predictors, and random intercepts for school.
Importance
Demographic variables had a statistically significant, but small, association with normative compliance. In particular, men reported normative compliance as less important as a marker of adulthood than women (b = −.15). Men also reported lower importance ratings of relational maturity than women (b = −.08). Role transitions and independence did not show demographic differences.
Achievement
Demographic variables significantly predicted achievement of all four subscales. In particular, age was positively associated with achieving role transitions (b = .02), independence (b = .02), and relational maturity (b = .02), but not normative compliance. These are unstandardized coefficients, and therefore, for each year of age, we predict .02 increase in original units for these variables. Men reported lower levels of normative compliance achievement (b = −.06) than women, but there was no evidence of other gender differences.
Campus-Level Predictors of Between-Campus Variability
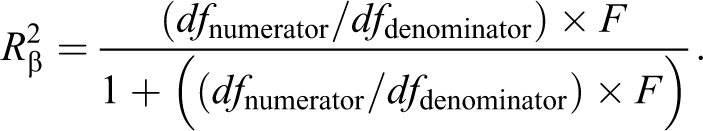
To test our main hypotheses, campus-level variables (liberal arts and selectivity) were entered into models as predictors. Effect sizes were our primary determinant of support for the hypotheses and were computed as semipartial R 2 (Edwards, Muller, Wolfinger, Qaqish, & Schabenberger, 2008) for each predictor, using the following formula:
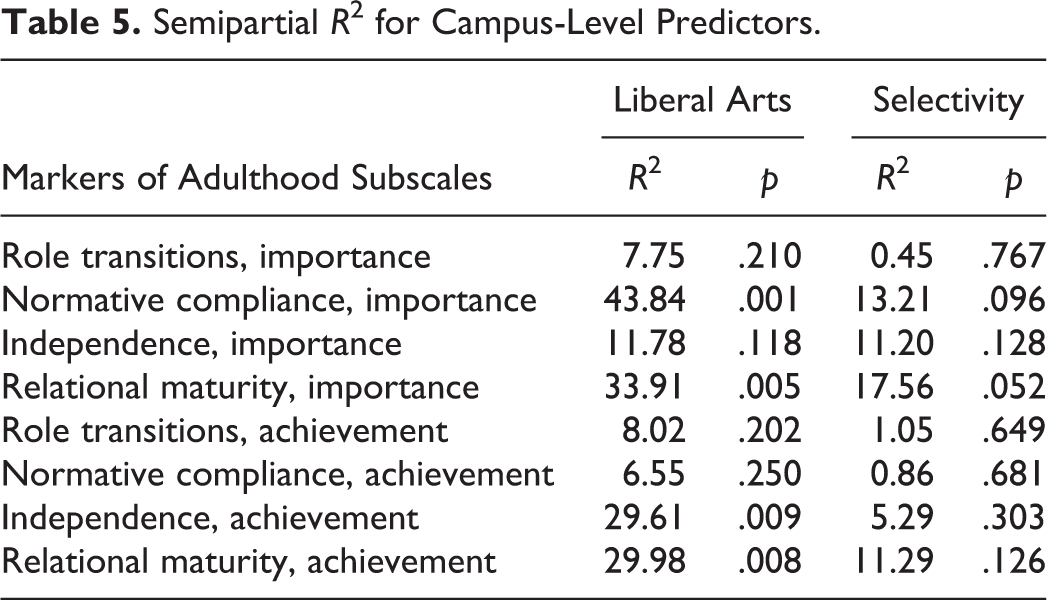
Even though we had more than double the number of schools as Fosse and Toyokawa (2016), we caution against overinterpreting these results because multilevel modeling power is determined jointly by the number of groups (i.e., Level 2) and the number of respondents (i.e., Level 1). We interpreted effect sizes continuously 5 to assess results, which are displayed in Table 5.
Semipartial R 2 for Campus-Level Predictors.
Importance
Liberal arts status predicted the importance of normative compliance, R 2 = 43.84%, and also importance of relational maturity, R 2 = 33.91%. Respondents at liberal arts schools reported that normative compliance and relational maturity were less important indicators of adulthood than those at nonliberal arts schools. Role transitions and independence were not statistically significantly associated with liberal arts status (R 2 = 7.75% and 11.78%), but the effects were in the negative direction (as with the other two subscales).
Selectivity did not significantly predict any of the four subscales, although all effects were in the negative direction, which was consistent with our hypotheses. However, the effect sizes ranged from 0.45% to 17.56%, suggesting little support for the selectivity hypotheses.
By observing plots of the correlations between each MoA scale and selectivity at the campus level, we noted an intriguing potential curvilinear trend. This trend suggested the presence of decreased endorsement of the MoA Scale items at both the high and low ends of the selectivity scores. We tested these effects with an additional quadratic predictor (selectivity squared) in an unregistered exploratory analysis. Selectivity squared was grand mean centered based on the subset of schools being analyzed prior to the construction of the squared term, as recommended in Cohen, Cohen, West, and Aiken (2003).These findings are reported in full in Online Supplemental Tables 2 and 3 (“supplemental analyses” folder; https://osf.io/egmm2/). For the importance items, each of the four scales yielded larger effects for quadratic predictors than for linear predictors (role transitions, R 2 = 49.72, p < .001; normative compliance, R 2 = 24.50, p = .023; independence, R 2 = 30.90, p = .009; relational maturity, R 2 = 13.36, p = .103). Also, with these new models, the linear selectivity predictors were somewhat stronger with relational maturity. Even considering a more stringent p value for decision criteria, these quadratic findings are intriguing and may be important to consider.
Achievement
Liberal arts status predicted perceived achievement of independence and relational maturity (R 2 = 29.61% and 29.98%), but not role transitions and normative compliance (R 2 = 8.02% and 6.55%). All effects were negative: Students at liberal arts schools were less likely to report achieving independence and relational maturity. Selectivity was not significantly associated with achievement ratings for any of the four subscales; effect sizes ranged from 0.86% to 11.29% (see Table 5). Adding quadratic predictors in exploratory analyses did not explain any meaningful variance and did not change the results for liberal arts or selectivity in any measurable way. Any effects of selectivity were found in the importance rather than achievement items.
Relative Effects Sizes Between MoA Constructs
Our fifth and final hypothesis was that effect estimates from both importance and achievement for two MoA constructs (normative compliance and relational maturity) would be greater than the effect size estimates for the other two (role transition and independence). To examine Hypothesis 5, we compared the relative effect sizes represented by the R 2s from Model 3 from Table 4. This is not conclusive statistical evidence, 6 but this trend does suggest that liberal arts status is more strongly associated with certain MoA constructs than others.
Discussion
Summary of Findings
Meaningful differences in the MoA Scale between colleges and universities were reflected in small to moderate ICCs. Further, our findings provided partial support for our hypotheses regarding institutional variability predicting differences in perceived importance and achievement of MoAs as first demonstrated by Fosse and Toyokawa (2016). As predicted, respondents from liberal arts institutions rated items in the Normative Compliance and Relational Maturity subscales as less important indicators of adulthood than respondents from other institutions. However, we did not observe predicted associations with institutional selectivity for importance scales in the planned analyses. And yet, when taking into account a quadratic selectivity effect, the most selective schools showed lower levels of importance for role transitions and independence. Thus, the data supported Hypothesis 2 but did not support Hypothesis 1.
When considering achievement of MoA, there were no significant effects of selectivity, failing to support Hypothesis 3. However, respondents from liberal arts institutions were less likely to report achieving relational maturity milestones, though they did not differ from others in reporting that they achieved milestones representative of normative compliance, providing partial support for Hypothesis 4.
Finally, students at liberal arts institutions were less likely to define adulthood as involving emotionally mature relationships with their parents and also less likely to have achieved these mature relationships. Additionally, these respondents less frequently suggested that normative compliance milestones were defining characteristics of adulthood. Of note, we found no evidence of differences in normative compliance achievement but that might be because of floor effects or restriction of range or because this scale had the weakest psychometric characteristics of all the scales. An unpredicted finding was that liberal arts respondents were also less likely to report achievement of the independence items (e.g., caring for others and taking responsibility).
We replicated previously observed age and gender differences in MoA (Badger et al., 2006, Nelson et al., 2007). First, age was associated with achievement for three of the four scales, but not with importance. This finding reflects a basic premise of EA. With increased age, individuals transition across these various MoAs (Arnett, 2000) but even the youngest emerging adults may still rate these markers as important to achieve in the future. These findings provide an important validity check of the scale generally.
Additionally, women rated normative compliance and relational maturity as more important indicators of adulthood, and they reported higher achievement of normative compliance. This result supports prior findings of higher ratings of importance for normative compliance items for women among both American and Chinese participants, though no other sex differences were reported (Badger et al., 2006). Other research also documented women rating normative compliance as more important than men did, though they also found women rated other constructs as important for this transition (Nelson et al., 2007). The lack of difference in achievement in our sample is a curious finding that should be further considered, but the pattern of perceived importance seems consistent with prior literature.
Institutional Characteristics and EA
Although replication of these age and gender effects is important, it was the replication of associations with institutional selectivity and liberal arts status that represented our primary questions. Specifically, we replicated Fosse and Toyokawa (2016) who first examined these variables. In contrast to age and gender, to our knowledge, no other published research addressed the four hypotheses regarding selectivity and liberal arts status and perceptions of the importance and reported achievement of EA. Although prior research (Corker et al., 2017) focused on associations between institutional characteristics with personality measures, our findings are compelling because they show that institutional characteristics are meaningful predictors of individuals differences in a novel domain, EA. Beliefs about the transition to adulthood are determined by many variables beyond personality traits requiring extensive investigation. Although we did not measure any process variables that could explain the differences we found, our research highlights the importance of exploring and trying to systematically account for sample differences.
Although most of the effects related to liberal arts status replicated in our sample, the effects related to selectivity were confusing and intriguing rather than consistent with Fosse and Toyokawa’s (2016) findings. Previous research noted mixed findings. For example, Pascarella et al. (2006) observed that undergraduate institution selectivity was positively associated with career success and future earnings but had small or inconsistent relationships to cognitive, developmental, and psychosocial outcomes. Our preregistered analyses for selectivity yielded no meaningful findings, though all the effects for institutional selectivity were in the predicted negative direction.
In post hoc follow-ups with importance items, we showed some evidence for quadratic effects for selectivity, as two quadratic predictors returned large effect sizes (role transitions and independence) and two revealed medium-sized effects (normative compliance and relational maturity). These quadratic effects were present even when considering only the institutions in the IPEDS subsample (not including the open enrollment institutions), which is a smaller and therefore a less powerful test. We are cautious to avoid over interpretation, but we note that these effect sizes were quite large. These findings provide further evidence that institutional characteristics may explain psychological individual differences. Although by no means conclusive, this finding reiterates the complicated relationship between school selectivity and outcomes. As noted by Pascarella et al. (2006), more variation exists within rather than between institutions; subenvironments of a university may have more impact than institutional characteristics themselves.
Institutional differences in liberal arts focus were associated with students’ evaluations of importance and achievement of MoA. Although we are not clear on specific mechanisms, we assert that horizontal stratification between institutions may relate to the same mechanisms that explain differences in other psychological variables. That is, students with particular attitudes and values may be attracted to institutions with particular norms or reputations, and institutions may select students with qualities that match their values and goals. Corker et al. (2017) propose possible mechanisms to explain personality differences between institutions. Although we could not find other research that explored how attraction, attrition, selection, or socialization predicted institutional-level individual differences for colleges, there is considerable evidence that these conditions can impact other educational outcomes such as major selection (Vedel, 2016), organizational fit (De Coorman et al., 2009; Porter & Umbach, 2006), and subsequent organizational citizenship behavior (Ployhart, Weekley, & Baughman, 2000), which can lead to homogeneity (Denton, 1999; Schneider, Smith, & Goldstein, 2000).
To that end, liberal arts status specifies that an institution focuses on a certain set of disciplines with a limited number of professional school majors (e.g., engineering and nursing). Highly selective institutions and those with a liberal arts focus may be viewed as valuing “highbrow aesthetic culture,” a common interpretation of cultural capital (Lareau & Weininger, 2003, p. 568). Rather than identifying some unifying characteristic of individuals at liberal arts schools, it might be useful to consider which individuals are not attending them. Individuals attending universities with professional schools and a vocational focus might be more interested in getting a job and possibly achieving other conventional MoA (e.g., leaving home, finishing school, marriage or partnering, and having children). Relational maturity reflects becoming emotional equals with parents and taking care of others. Individuals who are seeking to explore education rather than prepare for a career might perceive reliance on parental financial and emotional support as more important. Although not predicted, the finding that liberal arts respondents reported achieving less independence could reflect a number of factors: these students might be more connected to their parents (Schiffrin et al., 2014), more likely to live on campus, and less likely to work while attending college.
We recognize this is speculation without further research to suggest why liberal arts schools fostered or recruited individuals who are less likely to value relational maturity, or even normative compliance, as a marker of the transition to adulthood. However, the present study replicates a previous study with data from 2004 (Fosse & Toyokawa, 2016) revealing institutional differences in how people define and achieve adulthood. Regardless of the mechanism driving these differences in defining and attaining adulthood milestones, recognizing them can help institutions and students when considering cocurricular programming, even recruiting.
Limitations and Future Directions
No single study can address all questions without limitations, and our primary limitation is that the study is underpowered. The multilevel nature of the question requires many different samples rather than simply many respondents. Our sample only included 23 institutions (of the 32 in EAMMi2). Even with over 1,500 respondents in our demographic subset, our conclusions are limited by the smaller number of institutions. Future research should further attend to power at both levels of analysis (institutional and individual).
Future research should not only increase the number of samples but also include more sophisticated analyses to address this institutional variability. Increased sample size would further advance the ability to examine other participant and institutional characteristics. In our preregistration, we had also planned to conduct exploratory analyses controlling for ethnicity, education, and socioeconomic status. However, other power limitations made it impossible to conduct these analyses confidently. Further research could do so with greater power.
Moreover, although liberal arts status was associated with differences, a more nuanced categorization scheme may influence future research findings. The American Association of Colleges and Universities (n.d.) describes a “liberal education” as an education “that empowers individuals and prepares them to deal with complexity, diversity, and change.” Yet IPEDS and the Carnegie classification system may not accurately capture an institutional culture of liberal arts focus. Anecdotally, contributors from participating institutions self-identified their school as “liberal arts” while their official classifications were nonliberal arts due to offering at least 50% of their degrees in professional programs, such as nursing or engineering.
In our analyses, we followed the IPEDS classifications and not personal classification, but we wonder how the liberal arts schools qualitatively differed from the rest of the sample. Consistent with Ro, Terenzini, and Yin’s (2013) conclusion, it is possible that characteristics of a college or university more proximal to students’ experiences are more useful predictors of student outcomes, whereas broader institutional characteristics such as categories defined by size, mission, and selectivity may be too distant from daily experience to be impactful.
Additionally, it is worth noting that institutional “selectivity” may be measured in multiple ways. Because this was a replication, we followed Fosse and Toyokawa’s (2016) operational definition of selectivity as proportion of rejected applicants, whereas other literature has defined selectivity by average ACT/SAT of enrolled students (Pascarella et al., 2006). By considering other institutional variables with clearer operational definitions, future research may better explain differences rather than merely describe them.
Although MoA importance items measure perceptions of what characteristics of adulthood matter, achievement items measure the respondents’ progress in the process of passing those markers. We scored the MoA following the protocol employed by Fosse and Toyokowa (2016). However, this is only a single approach to categorizing these items and other options should be explored and the reliabilities of these constructs were modest. Further, the reliability of relational maturity was quite poor, weakening interpretations related to this construct. Faas et al. (2018) explored other approaches, and there is suggestive evidence of a fifth factor that should be considered or that some items need to be reassigned. Perhaps the null findings reflect that the constructs use the wrong combination of items or the need to identify new items.
Further research could address this issue using an alternative score approach that considers the relative answers to both sets of questions. For example, Sharon (2016) computed the relative match between importance and achievement items to measure how respondents were matching with their adulthood expectations. Using the available data from both the EAMMi (Reifman & Grahe, 2016) and EAMMi2 (Grahe et al., 2016) projects, researchers could provide updated recommendations for MoA scoring protocols.
The method of data collection likely increased error variability in our data. Participants recruited via online invitations completed the project with little control over the testing environment. Although this method increased participation by making it easier for varied researchers to collect data from respondents across a wide area, some participants responded from outside institutions, and their data were not included in the present analyses.
Conclusions
Institutional context is related to perceptions about which milestones represent adulthood transitions for some constructs. For the importance scales, we only found effects for norm compliance and relational maturity, not role transitions or independence. Our results support conclusions from Fosse and Toyokawa (2016) that although institutional selectivity is prominently used in higher education research, other measures might better capture interinstitutional variation. Perhaps this is good news for higher education. Despite allegations of selectivity perpetuating privilege and facilitating horizontal stratification, we were unable to find support for this notion in regard to attaining milestones associated with adulthood. However, we do find evidence that institutional characteristics should be addressed and accounted for when examining questions related to our conceptions of adulthood and other psychosocial variables.
Footnotes
Acknowledgment
Author Contributions
Jon E. Grahe contributed to conception, design, acquisition, analysis, and interpretation; drafted the manuscript; critically revised the manuscript; gave final approval; and agreed to be accountable for all aspects of work ensuring integrity and accuracy. Katherine S. Corker contributed to design, acquisition, analysis, and interpretation; drafted the manuscript; critically revised the manuscript; and gave final approval. Matthew Schmolesky contributed to acquisition; drafted the manuscript; critically revised the manuscript; and gave final approval. Leslie D. Cramblet Alvarez contributed to interpretation; drafted the manuscript; critically revised the manuscript; and gave final approval. Joseph McFall contributed to acquisition and analysis; critically revised the manuscript; and gave final approval. Julie Lazzara contributed to acquisition; drafted the manuscript; critically revised the manuscript; and gave final approval. Andrew H. Kemp contributed to acquisition; critically revised the manuscript; and gave final approval.
Declaration of Conflicting Interests
The author(s) declared no potential conflicts of interest with respect to the research, authorship, and/or publication of this article.
Funding
The author(s) disclosed receipt of the following financial support for the research, authorship, and/or publication of this article: This work was supported by Association for Psychological Science (APS Fund for Teaching and Public Understanding) and Pacific Lutheran University (Faculty Regency Award [internal grant]).
Supplemental Material
Supplemental material for this article is available online.
Open Practices
All data and materials have been made publicly available via the Open Science Framework and can be accessed at https://osf.io/x7mp2/, https://osf.io/t2ek4/ and https://osf.io/wxkyj/. The complete Open Practices Disclosure for this article can be found at ![]() . This article has received the badges for Open Data, Open Materials, and Preregistration.
. This article has received the badges for Open Data, Open Materials, and Preregistration.