
Abstract
Sense of belonging is crucial for thriving in various contexts and must be maintained over time. However, we know little about how belonging fluctuates. In education, changes in school belonging differ by gender identity. Unfortunately, this evidence does not assess differences by racial identity or socioeconomic status. Because low belonging among students that espouse minoritized racial socioeconomic identities is a pervasive concern, it is important to understand how it functions among diverse groups. Via growth curve modeling this study explores changes in university belonging among individuals (Ns = 136, MT1age = 19 years) from diverse backgrounds (Black 16%, Latinx 15%, Asian 19%, White 34%, Native American 3%, Multiracial 13%; 36% low-income; 61% female identifying) over 4 years of college.
Introduction
Sense of belonging – a human need to be accepted by a group or in an environment – is fundamental to positive life outcomes (Baumeister & Leary, 1995). In the educational environment, university belonging is no exception. University belonging - the extent to which college students see themselves as part of the campus community, feel they are members of the campus community, and feel they belong to the campus community – is crucial to college student development (Hurtado & Carter, 1997; Strayhorn, 2018). When students exhibit a healthy sense of school belonging, they are more motivated to do well academically (Freeman et al., 2007). They are also more likely to persist in their degree program (Booker, 2016) and, ultimately, more likely to graduate from college (O’Keeffe, 2013).
Differences in University Belonging by Social Identities: A Singular Approach
Unfortunately, not all students experience a healthy sense of university belonging. Students who identify with minoritized social/group identities are more likely to experience lower levels of sense of university belonging than their peers (Cohen & Garcia, 2008; Ruedas-Gracia et al., 2020; Tachine et al., 2017). Cross-sectional studies examining demographic differences in university belonging have found overwhelming differences by various social identities, including gender, race, and social class. For example, a study exploring sense of belonging to the field among students in Physical Sciences, Technology, Engineering, and Mathematics (pSTEM) fields found that women reported significantly lower sense of pSTEM belonging levels than men (Lewis et al., 2017). Further, a study exploring sense of university belonging at a large public university found that students of color reported lower university belonging levels than their White peers (Museus et al., 2018). Lastly, a nationally-representative study exploring university belonging found that among students enrolled in 4-year schools, first-generation college students (i.e., students from low-income backgrounds) reported significantly lower university belonging levels than non-first-generation college students (Gopalan & Brady, 2020). While the literature on sense of university belonging has made clear that it is lacking among specific groups of minoritized and marginalized students, the literature as a whole ignores the potentially weaker belonging and attendant adverse effects among students of multiply-marginalized identity backgrounds such as first-generation students of color or women of color in pSTEM.
Differences in University Belonging by Social Identities: An Intersectional Approach
Recently, literature has begun exploring sense of university belonging among students espousing multiply-minoritized social identities. Findings suggest that sense of university belonging is experienced differently by individuals at the intersection of these minoritized identities. This is encouraging, since an intersectional identity framework has proved conducive to a less generalized and more nuanced understanding of multiple marginalized communities (Crenshaw, 2005). Although this theoretical framework aids in understanding the lived experiences of individuals with multiple minoritized identities, there is no clear guideline as to how to quantitatively test it (Syed, 2010). Nonetheless, scholars have utilized quantitative methodologies (mostly by quantitatively modeling interaction effects) in an earnest attempt to translate qualitative knowledge to quantitative insight (Guan et al., 2021). For example, Duran and colleagues found a race by generation-status interaction effect such that living on campus had a stronger impact on university belonging for continuing-generation Latino/a/x students than first-generation Latino/a/x students (Duran et al., 2020). Another study uncovered a race by LGBQ + identity interaction that uncovered within-group differences in university belonging levels among students who identified as part of the LGBQ + community (BrckaLorenz et al., 2021). These studies complicate our understanding of individual differences in university belonging and encourage us to continue to take into consideration students’ belonging experiences at the intersection of various social identities (e.g., race, gender, and socioeconomic status). Further, we recognize that quantitative approaches to intersectionality effectively only reveal the “tip of the iceberg” with regard to variation in experiences of marginality, as qualitative studies of intersectional belonging demonstrate (Valdez & Golash-Boza, 2020). It is important to note, however that most university belonging literature is cross-sectional and thus provides only a snapshot view of university belonging experienced at one timepoint. Although cross-sectional studies help highlight group and intersectional differences, documenting change over time in university belonging can better inform both theory and prospects for intervention.
Understanding Belonging Changes Over Time
Considering that the college experience is contextualized within the emerging adulthood developmental period (Arnett, 2016), it is possible that sense of university belonging during this developmental phase may fluctuate, like other aspects of development. In fact, university belonging theories highlight that it must be maintained over time (Hurtado & Carter, 1997), and may change as circumstances, contexts, or experiences change (Strayhorn, 2018). However, few studies explore how university belonging may change – or remain stable – over the course of a student’s college tenure. The scant literature that measures university belonging at more than one timepoint suggests that external factors (e.g., interventions; see Covarrubias & Fryberg, 2015; Stephens et al., 2012; Walton & Cohen, 2011) can increase university belonging for individuals from minoritized groups. These empirical findings coupled with theoretical frameworks (Hurtado & Carter, 1997; Strayhorn, 2018) hint at a dynamic that is not yet fully understood empirically; sense of university belonging can change over time, be it aided by an intervention or by other factors. Considering the importance of maintaining a healthy sense of university belonging during the college years, it is imperative that we explore fluctuations in university belonging over time. Thus, this study will examine whether university belonging changes over the course of four college years.
Differences in Belonging Changes Over Time by Social Identities
Since extant literature suggests differences in university belonging levels by minoritized group status, it is plausible that there also be such differences regarding changes in university belonging levels. Of the little work on longitudinal university belonging that does exist, we see key differences in daily university belonging fluctuations by college generation status, where first-generation college students reported lower university belonging at the daily level (Gillen-O’Neel, 2021). In the K-12 school belonging literature, we see key differences in yearly school belonging changes by gender identity, where girls’ school belonging declined whereas boys’ school belonging remained stable (Gillen-O’Neel & Fuligni, 2013). This existing belonging literature uncovering differences in school/university belonging fluctuations based on socioeconomic status and gender identity supports future work exploring these differences in addition to differences in other social identities. Thus, this study will examine whether changes in university belonging differ by three important social identities: socioeconomic status, gender identity, and race.
Several scholars have responded to calls for applying intersectionality approaches within psychological work (Lewis & Grzanka, 2016) and shedding light on the experiences of the “intersectionally invisible” (Purdie-Vaughns & Eibach, 2008) by exploring sense of university belonging among multiply minoritized students. However, few – if any – articles employ this intersectionality lens (Santos & Toomey, 2018) when exploring changes in university belonging. Therefore, this study will not only examine university belonging changes over time, and differences in these changes by social identities, but will also explore the impact that intersectional identities have on university belonging changes. This line of research will inform our understanding of how university belonging fluctuates over time. This understanding will further inform how changes in university belonging contribute to academic performance throughout college tenure, rather than at one point in time. These findings may also inform our understanding of when to implement interventions and to which demographic universities should focus reform efforts.
Conceptual Figure
We present a conceptual figure (Figure 1) that guides our analyses of between-group differences in sense of university belonging and its changes over time. The figure is a Venn diagram in the shape of a flower, with each petal representing one axis of social identity (e.g., race, gender, class). Different regions of this diagram correspond to different levels and foci of our analyses. At the outer perimeter, the petals are spread out and clearly distinct from one another. This outer region corresponds to the singular approach, where individual dimensions of identity are considered one at a time (e.g., differences in sense of belonging by gender). In the middle regions, where individual petals begin to overlap, is the intersectional region. Here, intersecting identities are considered (e.g., race x gender). Ultimately, this region culminates at the base of the diagram (at the flower’s ovary), from which all the petals originate. Here, all axes of identity (and their intersections) are considered simultaneously. Our diagram includes the three dimensions of race, gender, and social class. There are, however, many more salient dimensions of identity to consider, and this is indicated by the petals with dashed outlines. Conceptual framework. R = race. G = gender. S = social class. Interactions between demographic categories are marked by “x”.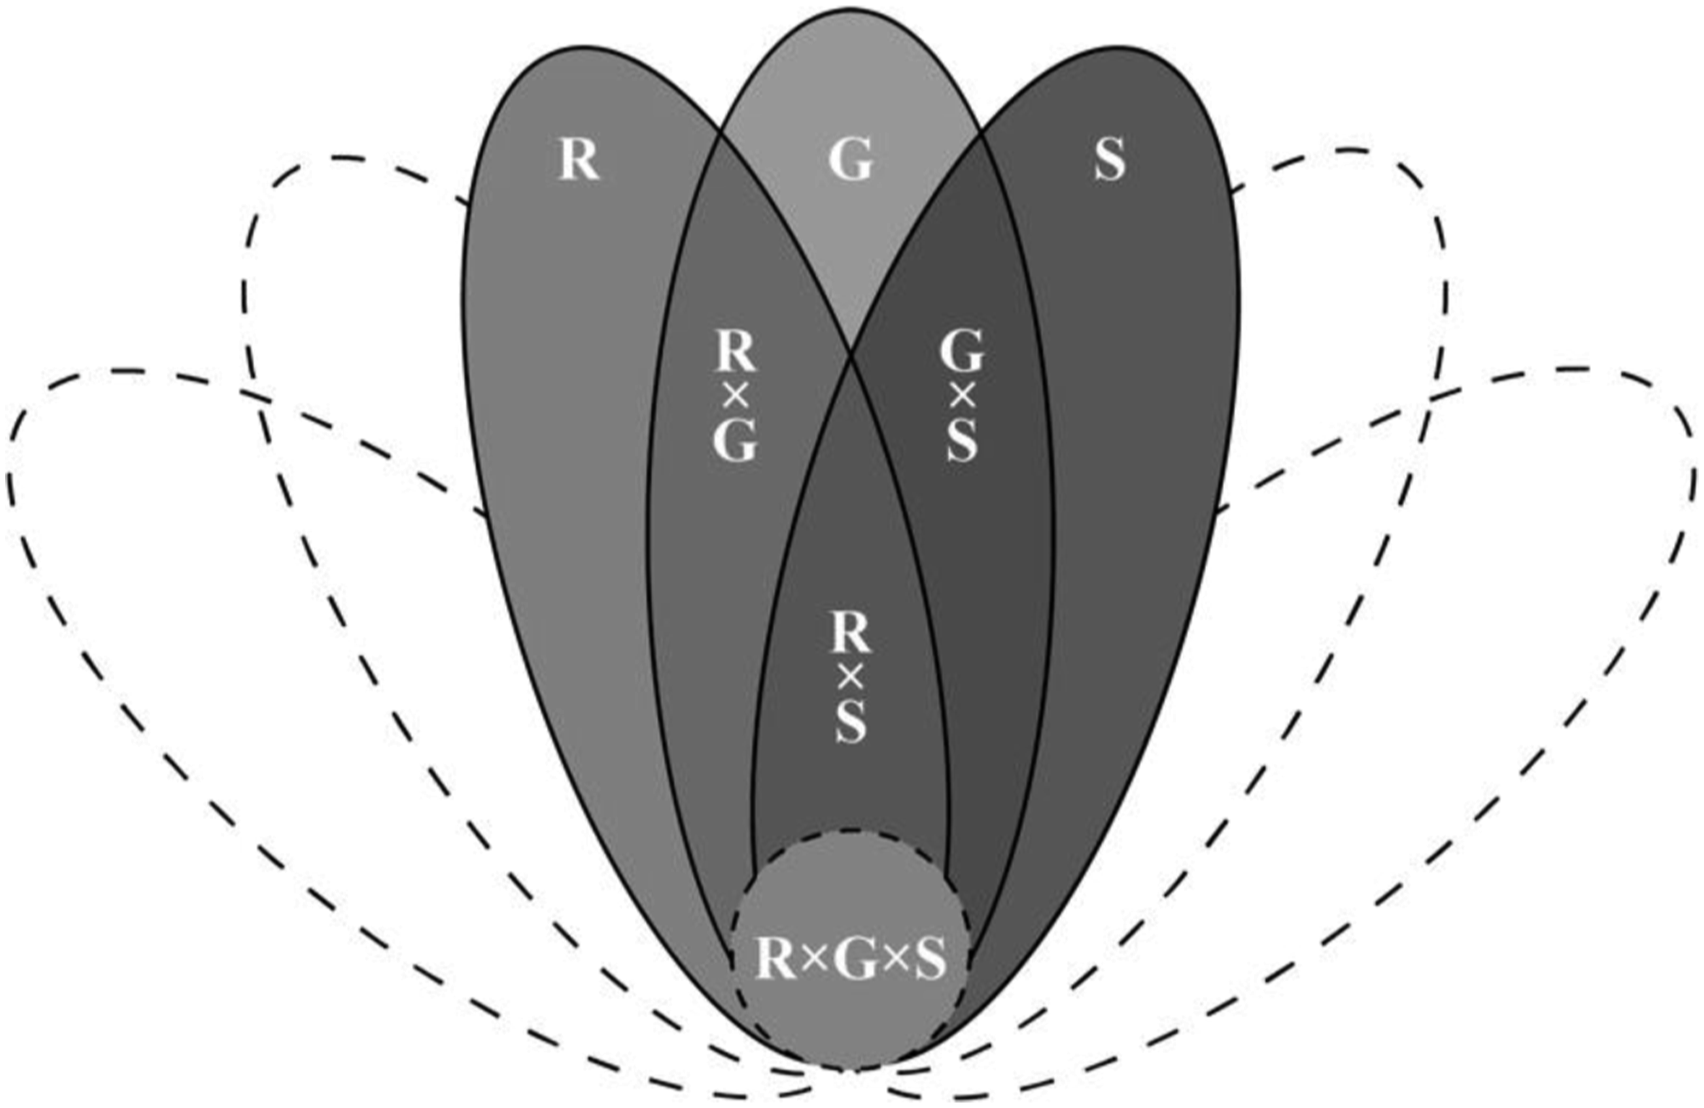
The Present Study
Capitalizing on a sample that is culturally diverse in regard to gender, race, and social class, we pursued four confirmatory research goals in the current study. First, we identified the normative trajectory of university belonging among students in our sample through three timepoints canvassing 4 years of college. Based on previous findings, we expected that the average levels of students’ university belonging remained stable over time. Second, we examined individual differences in the initial levels and the rates of change of university belonging through college. We hypothesized that both the initial level and the rate of change differed significantly among college students (Strayhorn, 2018).
Third, we examined whether the individual differences could be explained by three important social identities: socioeconomic status, gender identity, and race. We hypothesized that the differences in the initial levels and rates of change of university belonging through college can be partially predicted by the three social identities. Based on previous findings, we expected to see lower initial levels and slower change patterns of university belonging among female and economically disadvantaged students (Gillen-O’Neel & Fuligni, 2013; Gopalan & Brady, 2020). Based on findings from cross-sectional studies of university belonging differences by racial/ethnic group status, we hypothesized lower initial levels and slower change patterns of university belonging among students of color (e.g., Black/African American students) compared to white students.
Fourth, we examined interactions of the aforementioned three social identities in understanding the trajectories of university belonging. Intersectionality theory asserts that oppressions experienced based on one’s identities are not simply additive (based on singular dimensions of identity) and are unique to the intersection of identities. Statistical interactions capture elements of this intersectionality. We assumed that the experiences based on social identities were not additive but, instead, varied as a function of combinations with other social identities. We tested main “effects,” two-way interaction “effects,” and the three-way interaction “effects” on the trajectories of university belonging (“effects” is in quotes to emphasize that it is not the identities, but rather identity-based oppressions, that affect belonging). Although two-way interactions were commonly investigated in empirical studies, the three-way interaction was not. Therefore, we anticipated strong two-way interactions but made no hypothesis on the three-way interaction.
We pursued these goals by collecting longitudinal data from a sample of college students diverse in regard to race, ethnicity, gender, and social class across 4 years in college. It is worth noting that previous studies that looked at differences by racial groups typically included just a few categories (Black vs. White, for example) but we included a total of six racial groups in our analyses. By doing so we hoped to enhance the understanding of if and how university belonging changed in a variety of racial groups. In sum, our study contributes to the field by utilizing a longitudinal design to examine the effects of social identities (socioeconomic status, gender identity, and race) and their complex interactions on both the initial level and the rate of change of university belonging’s trajectories throughout college tenure.
Method
Participants
Since the primary variable of interest is sense of belonging in the university context, college students were recruited for this study. The purposive sample included 136 students (Black 16%, Latinx 15%, Asian 19%, White 34%, Native American 3%, Multiracial 13%) enrolled in one private 4-year university in western United States (Western University). Participants’ ages were calculated based on their dates of birth. All participants were between 17.7 and 21.4 years old (mean = 19 years old) when they entered the study. Approximately 36% of the participants self-reported as considering themselves to be low-income students. Females were over-represented at a rate of 61%. All demographic data were collected via self-report.
Procedure
We conducted a primary analysis of university belonging levels across three waves of quantitative student survey data (T1, T2 and T3) from a larger survey study, the Friendship Study, conducted between 2017 and 2021. Via purposive stratified sampling by race/ethnicity to gather a diverse sample, students enrolled at Western University were invited to participate in the Friendship Study on a voluntary basis. Data were collected via a consent process approved by the institution’s institutional review board (IRB). The friendship survey was administered online at seven points in time. For the purposes of this paper, three timepoints were included in data analysis: T1 (January – May 2018), T2 (January – May 2019), and T3 (January – May 2021). Due to the onset of the COVID-19 pandemic, no data were analyzed for that timepoint (Winter 2020). The remaining surveys were not included because they were distributed in September – December of each year, respectively. This is during the beginning of the academic year, which would be too soon to develop university belonging for that academic year. Thus, we only included survey data from the latter half of students’ academic years.
Measures
As noted above, the source of student-report university belonging data for the current study was the larger Friendship Survey, which was developed by the authors. The Friendship Study measured university belonging, peer relationships, and racial/ethnic identity development. For the purposes of the current study, we focused on the university belonging sub-component of this study. Cronbach’s alphas were calculated and reported below in the current sample to assess the internal consistency reliability of the key latent construct in the study: university belonging.
University Belonging
University belonging was measured using an adapted version of the Sense of Social Fit scale (Walton & Cohen, 2007). Response options were on a 7-point Likert scale from (1) strongly disagree to (7) strongly agree, with items such as “People at Western University accept me” and “I belong at Western University.” Based on results of recent factor analytic studies of this measure, we computed a total scale score with all 17 items (Maghsoodi et al., 2023), with higher scores indicating higher levels of university belonging. At each wave of the measurement, the scale demonstrated good internal reliability (Cronbach’s α = 0.92, 0.92, 0.89 at time 1, 2, and 3) and was similarly reliable for each gender group (α = 0.89, 0.91), income group (α = 0.90, 0.92), and racial group (α = 0.83–0.93).
Demographics
Students responded to a series of questions regarding demographic characteristics, including gender (“How do you identify in terms of your gender?”), race (“How do you racially/ethnically identify?”), and socioeconomic status (SES; “Do you consider yourself to be low income?”). We dummy-coded gender identity (female = 1; male = 0) based on students’ responses. Answers like “non-binary female” or “non-binary male” were coded as 1 or 0, respectively. We also dummy-coded SES (“yes” = low-income = 1; “no” = higher-income = 0) and used SES interchangeably with “income status” in the following text. For race, we created a dummy variable for each racial category (i.e., African American/Black, Asian, Latino, Native, White, and Multiracial).
Statistical Analyses
The statistical methods in this study were chosen to pursue the four major goals discussed above. All statistical analyses, including data pre-processing and power calculations were conducted in the R statistical software (R Core Team, 2020). The path diagram of the latent growth curve models was drawn using the freely available online software WebSEM (Zhang et al., 2012).
Modeling Longitudinal Data
We performed latent growth curve modeling (LGCM; Duncan et al., 1999) to model the trajectories of university belonging throughout college. The present study used two types of LGCM models: (1) unconditional LGCM in which the change patterns of university belonging were modeled using an intercept and a slope, and (2) conditional LGCM in which social identities were included as predictors. We first specified an unconditional LGCM to examine the normative trajectory and the heterogeneity in the individual trajectories of university belonging. A path diagram of this model is shown as Model A in Figure 2. With three measurement waves we specified a linear pattern for the normative trajectory which was characterized by two growth factors: intercept and slope. The intercept represented the initial level of university belonging when students first entered college and the slope represented the linear rate of change of university belonging through college. Both the intercept and slope were latent growth factors in LGCMs and were allowed to vary for all participants. The means of the intercept and the slope factors estimated the average initial level and the average rate of change of all participants, whereas their variances estimated how variable the initial levels and rates of change differed from person to person. We also examined whether there was a correlation between the initial level and the rate of change. This helped us test whether the “Matthew effect” took place that students who had higher initial levels increased their university belonging levels faster in college. To identify the LGCMs, the intercept factor was fixed to have equal loadings of 1.0. The slope factor was fixed to have loadings of 0, 1, and 3, corresponding to the three measures of university belonging at T1 (2018), T2 (2019), and T3 (2021). Path diagram of unconditional LGCM (model A) and conditional LGCMs (model B and model C). Note. Model A = Unconditional LGCM without the influence of social identities. Model B = Conditional LGCM with main effects of social identities. Model C = Conditional LGCM with both the main effects and the interaction effects of social identities.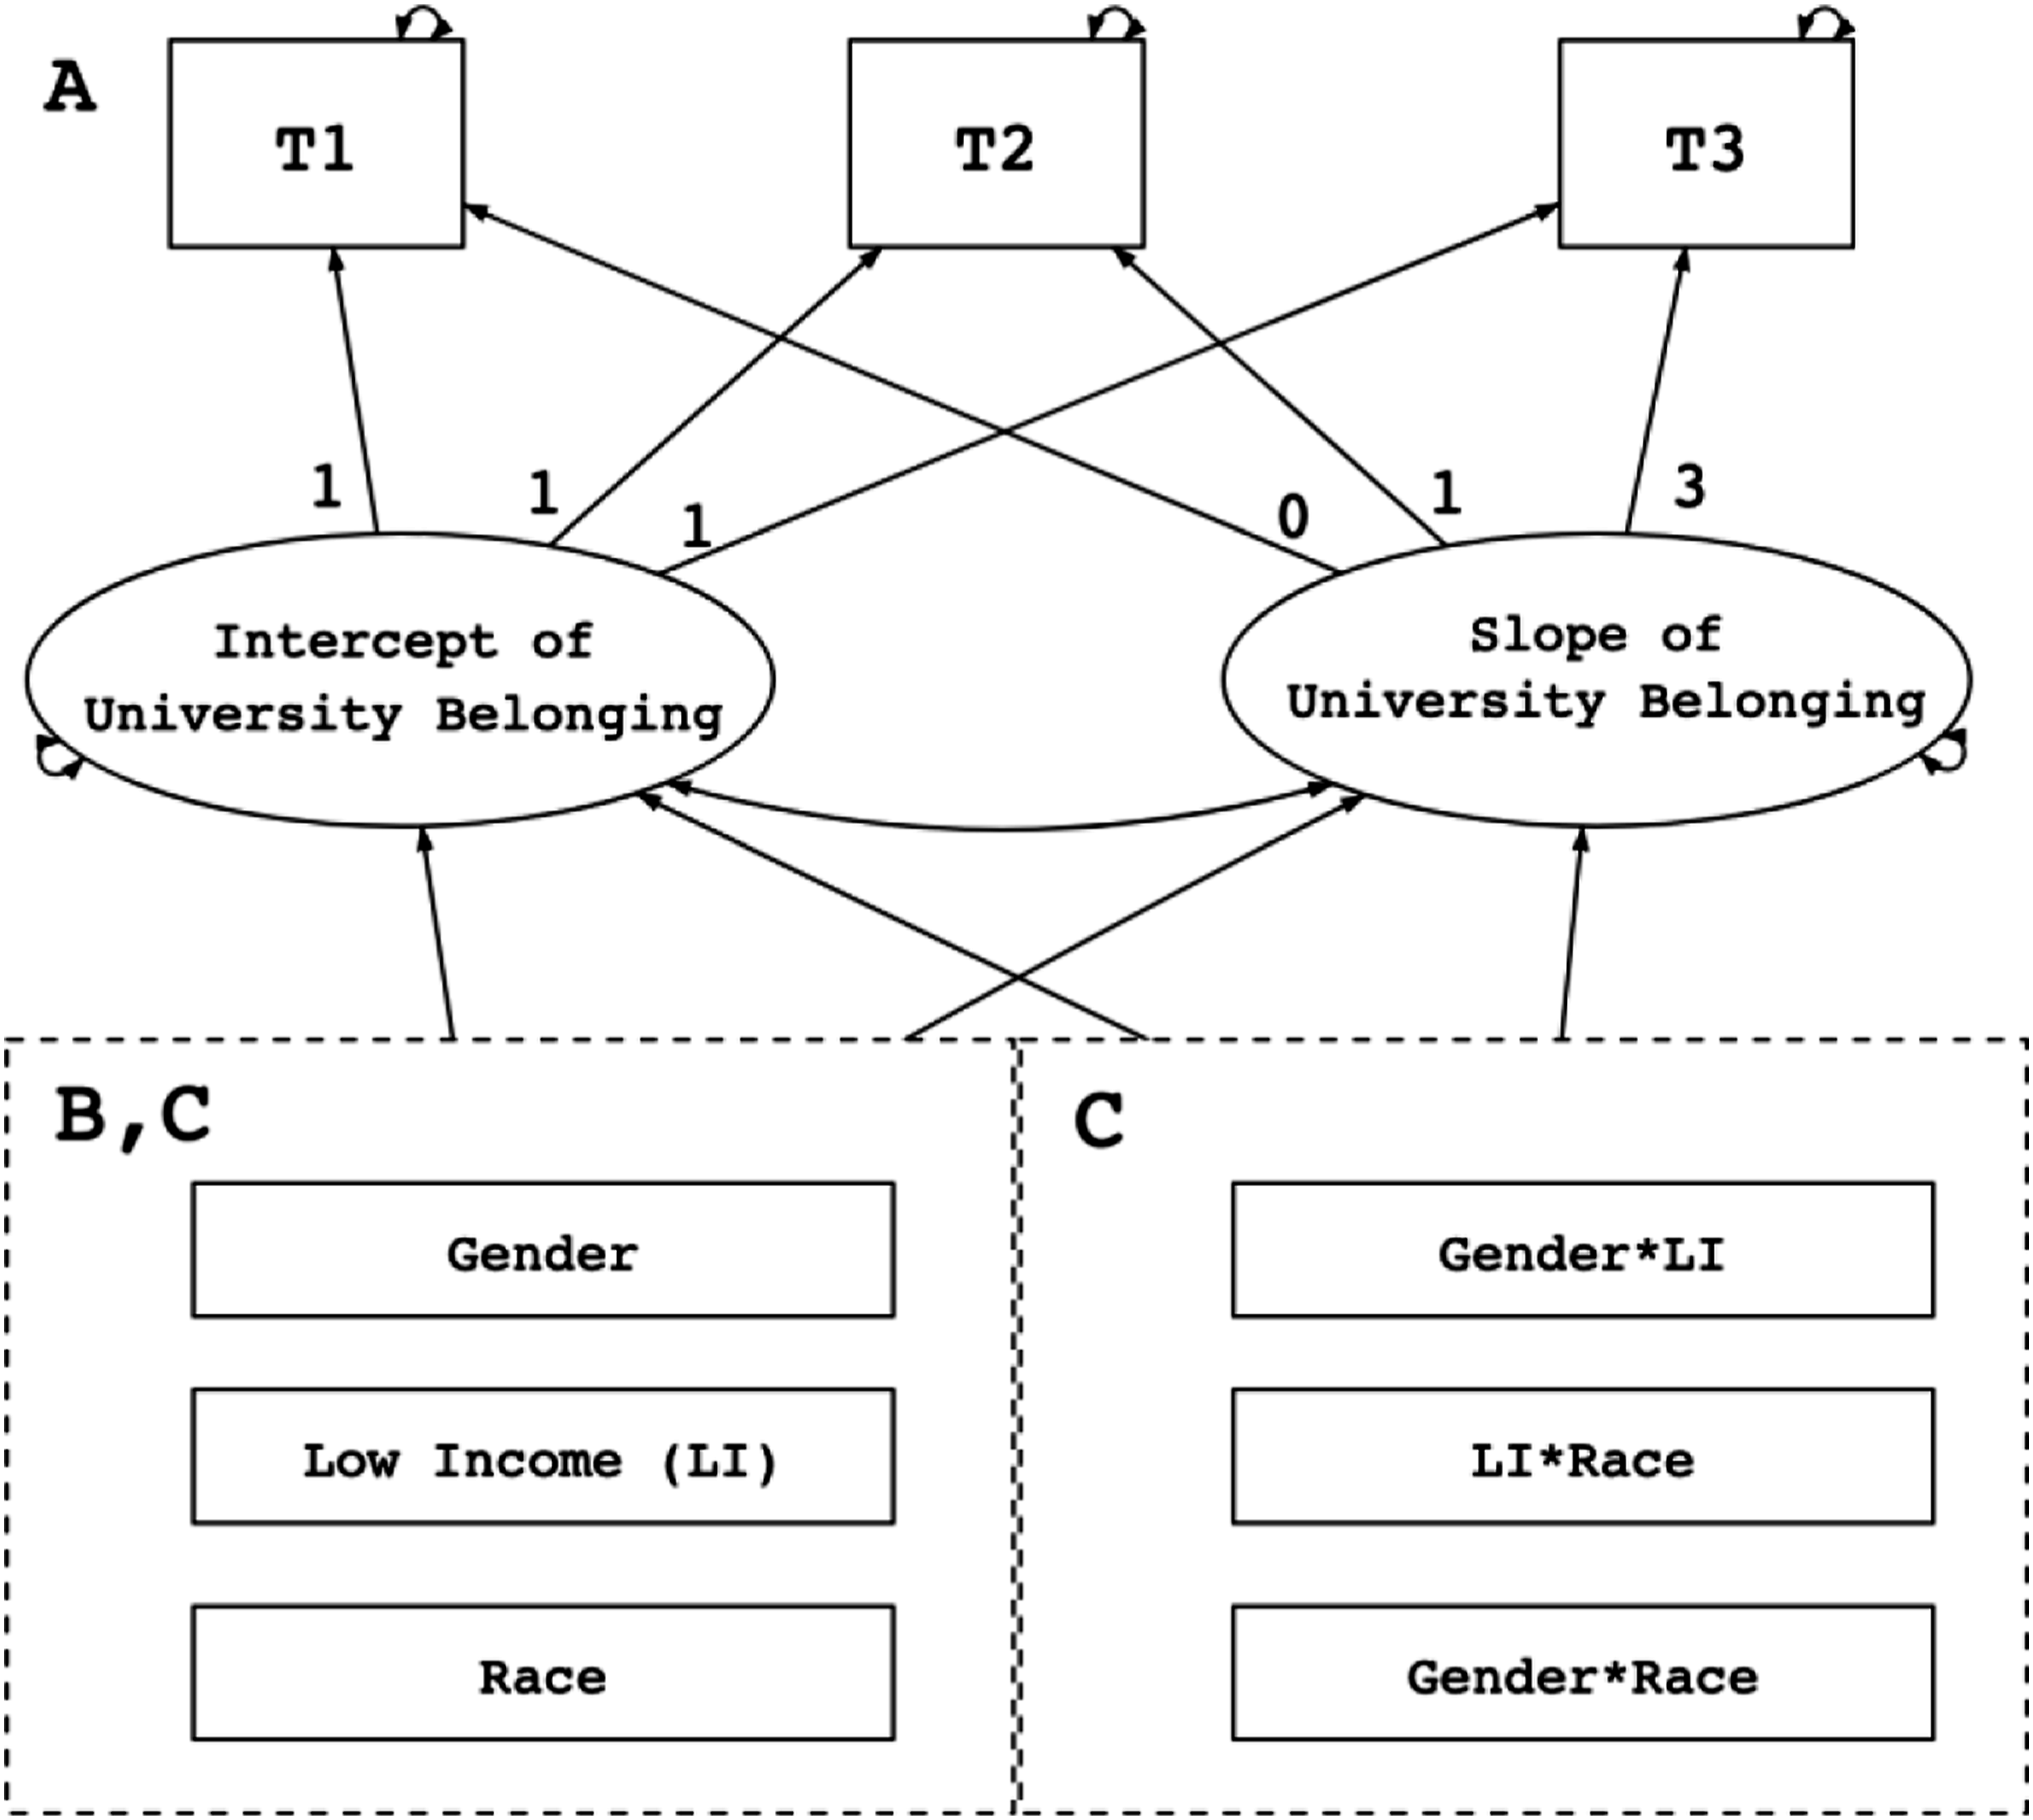
Using the same unconditional model, we specified two conditional LGCMs to test the main effects (Model B) and the interaction effects (Model C) of social identities on the intercept and slope factors of individual trajectories. The path diagram of Model B and Model C were also presented in Figure 2. To test the main effects of income status and gender identity, we dummy coded income (low-income = 1; higher-income = 0) and gender (female = 1; male = 0). To test the main effect of race, we created six dummy variables for this polytomous nominal variable, representing African American (AA), Asian, Latino, Native, Multiracial, and White populations, respectively. To test the two-way interactions among the three social identities, we created one product term for the income*gender interaction, six product terms for the income*race interaction, and six product terms for the gender*race interaction. For all effects that involved race, each racial category was rotated as the reference category and the remaining five categories were entered into the model, making all pairwise comparisons possible.
For all LGCMs, robust maximum likelihood (MLR) was used to handle the potential non-normal distributions of the observed variables. MLR used (1) sandwich-type standard errors to test the significance of parameter estimates and (2) robust fit statistics to provide better control of Type I errors and power when evaluating the overall model fit. An LGCM was considered as an acceptable fit if (1) robust comparative fit index (CFI) is 0.95 or greater and (2) standardized root mean residual (SRMR) is 0.08 or smaller, and was further considered as a good fit if (3) the robust Yuan-Bentler χ2 statistic is insignificant (Hu & Bentler, 1999; Wu & West, 2010; Yuan & Bentler, 2000).
Missing Data
A total of 158 students were recruited to participate in this longitudinal study across three measurement waves (T1, T2, and T3). Of the 158 participants, 18 students (33% low-income; 33% male; 39% White) provided information on their social identities but did not provide any information on their university belonging levels, leaving 140 students who participated in at least one of the measurement waves. Of the 140 participants, 4 students were removed from the study for the lack of data on income status, yielding 136 participants with complete data on social identities (36% low-income; 39% male; 34% White) and at least one measure of university belonging. The primary reason for missing data is non-response. Chi-squared tests showed that there were no significant differences between participants who were removed or observed in the study with respect to income status (χ2(1) < 0.01, p = 1.00), gender (χ2(1) < 0.01, p = 1.00), and race (χ2(5) = 3.70, p = 0.60).
We included the 136 participants in our final sample. Among the 136 participants, 66 students participated in all three measurement waves (29% low-income; 33% male; 38% White), 43 students participated in two measurement waves (42% low-income; 40% male; 35% White), and 27 students participated in one measurement wave (44% low-income; 52% male; 22% White). Although there was a tendency for low-income, male, and non-White students to have a higher proportion of missing data, the tendency was not statistically significant with respect to income status (χ2(2) = 2.97, p = 0.23), gender (χ2(2) = 2.77, p = 0.25), and race (χ2(10) = 10.04, p = 0.44).
Across the three measurement waves, 110 participants provided complete responses at T1, 89 participants provided complete responses at T2, and 112 participants provided complete responses at T3. Chi-squared tests found no significant differences between participants measured at the three waves with respect to income status (χ2(2) = 0.10, p = 0.95), gender (χ2(2) = 0.34, p = 0.84), and race (χ2(10) = 3.83, p = 0.95). There is no missingness at the item level. Participants typically spent less than 10 minutes on the survey and provided complete responses to all 17 items on the Sense of Social and Academic Fit scale.
To address the missing university belonging responses of participants who were not completely measured at all three waves, we used full-information maximum likelihood (FIML) when estimating model parameters in LGCMs. Compared with deletion and imputation methods, FIML used all available data to construct a likelihood function on a case-wise basis so that participants who were not completely measured at all time points can still be included in the estimation process. FIML yields unbiased and efficient parameter estimates under the assumption of ignorable missingness (i.e., missing completely at random and missing at random) (Enders & Bandalos, 2001; Newman, 2003). As a test of this assumption, we performed Little’s MCAR test (Little, 1988) on the final sample and decided to retain the null hypothesis that the university belonging data were missing completely at random (MCAR) (χ2(33) = 32.57, p = 0.49). Little’s MCAR test was conducted using the R package naniar (Tierney et al., 2019) and FIML was employed using the R package lavaan (Rosseel, 2012).
Sample Size
It is worth noting that the sample size of the study (N = 136) and the subgroup sizes may limit the generalization of the results and undermine the chances that effects get detected in interactive models. Therefore, we have dropped a subgroup with limited sample size (i.e., Native students) from the interactive-effects models. Additionally, as one of the first studies that took a quantitative approach to explore the university belonging yearly changes over time among students with various intersectional and minoritized identities, the current study focused on identifying patterns and trends. To help the readers assess the sizes of the effects, we provided standardized parameter estimates, standard errors, and p-values in the supplementary tables.
Pandemic Statement
The COVID-19 pandemic has made a profound impact on psychological and educational processes. Our understanding of this impact is still in development. Moreover, we have yet to fully understand how the pandemic has influenced various aspects of the research process – from how researchers conceptualize studies, how past theoretical frameworks do (or do not) apply, and the validity of psychological measurements. One wave of data for this study (T3) was collected during the COVID-19 pandemic, and research suggests that the university belonging measure used in this study remained a valid measure of university belonging during the COVID-19 pandemic (Maghsoodi et al., 2023). Still, we recommend that researchers continue to study the effects of the COVID-19 pandemic on students' experiences of—and psychologists’ measurement of—university belonging.
Results
Descriptive Statistics
Descriptive Statistics of University Belonging by Measurement Waves and Social Identities.
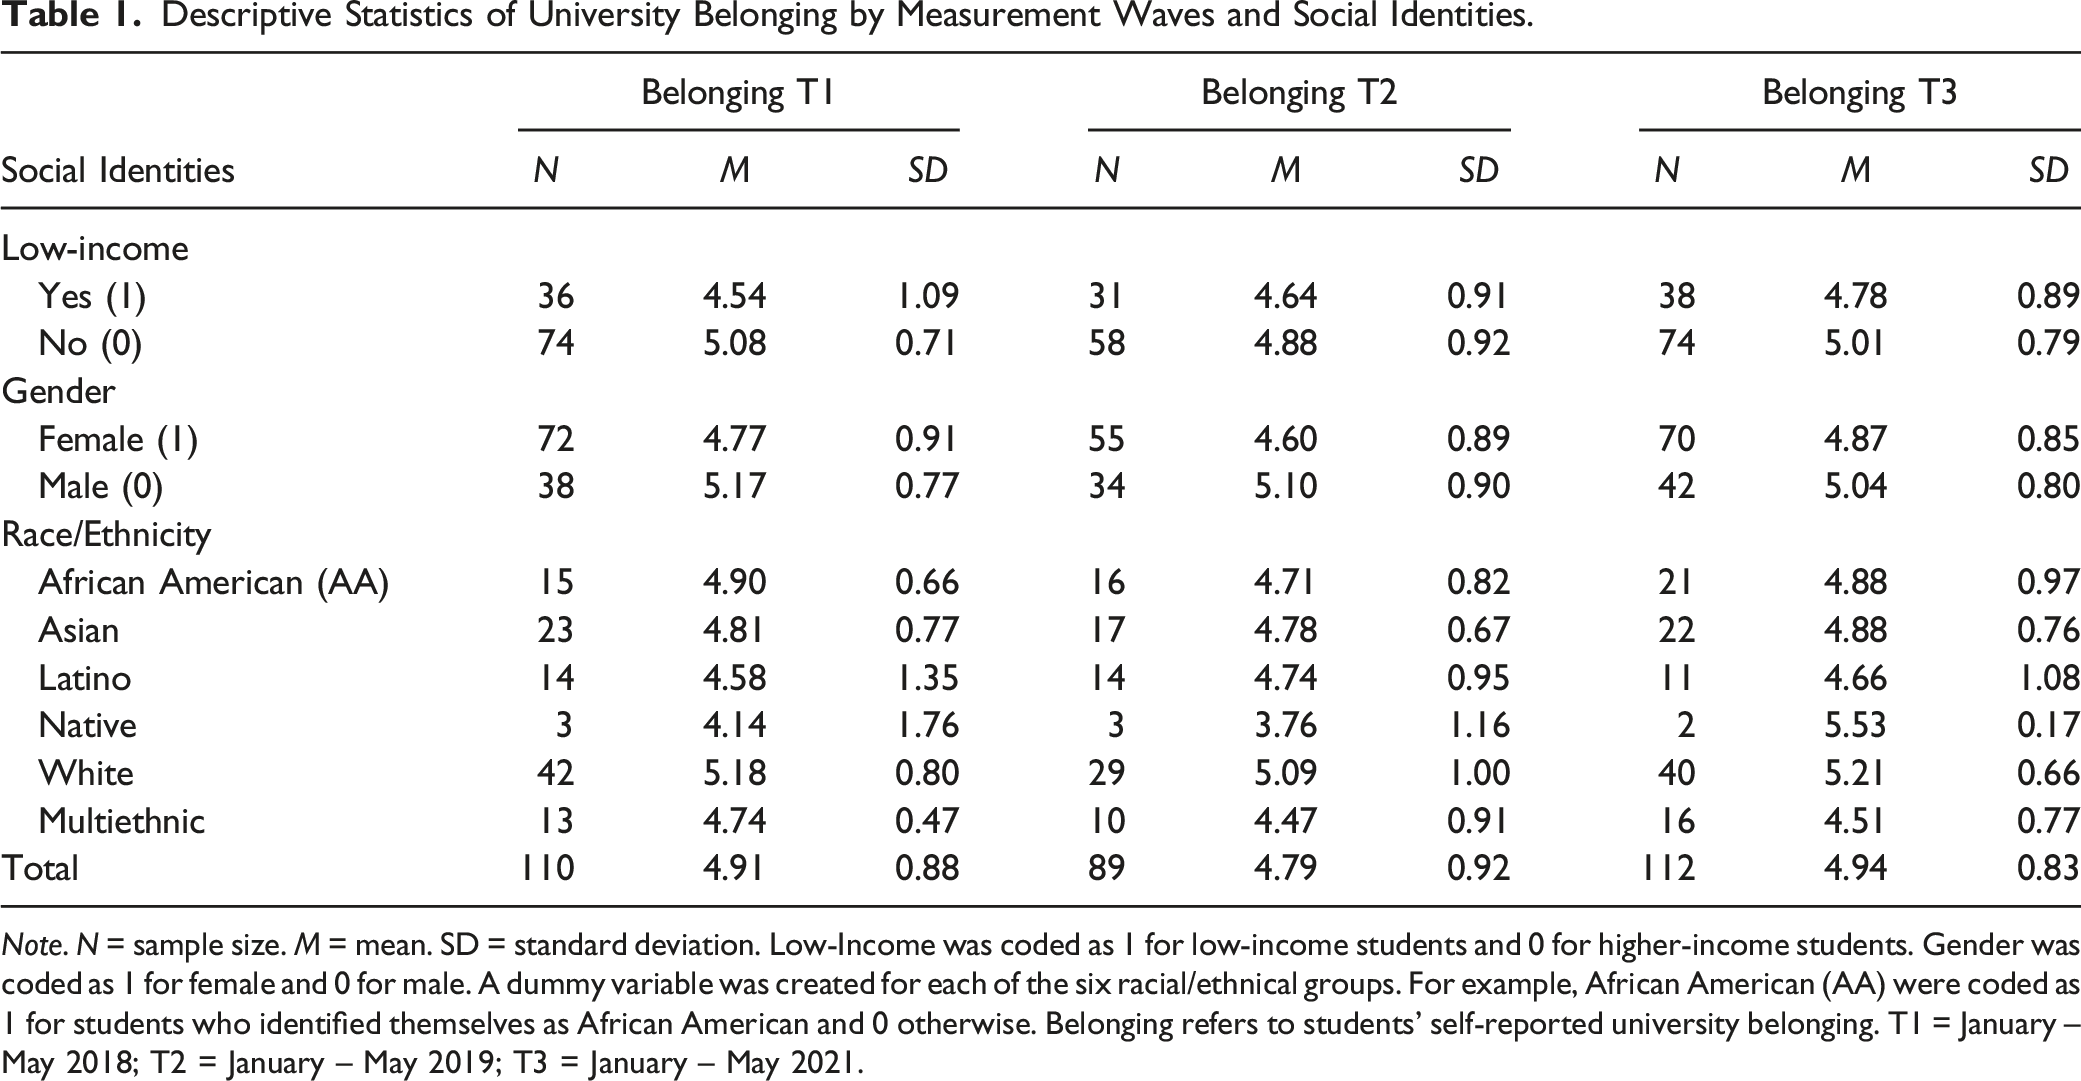
Note. N = sample size. M = mean. SD = standard deviation. Low-Income was coded as 1 for low-income students and 0 for higher-income students. Gender was coded as 1 for female and 0 for male. A dummy variable was created for each of the six racial/ethnical groups. For example, African American (AA) were coded as 1 for students who identified themselves as African American and 0 otherwise. Belonging refers to students’ self-reported university belonging. T1 = January – May 2018; T2 = January – May 2019; T3 = January – May 2021.
Across all three measurement waves, the levels of university belonging remained relatively stable for college students regardless of their income status, gender, and race. The only exception is Native students, whose university belonging levels changed from the lowest at T1 and T2 to the highest at T3. This change pattern is likely due to sampling error associated with the low sample size of Native students, which further caused model convergence problems in conditional LGCMs. Therefore, Native students were only included in the main-effects LGCM (Model B) but not in the interactive-effects LGCM (Model C).
A visual inspection of individual growth curves is recommended to determine the shape of changes in longitudinal modeling (Fidell & Tabachnick, 2003). The spaghetti plot in Figure 3 showed that the normative university belonging trajectory (in blue) was roughly linear between T1 and T3, although there was a substantial amount of variation in initial levels and to a lesser extent on the rates of change of individual trajectories. This indicated that a linear trend was appropriate to be assumed in LGCMs and the initial level and the rate of change should be allowed to vary across individuals. Spaghetti plot of individual trajectories of university belonging.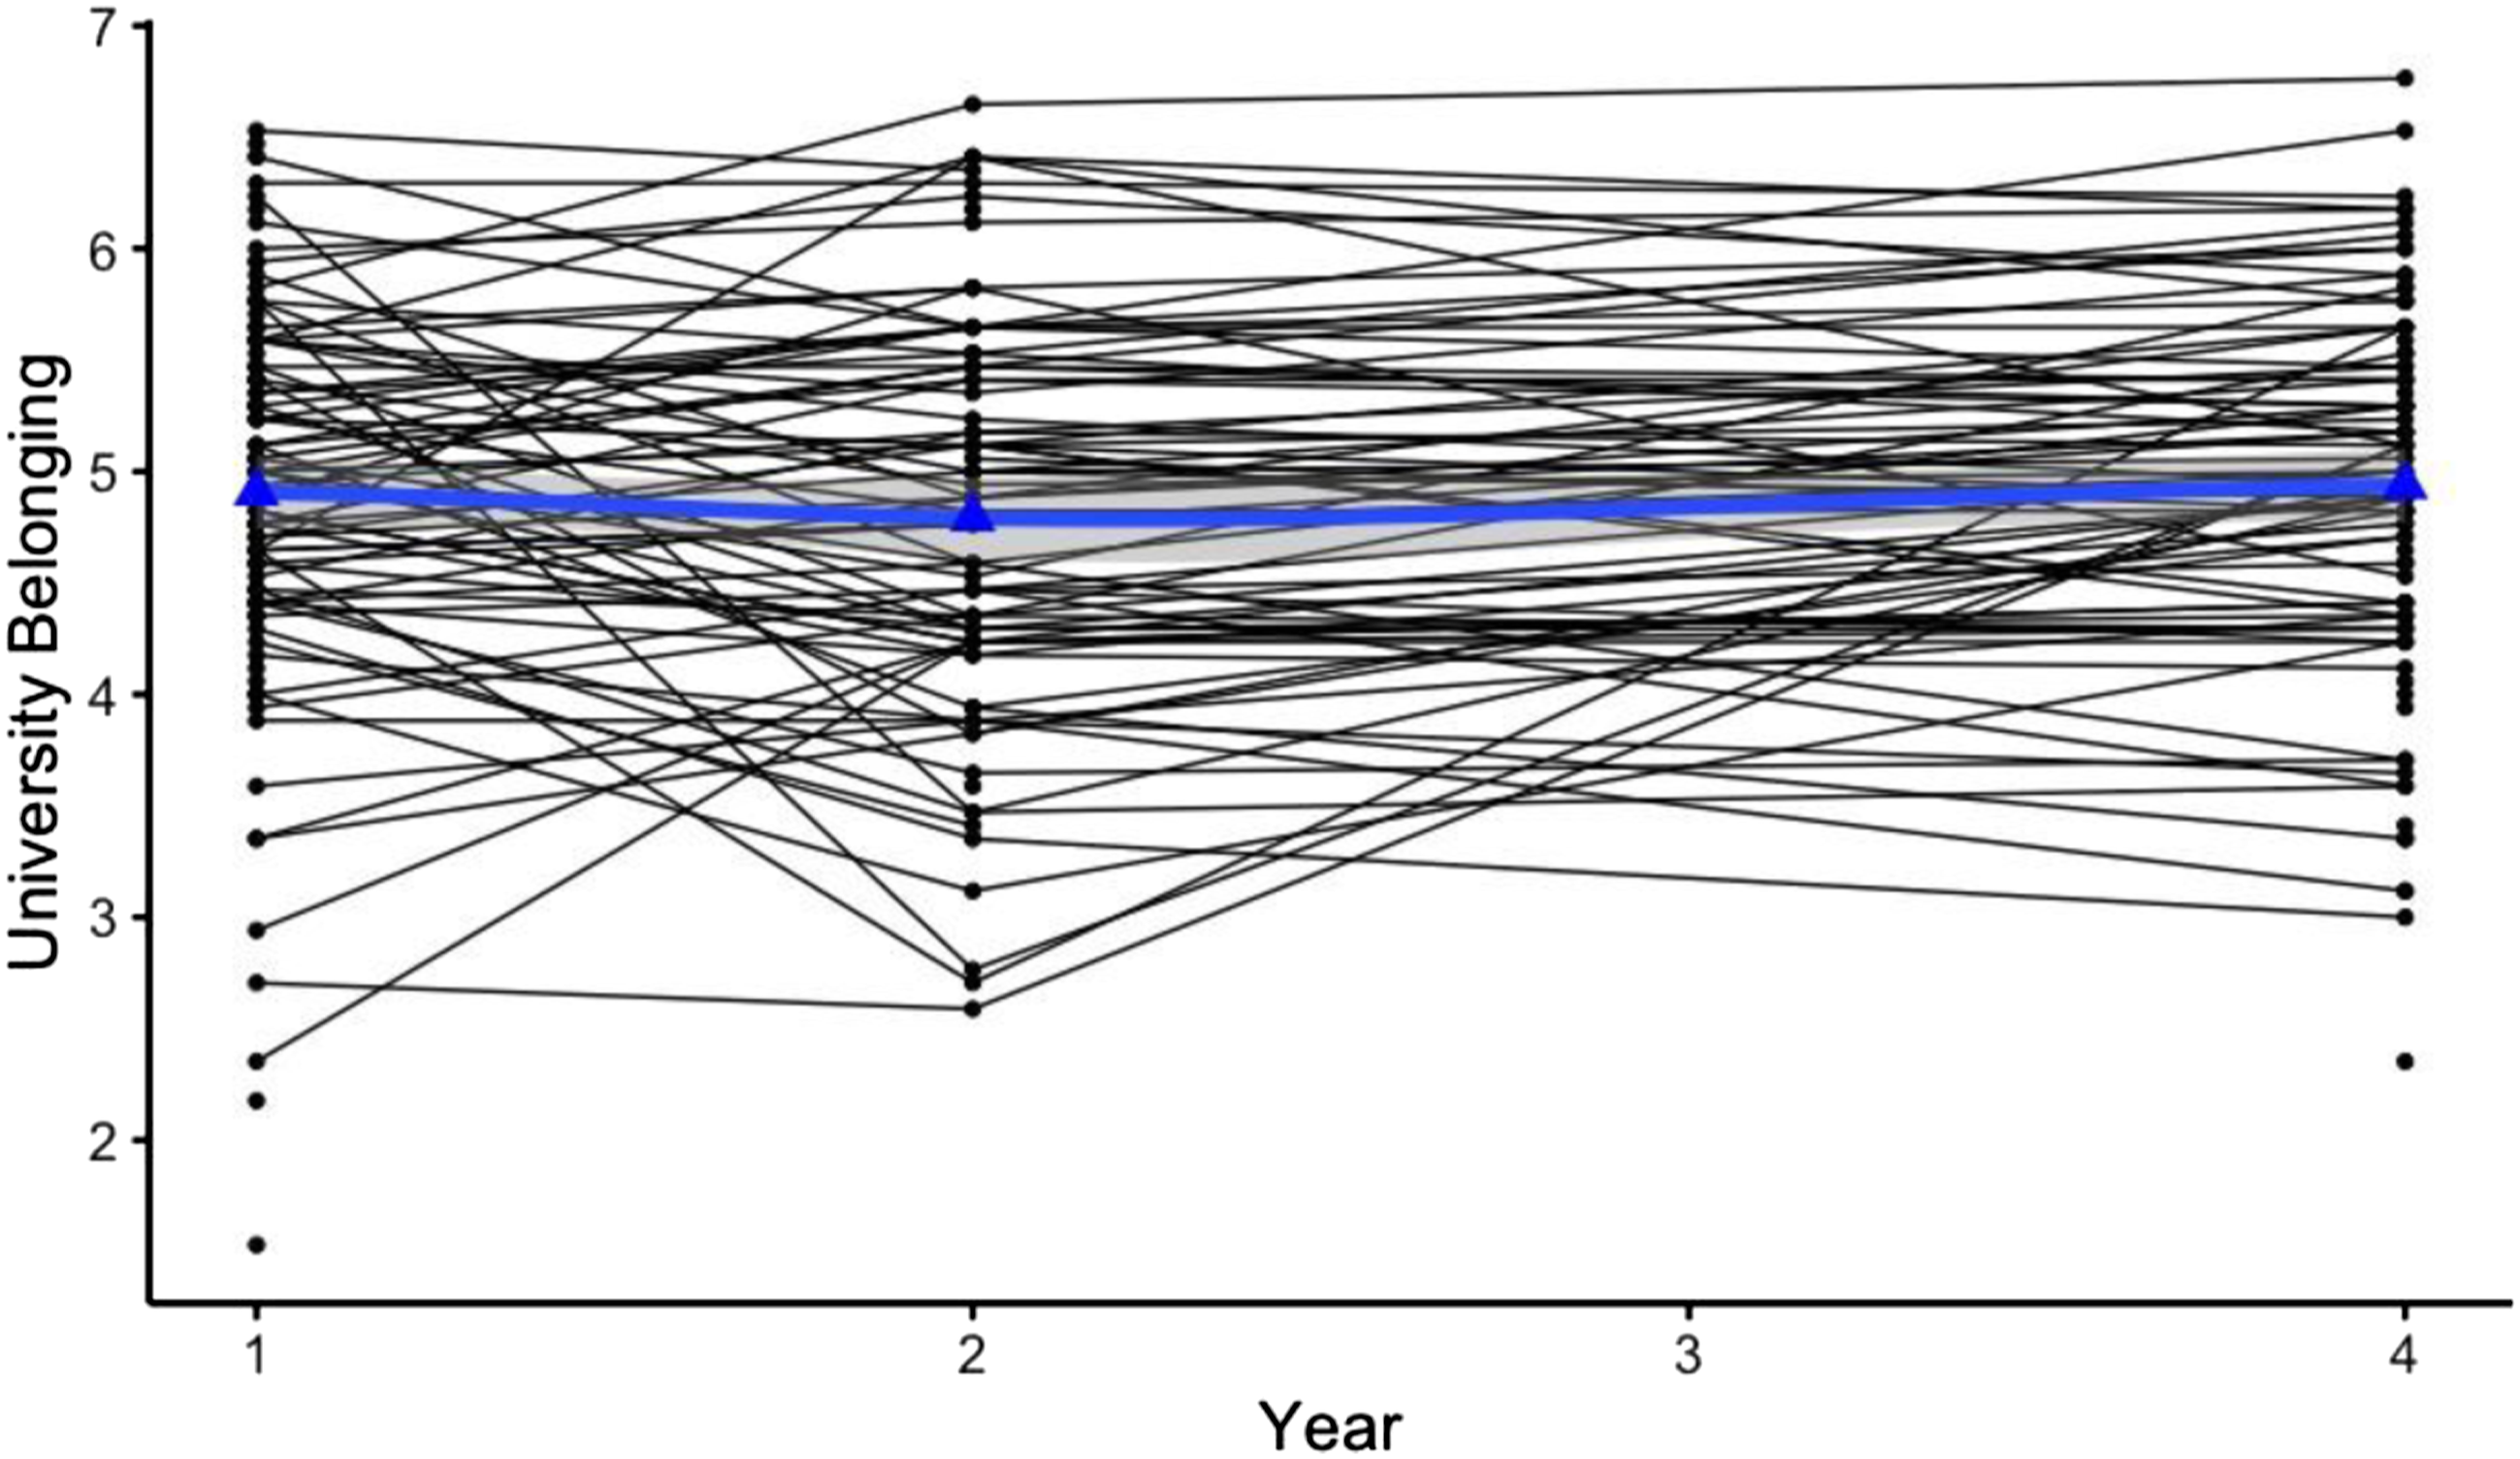
Unconditional LGCM
Unconditional LGCM and Main-Effects Conditional LGCMs With Rotating Reference Racial Groups.
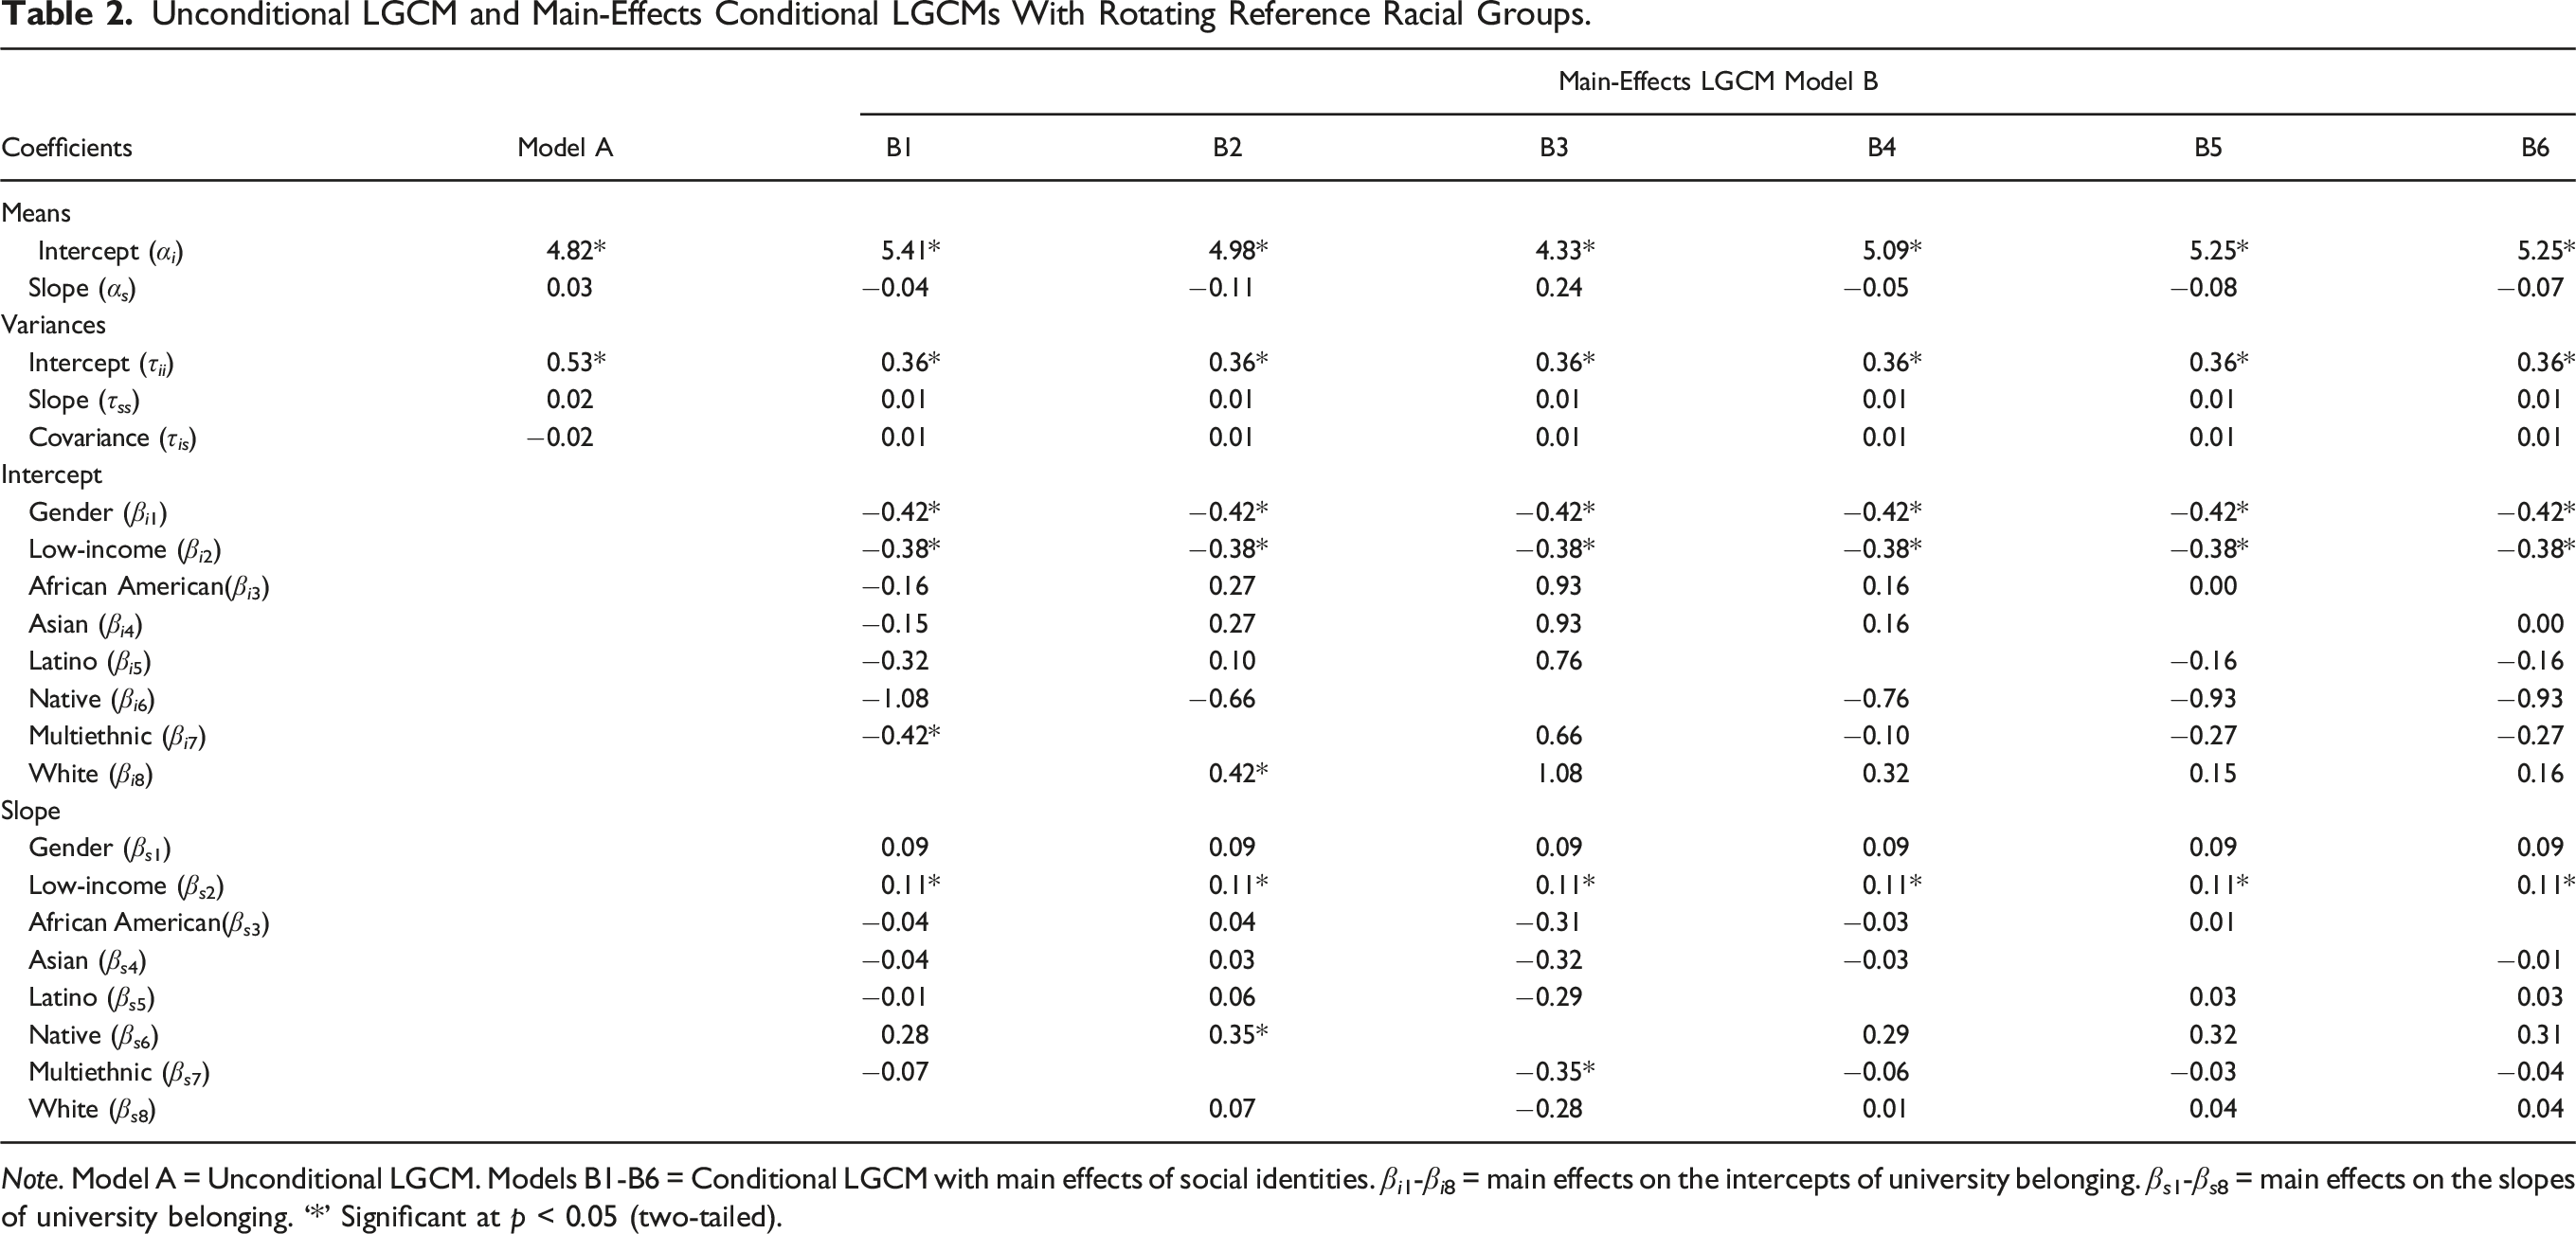
Note. Model A = Unconditional LGCM. Models B1-B6 = Conditional LGCM with main effects of social identities. βi1-βi8 = main effects on the intercepts of university belonging. βs1-βs8 = main effects on the slopes of university belonging. ‘*’ Significant at p < 0.05 (two-tailed).
Conditional LGCMs
Main Effects
Following the unconditional LGCM, a conditional LGCM was fit to examine the first-order main effects of the three social identities as predictors on the intercepts and the slopes of individual trajectories. Since there were six racial groups, we tested six main-effects conditional LGCMs by rotating the reference group so that pairwise comparisons among all the racial groups can be made. Models B1-B6 in Table 2 presented parameter estimates for each of the six models with White, Multiracial, Native, Latino, Asian, and African American (AA) as the reference groups, respectively. All parameter estimates were tested using Wald’s tests (Wald, 1943) and we will only interpret significant results (p < 0.05) below. For simplicity, standardized parameter estimates and standard errors of the parameter estimates were not included in Table 2 but can be found in the supplementary tables. The six conditional LGCMs were reparameterizations of the same conditional LGCM, which had a good model fit (Yuan-Bentler χ2(8) = 10.83, p = 0.21, CFI = 0.97, SRMR = 0.03).
In each of Models B1-B6, female students reported significantly lower levels of university belonging than male students when they entered college at T1 (βi1 = −0.42, SE = 0.15, p < 0.01), whereas no gender differences were found in the linear rates of change from T1 to T3 (βs1 = 0.09, SE = 0.05, p = 0.07). Low-income students experienced lower university belonging than their higher-income peers at T1 (βi2 = −0.38, SE = 0.16, p = 0.02), yet their university belonging increased faster from T1 to T3 (βs2 = 0.11, SE = 0.05, p = 0.02). The only racial difference was between Multiracial and White students: belonging levels were significantly different at T1 (Multiracial lower than White by βi7 = −0.42, SE = 0.19, p = 0.03 in Model B1).
Interaction Effects
Conditional LGCMs with Two-way Interaction Effects with Rotating Reference Racial Groups.
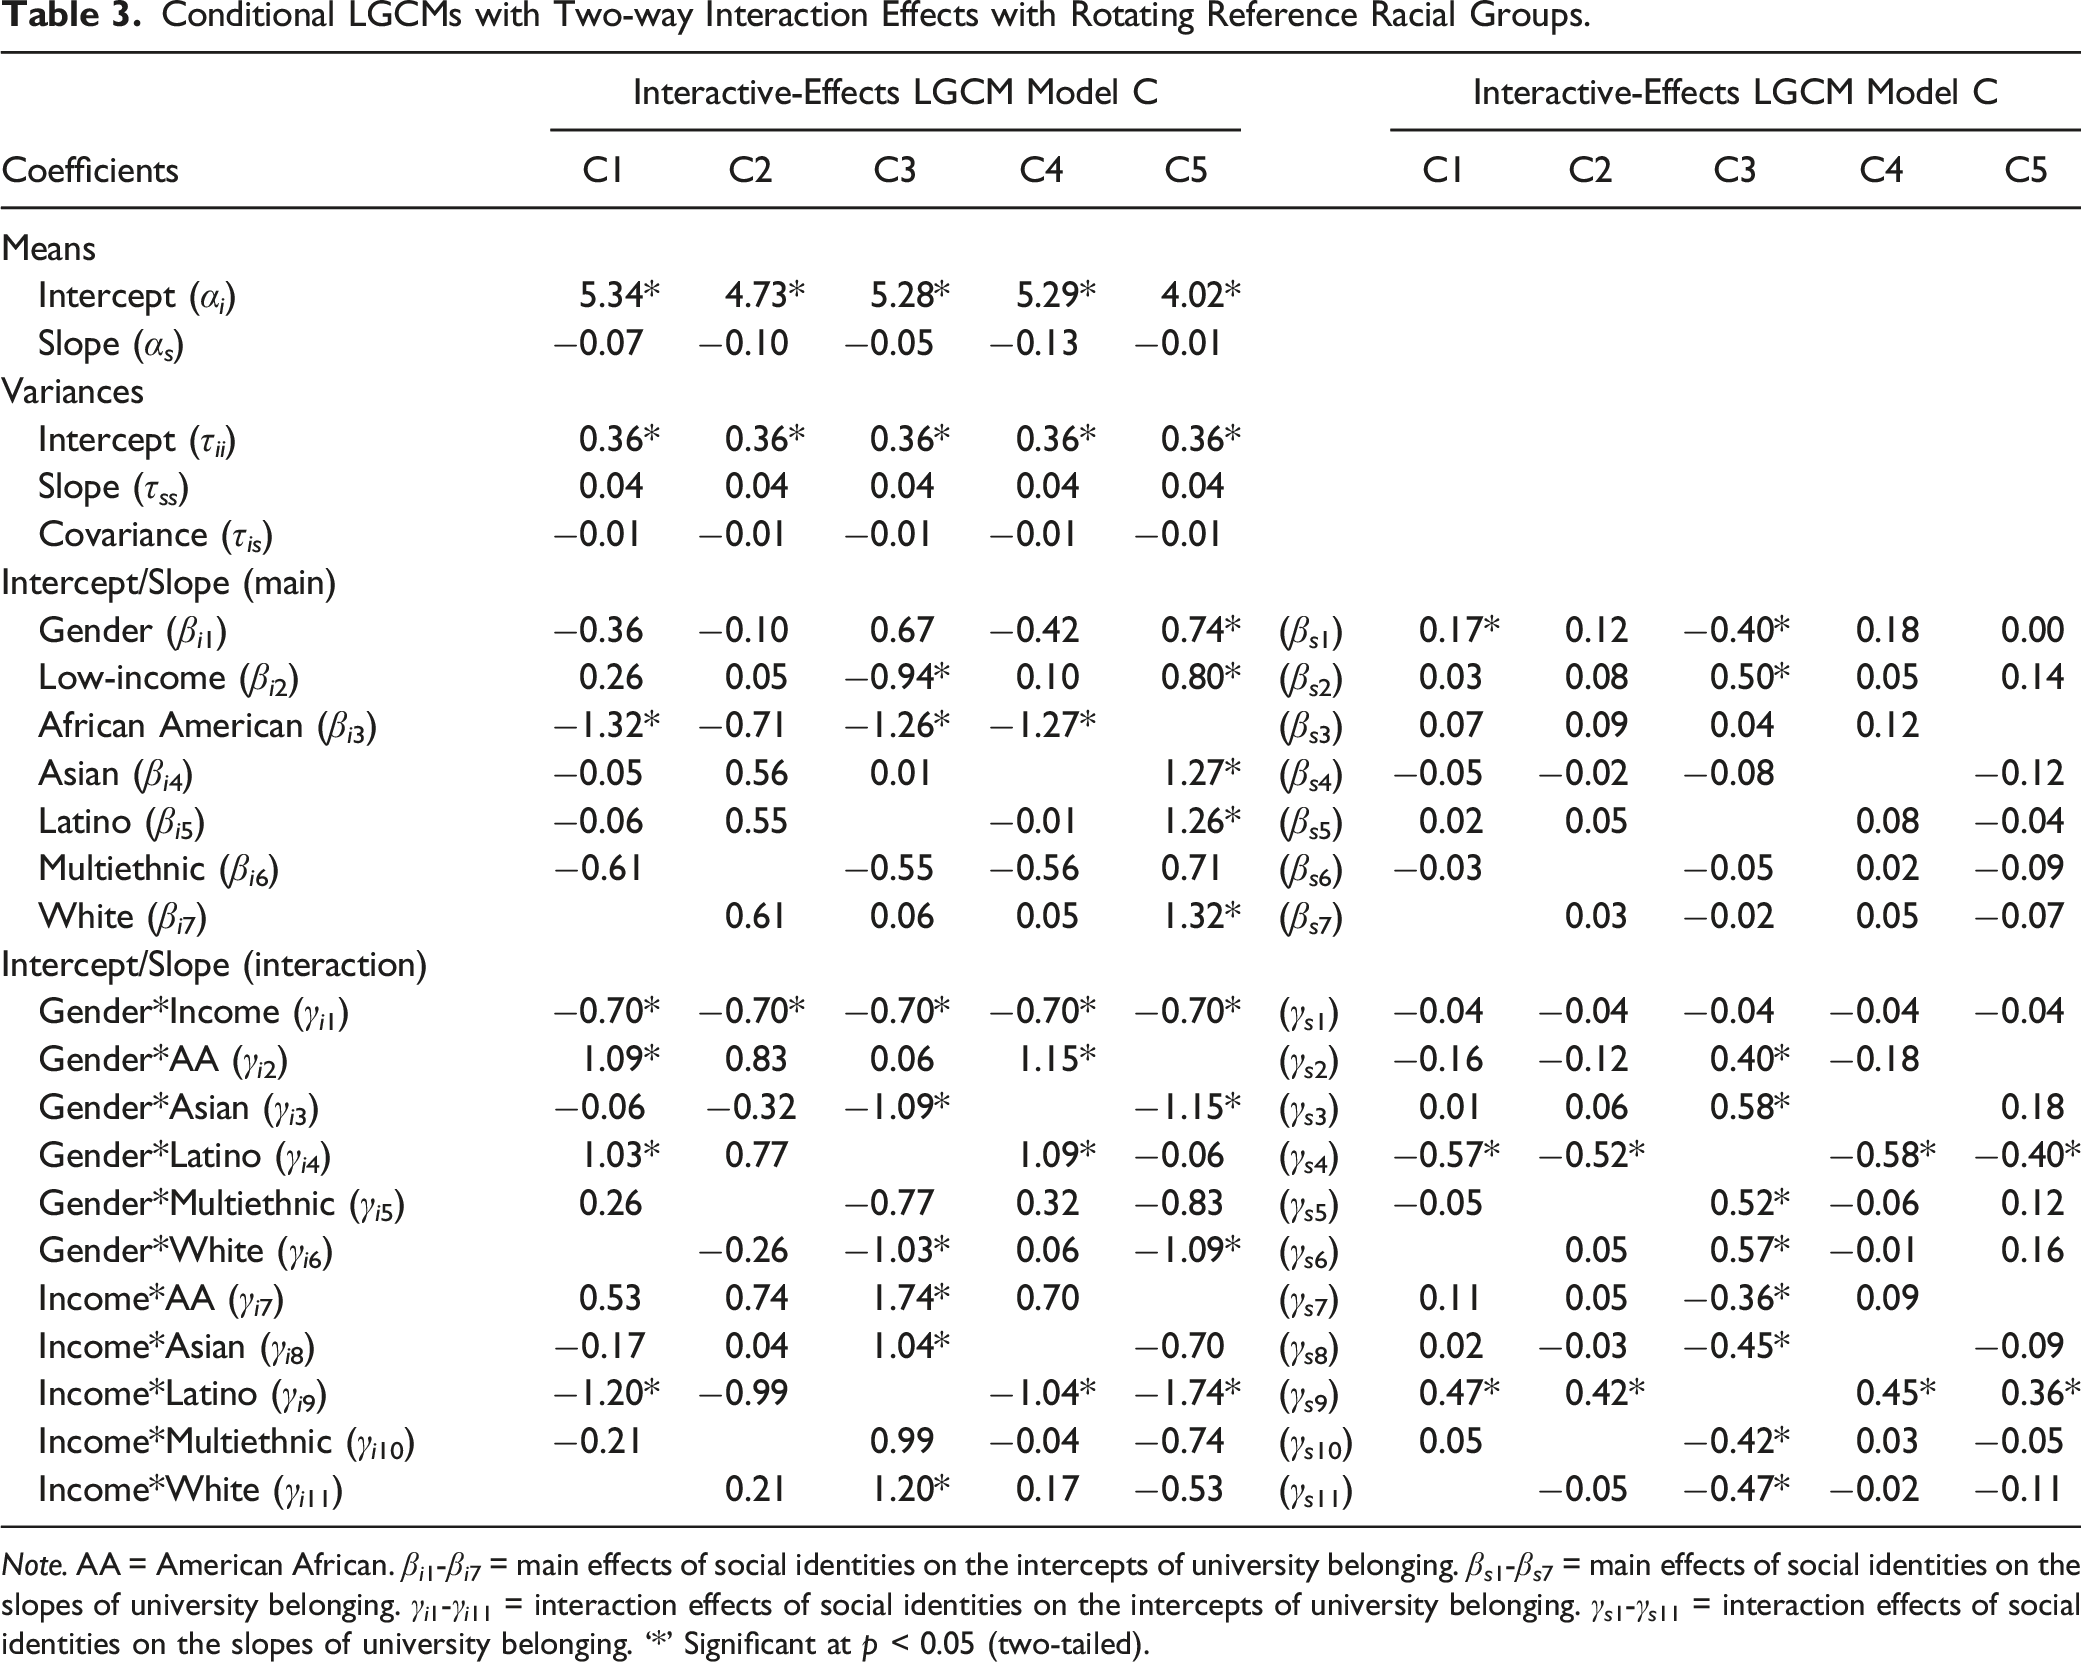
Note. AA = American African. βi1-βi7 = main effects of social identities on the intercepts of university belonging. βs1-βs7 = main effects of social identities on the slopes of university belonging. γi1-γi11 = interaction effects of social identities on the intercepts of university belonging. γs1-γs11 = interaction effects of social identities on the slopes of university belonging. ‘*’ Significant at p < 0.05 (two-tailed).
To further understand the two-way interaction effects in Table 3, we classified students into subgroups based on their social identities and plotted the projected trajectories for each subgroup in Figure 4. In the figure, the levels of university belonging at T1 reflected the intercepts and the linear rates of change from T1 to T3 reflected the slopes. Projected trajectories of university belonging for each subgroup based on social identities.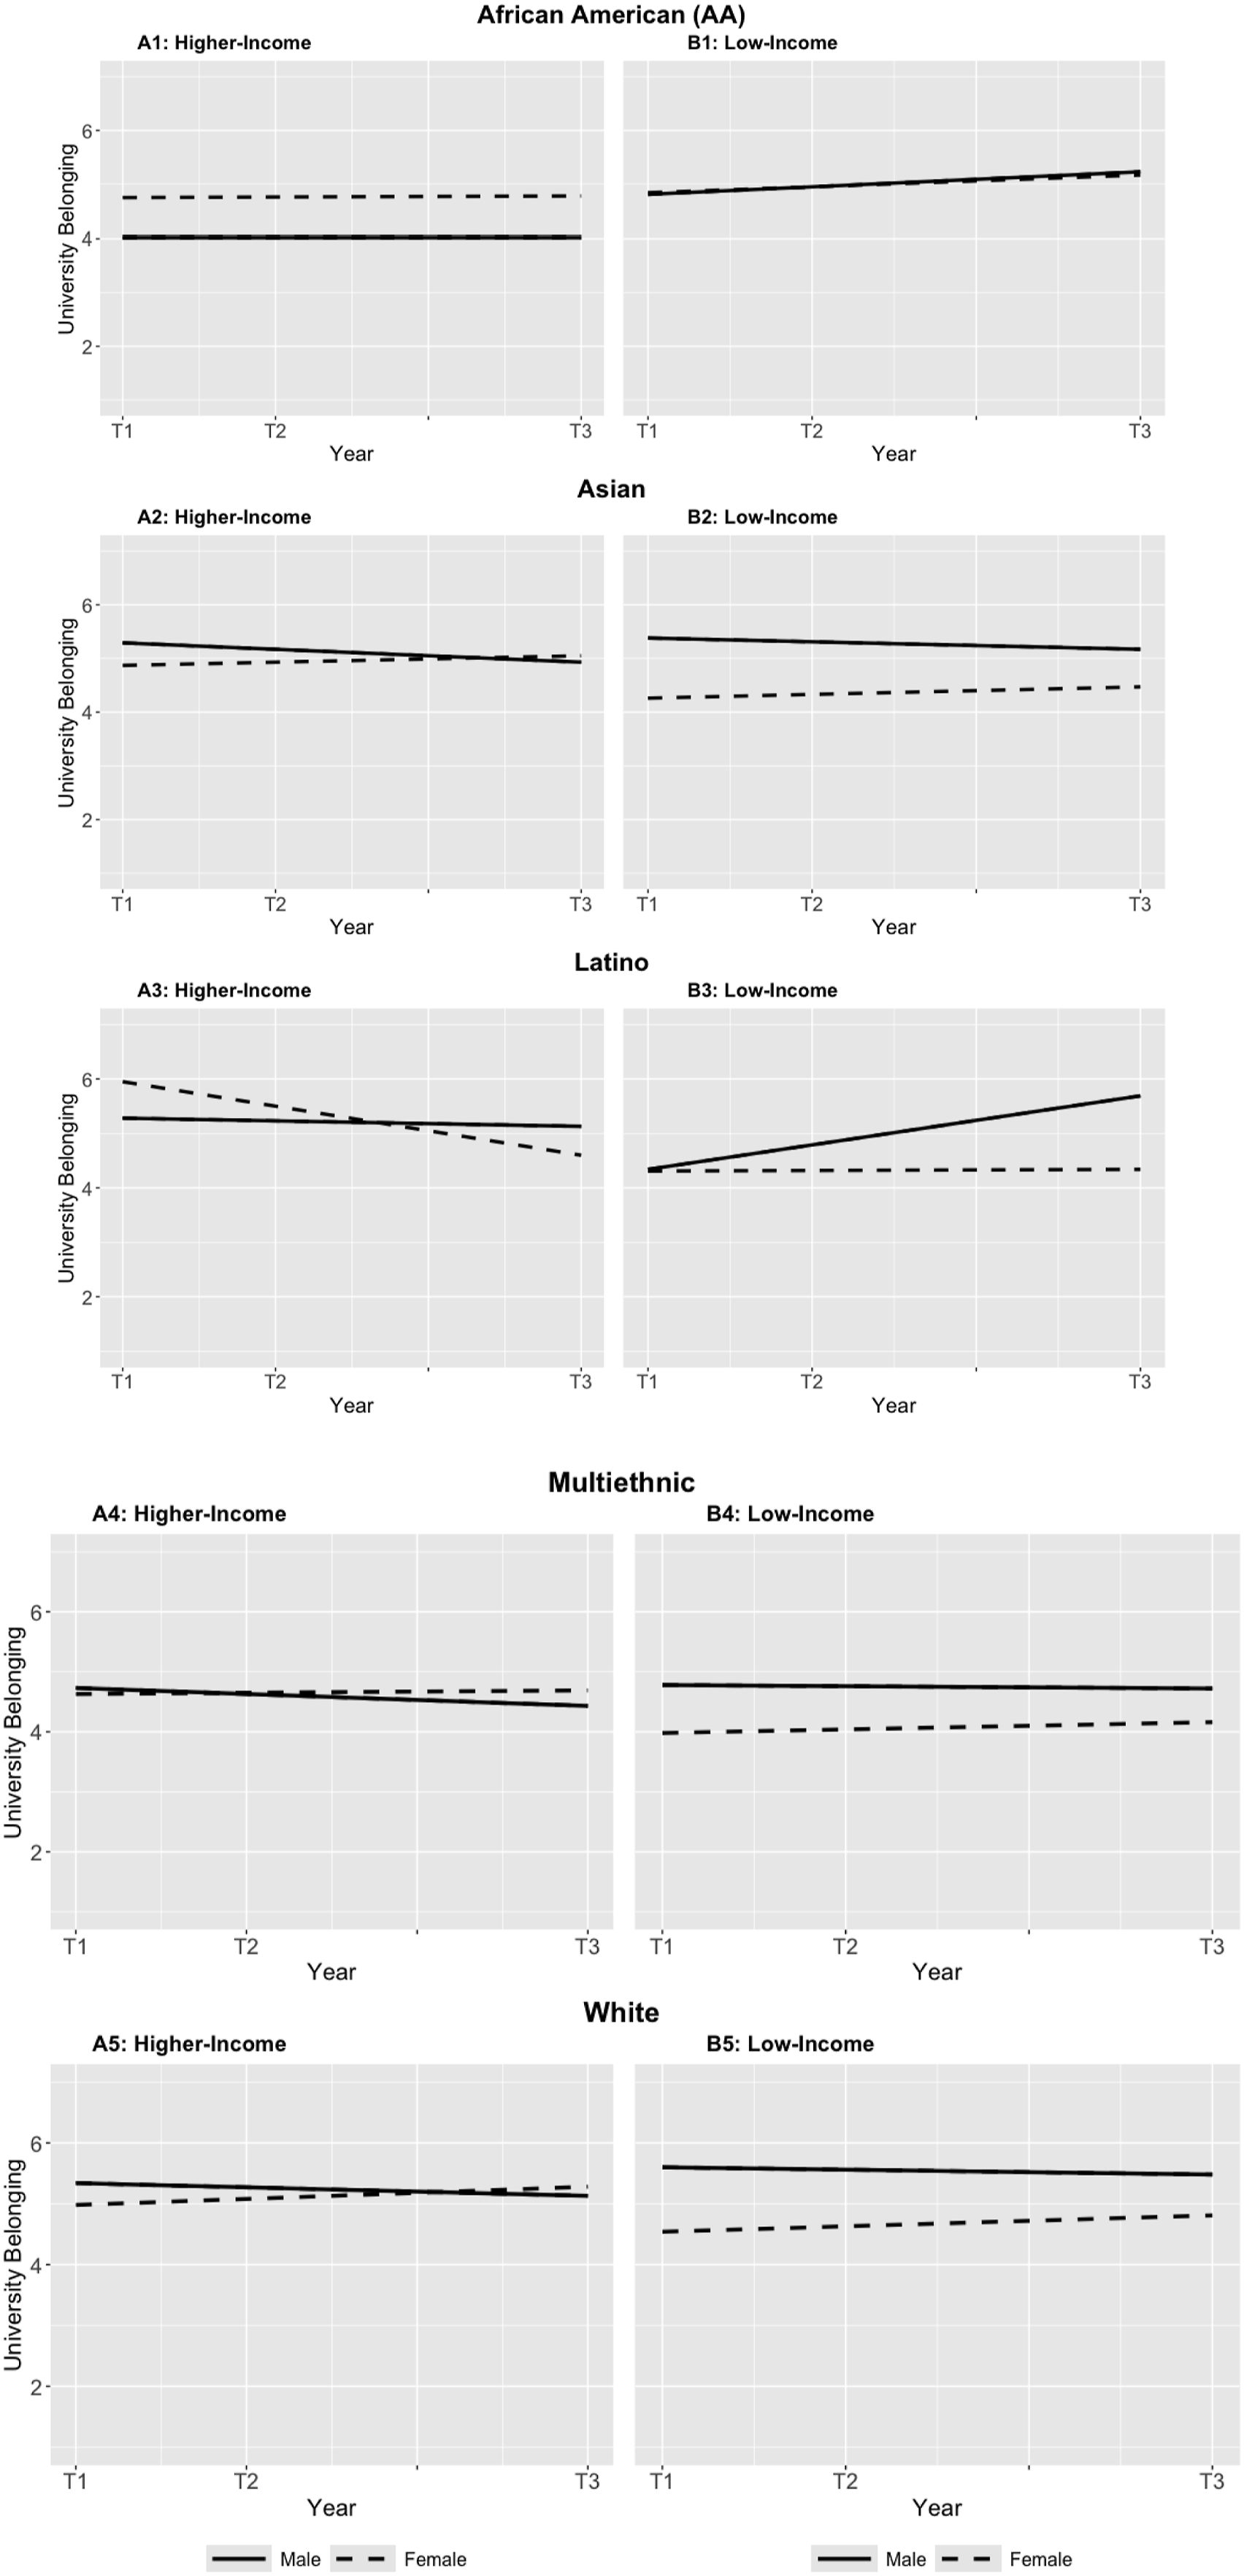
Following Models C1-C5, we included a three-way interaction among the social identities as an additional predictor. Using a similar modeling strategy, we created five three-way product terms of income status, gender, and race and fitted five conditional LGCM with the reference racial group rotated. In each model, none of the product terms for the three-way interaction reached significance. Results for the five conditional LGCM were thus not included.
The interaction between gender and ethnicity also affected the slope of university belonging from T1 to T3. All racial groups remained at the level of university belonging, except that Latino male and female students showed diverging trajectories (see A3 and B3 in Figure 4). In particular, female Latino students had a lower rate of change than that of male Latino students regardless of income status. On average, the gender difference on the rate of change among Latino students was 0.40 larger than that of African American students (γs2 = 0.40 in Model C3, SE = 0.16, p = 0.01), 0.58 larger than that of Asian students (γs3 = 0.58 in Model C3, SE = 0.17, p < 0.01), 0.52 larger than that of Multiethnic students (γs5 = 0.52 in Model C3, SE = 0.16, p < 0.01), and 0.57 larger than that of White students (γs6 = 0.57 in Model C3, SE = 0.16, p < 0.01). Results indicated that Latino female students’ university belonging increased much slower (or declined much faster) than their male peers whereas female students in other racial groups showed similar growth curves as males.
Conversely, the slopes among Latino students were higher among lower-income students. Whereas the trajectories of university belonging in other racial groups are relatively stable through college, trajectories of Latino students’ university belonging were generally decreasing among higher-income students but increasing among lower-income students over time. On average, the change in the slopes caused by low-income status among Latino students was 0.36 larger than that of African American students (γs7 = −0.36 in Model C3, SE = 0.17, p = 0.03), 0.45 larger than that of Asian students (γs8 = −0.45 in Model C3, SE = 0.18, p = 0.01), 0.42 larger than that of Multiethnic students (γs10 = −0.42 in Model C3, SE = 0.18, p = 0.02), and 0.47 larger than that of White students (γs11 = −0.47 in Model C3, SE = 0.14, p < 0.01). Results indicated that low-income Latino students had remarkably high rates of change after they entered college among all considered racial groups.
Discussion
A large and growing literature examines the potentially harmful effects of low university belonging, which is experienced disproportionally by students who espouse minoritized social identities (Ruedas-Gracia et al., 2020). The present study is, to our knowledge, the first quantitative exploration of university belonging yearly changes over time among students with various intersectional and minoritized identities. It is novel in its use of LGCM to develop student profiles of university belonging that highlight differential trajectories based on intersecting identities. Longitudinal analyses allow us to observe a phenomenon over time and understand both the initial level and the rate of change. Our utilization of LGCM allows us to look at the change patterns, not just a slice of measurement, and is reflected in our discussion of our findings below.
To explore university belonging patterns over time, we collected survey data measuring university belonging among racially diverse college students at a private 4-year university at three timepoints over the course of 4 years. The present research confirmed that students from different racial, gender, and income status groups report significant differences in both initial levels of university belonging as well as its rate of change. The study findings shed light on differential profiles of university belonging over time among culturally diverse college students. The findings have implications for university programming and resource allocation, including optimal timing of resource delivery, to support diverse college student populations, especially those with multiple minoritized social identities.
Normative University Belonging Patterns: A Generalist Approach
Regarding our first research question, our findings show that on average, university belonging levels increased slightly, but not significantly. In other words, over their first 4 years in college, students’ university remained relatively stable. Previous research on university belonging shows that it is stable throughout college years, and our results confirm this pattern. It is important to note, however, that there was significant heterogeneity in initial levels of university belonging across participants. During their first year in college, there seemed to be differences in university belonging levels across students in our sample. This finding supports our next analysis: exploring whether this heterogeneity was present along lines of race, social class, and gender.
Differences in University Belonging by Social Identities: A Singular Approach
When we explored variation by demographic variables separately, we gained a fuller picture of the heterogeneity found above. We found in this study that students identifying as female had lower university belonging than students identifying as male. In addition, low-income students had lower university belonging than non-low-income students. Of the racial groups, Native students had the lowest university belonging at T1 and T2, but the highest university belonging at T3. White students had the highest university belonging at T1 and T2 and the second highest university belonging at T3. These findings suggest that, when social identities are looked at separately, some students (e.g,. females, low-income, POC) experience lower sense of university belonging while other students (e.g., males, non-low-income, white) enjoy higher sense of university belonging. This is consistent with the extant belonging literature that looks at isolated effects of social identities on university belonging separately.
Considering women outpace men in college enrollment (Keels et al., 2013) and thus benefit from higher representation in higher education, some may assume that women in our sample should have reported higher university belonging than men. It is a common assumption that greater representation of one social identity alone can contribute to higher levels of university belonging. However, university belonging is comprised of multiple components that work together to support high university belonging levels (e.g., identification with school, social match, social acceptance, cultural capital; Maghsoodi et al., 2023). Therefore, although greater representation along one social identity (gender identity) could contribute to a higher sense of university belonging for women, it cannot be assumed that that component alone is sufficient to engender higher levels of university belonging.
Moreover, this study is intentional about incorporating an intersectional identity approach when assessing university belonging levels. While female college students may see their gender identity well represented, other aspects of their identity (e.g., racial/ethnic/cultural identity) may not be as well represented and thus complicate their university belonging experience (Azpeitia & Bacio, 2022; Kelly et al., 2021). For example, although there may be more women than men in college, an individual who identifies as a woman and Latinx may not see Latinx women specifically, and thus would not feel a higher level of university belonging.
Lastly, although women may be more represented in college enrollment, the historically entrenched higher education climate – which at its inception did not welcome women – is not yet fully supportive of women in higher education. Since the campus climate is important to developing a sense of university belonging (Hurtado & Carter, 1997), representation without institutional support would not suffice. For these three reasons, it is not a given that representation of one aspect of an individual’s identity will automatically create higher levels of university belonging.
Because we employed longitudinal data collection methods and rigorous longitudinal statistical analyses, we also have insight on demographic differences in the rate of change in university belonging. Findings show that low-income students experienced a significantly faster increase in university belonging compared to their peers. Therefore, although their initial levels of university belonging may be lower than their peers, their rate of increase allows them the opportunity to eventually “catch up” to their peers over time. Conversely, female identifying students did not experience a significantly faster rate of change than male identifying students. Therefore, not only did they experience lower levels of university belonging than their peers, but they also did not have the opportunity to “catch up” to their peers over time. In addition, students identifying as multiethnic not only experienced significantly lower levels of university belonging than their White peers but also experienced a lower slope than their White peers, meaning that their university belonging levels diverged even further compared with other racial ethnic groups. Thus, they were also not able to “catch up” to their White peers over time. All three of our demographic variables of interest affected growth trajectories in different ways. This supports our more complex analyses acknowledging and consequently examining university belonging levels and their rate of change among students with intersectional identities.
Differences in University Belonging by Social Identities: An Intersectional Approach
An intersectional analysis uncovered additional differences between student groups. Findings supported burgeoning literature highlighting impacts of espousing intersectional identities. It is important to note that rather than suggesting that these patterns did not previously exist, we simply posit that research methods utilized in the past (e.g., examining between group differences by only one social identity at a time) were not sophisticated enough to identify impacts of intersectional identities. In this study, various differential patterns were detected when we examined intersectional identities.
Initial Levels of University Belonging
As mentioned above, on average female participants reported lower university belonging levels than their male peers. However, an intersectional gender by income examination of female low-income students determined that this gender difference was larger among low-income students. In other words, female low-income participants experienced a much lower level of university belonging than their male low-income peers, compared to female non-low-income participants and their male non-low-income peers. This pattern was observed across all racial ethnic groups.
A gender by race interaction was also detected. The difference in university belonging levels between female and male participants varied by racial ethnic identity. Among African American and Latinx participants, females reported higher university belonging levels than their male peers. Among Asian and White participants, females reported lower university belonging levels than their male peers.
In addition, an income by race interaction was found such that the difference in university belonging between low-income and non-low-income students was largest in the Latinx group compared to other racial ethnic groups. Low-income Latinx participants experienced lower university belonging than their non-low-income Latinx peers. For all other racial ethnic groups, there was not as large of a difference by income status.
Rates of Change
Regarding rate of change, there was no gender by income status interaction found in our sample. However, we detected a gender by race interaction such that female Latinx participants’ university belonging levels decreased much faster and increased much slower than their male Latinx peers. Thus, although female Latinx participants may have experienced higher university belonging levels during T1, this advantage disappeared over time due to the drastic rate of change experienced by female Latinx participants.
There was also an income status by race interaction in the rate of change. Low-income Latinx participants’ university belonging levels increased much faster than low-income students in all other racial ethnic groups.
Limitations and Strengths
There are some limitations of this study that warrant consideration and could be improved upon in future studies. First, our analyses utilize self-report survey data, which is known to contain measurement errors. Although we accounted for many limitations of our data (e.g., adequately accounting for missing data), we cannot fully account for measurement error arising from self-report data that measure a latent variable. However, prior research on university belonging suffers the same limitation as all measures of university belonging are self-report measures. Future studies should continue strengthening current self-report measures of university belonging to ensure they are generalizable and valid across diverse social groups. Moreover, researchers have shown university belongingness to be a multidimensional construct (Maghsoodi et al., 2023), and future studies should assess changes in individual dimensions of this construct.
Another potential limitation is the number of timepoints we included in our dataset. In our study, we analyzed changes in university belonging at three timepoints over the span of four college years. Although this allowed us to detect changes that would otherwise be impossible to detect in cross-sectional data, future studies should include more timepoints across different timescales (e.g., yearly, monthly, or daily) to capture additional fluctuations in university belonging.
Another limitation is the nature of attrition. University belonging is associated with engagement, where students who feel a stronger sense of university belonging are more engaged in university activities (Wilson et al., 2015). Students with significant decreases in university belonging levels may have disengaged from university activities and thus dropped out of our study, a project organized by researchers affiliated with the university (i.e., a university activity). In the current study, the assumption of missing completely at random (MCAR) was retained and the missing data were addressed by the use of full information maximum likelihood (FIML). Future studies should explore creative ways to retain students experiencing decreases in university belonging (including those who eventually drop out of college) to reduce the possibility of attrition bias.
A related limitation is the sample size in this study. Due to attrition and pandemic-related reasons, the final sample size of the study was N = 136. We understand that such as small sample size may limit the generalization of the results and undermine the power of detecting interactive effects. Therefore, wedropped a subgroup with limited sample size (i.e., Native students) from the interactive-effects models to protect the integrity of our results. Additionally, we took an exploratory approach and focused on identifying patterns and trends in interpreting our results. Overall, in spite of the sample size limitation, this study provided tentative support for the change patterns of students’ sense of belonging by different social identities. The preliminary evidence is promising but limited, and continued research with expanded, representative samples is required to draw more definitive conclusions. Despite this study’s limitations, the significant inter and intragroup differences in levels of belonging and rates of change by race, gender, and income level suggest that future studies on longitudinal belonging need to include both a) analyses of between group differences by key social identities (i.e., the singular approach) and b) intersectional analyses of within group differences by the same key social identities (i.e., the intersectional approach). This will ensure there exist no hidden change patterns that would influence our interpretation of the findings. Prior research on this topic is almost exclusively cross-sectional, eliminating the ability to observe potential fluctuations in university belonging. The longitudinal research that does exist does not incorporate an intersectional approach. We believe these findings address these gaps in the literature. Our findings suggest that generalist and cross-sectional approaches to understanding university belonging and its change over time are not enough. Instead, empirical research should utilize sophisticated growth models (i.e., LGCM) and employ both singular and intersectional approaches to fully understand how university belonging functions over time.
Practice Implications and Conclusions
The present study illustrates the necessity for longitudinal studies of university belonging and the importance of employing an intersectional analysis in studies of belonging. While university belonging levels were stable across time for the sample as a whole, our analyses revealed significant differences based on race, gender, and income level, such that students of color (compared to white students), female students (compared to male students), and low-income students (compared to non-low-income students) reported lower levels of belonging across time. Longitudinal and intersectional analyses, however, revealed importance nuances in group differences in university belonging that have previously gone unexamined, with practical implications.
In addition to between-group differences in initial levels of belonging, rates of change in university belonging differed between different groups of students. The opportunity for those with initially low levels of belonging to “catch up” to their peers was greater for some (e.g., low-income) than for others (e.g., females). For the latter group, belonging interventions and programming at the beginning of the college journey would perhaps be most effective at minimizing the belonging gap in later years. Thus, administrators and educators must act quickly and effectively to address belonging concerns for these students. For the former group (those with a greater rate of positive belonging change), however, the timing of programming is not as consequential, as the present study shows them to have a relatively high rate of increase in belongingness without any intervention.
Findings from our intersectional analyses illustrate that studies should avoid combining heterogenous groups (e.g., gender, race), as it can cause researchers to overlook important differences existing at intersections of identities. These findings also have implications for university programming, institutional structure considerations, and mentorship. The significant interaction effects we found in mean levels and rates of change in university belonging imply that campus resources seeking to support students’ sense of belonging (e.g., campus wellness centers, cultural houses, research programs etc.) should develop programming and affirming spaces reflecting students’ intersectional identities and resulting experiences, rather than focusing solely on a single dimension of identity at a time. In particular, scholars have noted the dearth of such campus resources for multiply marginalized students (Mosley et al., 2019). Existing identity-based campus organizations should develop community programming and community building that reflects their members’ intersectional identities (e.g., Black sororities; ethnic cultural centers developing LGBTQ-specific programming; etc.). Moreover, research suggests that quality relationships with faculty are conducive to boosting sense of university belonging (Means & Pyne, 2017; Miller et al., 2019; Schmahl & Nguyen, 2022). Investing in institutional support for professional development is thus imperative. In particular, institutions should incentivize and value culturally sustaining mentorship practices among faculty which is cognizant of the different ways that university belonging can manifest based on intersectional identities. Examples of such practices are 1) including readings in course syllabi that are written by scholars espousing diverse social identities, 2) establishing opportunities and spaces where culturally diverse norms are recognized and included in curriculum and minoritized students can be their authentic selves (Peña et al., 2022), 3) incorporate strategies to foster belonging outside of the classroom (e.g., research groups; for specific strategies see Ruedas-Gracia et al., 2022). In this way, postsecondary institutions – and important change agents within these institutions – can provide optimal environments that foster university belonging among diverse student populations.
Supplemental Material
Supplemental Material - Is Belonging Stable Over Time?: A Four-Year Longitudinal Examination of University Belonging Differences Among Students
Supplemental Material for Is Belonging Stable Over Time?: A Four-Year Longitudinal Examination of University Belonging Differences Among Students by Nidia Ruedas-Gracia, Ge Jiang, and Amir H. Maghsoodi in Emerging Adulthood
Footnotes
Declaration of Conflicting Interests
The author(s) declared no potential conflicts of interest with respect to the research, authorship, and/or publication of this article.
Funding
The author(s) disclosed receipt of the following financial support for the research, authorship, and/or publication of this article: The research reported here was funded by the Institute of Education Sciences, U.S. Department of Education, through Grant R305B140009 to the Board of Trustees of the Leland Stanford Junior University. The opinions expressed are those of the authors and do not represent the views of the institute or the U.S. Department of Education.
Open Practices
We report the rationale for our sample size, all data exclusions, and manipulations (if any), and all measures in the study. We follow JARS in the reporting of the present study (Kazak, 2018). Data, analysis code, and research materials are available upon request from the first author. Data were analyzed using R, version 4.1.2 (R Core Team, 2021). This study’s design and analyses were not pre-registered.
Supplemental Material
Supplemental material for this article is available online.
Note
Author Biographies
References
Supplementary Material
Please find the following supplemental material available below.
For Open Access articles published under a Creative Commons License, all supplemental material carries the same license as the article it is associated with.
For non-Open Access articles published, all supplemental material carries a non-exclusive license, and permission requests for re-use of supplemental material or any part of supplemental material shall be sent directly to the copyright owner as specified in the copyright notice associated with the article.