
Abstract
This study aimed to develop and validate the Academic Psychological Distress Scale (APDS) to assess psychological distress in university students across multiple domains. Two student samples (N = 310 for exploratory factor analysis, EFA; N = 367 for confirmatory factor analysis, CFA) completed the preliminary scale alongside measures of academic and general psychological distress. EFA identified a 6-factor structure with 37 items, reduced to 25 items after CFA. The factors included academic anxiety, stress somatic responses, loneliness, negative self-worth, fatigue, and demoralization, with an excellent model fit (χ2/df = 2.31; RMSEA = .06 [CIs = .05, .06]; CFI = .94; TLI = .93; SRMR = .04). Furthermore, the APDS demonstrated evidence of convergent, discriminant, and construct validity, showing correlations with psychological distress, academic stress, and academic engagement and performance. Despite methodological and sample-related limitations, the APDS offers a reliable, multidimensional tool for assessing academic distress, supporting targeted interventions for university students.
In recent years, the mental health and well-being of university students have increasingly drawn attention from educational institutions and policymakers worldwide. Research shows that mental health issues are prevalent among university students (Settersten & Ray, 2010; Sheldon et al., 2021), with studies revealing high rates of depression and anxiety symptoms within this group (Bruffaerts et al., 2018; Ibrahim et al., 2013), even beyond diagnosable psychopathological conditions (Bewick et al., 2010; Porru et al., 2022; Pritchard et al., 2007). Consequently, requests for support from mental health services have steadily increased (Duffy et al., 2019), particularly in university counseling centers (Pizzo et al., 2024; Prince, 2015; Xiao et al., 2017), where the nature and severity of mental health needs presented by students have evolved compared to the past. In response, these centers have adapted to the growing diversity of student concerns by offering psychotherapeutic interventions primarily based on a psychopathological model.
However, although some students seeking help at university centers have clear, diagnosable disorders, the majority still struggle with academic-related difficulties (Broglia et al., 2021; Rückert, 2015). Along these lines, a widespread prevalence of negative emotional responses to the academic environment, such as academic anxiety and academic-related hopelessness, has been continuously recorded (Vitasari et al., 2010). Indeed, higher education inherently involves complex adjustment processes, and the concept of “studenthood” (Baker, 2006) has been introduced to describe a distinct developmental stage with its own set of tasks that intersect with the broader challenges of emerging adulthood. While a certain amount of stress can be beneficial and most students navigate their academic challenges without particular problems, for others coping with academic pressures can be problematic and lead to maladjustment processes. For these students, university becomes the stage on which their internal developmental struggles unfold, leading to dysregulation of their interpersonal functioning in the academic setting and a resulting maladaptation to the demands of studenthood (Scandurra et al., 2024).
Building on these premises, alongside general measures of distress, there is a clear need for assessment tools tailored to the specific health needs of university students (e.g., Erdur-Baker et al., 2006; Kettmann et al., 2007). Tools grounded in the specific health needs of the student population would not only enable a more in-depth evaluation of the effectiveness of psychological interventions in academic settings, but also help inform those interventions by identifying the specific areas of distress and vulnerability that are closely linked to the academic context. In the current literature, there already seems to be an indicator that meets this need: academic distress, which captures students’ psychological functioning in relation to academia (Locke et al., 2011; McAleavey et al., 2012). Although preliminary, studies have shown that academic distress is associated with a number of negative consequences, both in terms of higher risk of academic failure and dropout (Chua et al., 2018; Holding et al., 2020; Samlan et al., 2021; Vasquez-Salgado et al., 2021) and poorer mental health (Jones et al., 2018; Zakeri et al., 2021). However, academic distress has been used without a clear conceptual framework, often referring to a loosely defined set of cognitive and affective dimensions, including low motivation, poor concentration, lack of confidence, and diminished interest and enjoyment in studies (Cheng et al., 2020; Lockard et al., 2012; Locke et al., 2011). Most of the studies cited have relied on the only scale currently available in the literature, i.e., the Academic Distress subscale of the Counseling Center Assessment of Psychological Symptoms (CCAPS-62; Locke et al., 2011, 2012), which, despite its widespread use and strong validity evidence, does not assess the construct in a multidimensional way, as will be discussed in the following paragraph.
In summary, the conceptual vagueness of academic distress, combined with the lack of multidimensional measurement tools, has limited previous studies in examining the distinct role of its underlying dimensions. To address this gap, a recent concept analysis clarified the construct and introduced the notion of Academic Psychological Distress (APD; Scandurra et al., 2024), identifying its core components. This conceptual clarification highlighted the need for a dedicated assessment tool that aligns with the refined definition of APD. Building on this foundation, the present study aims to develop and validate a comprehensive and multidimensional instrument to assess APD.
Academic Psychological Distress: A Theoretical Model
A recent concept analysis on APD was conducted to clarify the construct and isolate its main components (Scandurra et al., 2024). The results of this work revealed that APD is a specific form of distress that refers to a range of negative affective reactions that a student may exhibit in response to the developmental challenges of studenthood.
The structure of APD includes four main domains: (a) affective; (b) cognitive; (c) somatic; and (d) social. The affective domain refers to the spectrum of negative emotional states experienced by students in direct relation to academic contexts, tasks, and identity. It primarily encompasses internalized emotional states such as academic anxiety, sadness, and hopelessness, which are negative affective responses elicited by academic stressors and the perceived inability to meet institutional expectations (Andersen et al., 2021; Hirai et al., 2015; Kanter Agliata & Renk, 2009; Krys et al., 2020; Mcdermott et al., 2020; Locke et al., 2011, 2012; Naz et al., 2020). Thus, this domain primarily involves anxiety and depressive states, with some studies also highlighting the role of dysphoric emotional states, such as irritability, frustration, anger, shame, guilt and agitation (Holding et al., 2020; Julien et al., 2009; Kanter Agliata & Renk, 2009; Morris et al., 2021; Padrón et al., 2021; Renshaw & Bolognino, 2016). The most common anxiety symptoms reported in the studies have been nervousness and restlessness, excessive academic worry and feeling tense and under pressure (Naz et al., 2020; Scandurra et al., 2024). Instead, the following depressive states have been identified: lack of motivation to study, academic anhedonia, loss of interest in academics, feelings of worthlessness, academic-related hopelessness and lack of self-confidence as a student (Locke et al., 2011, 2012; Scandurra et al., 2024). The cognitive dimension reflects a state of overload and fatigue resulting from coping with academic demands, leading to reduced mental energy and efficiency (Locke et al., 2011, 2012). It involves difficulties in key processes like attention, memory, and executive functioning. Students may struggle to concentrate, retain information, feel mentally exhausted, and tend to procrastinate (Locke et al., 2011, 2012; Oaten & Cheng, 2005; Scandurra et al., 2024). The somatic dimension captures the bodily manifestations associated with negative thoughts and anticipatory anxiety about academic demands (Naz et al., 2020; Oaten & Cheng, 2005; Sharp & Theiler, 2018; Steptoe et al., 1996). It includes symptoms such as trembling, a lump in the throat, irregular breathing, a sense of emptiness in the stomach, and nausea, all of which are physical expressions of psychological distress triggered by academic pressure. Finally, the social dimension involves a subjective sense of disconnection or alienation within the university context, often rooted in difficulties establishing or maintaining supportive relationships with peers, faculty, or institutional figures (Morris et al., 2021; Solberg Nes et al., 2009). These four domains interact dynamically and reflect not only symptomatic expressions but also a disrupted adaptation to the developmental challenges of studenthood, making APD a context-sensitive indicator of psychological vulnerability in higher education settings.
Thus, despite the challenges of emerging adulthood often intersect with those of studenthood, and it is clear that students experiencing high levels of general distress may also be more vulnerable to academic burden, APD is theoretically conceptualized as a specific and context-based form of distress that includes emotional states and manifestations of distress directly related to academic situations. In other words, while APD shares certain features with general psychological distress (e.g., anxiety, depressive mood, and somatic symptoms) it is distinctively rooted in the academic context and revolves around students’ self-perceptions, role expectations, and performance within the educational setting. For instance, a student may report persistent insomnia, low energy, and self-deprecating thoughts. If these symptoms are tied specifically to academic concerns (e.g., fear of failing an exam, feeling inadequate as a student, or hopelessness about graduating), they would be better conceptualized as manifestations of APD rather than general distress.
As mentioned above, there is currently no validated scale that comprehensively measures domains of APD and the only related measure available in the literature is the Academic Distress subscale of the CCAPS-62 (Locke et al., 2011, 2012). The CCAPS-62 is a comprehensive instrument designed to assess the mental health of college students using eight subscales: Depression, Eating Problems, Substance Use, General Anxiety, Hostility, Social Anxiety, Family Distress, and Academic Distress. With the exception of the Academic Distress subscale, which specifically assesses factors such as lack of academic motivation, difficulty concentrating, and lack of confidence in one’s ability to succeed academically, all other subscales are general measures of mental health that are not tied to student identity. Additionally, the Academic Distress subscale is limited to the cognitive domain and the depressive subcomponent of the affective domain and therefore does not capture the multidimensional nature of APD. A dedicated tool that integrates all its components is essential not only for advancing empirical research but also for enabling accurate psychological screening and assessment in university settings.
The Current Study
The current work aims to fill the above gap through the construction, the development, and the evaluation of the psychometric properties of a scale for the assessment of APD, the Academic Psychological Distress Scale (APDS).
Specifically, we hypothesized that the APDS has: (1) a good content and face validity; (2) a robust factor structure; (3) a good convergent and discriminant validity of the factor structure; (4) an adequate score distribution and factor statistics, as well as a good reliability of the factors; (5) an adequate construct validity, as assessed by correlations with a previously validated measure of academic distress; (6) and an adequate criterion validity, as assessed by correlations with (6a) academic stress, (6b) non-specific measures of distress, (6c) academic engagement, and (6d) grade point average. As further exploration, we tested potential differences on APD by gender identity, type of discipline (STEM [Science, Technology, Engineering and Mathematics] vs. SSH [Social Sciences and Humanities]), and mental health treatment in course (yes vs. no).
Method
Development of the APDS Items
Based on the guidelines of Boateng et al. (2018) on best practices for the construction of psychological instruments, the generation of the items was based on a combination of a deductive and an inductive approach.
First, an initial pool of items was created based on the theoretical model of APD. This was done through a process of comparison and reflexivity between the authors of the current work, who have many years of clinical experience with university students. The first three researchers designed a pool of items that captured all 4 main dimensions of APD isolated from the theoretical model, namely: affective (anxiety and depression), cognitive, somatic and social. The preliminary pool was developed from existing scales for general distress, anxiety and depression, the items of which were slightly modified to adapt them specifically to the university context. For example, the Depression Anxiety Stress Scales (Lovibond & Lovibond, 1996) item “I felt I was pretty worthless” was rephrased as “I felt I was pretty worthless as a student”; the General Anxiety Disorder Scale (Spitzer et al., 2006) item “How often have you been bothered by not being able to stop or control worrying?” was reformulated as “I couldn’t stop worrying about University”; the Patient Health Questionnaire (Löwe et al., 2004) item “How often have you been bothered by feeling tired or having little energy” was rephrased as “When I tried to study, I felt tired and/or had no energy”. Once the items were finalized, the last author was involved as a judge (“supervisor”) to solve any inconsistencies or discrepancies. This led to the construction of an initial pool of 61 items. Following the response format of most distress instruments, students were asked to respond to the items by describing their emotional state in the past month on a five-point rating scale (from 0 = “never or almost never” to 4 = “almost always”).
This deductive method was combined with an inductive approach, which consisted of conducting two focus groups involving both experts (6 clinicians working in university counseling centers) and subjects from the target population (17 university students enrolled in a psychology course). This was done both to refine the items, to add new dimensions and to check their content and face validity. The expert judges were asked to review the items based on three criteria (Grant & Davis, 1997): representativeness (the extent to which the items reflect the operationalization of the construct), relevance (the importance of the items for explaining the construct), and clarity (accessibility and comprehensibility). Instead, participants from the target population (i.e., university students) were asked to rate the items based only on the criterion of clarity (i.e., comprehensibility) in order to assess face validity. Each item was rated on a scale from 0 (not representative/not relevant/not clear) to 5 (very representative/very relevant/very clear). Participants were also asked to suggest changes to existing items and propose new items based on their clinical and/or personal experience. A final pool of 58 items were retained.
Samples and Data Collection Procedures
In determining the sample size, we followed the guidelines of an extensive literature that considers a 5:1 sample for the Exploratory Factor Analysis (EFA) (5 participants for each item) and a 10:1 sample for the Confirmatory Factor Analysis (CFA) (10 participants for each item) to be sufficient (Costello & Osborne, 2019; Gaskin & Happell, 2014; Howard, 2016; Lloret-Segura et al., 2014).
Based on a proportion of 5 participants for each item, a sample of at least 290 participants can therefore be considered sufficient for the EFA. However, as there could be outliers that we would then have to exclude, we included slightly more participants than expected with a final sample of 326 participants. The average age of the sample was 23.42 years (range: 18–29 years, SD = 3.93). In terms of gender, 67.7% (n = 210) of participants self-identified as women and 32.3% (n = 100) as men. 67.4% of the sample (n = 209) attended a STEM degree program, while 32.6% (101) attended a SSH degree program. 2.3% of students (n = 7) had a disability (.3% had a sensory disability, 1.3% had a motor disability, 0.6% had an intellectual disability), while .6% (n = 2) had a certified diagnosis of specific learning disorder. In addition, 21% (n = 65) of students were undergoing mental health treatment (university counseling, psychotherapy, pharmacology).
The sample size for the CFA was instead calculated based on the proportion of 10 participants for each item. However, as we will show later, the proportion was based on the items remaining after the EFA (i.e., 37 items). Therefore, the minimum sample size was set at N = 370. Similar to the sample for the EFA, we decided to slightly increase the number of participants (N = 382) to avoid the same problem of outliers. The average age of the sample was 19.96 (range: 18–24, SD = .87). Of the participants, 60.8% (n = 223) identified as women, 36.0% (n = 132) as men, and 3.3% (n = 12) as transgender or non-binary. Regarding academic programs, 75.5% (n = 277) were enrolled in STEM degrees, while 24.5% (n = 90) pursued studies in Social Sciences and Humanities (SSH). A small portion of students (1.4%, n = 5) reported having a disability, with .5% indicating a sensory disability, .3% an intellectual disability, and .5% a psychic disability. Additionally, 3% (n = 11) had a certified diagnosis of a specific learning disorder. Finally, 14.4% (n = 53) of students reported being in mental health treatment, which included university counseling, psychotherapy, or pharmacological interventions.
As for the recruitment procedures, the data was collected online via the Qualtrics platform. Participants were invited through advertisements in the lecture halls of different degree programs at the authors’ University and through dissemination on major social media (Instagram, Telegram, and Facebook). The first page of the questionnaire included the informed consent form, which contained information about the research objectives, researchers’ information, and potential risks and benefits. The questionnaire took approximately 15 minutes to complete. Participants were eligible to take part in the surveys if they: (1) were enrolled in a degree program at an Italian university; (2) were at least 18 years old (the age of consent in Italy); and (3) were proficient in the Italian language.
The study was approved by the Ethical Committee of the University of Naples Federico II (protocol number: 18/2024), and designed according to the EU General Data Protection Regulation and the principles of the Declaration of Helsinki on Ethical Principles for Medical Research Involving Human Subjects.
Validity Measures
Following, the measures administered to assess CFA and different validities of the APDS are reported.
Academic Distress
This variable was assessed through the Academic Distress Subscale of the Counseling Center Assessment of Psychological Symptoms (CCAPS-62, Locke et al., 2011), which is a multidimensional instrument designed to assess the mental health of college students and consists of eight subscales: Depression, Generalized Anxiety, Social Anxiety, Academic Distress, Eating Concerns, Family Distress, Hostility, and Substance Use. For the purposes of this study, only the Academic Distress subscale was administered, which consists of five items (e.g., “I’m unable to keep up with my schoolwork” or “I am not able to concentrate as well as usual”). Participants are asked to rate the extent to which each statement has applied to them over the past two weeks on a scale from 0 (“not at all like me”) to 4 (“extremely like me”). The subscale score is calculated by averaging the responses to all 5 items, with lower scores indicating lower academic distress (Center for Collegiate Mental Health, 2023). The Cronbach’s alpha for Sample 2 was .71.
Academic Stress
Academic Stress was measured through the Higher Education Stress Inventory (HESI, Dahlin et al., 2005; Italian validation by Ferrara et al., 2023), which was developed to investigate the extent to which university students are exposed to a list of stressors in academic life (i.e., academic stress). The original scale consists of 33 items, while the Italian scale comprises 26 items with eight different factors: (1) Worries about competence and professional responsibilities (4 items); (2) Non-supportive climate (4 items); (3) Faculty shortcomings (5 items); (4) Workload (3 items); (5) Feedback (2 items); (6) Satisfaction with career choice (2 items); (7) Financial concerns (3 items); (8) Stigma (2 items). In the present study, we used the total scale score, with higher scores indicating greater academic stress. The Cronbach’s alpha for Sample 2 was .78.
Non-Specific Psychological Distress
This variable was measured through the Kessler Scale (K-10; Kessler et al., 2002; Italian version by Carrà et al., 2011) is a non-specific measure of mental distress consisting of 10 questions phrased as “How often in the past month did you feel …”, accompanied by explicit response options (e.g., “tired out for no good reason” or “nervous”) ranging from “none of the time” to “all of the time”, scored on a scale from 1 to 5, respectively. All the 10 questions were ordered to get a total score. In the present study, the Cronbach’s alpha for Sample 2 was .78.
Academic Engagement
This variable was measured through the SInAPSi Academic Engagement Scale (SAES, Freda et al., 2023). The SAES is a self-report scale consisting of 29 items that assess university students’ engagement on 6 dimensions: University value and sense of belonging; Perception of the capability to persist in the university choice; Value of university course; Engagement with university professors; Engagement with university peers; Relationships between university and relational net. Participants are asked to indicate their level of agreement with each of the statements on a scale from 1 (not at all) to 5 (completely). In the current study, we used the total score of the scale, with higher scores indicating greater academic engagement. The Cronbach’s alpha for Sample 2 was .85.
Academic Performance
The academic performance was measured through the grade point average (GPA) which was requested to participants.
Statistical Analyses
To test the first hypothesis of the current study (i.e., content and face validity of the APDS), we used content validity ratios (CVR), which indicate the degree of agreement between expert judgments on the representativeness, clarity, and relevance of each item of the scale. To calculate the CVR, half of the total number of respondents (6/2 = 3) was subtracted from the number of valid responses (i.e., ratings of 4 or higher on a 5-point Likert scale) and the result was then divided by half of the total number of respondents (Lawshe, 1975). The minimum threshold for the CVR varied depending on the number of expert panelists. For this study, in which 6 experts participated, the minimum CVR was .99. As with face validity, the maximum agreement between participants was used as the criterion for assessing item comprehensibility. Specifically, the average rating by students needed to be 5.0 with a standard deviation of .0. If this condition was not met, the item was deemed inappropriate.
To test the second hypothesis (i.e., the goodness of factor structure and internal consistency) we performed both EFA and CFA. Specifically, the EFA was conducted following a structured approach. First, multivariate outliers were identified using Mahalanobis distance, examining the cumulative distribution of the chi-square statistic, with the number of items (n = 58) as degrees of freedom. According to Hair et al. (1998), cases with p-values less than .001 were considered multivariate outliers. Second, the adequacy of the sample size was evaluated using Bartlett’s test of sphericity and the Kaiser-Meyer-Olkin (KMO) measure. Third, the normality of data distribution was assessed using the Shapiro-Wilk test. Results indicated that all items had p-values <.001, pointing to a significant violation of normality. Consequently, following the recommendations of Costello and Osborne (2019), EFA was performed using principal axis factoring. Oblimin rotation was applied, assuming that the factors were correlated. Finally, a parallel analysis (Hayton et al., 2004) was conducted to determine the number of factors to retain. In general, it is recommended that a satisfactory item should load at least above .40 on the primary factor and below .30 on the alternative factors (Howard, 2016). On this basis and considering that the closer the factor loading is to zero, the greater the importance of an item, we decided to suppress all items with a factor loading less of .60, thereby improving the clarity and reliability of the factor structure.
Following the EFA, a CFA was conducted using maximum likelihood estimation with robust standard errors via Jamovi. Initially, the potential presence of multivariate outliers was re-evaluated using the same method applied in the EFA, but considering only the items retained after the EFA. Model fit was assessed based on the recommendations of Cole (1987) and Kline (1998) using the following indices: Chi-Square divided by degrees of freedom (χ2/df), Root Mean Square Error of Approximation (RMSEA), Comparative Fit Index (CFI), Tucker-Lewis Index (TLI), and Standardized Root Mean Square Residual (SRMR). A good model fit was indicated by χ2/df values below 3, RMSEA values below .05, SRMR values below .08, and CFI and TLI values above .90 (Kline, 2005; Schreiber, 2008). In general, it is recommended that a satisfactory item should load at least above .40 on the primary factor and below .30 on the alternative factors (Howard, 2016). On this basis and considering that the closer the factor loading is to zero, the greater the importance of an item, we decided to suppress all items with a factor loading of less of .60, thereby improving the clarity and reliability of the factor structure. Internal consistency reliability was evaluated using Cronbach’s alpha. The CFA was tested again using Sample 1.
The third hypothesis concerned the convergent and discriminant validity of the APDS. Specifically, convergent validity, which refers to the degree to which items designed to measure a specific construct are closely related, was assessed using the Average Variance Extracted (AVE) and Composite Reliability (CR) in Sample 2. The AVE indicates how much variance in the indicators is explained by the latent construct. It is calculated by summing the squared standardized factor loadings and dividing by the number of indicators in the construct (Hair et al., 2014). CR evaluates the internal consistency of the indicators, showing how reliably they represent the underlying construct. It is computed by dividing the squared sum of factor loadings by the sum of that squared value and the corresponding error variances (i.e., one minus each squared loading) (Hair et al., 2014). Following the guidelines of Fornell and Larcker (1981), AVE values of ≥.50 and CR values of ≥.70 were considered acceptable thresholds. Instead, discriminant validity, which refers to the degree to which a construct is distinct from other measured constructs, was assessed by comparing the AVE for each factor with the squared inter-factor correlations, which should be lower than their respective AVEs (Hair et al., 2014).
To test the fourth hypothesis (i.e., adequate score distribution, acceptable factor statistics, and good reliability of the factors), we calculated the score distribution, skewness, kurtosis and internal reliability with Cronbach’s alpha for each factor and for both samples.
To test the fifth hypothesis—construct-related validity—we investigated the correlations between APDS and CCAPS-AD (academic distress measure). The construct-related validity refers to the extent to which the results obtained with the scale to be validated are correlated to the results obtained from another measure designed to assess the same construct (Raykov & Marcoulides, 2012)
The sixth hypothesis—criterion validity—was assessed through correlations of the APDS total score with HESI (academic stress measure; hypothesis 6a), K10 (nonspecific psychological distress; hypothesis 6b), academic engagement (hypothesis 6c), and academic performance (grade point average; hypothesis 6e). The criterion validity indicates the extent to which the score obtained with the instrument correlates with variables that have a hypothesized relationship with the construct measured by the instrument (DeVellis, 2012; Raykov & Marcoulides, 2012).
Finally, the role of gender identity, type of discipline (STEM vs. SSH), and being in mental health treatment across APD factors was assessed through Students’ t-tests in Sample 2. The effect size was determined using Cohen’s d, where values of .20, .50, and .80 correspond to small, medium, and large effects, respectively.
In both samples, there were no missing data because responses were mandatory.
Results
Content and Face Validity
Five items were deleted as they did not exceed the minimum CVR threshold (.99). (“When I thought about university, I was afraid that something bad might happen to me”, “I felt like going to University wasn’t worth it”, “I felt like nothing about university really interested me, “I felt irritable about University”, and “I felt like there was no one to turn to when I needed to vent about University”). Once these were excluded, the CVR (both as an overall score and in relation to the individual criteria, i.e., clarity, representativeness and relevance) was 1.00. This resulted in the retention of 56 items from the initial pool.
In terms of face validity, the results showed that all participants marked the maximum scale option for each of the 56 proposed items (M = 5.00, SD = .00). That is, they showed high comprehensibility of all items, indicating that no rephrasing was required. In addition, two items were added during the focus group with the students, so that the final pool comprised 58 items.
Exploratory Factor Analysis
Sixteen participants were removed from Sample 1 as cumulative distribution of chi-square was <.001, resulting in a final sample of 310 participants. Bartlett’s test of sphericity (χ 2 = 16,840, df = 1,653, p < .001) and the Kaiser-Meyer-Olkin (KMO = .967) measure of sampling adequacy indicated that EFA was appropriate for our sample.
Parallel analysis indicated a 6-factor solution, rather than a 7-factor solution. The corresponding eigenvalues for each factor were as follows: 26.65, 3.36, 1.88, 1.66, 1.25, and .92. The factors were correlated with each other between .33 and .58. The EFA indicated that the loadings of 23 items did not saturate well on a single factor or did not reach a factor loading ≥.5. The factors corresponded to (1) Academic Anxiety (8 items) indicating feelings of persistent worry, tension, and nervousness related to university life and one’s ability to cope with academic tasks; (2) Academic Stress Somatic Responses (6 items), indicating physical symptoms and bodily reactions resulting from academic stress; (3) Academic Loneliness (7 items) reflecting feelings of disconnection from others in the academic environment and emotional isolation in relation to one’s university experience; (4) Academic Negative Self-Worth (7 items), indicating feelings of inadequacy, self-doubt, and negative evaluations of one’s abilities as a student; (5) Academic Fatigue (5 items), indicating cognitive and physical exhaustion from academic demands; and (6) Academic Demoralization (4 items), indicating a sense of hopelessness, meaninglessness, and anhedonia related to studying. The 6-factor solution had an adequate structure (χ2/df = 2.06, RMSEA = .05 [CIs = .05, .06], TLI = .88), explained 67.41% of the variance resulting in 37 items. Below, we report the explained variance for each factor: Factor 1 (46.81%), Factor 2 (6.79%), Factor 3 (4.21%), Factor 4 (3.86%), Factor 5 (3.18%), and Factor 6 (2.57%).
Confirmatory Factor Analysis
Fifteen participants were removed from Sample 2 as cumulative distribution of chi-square was <.001, resulting in a final sample of 367 participants.
Confirmatory Factor Analysis on APDS Alternative Models
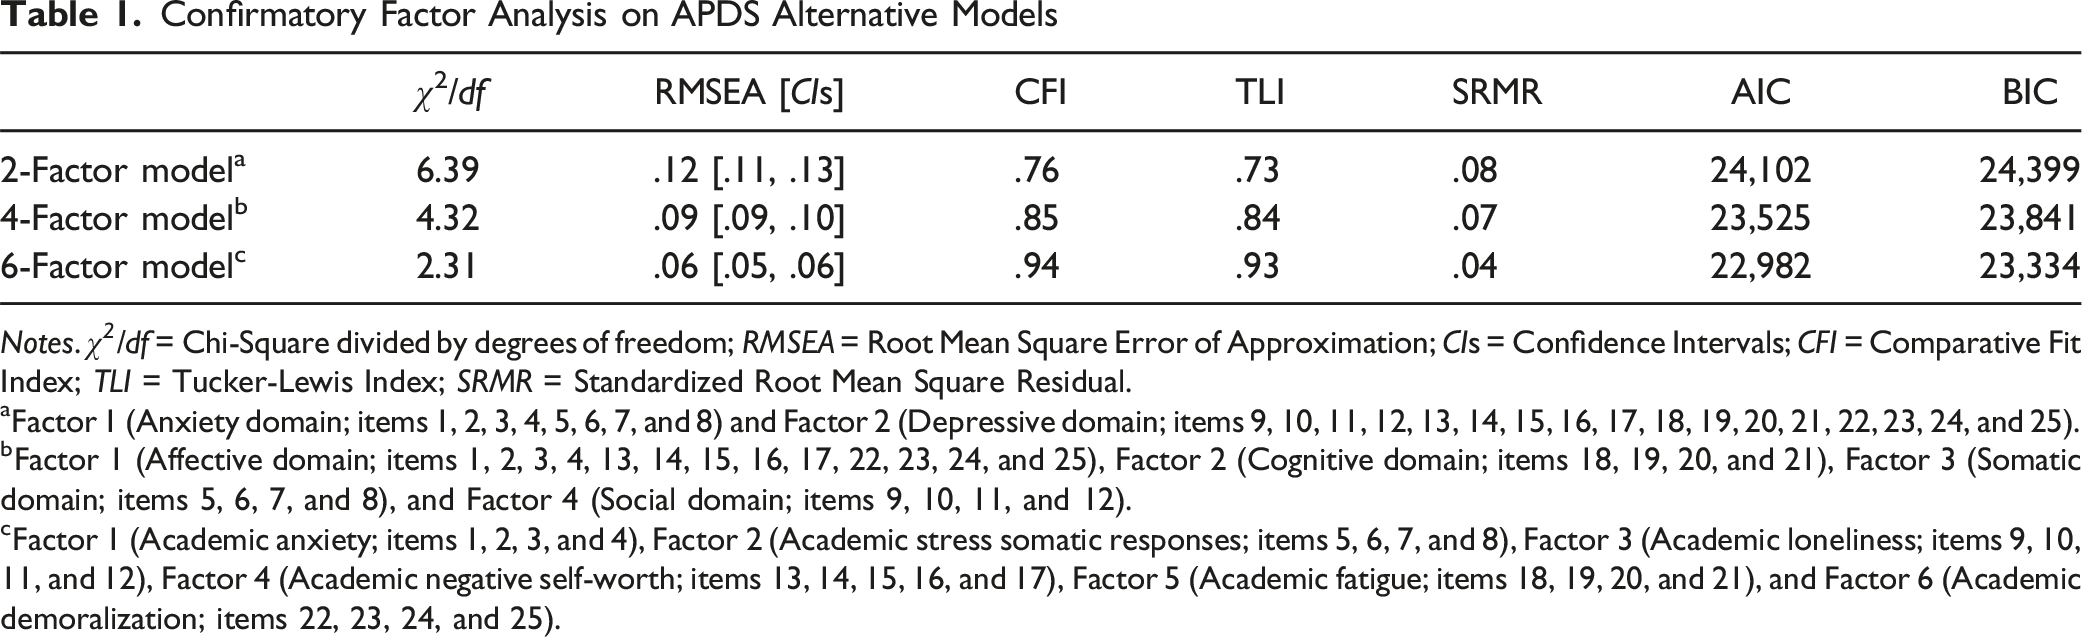
Notes. χ 2 /df = Chi-Square divided by degrees of freedom; RMSEA = Root Mean Square Error of Approximation; CIs = Confidence Intervals; CFI = Comparative Fit Index; TLI = Tucker-Lewis Index; SRMR = Standardized Root Mean Square Residual.
aFactor 1 (Anxiety domain; items 1, 2, 3, 4, 5, 6, 7, and 8) and Factor 2 (Depressive domain; items 9, 10, 11, 12, 13, 14, 15, 16, 17, 18, 19, 20, 21, 22, 23, 24, and 25).
bFactor 1 (Affective domain; items 1, 2, 3, 4, 13, 14, 15, 16, 17, 22, 23, 24, and 25), Factor 2 (Cognitive domain; items 18, 19, 20, and 21), Factor 3 (Somatic domain; items 5, 6, 7, and 8), and Factor 4 (Social domain; items 9, 10, 11, and 12).
cFactor 1 (Academic anxiety; items 1, 2, 3, and 4), Factor 2 (Academic stress somatic responses; items 5, 6, 7, and 8), Factor 3 (Academic loneliness; items 9, 10, 11, and 12), Factor 4 (Academic negative self-worth; items 13, 14, 15, 16, and 17), Factor 5 (Academic fatigue; items 18, 19, 20, and 21), and Factor 6 (Academic demoralization; items 22, 23, 24, and 25).
Considering the possibility that alternative models might provide a better fit than the model identified by the EFA and confirmed by the CFA, we tested two additional theory-driven models. The first was based on the conceptualization of APD proposed by Scandurra et al. (2024) and the second on the most widely accepted model of psychological distress (Drapeau et al., 2012; Mirowsky & Ross, 2002). In particular, APD has been theorized to comprise four domains (affective, cognitive, somatic, and social), whereas psychological distress is generally understood to comprise two main domains (anxiety and depression). Based on these theoretical frameworks, we included all relevant items within their respective domains to create the two alternative models. Specifically, in the 4-factor model, we included in Factor 1 (“Affective domain”) the items that loaded on “Academic Anxiety”,” “Academic Negative Self-Worth” and “Academic Demoralization” in the 6-factor model; in Factor 2 (“Cognitive domain”) the items from “Academic Fatigue”; in Factor 3 (“Somatic domain”) the items from “Academic Stress Somatic Responses”; and in Factor 4 (“Social domain”) the items from “Academic Loneliness.” In the 2-factor model, Factor 1 (“Anxiety domain”) included the items from “Academic Anxiety” and “Academic Stress Somatic Responses,” while Factor 2 (“Depressive domain”) included the items from “Academic Loneliness,” “Academic Negative Self-Worth,” “Academic Fatigue,” and “Academic Demoralization” were included. As shown in Table 1, the fit indices for the alternative models did not reach the minimum acceptable thresholds, indicating that the 6-factor model remains the best-fitting solution.
Confirmatory Factor Analysis Results of the APDS: Standardized Factor Loadings, Average Variance Extracted, Composite Reliability, Squared Correlations Between Factors
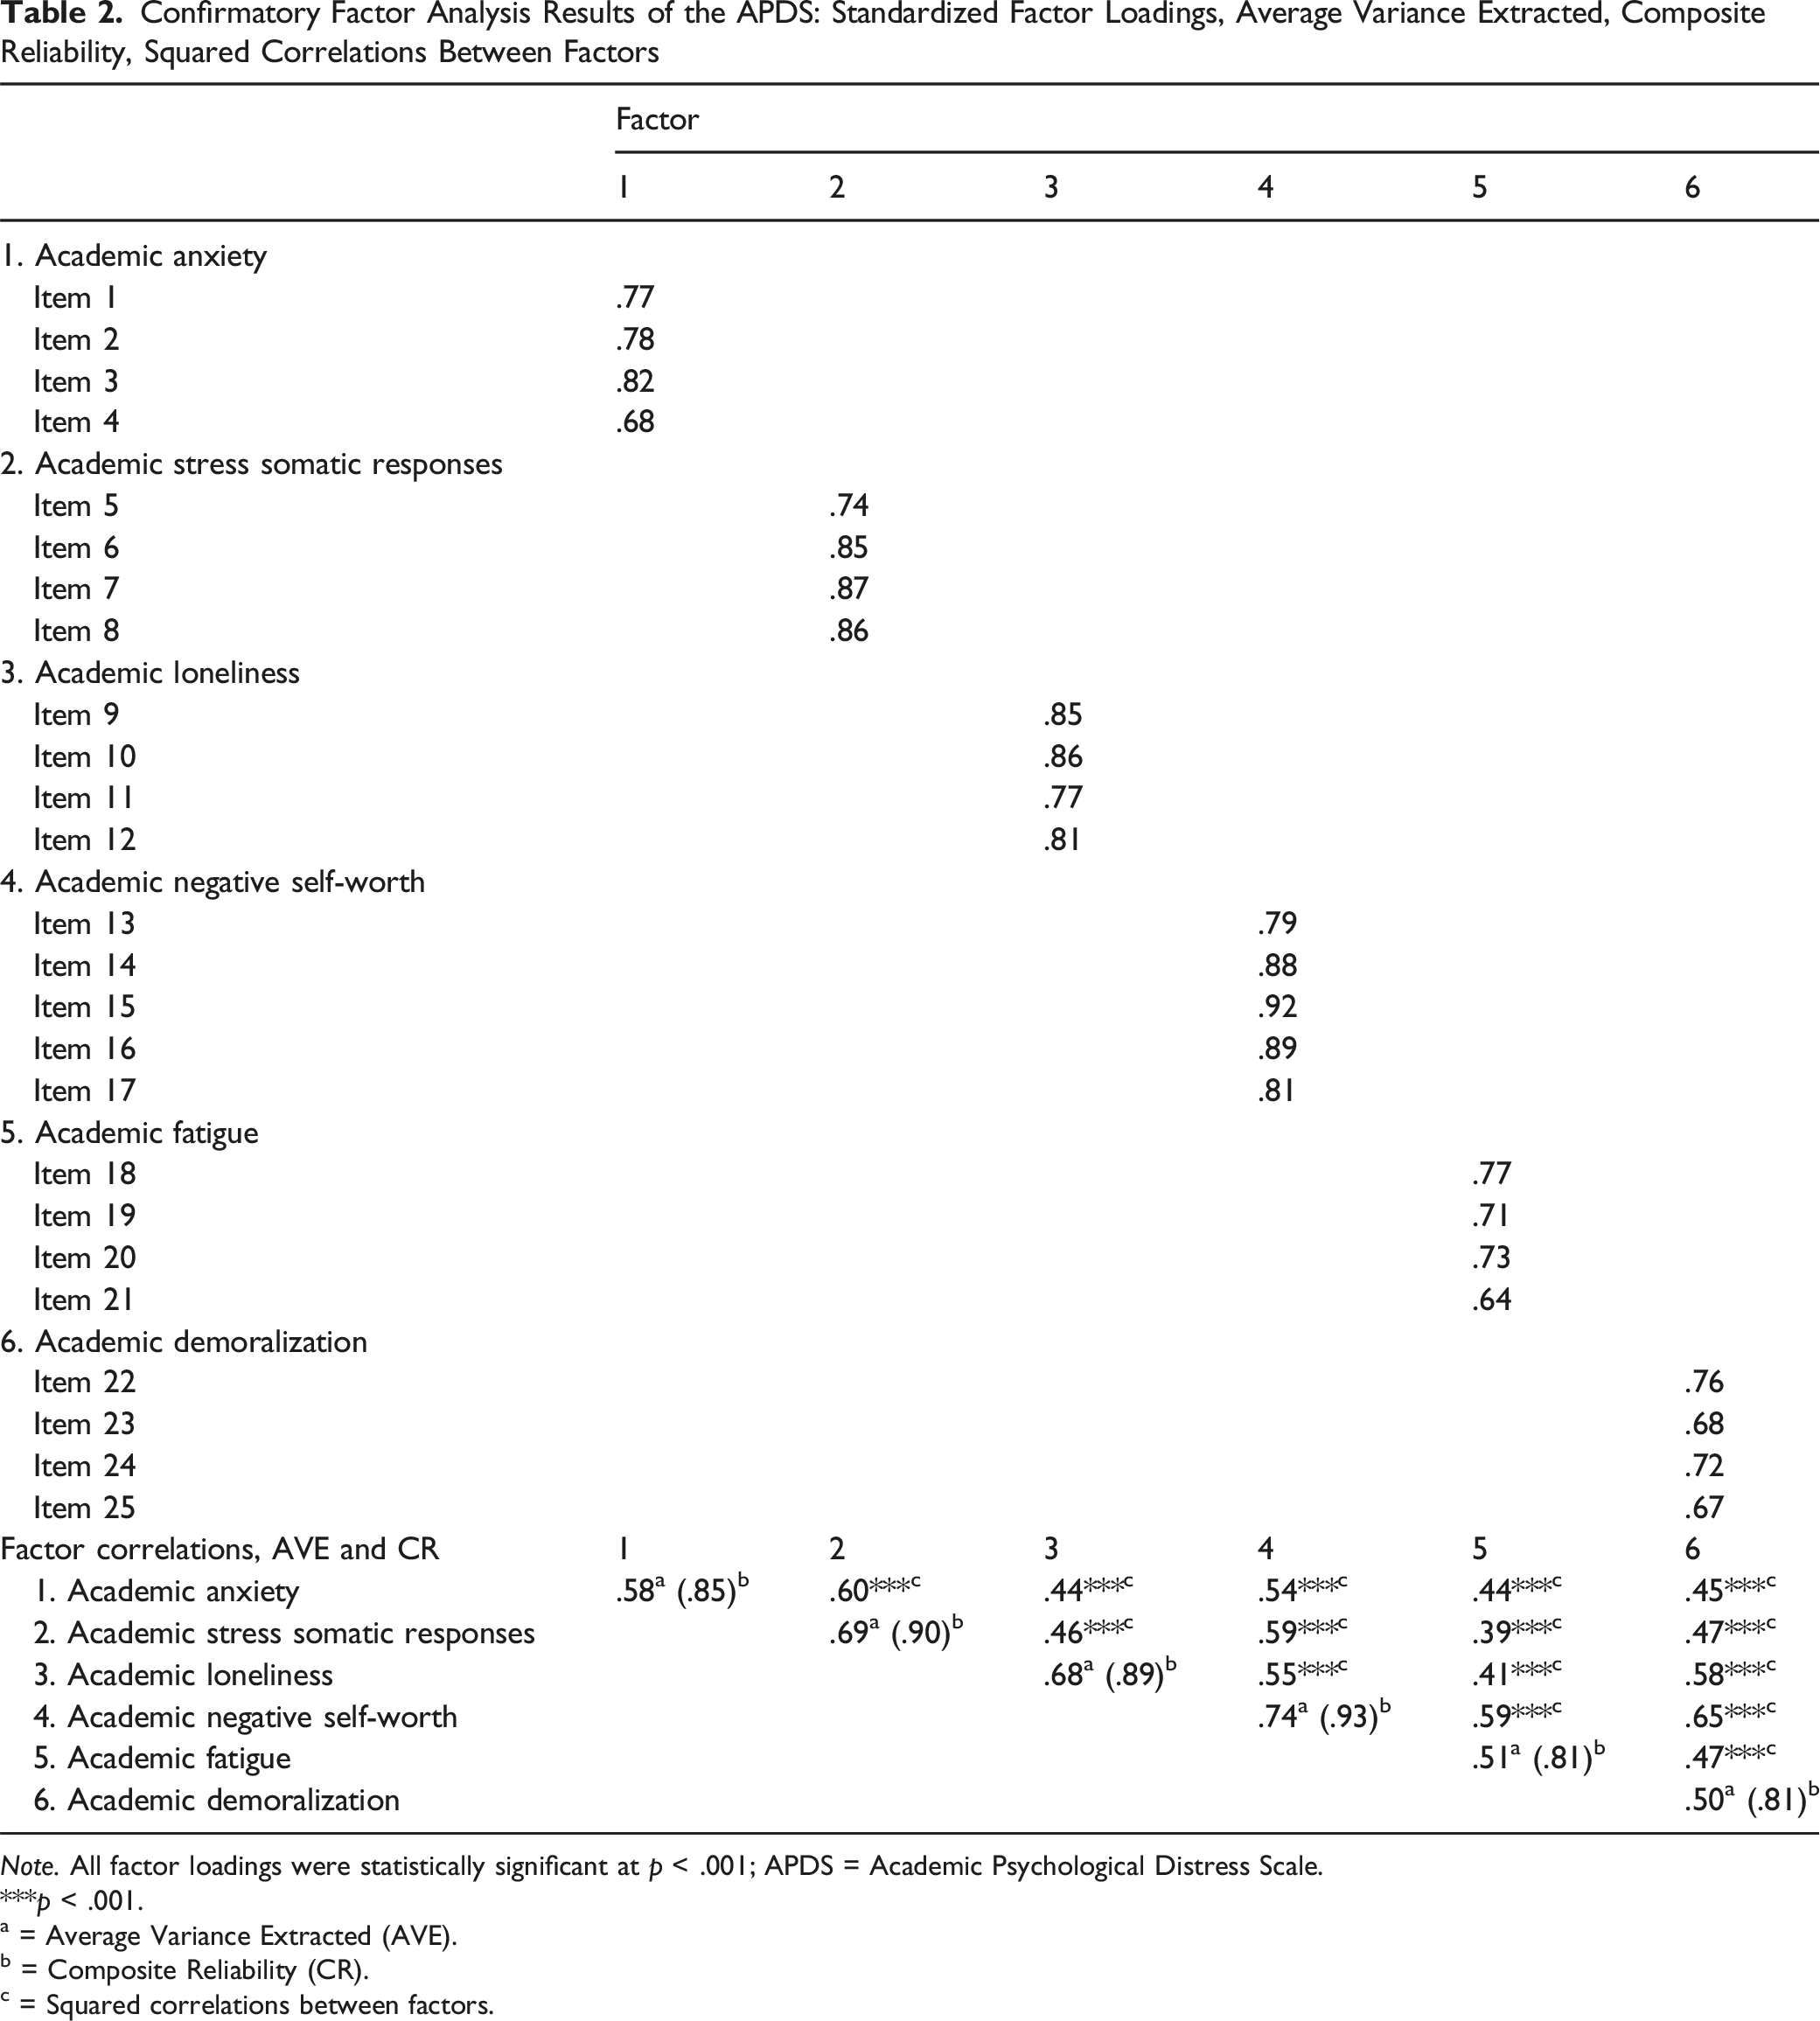
Note. All factor loadings were statistically significant at p < .001; APDS = Academic Psychological Distress Scale.
***p < .001.
a = Average Variance Extracted (AVE).
b = Composite Reliability (CR).
c = Squared correlations between factors.
A graphical representation of the factor structure is shown in Figure 1. Path Diagrams for the CFA of the APDS for Sample 1 (in Italic) and Sample 2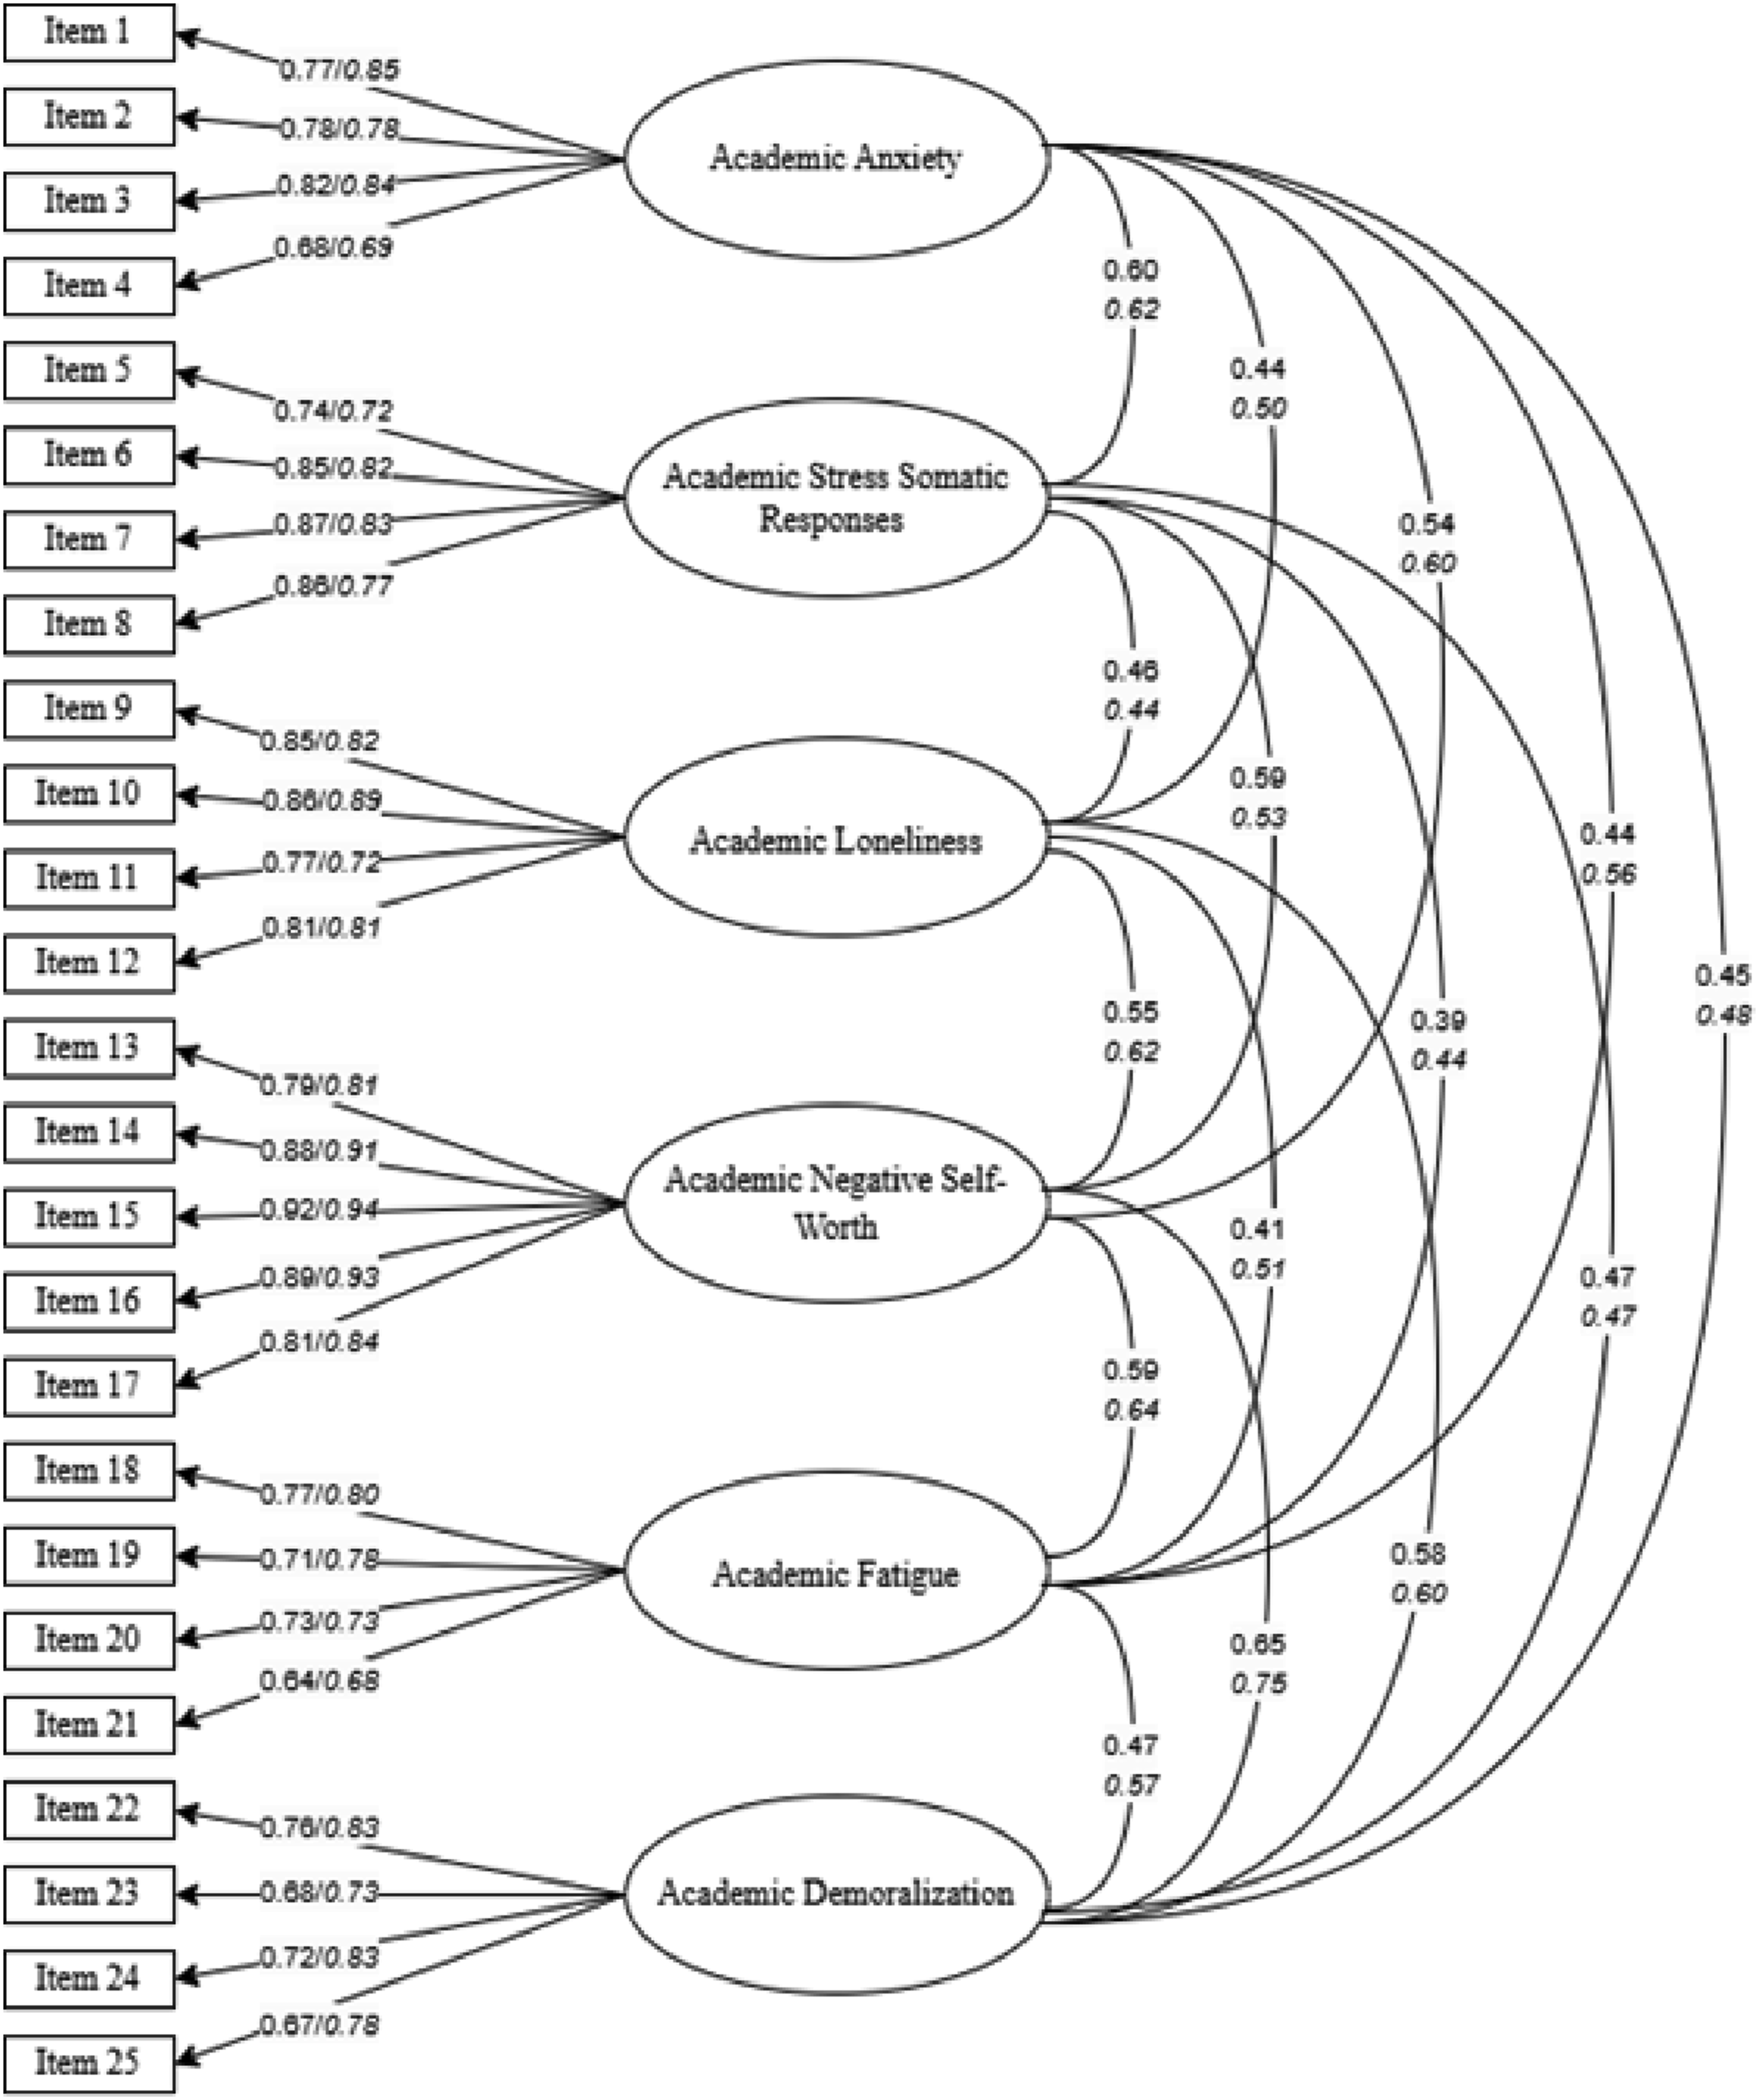
As a further analysis, we assessed whether the 6 factors were indicative of a single higher-order latent construct (i.e., the APD) by performing a second-order CFA. The second-order model showed good fit to the data (χ2/df = 2.02; RMSEA = .05 [CIs = .04, .06]; CFI = .99; TLI = .99; SRMR = .06). All first-order factors loaded significantly on the second-order factor (standardized loadings ranging from .73 to .88), supporting the hypothesis that APD is a unidimensional construct manifested through multiple interrelated dimensions.
The final 25 retained items are reported in Appendix A (English version) and Appendix B (Italian version).
Evidence for Convergent and Discriminant Validity
Regarding the convergent validity of the APDS, the AVE scores for all APDS factors except factor 6 (i.e., “Academic Demoralization”) were above the recommended threshold of .50 and the CR scores were above the standard threshold of .70 (Nunnally, 1978). Nevertheless, the AVE of Factor 6 can also be considered acceptable as it meets the threshold of .50, and its CR value exceeds .70 (Fornell & Larcker, 1981). These findings collectively demonstrate good convergent validity for the instrument (see Table 2).
In terms of discriminant validity, all paired squared correlations between the factors were lower than their respective AVEs, with the exception of Factor 1. For Factor 1, although the AVE was very close to the squared correlation with Factor 2, it remained higher than the average shared variance (.39) with the other factors. This indicates that the discriminant validity of the APDS constructs is established (see Table 2).
Therefore, these analyses confirmed our third hypothesis.
Score Distributions, Factors Statistics, and Reliability
Score Distributions, Descriptive Statistics and Reliability of APDS Factors
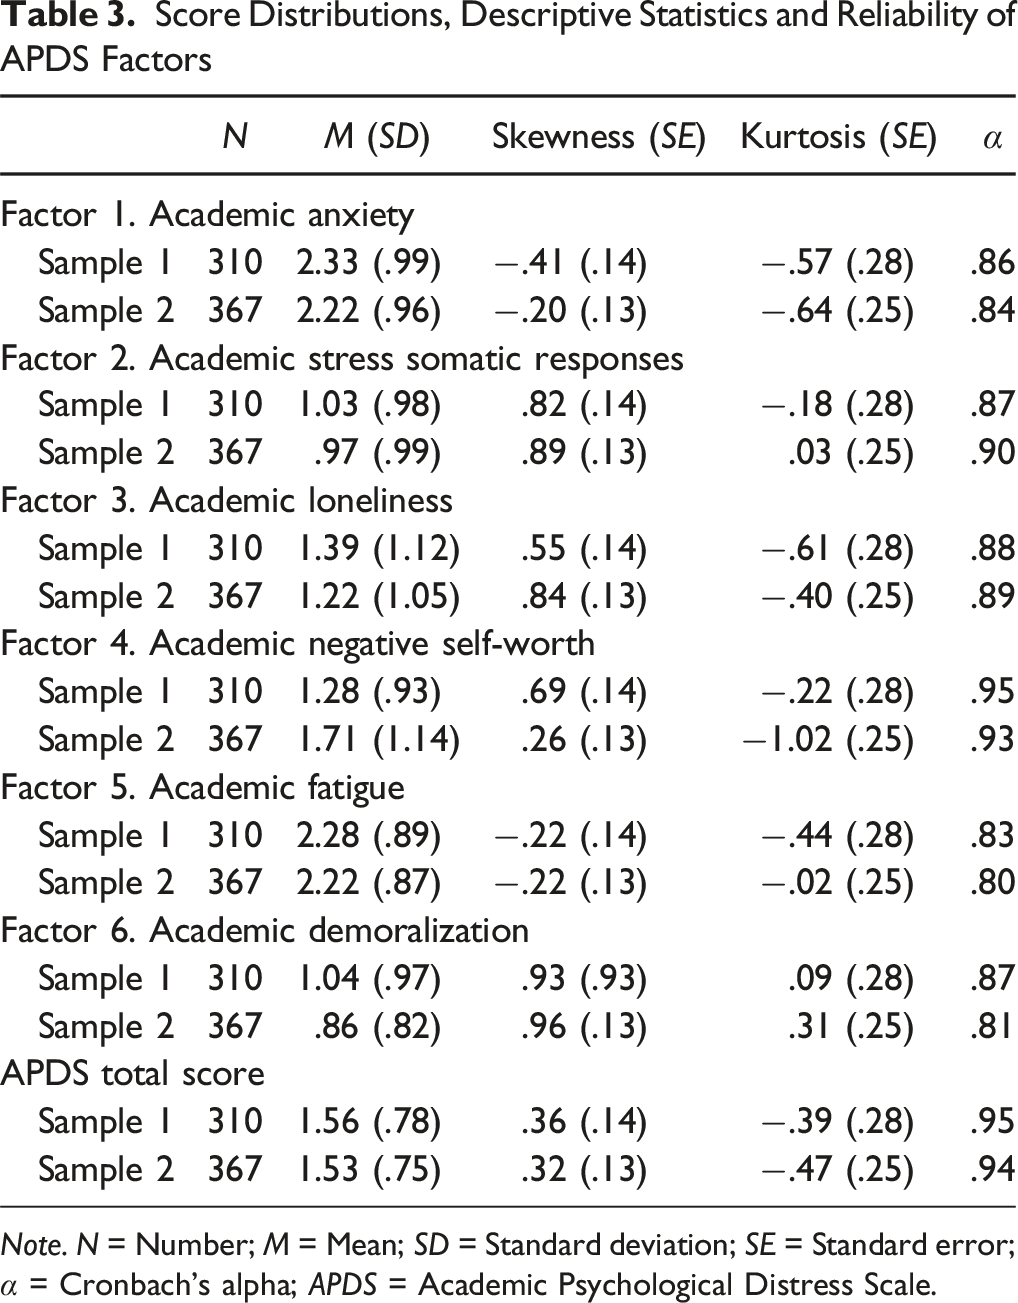
Note. N = Number; M = Mean; SD = Standard deviation; SE = Standard error; α = Cronbach’s alpha; APDS = Academic Psychological Distress Scale.
Evidence for Construct-Related Validity
Correlations Between APDS Factors, Academic Distress, Academic Stress, Psychological Distress, Academic Engagement, and Academic Performance (Sample 2, N = 367)
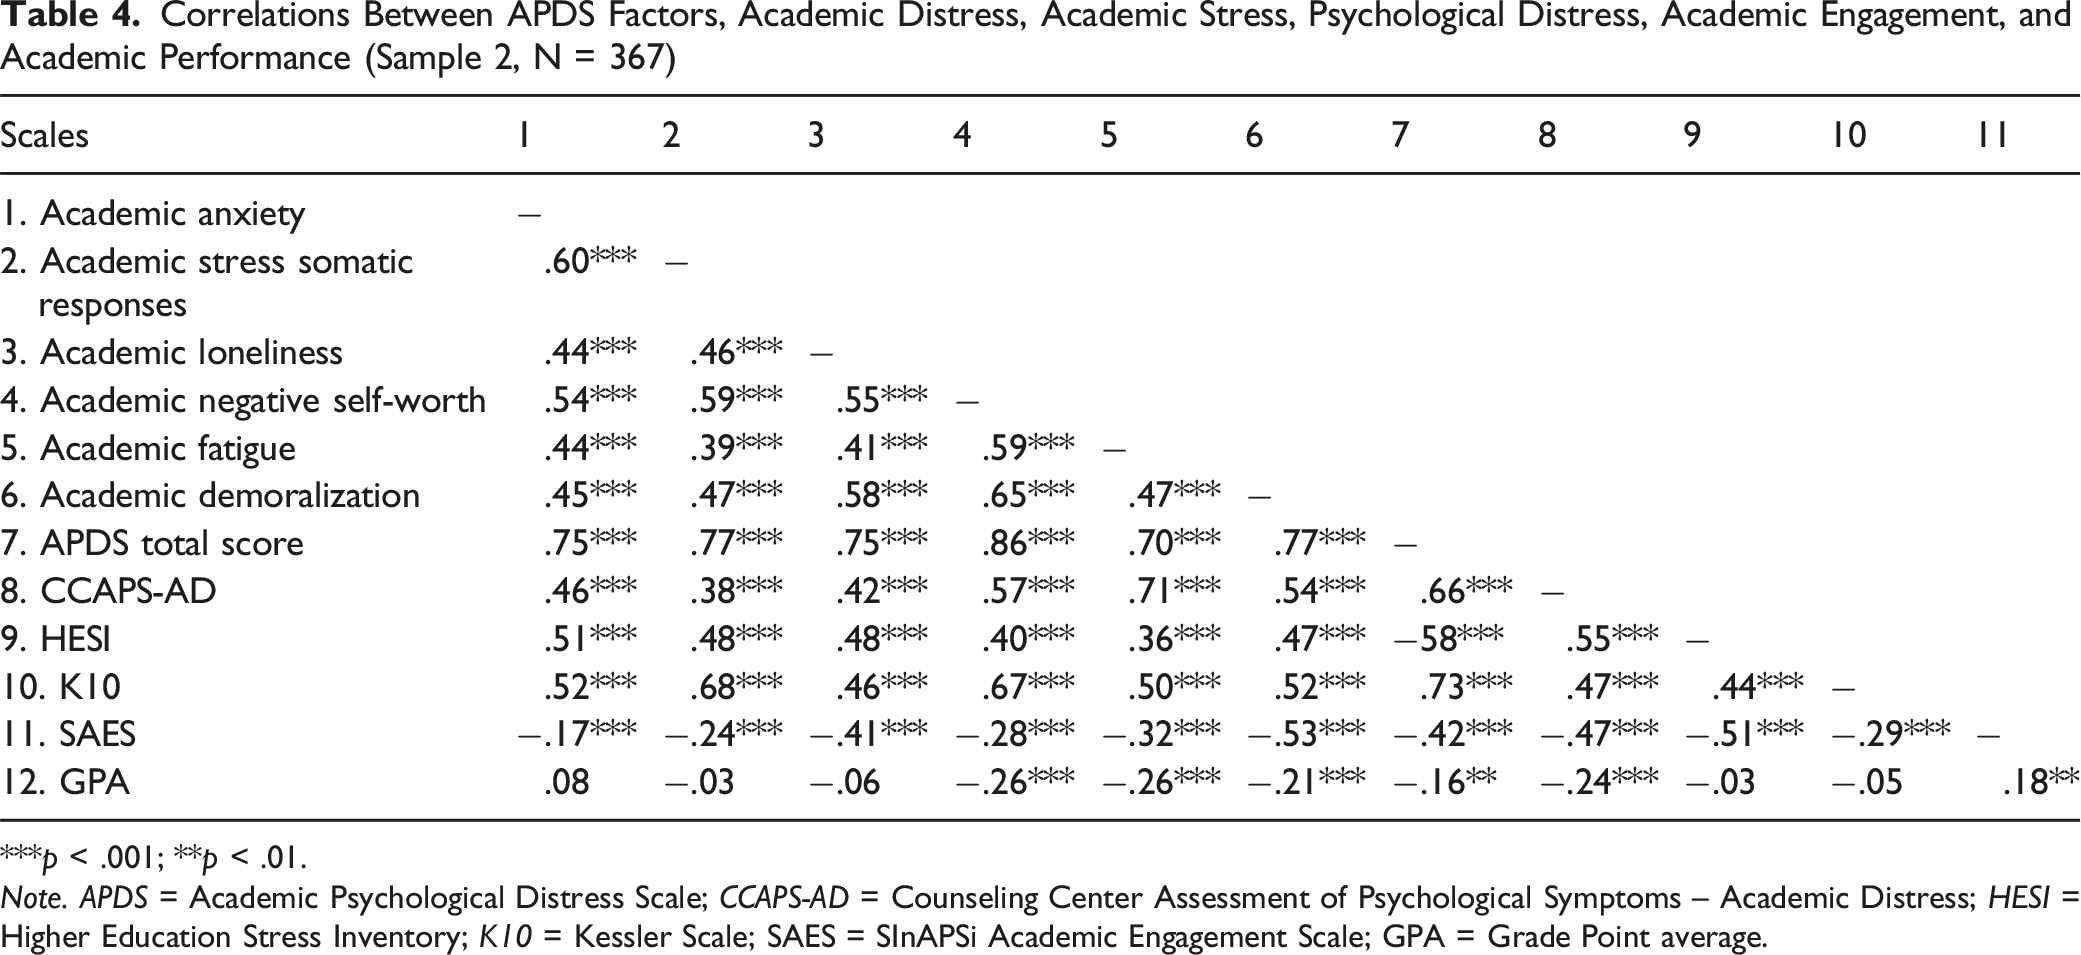
***p < .001; **p < .01.
Note. APDS = Academic Psychological Distress Scale; CCAPS-AD = Counseling Center Assessment of Psychological Symptoms – Academic Distress; HESI = Higher Education Stress Inventory; K10 = Kessler Scale; SAES = SInAPSi Academic Engagement Scale; GPA = Grade Point average.
Evidence for Criterion-Related Validity
Criterion-related validity was assessed through the exploration of the relationships of APD with academic stress, general psychological distress, academic engagement, and GPA (see Table 4).
All factors of APD correlated significantly and positively with academic stress and general psychological distress, indicating that higher scores on APD are associated with greater academic stress and psychological distress. On the contrary, all factors of APD correlated significantly and negatively with academic engagement, indicating that higher scores on APD are associated with lower academic engagement. These results confirmed the hypotheses 6a, 6b, and 6c, respectively.
Additionally, our analyses showed that higher academic negative self-worth, academic fatigue, academic demoralization, and APDS total score (but not academic anxiety, academic stress somatic responses, and academic loneliness) correlated significantly with a lower grade point average partially confirming the hypothesis 6d.
Differences of APD Across Gender Identity, Type of Discipline, and Mental Health Treatment Attendance
Mean Scores in the APDS Factors for Gender, Type of Discipline, and Mental Health Treatment Attendance (Sample 2, N = 367)
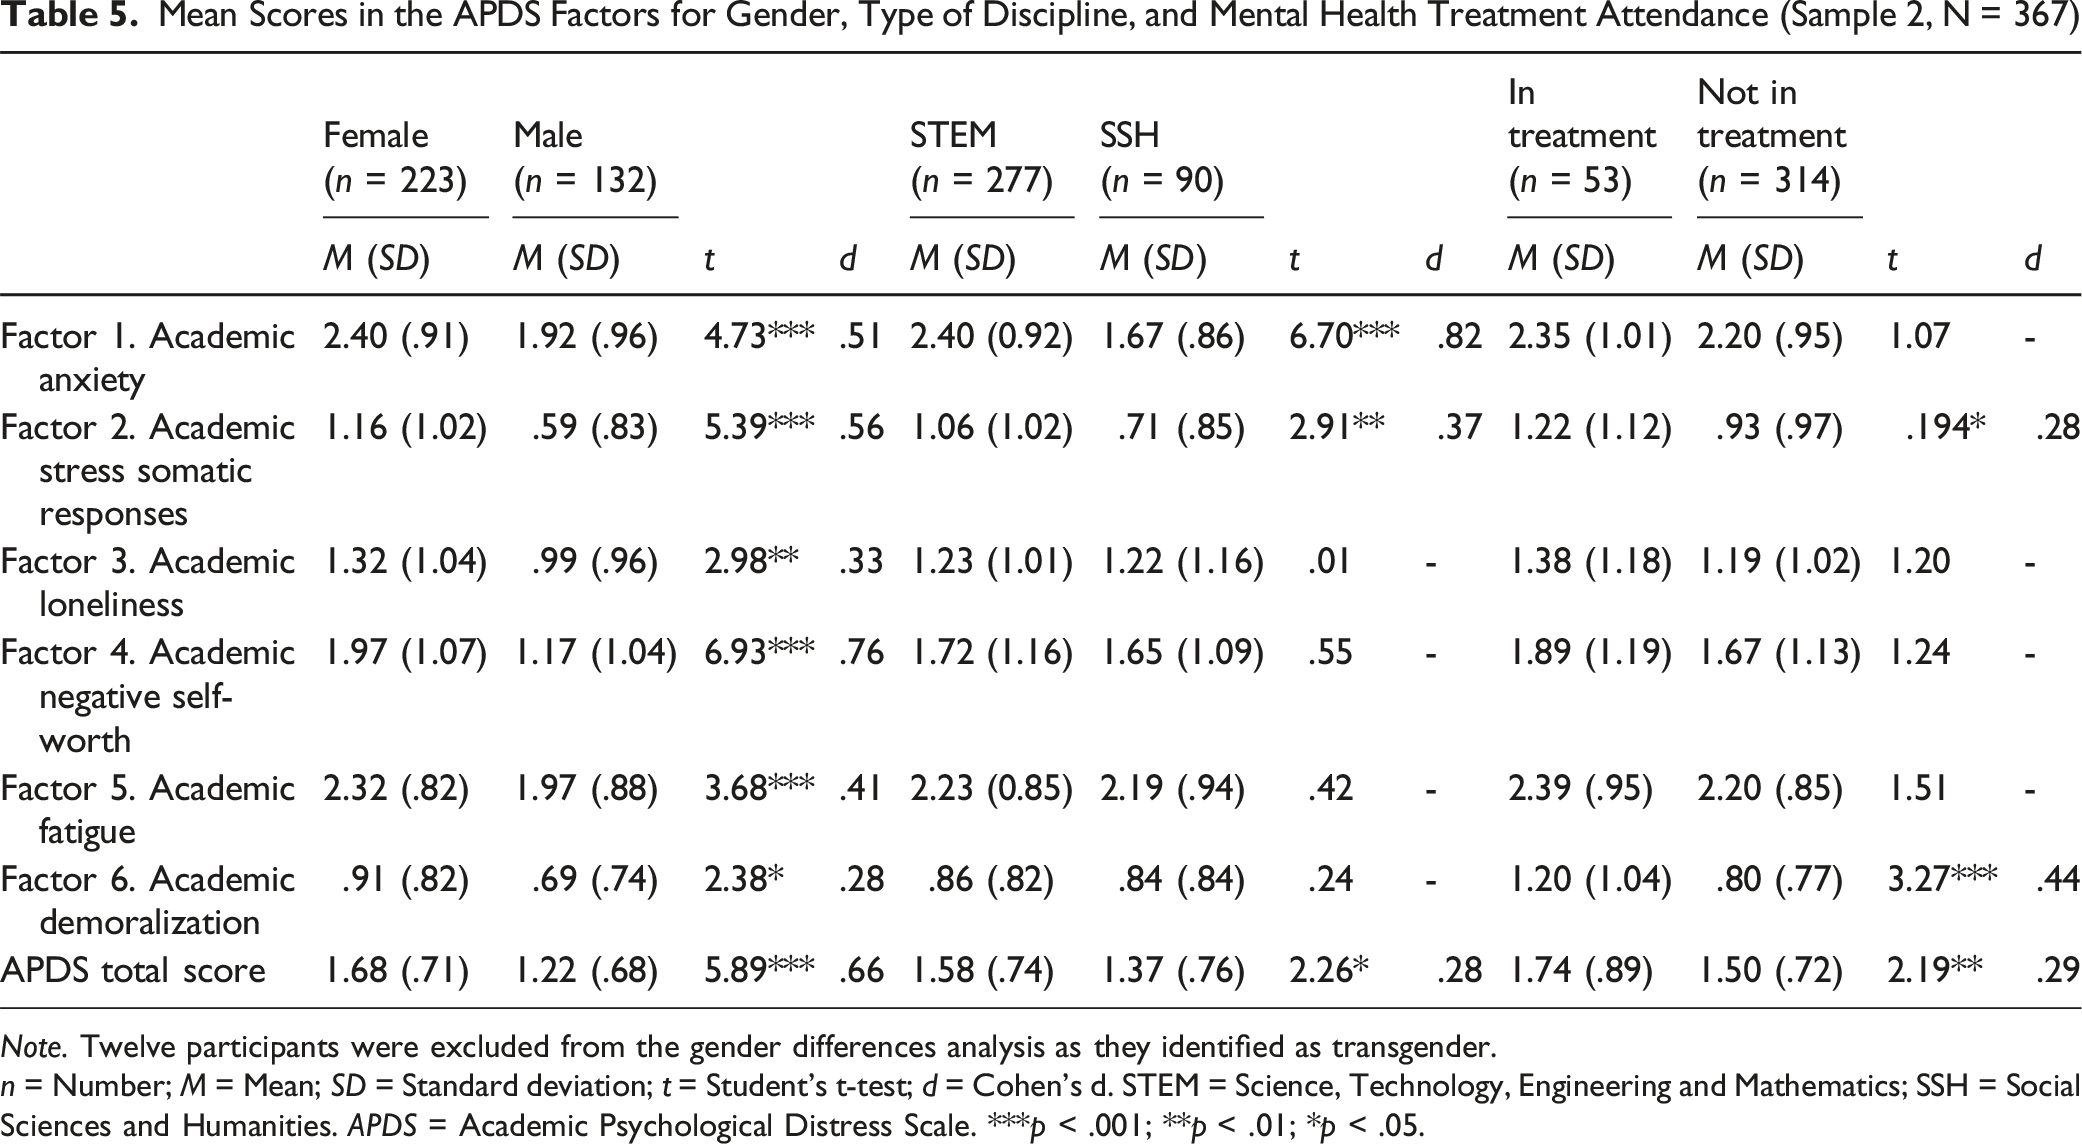
Note. Twelve participants were excluded from the gender differences analysis as they identified as transgender.
n = Number; M = Mean; SD = Standard deviation; t = Student’s t-test; d = Cohen’s d. STEM = Science, Technology, Engineering and Mathematics; SSH = Social Sciences and Humanities. APDS = Academic Psychological Distress Scale. ***p < .001; **p < .01; *p < .05.
The results revealed significant gender differences across all factors, with female participants reporting higher scores than males. Significant differences also emerged by discipline, with STEM students scoring higher than SSH students on academic anxiety (Factor 1), academic stress somatic responses (Factor 2), and the total scale. Finally, significant differences emerged based on attendance to mental health treatment. Participants currently in treatment scored higher on academic stress somatic responses, academic demoralization, and the APD total score compared to those not in treatment.
Discussion
The aim of this study was to develop and validate a multidimensional measure for APD. Overall, the results of this study have shown that the APDS can provide valid and reliable data on academic distress.
Specifically, with regard to the first hypothesis, content and face validity were assessed following the recommendations of Grant and Davis (1997). Expert judgment and item comprehensibility testing confirmed that the APDS appropriately measures its intended construct, with items aligning with the operational definition of APD.
The results of the EFA and CFA indicated a robust factor structure of the APDS, confirming our second hypothesis. More specifically, we showed that the APDS is a multidimensional measure with high internal consistency, with analyses yielding a 6-factor model comprising 25 items, which demonstrated the best fit and effectively captured key aspects of the APD construct. Specifically, Academic Anxiety is a domain-specific affective state characterized by persistent worry, tension, and a sense of being overwhelmed by academic demands. It includes cognitive preoccupation with academic concerns and behavioral manifestations such as social withdrawal due to study-related stress. This factor captures anticipatory anxiety and the difficulty in emotionally disengaging from academic pressure. Academic Stress Somatic Responses represent the physical manifestations of stress specifically associated with academic thoughts or situations. These symptoms include trembling, irregular breathing, feelings of nausea, tightness in the throat or emptiness in the stomach. These are physical reactions typically associated with autonomic hyperarousal triggered by academic anxiety. Academic Loneliness describes a subjective feeling of isolation, disconnectedness in the university environment, and lack of social support in relation to one’s academic experience. It reflects the perceived inadequacy of relationships and the lack of meaningful connections in the academic context or sources of support for one’s academic problems. Academic Negative Self-Worth refers to a pervasive and internalized sense of personal inadequacy as a student. It is characterized by self-deprecating thoughts, feelings of shame, failure, and a diminished academic self-concept that undermines self-confidence and motivation. Academic Fatigue refers to the cognitive and motivational exhaustion in dealing with academic demands. This includes difficulty concentrating, poor memory, tiredness, and lack of energy while studying, as well as procrastination as an avoidance response. Academic Demoralization refers to the loss of purpose, motivation and hope in relation to one’s academic path. This includes feelings of futility, emotional withdrawal from university life and serious consideration of dropping out.
These factors appear to overlap with the initial tentative dimensions isolated based on the theoretical model of APD. The only exception concerns the dimension of depression, which did not appear in the results of the present study. However, two of the identified factors (i.e., Academic Self-Worth and Academic Demoralization) are dimensions classically associated with the depressive domain, which typically consists of feelings of low self-worth (defined as the degree of worth one ascribes to oneself as a person) and hopelessness (defined as the feeling that one will not experience positive emotions or improvement in one’s condition; Renouf & Harter, 1990; Tecuta et al., 2015).
Importantly, the identification of these factors for APD is also consistent with the multidimensional structure of distress that underlies the most widely used and accepted definitions in the literature. According to this, distress is defined as a state of emotional suffering marked by symptoms of anxiety, hopelessness, and sadness (Mirowsky & Ross, 2002). It is often accompanied by somatic symptoms (e.g., lack of energy, insomnia), cognitive fatigue (i.e., cognitive dysfunction and reduced motivation), and social dysfunction (i.e., withdrawal and isolation) (Massé, 2000; Matthews, 2016; Ridner, 2004). The present study also confirms this structure in relation to this specific form of distress associated with university experience.
Concerning the third hypothesis, the analysis of AVE, CR, and squared correlations supports the convergent validity of the APDS. For all APDS instrument factors – except Factor 6 (Academic Demoralization) – AVE values exceeded the .50 threshold, indicating acceptable convergent validity. Additionally, all CR values were above the recommended .70 threshold, demonstrating the acceptable reliability of each factor. These results support the validity of the 6-factor model, confirming that the six APD dimensions are correlated yet distinct. Each dimension captures a specific aspect of the construct, reflecting its unique contribution while remaining part of the broader concept. Similarly, discriminant validity has also been established.
Additionally, the APDS demonstrated robust psychometric properties, including adequate score variability and strong internal consistency as indicated by Cronbach’s alpha and confirming our fourth hypothesis. Furthermore, the skewness and kurtosis indices showed favorable factor values.
In addition, the positive, strong, and significant relationship between APDS and the Academic Distress Subscale of the CCAPS-62 offers support to its construct validity, therefore confirming the fifth hypothesis of the study.
Evidence of criterion-related validity was also found, as APDS correlated significantly (both in total score and individual dimensions) with general stress, academic stress, and academic engagement. These findings support the literature underlying our sixth hypothesis, which identifies academic stressors as the main antecedents of students’ distress states and university maladjustment (Choi & Lee, 2012; Kristensen et al., 2023; Passeggia et al., 2023; Scandurra et al., 2024; Sheldon et al., 2021). Furthermore, these findings are consistent with the data that APD is correlated with a variety of negative conditions, both in terms of poorer mental health and lower academic performance and likelihood of remaining enrolled in university (Scandurra et al., 2024).
Notably, these findings are consistent with the literature indicating a strong association between general distress and APD (Scandurra et al., 2024), although the directionality of this relationship remains to be clarified. Indeed, it is possible that academic distress contributes negatively to mental health (McIntyre et al., 2018) and/or that people suffering from poor mental health are more prone to develop an emotionally problematic relationship with university (Andersen et al., 2021; Ghosh et al., 2021). Future studies are needed to further explore this relationship. Regarding correlations with academic performance, our results show that while GPA is negatively correlated with overall APD scores, it is not associated with all dimensions of APD. Specifically, it shows negative correlations only with academic self-worth, academic fatigue, and academic demoralization. These data confirm the strong influence of academic performance on academic self-concept documented in several studies (Marsh & Martin, 2011; Wu et al., 2021). Moreover, they also seem to be in line with the data found in the literature that persistent academic failure has a negative impact on learners and their motivation in relation to themselves and their academic performance, leading to states of despair and academic-related hopelessness (Au et al., 2009). Another hypothesis is that general psychological dimensions may influence academic performance through the mediating role of APD dimensions. For example, Diotiaiuti et al. (2021) found that procrastination (i.e., a manifestation of academic fatigue) mediates the relationship between emotional balance and academic performance. Integrating this perspective would allow for a deeper understanding of students’ psychological responses to academic demands.
As for the differences in APD scores based on sociodemographic variables, the results of our study showed the influence of gender on the level of distress reported by students. These findings are consistent with previous research that has shown gender differences in levels of academic stress (Backović et al., 2012) and satisfaction with academic life (Nogueira et al., 2022). This increased susceptibility to APD among women may be explained by their higher perceptions of stress related to academic demands, deadlines, and expectations, as well as poorer relationships with teachers and peers (Calaguas, 2011). These factors may stem from a greater tendency toward personal inadequacy, negative thinking, lower self-worth (Nogueira et al., 2022), and higher levels of perfectionism compared to men (Ghosh & Roy, 2017). In addition, our results show differences in APD scores between majors, confirming the high rates of stress and symptoms of poor mental health in undergraduates in STEM courses found in previous literature (Vitasari et al., 2010). Furthermore, our study indicates that students currently receiving treatment from mental health services (including university counseling, psychotherapy, and pharmacological treatment) have higher levels of academic distress. Although the small number of students in this subgroup did not allow for sub-analyses by type of intervention, the finding is consistent with existing data. Students typically seek university counseling for emotional difficulties related to studying, and preliminary evidence suggests that help-seeking students report higher levels of academic distress than their non help-seeking peers (Glickman et al., 2023; Lockard et al., 2012).
Limitations and Suggestions for Future Research
Our study has a number of limitations that should be considered when interpreting its results.
A first set of limitations concerns methodological biases. The exclusive use of self-report could have led to response biases such as social desirability or subjective misinterpretation of the items. Future studies should consider the inclusion of multi-informant reports or performance-based ratings to increase the validity of the results. In addition, the study did not directly compare the APDS to existing psychometric instruments for assessing student distress. This omission limits the ability to determine whether the APDS provides additional predictive or discriminative value beyond what is already available. Comparative analyses with established instruments are therefore recommended. Furthermore, the study did not assess the predictive validity of the APDS over time. Future studies should address this question in the context of longitudinal studies, taking into account that the APD may vary depending on the year of study and the specific developmental stage of studenthood.
A second set of limitations relates to the socio-demographic characteristics of the sample. All participants were Italian students, which limits the generalizability of the results to other cultural and educational contexts. Cross-national studies are needed to assess the cross-cultural applicability of the APDS, especially considering the structural differences in the higher education systems and labour market of different countries. In addition, the sample included only a small number of students with disabilities and specific learning disorders, which prevents a comparison of subgroups. Given the well-documented vulnerability of these populations to academic maladjustment and dropout, future research should investigate whether higher levels of APD are observed in these groups. Also, the small number of trans and non-binary individuals did not allow for analysis of differences in APD scores by gender. Furthermore, as no data was collected on participants’ ethnicity, it was not possible to conduct intersectional analyses. Future studies should endeavor to include more diverse samples in terms of gender and ethnicity to examine potential differences in APD. Finally, we were unable to examine differences in APD scores as a function of type of mental health treatment (e.g., university counseling vs. psychotherapy). This aspect requires further investigation to understand whether different forms of intervention are associated with different APD profiles.
Implications for Clinical Practice
The conceptual clarification and empirical operationalization of APD has direct implications for clinical practice in the university setting. First, recognizing APD as a multidimensional, context-specific construct underscores the need for interventions that are tailored to the academic setting rather than relying solely on general psychopathological concepts. Conventional therapies may overlook the developmental and relational dynamics embedded in student life. The distinction between APD and general psychological distress underscores the value of using domain-specific instruments such as the APDS to guide case formulation. Used in counseling centers, it can be a valuable clinical instrument by supporting the intake process and assisting the clinician’s decision making regarding treatment planning. Furthermore, the APDS can serve as an early tool to identify students at risk of dropping out by capturing psychological dimensions associated with these outcomes, such as fatigue, demoralization, and low academic self-esteem. Thanks to its sensitivity to context, students who are struggling to adjust can be identified even if no clinical symptoms are present. When used at key academic junctures (e.g., beginning of semester or exam period), the APDS can provide timely, targeted interventions within a stepped-care framework to prevent escalation and support more accurate allocation of mental health resources.
Secondly, the 6-factor structure of APD (consisting of anxiety, somatic responses, loneliness, negative self-worth, fatigue and demoralization) supports the use of modular interventions targeting specific domains. For example, cognitive-behavioral techniques can address academic anxiety, emotion-focused strategies can help with negative self-perception, and interpersonal approaches can reduce academic loneliness. However, these interventions should also aim to strengthen students’ academic identity, support their integration into the student role, and improve their relationships within the academic environment. The developmental perspective of APD also encourages clinicians to situate students’ difficulties within the broader context of emerging adulthood and to recognize the identity challenges and autonomy-related tensions that accompany this stage of life. This perspective requires integrative interventions that address the individual, relational and institutional levels.
A further conclusion concerns the need for differentiated levels of intervention. In particular, a stepped-care care approach is recommended to ensure that interventions are adapted to both the severity and contextual specificities of students’ difficulties. At the community level, universities should implement institutional strategies aimed at improving the academic climate, promoting students’ inclusion and engagement and supporting their needs for autonomy, relatedness and competence (Gilbert et al., 2021, 2023). For students experiencing transient or moderate forms of distress, low-intensity interventions, such as psychoeducational groups, study skills training, or guided self-help, can be implemented individually or in groups (e.g., Amodeo et al., 2017; Hanson et al., 2016; Martino et al., 2022; Scandurra et al., 2018; Short et al., 2010). In cases where APD becomes persistent and clinically impairing, more intensive psychological interventions are required. These may include supportive cognitive-behavioral interventions (Conley et al., 2013; Powers et al., 2017; Smits et al., 2012), acceptance-based approaches (Coto-Lesmes et al., 2020; Twohig & Levin, 2017), or psychodynamic treatments (Lemma et al., 2010) aimed at processing the negative self-evaluation as a student, reframing the appraisal of stress, improving self-regulation, and strengthening adaptive coping strategies.
Conclusions
The APDS represents a valuable contribution to the understanding of university students’ distress. Its robust factor structure, high internal consistency, and significant convergent, discriminant, and construct validity confirm its reliability as a measurement tool. The six identified factors provide a comprehensive picture of APD. The APDS can serve as a practical tool for researchers and mental health practitioners, providing insight into the development of targeted interventions and improving students’ academic experiences. Despite its strengths, further validation of the APDS across diverse populations, along with longitudinal evaluation of its predictive validity, is recommended to enhance its generalizability and reliability.
Supplemental Material
Supplemental Material - Academic Psychological Distress Scale: Development and Psychometric Validation of a Multidimensional Measure for University Students
Supplemental Material for Academic Psychological Distress Scale: Development and Psychometric Validation of a Multidimensional Measure for University Students by Cristiano Scandurra, Rosa Pizzo, Giovanna Esposito, and Maria Francesca Freda in Emerging Adulthood.
Footnotes
Ethical Approval
The study was approved by the Ethical Committee of the University of Naples Federico II (protocol number: 18/2024), and designed according to the EU General Data Protection Regulation and the principles of the Declaration of Helsinki on Ethical Principles for Medical Research Involving Human Subjects.
Funding
The authors received no financial support for the research, authorship, and/or publication of this article.
Declaration of Conflicting Interests
The authors declared no potential conflicts of interest with respect to the research, authorship, and/or publication of this article.
Data Availability Statement
The data supporting the present article are available from the corresponding author upon reasonable request.
Transparency and Openness Statement
The raw data, analysis code, and materials used in this study are not openly available but are available upon request to the corresponding author. The data collection and analysis were not pre-registered.
Supplemental Material
Supplemental material for this article is available online.
Author Biographies
References
Supplementary Material
Please find the following supplemental material available below.
For Open Access articles published under a Creative Commons License, all supplemental material carries the same license as the article it is associated with.
For non-Open Access articles published, all supplemental material carries a non-exclusive license, and permission requests for re-use of supplemental material or any part of supplemental material shall be sent directly to the copyright owner as specified in the copyright notice associated with the article.