
Abstract
Risk of depression increases considerably during the menopause transition (or perimenopause)—the 5 to 6 years surrounding the last menstrual period. Although the mechanisms underlying this increased risk are unknown, we have hypothesized that excessive estradiol (E2) fluctuation, which accompanies the perimenopause, may be implicated. We have furthermore proposed that dysregulation of the hypothalamic–pituitary–adrenal (HPA) axis may underlie E2 fluctuation’s effect on mood. This study examined the relationship between weekly changes in salivary E2, salivary cortisol levels, and weekly mood in 30 perimenopausal women recruited to achieve equal numbers of women with current depression, past depression, and no history of depression. Greater weekly increases in E2 were associated with increased cortisol among past and currently depressed women; greater E2 increases were also associated with negative mood among currently depressed women. These findings provide evidence that HPA axis dysregulation, correlated with E2 fluctuation, may be implicated in the pathophysiology of perimenopausal depression.
Keywords
The rate of major depressive disorder in women of reproductive age is double that of men’s. Depressive disorders tied to reproductive events may partially account for this increased risk. Premenstrual dysphoric disorder (PMDD) and postpartum depression are two such disorders; substantially less research has been conducted on depressive disorders tied to the menopause transition, though they have been gaining attention in recent research (Gordon et al., 2015; Schmidt et al., 2015; Shteinlukht, Marsh, Nadolny, & Jain, 2015).
The menopause transition (or perimenopause) is triggered by a woman’s diminishing supply of ovarian follicles (i.e., eggs) and represents the 5- to 6-year transition from reproductively capable ovulatory menstrual cycles to the cessation of menstruation. Although this transition is relatively smooth for most, studies estimate that between 26% and 33% of women develop clinically significant depressive symptoms during this time (Bromberger et al., 2011; Bromberger et al., 2007; Cohen, Soares, Vitonis, Otto, & Harlow, 2006; Freeman et al., 2004; Woods et al., 2008). Rates of full-blown major depressive disorder during the menopause transition range between 12% and 23% (Bromberger et al., 2005; Bromberger et al., 2007; Cohen et al., 2006; Pratt & Brody, 2008). A parallel increase in suicidal ideation and suicide attempts emerges in perimenopausal women compared with pre- or postmenopausal women or aged-matched men (Usall et al., 2009).
Despite the incredible burden that perimenopausal depression places on millions of women, very little is known about the biological mechanisms underlying its etiology. However, it has been hypothesized that extreme fluctuation in ovarian hormones, which characterizes the menopause transition, may play a role (Freeman, 2010; Schmidt & Rubinow, 2009). Whereas progesterone fluctuation progressively declines over the menopause transition, variability in E2 concentrations increases. For example, a perimenopausal woman’s E2 levels can periodically dip to postmenopausal levels; on the other hand, ovulatory cycles in the perimenopause can actually be associated with unusually high E2 levels. This increased E2 variability is likely the by-product of a number of factors: (a) extreme day-to-day fluctuation in follicle-stimulating hormone (FSH), which controls the development of E2-producing follicles in the ovaries; (b) greater variability in the number of follicles available for stimulation; and (c) variability in the degree to which the ovaries are sensitive to FSH’s stimulation (see Burger, Hale, Robertson, & Dennerstein, 2007; Hale, Robertson, & Burger, 2014; Santoro & Randolph, 2011, for review).
The role of E2 fluctuation in the etiology of perimenopausal depression has been of particular interest because progesterone levels gradually stabilize throughout the perimenopause, and there is little evidence that FSH directly influences human behavior. To our knowledge, five studies to date have evaluated the E2 variability hypothesis of perimenopausal depression by examining naturally occurring fluctuations in E2 in relation to depressive symptoms among perimenopausal women, with three of these studies obtaining null findings (Avis, Crawford, Stellato, & Longcope, 2001; Bromberger et al., 2011; Woods et al., 2008) and two studies observing a significant association between E2 fluctuation and depressive symptoms (Freeman, Sammel, Lin, & Nelson, 2006; Gordon, Rubinow, Eisenlohr-Moul, Leserman, & Girdler, 2016). Although the negative studies assessed hormone levels at most once annually, the positive studies used more frequent hormonal assessments—twice and four times annually, respectively—which may have accounted for their ability to detect a significant relationship between hormonal variability and mood. In addition to the above studies examining natural E2 fluctuation in relation to perimenopausal depressive symptoms, a recent study has experimentally manipulated E2 levels to test the effect of E2 withdrawal on perimenopausal mood (Schmidt et al., 2015). This study placed 56 euthymic perimenopausal women on 3 weeks of transdermal E2 and then blindly and abruptly withdrew half of the women. Those with a history of perimenopausal depression had an increase in depressive symptoms within 1 to 3 weeks of hormone withdrawal, an effect not seen in unaffected controls or in those maintained on E2.
Taken together, this body of research provides some evidence that increased sensitivity to changes in E2 may be implicated in the development of perimenopausal depression. In other words, for some “sensitive” women, acute increases or decreases in E2 binding in areas of the brain may trigger a cascade of neurobiological events that increase the likelihood of negative mood. Whether these women’s response to acute changes in E2 is categorically different than that of other women or whether their response is simply an amplified version of what most women experience is entirely unknown, though both options are possible. However, further research confirming the importance of sensitivity to E2 change is warranted given the inconsistent findings in the literature.
It should be recognized that, as is the case with depression unrelated to reproductive events, psychosocial stressors also predict an increased risk of perimenopausal depression. Although the validity of the long-held view that perimenopausal depression is simply a manifestation of the “empty nest syndrome” (when children leave home) is questionable, it is the case that unemployment (Freeman et al., 2004), financial strain (Bromberger et al., 2007), lack of social support (Bromberger et al., 2007), and recent stressful life events such as divorce or the death of a loved one (Bromberger et al., 2011; Bromberger et al., 2007) predict an increased risk for both depressive symptoms and syndromal major depressive disorder during the menopause transition. The physical symptoms that commonly accompany the menopause transition, such as poor sleep (Freeman et al., 2004) and vasomotor symptoms (Cohen et al., 2006; Freeman et al., 2004; Woods et al., 2008) are also associated with an increased risk of perimenopausal depression. With this in mind, we recently proposed a mechanistic heuristic model of perimenopausal depression development that would account for the importance of both hormonal and psychosocial factors in the development of perimenopausal depression (Gordon et al., 2015). This model proposes that, by triggering biological changes in a woman’s stress physiology, dynamic and substantial changes in E2 concentrations might increase a perimenopausal woman’s sensitivity to stress: As a result, she is more vulnerable to developing depression if exposed to psychosocial factors such as major life stressors or if she has a genetic or personality predisposition to developing depression.
More specifically, the previously mentioned model proposes that extreme E2 fluctuation may trigger dysregulation of the hypothalamic–pituitary–adrenal (HPA) axis. The HPA axis, the end product of which is the stress hormone cortisol, is central to regulating one’s physiological and psychological response to stress; it is therefore unsurprising that signs of HPA axis dysregulation are predictive of both depression onset (Adam et al., 2010; Harris et al., 2000) and depression relapse (Appelhof et al., 2006). The presence of E2 receptors in multiple brain regions that regulate the HPA axis, such as the hypothalamus, the amygdala, and hippocampus, would also lead one to believe that HPA axis dysregulation could be relevant to the etiology of perimenopausal depression (Österlund, Gustafsson, Keller, & Hurd, 2000; Österlund & Hurd, 2001; Wharton, Gleason, Olson, Carlsson, & Asthana, 2012). HPA axis dysregulation in perimenopausal depression is also supported by studies observing alterations in HPA axis activity in other reproductive mood disorders such as postpartum depression (Bloch, Daly, & Rubinow, 2003; Bloch et al., 2005; Greenwood & Parker, 1984; Jolley, Elmore, Barnard, & Carr, 2007; Magiakou et al., 1996; Wisner & Stowe, 1997) and PMDD (Bancroft, Cook, Davidson, Bennie, & Goodwin, 1991; Girdler et al., 1998; Roca et al., 2003; Su, Schmidt, Danaceau, Murphy, & Rubinow, 1997). Although a small study (Schmidt, Murphy, Haq, Danaceau, & Clair, 2002) found no difference in the basal cortisol levels of women with perimenopausal depression when compared with euthymic controls, to our knowledge, there have not been any studies examining perimenopausal E2 fluctuation in relation to HPA axis tone.
A study that is ideally suited to test the validity of our proposed model suggesting that E2 variability contributes to HPA axis destabilization and, consequently, to mood impairment in women with perimenopausal depression development would involve frequent concurrent measurements of E2, HPA axis activity, and mood. Of course, as the frequency of such measurements increases, there is a parallel increase in participant burden. Thus, developing a protocol that is both scientifically valid and acceptable to prospective participants poses a challenge. The measurement of E2 using a noninvasive method that can be performed at home, such as with the use of self-collected saliva samples, may be one way to overcome this obstacle. Thus, here we describe the results of a longitudinal study with three primary aims: (a) to assess the feasibility of capturing perimenopausal E2 fluctuation with home salivary E2 samples taken on a weekly basis, (b) to examine the relationship between week-to-week changes in E2 and weekly mood, and (c) to determine if there is evidence suggesting that HPA axis activation covaries with both perimenopausal E2 fluctuation and mood. A secondary exploratory aim was to examine whether the effect of week-to-week E2 change on mood and HPA axis activity would differ among women with different psychiatric histories. In light of the existing literature linking E2 fluctuation and depressive symptoms as well as our recently proposed heuristic model of perimenopausal depression suggesting a role for HPA axis dysregulation in its pathophysiology (Gordon et al., 2015), it was hypothesized that greater E2 change from one week to the next would be associated with worse mood and increased HPA axis activation and that these associations would be stronger among women with an increased vulnerability to depression—thus, women with either current or past depression.
Methods
Participants
Thirty medically healthy women aged 45 to 60 years and perimenopausal according to the Stages of Reproductive Aging Workshop (STRAW +10) criteria (early perimenopause, defined as menstrual cycle length 7+ days longer than usual; late perimenopause, defined as ≥2 skipped cycles and an interval of amenorrhea ≥60 days but within 1 year of the last menstrual period) were recruited. Women who had had their uterus removed were deemed eligible if they were aged 45 to 50, had at least one remaining ovary, and reported current menopausal symptoms (e.g., vasomotor symptoms) (n = 2). To explore the possibility that sensitivity to E2 fluctuation might differ depending on current or past mental health, three groups of women (n = 10 in each) were recruited on the basis of the results of the Structured Clinical Interview for Diagnostic and Statistical Manual of Mental Disorders (4th ed.; DSM–IV)–Non-patient edition (SCID-NP). These groups included the following: a currently depressed group (meeting DSM-IV criteria for Major Depressive Disorder, Minor Depressive Disorder, or Dysthymia), a past-depressed group (meeting DSM-IV criteria for past Major Depressive Disorder or Dysthymia but in remission for at least 6 months), and a never-depressed group. Participants’ mean age was 51.2 years (range = 45–56). Sixty-two percent of women were Caucasian, 31% were African American, and 7% were Asian. Fifty-eight percent of women were college graduates, whereas 100% had graduated from high school. Mean household income was in the range of US$50,000 to US$79,999.
Exclusion criteria included the following: gingivitis and other oral diseases or injuries that are accompanied by blood in the mouth (as the presence of blood in saliva can influence the measurement of salivary hormones); history of any cardiovascular disease (CVD); diabetes; blood pressure greater than 140/90 mmHg; body mass index (BMI) greater than 40; cigarette smoking greater than 10 per day; use of psychotropic medication, hormonal preparations, or frequent use of anti-inflammatory agents (>10 times/month); less than 2 years in remission from substance dependence; or intending to begin psychotherapy in the next 4 to 5 weeks. Due to ethical concerns related to requesting that depressed individuals refrain from seeking treatment for the duration of the study, a history of attempted suicide or any current active suicidal ideation was also exclusionary. Those with a history of bipolar or psychotic disorders were also excluded. The study protocol was approved by the institution’s Institutional Review Board. All participants provided informed, written consent prior to participating and received up to $150 in compensation for participating in full compliance.
Procedure
Participants first underwent an enrollment visit during which their study eligibility was determined and informed written consent was obtained. At this time, participants completed questionnaires assessing detailed medical and medication history, demographic characteristics, and depressive symptoms. A trained interviewer administered the SCID-NP with a psychotic screen for Axis I disorders. If determined eligible for the study, detailed instructions on saliva collection were given and a practice saliva sample was conducted with the research assistant present. Participants were instructed to collect saliva samples 1 day per week for 4 consecutive weeks and were given sampling supplies, an information packet, a sample collection diary for noting the exact time of saliva collection and any protocol deviations, as well as mood assessment questionnaires to take home. Prior to saliva collection, participants were to avoid the following: alcohol and exercise for 12 hours, eating or drinking anything other than water for 1 hour, brushing their teeth for 45 min, and dental work for 48 hours. It should be noted that the 12-hour restriction on exercise was perhaps overly conservative but was put in place to avoid any lingering effects of vigorous exercise on E2 levels (Bonen et al., 1979; Walberg-Rankin, Franke, & Gwazdauskas, 1992). If necessary, participants were also to rinse their mouths with water to remove food residue; however, participants were instructed to allow at least 10 min to elapse prior to saliva collection to avoid dilution. Deviations from these instructions were to be noted in the sample collection diary.
Each week, on the day prior to a saliva collection day, participants were contacted and reminded of the protocol. In order to capture a more integrated 24-hour profile, on each collection day, samples were collected at the same four specified time points for each subject and for each week: immediately upon waking, 30 min after waking, 3:00 p.m., and 3:00 a.m. Although all four time points were used to calculate the within-person mean E2 level for each weekly 24-hour period, because the focus of this study was on HPA axis activation, only the waking and 30-min postwaking samples were analyzed and averaged to generate an index of overall morning levels and were also used to calculate the cortisol wakening response (30-min sample minus the waking sample), a reliable measure of HPA axis reactivity that correlates highly with traditional pharmacological HPA axis challenge tests (Schmidt-Reinwald et al., 1999). Each saliva sample was stored in the participant’s home freezer, where it remained until the end of the study, at which point participants transported their saliva samples to the research laboratory in a cooler. Once at the laboratory, samples were stored at −80 °C until assayed. In cases where the participant was outside of the home for the 3:00 p.m. sample and to avoid the repeated thawing and refreezing of samples, participants were to refrigerate the saliva sample until the sample could be transported home in a cooler and stored in their home freezer. These collection/storage methods are consistent with the assay manufacturer (Salimetrics)’s recommendations and are validated by research finding salivary steroids, even when uncentrifuged, remain stable at −20 °C for up to 9 months (see Wood, 2009, for review). At the time of each saliva collection, participants also completed an assessment of their current mood and vasomotor symptoms. Finally, participants were instructed to complete the Center for Epidemiologic Studies–Depression Scale (CES-D) at the end of each collection day to assess depressive symptoms during the previous week.
Weekly measures
Weekly E2 change
E2 levels were averaged across all four within-day measurements. Weekly change in E2 was calculated as the difference between the mean E2 level of one week and the mean E2 level of the previous week. Salivary E2 was determined using a 17β-Estradiol Enzyme Immunoassay Kit (Salimetrics). Intra- and interassay coefficients of variation were low, at 5.7% and 2.5%, respectively; therefore, all samples from a single individual were not necessarily run in the same assay. The following standard curve calibrators were used: 32, 16, 8, 4, 2, and 1 pg/ml. The minimal E2 detection level with this assay is 0.1 pg/ml. Samples with E2 > 32 pg/ml were diluted, rerun, and the concentration multiplied by the dilution factor.
HPA axis activation
Saliva samples collected upon waking and 30 min postwaking were assayed for cortisol. Using these two levels, both the mean and cortisol awakening responses (30-min postwaking level minus waking level) were calculated, the former representing overall early morning cortisol output and the latter representing the HPA axis response to awakening. Salivary cortisol was determined using a Cortisol Enzyme Immunoassay Kit (Salimetrics) processed at the University of North Carolina (UNC) Biobehavioral Lab in the UNC School of Nursing. Intra- and interassay coefficients of variation were low, at 4% and 4%, respectively; therefore, all samples from a single individual were not necessarily run in the same assay. The following standard curve calibrators were used: 3.000, 1.000, 0.333, 0.111, 0.030, and 0.012 µg/dl. The minimum cortisol detection level with this assay is 0.007 µg/dl. Samples with cortisol values greater than 3.0 µg/dl were diluted, rerun, and the concentration multiplied by the dilution factor.
The UNC Biobehavioral Lab in the UNC School of Nursing performed the assays. All samples were spun to eliminate mucin after freezing.
Depressive symptoms
Depressive symptoms were assessed using the CES-D, a 20-item self-report form that asks about the frequency of depressive symptoms during the previous week on a 4-point scale of 0 (rarely) to 3 (most or all of the time) (Radloff, 1977). A score of 16 or above is commonly used as a cutoff for identifying potential clinical depression (Boyd, Weissman, Thompson, & Myers, 1982) and is predictive of major depression (Thomas, Jones, Scarinci, Mehan, & Brantley, 2001). Three subscales of the CES-D—somatic symptoms (Items 1, 2, 5, 7, 11, and 20), negative affect (Items 3, 6, 14, and 18), and anhedonia (Items 4, 8, 12, and 16) (Carleton et al., 2013)—were also examined in the current study. The CES-D has been frequently used in perimenopausal samples (Avis & McKinlay, 1995; Bromberger et al., 2011; Daly, Danaceau, Rubinow, & Schmidt, 2003; Freeman et al., 2006; Woods et al., 2008).
Weekly mood
Mood was assessed by having participants rate, from 0 to 10, the degree to which they felt hopeless, anxious, angry, rejected, and guilty. Participants completed this assessment at the four collection times throughout each saliva collection day; however, for the purposes of this study, ratings were averaged across all four assessments to yield a daily mood average.
Vasomotor symptoms
Similarly, participants rated the severity of their hot flashes from 0 to 10 at the four collections times per day, and vasomotor symptom severity was averaged across the four daily assessments each day to yield a daily average vasomotor symptom rating.
Statistical analyses
Hypothesis tests were carried out as two-level multilevel regression models (with weekly observations nested within women) using PROC MIXED in SAS 9.4. A repeated statement specified an autoregressive (Week 1) covariance structure for within-person error. Model fit was evaluated as significant change in −2 log likelihood from a model with no predictors. To test the hypothesis that greater changes in E2 from the previous week’s E2 concentration would be associated with increased affective symptoms and changes in HPA axis on the following week (referred to as the “index week” hereafter), we examined models (see equations that follow) predicting the outcome in the index week from the following predictors: (a) vasomotor symptoms (covariate because vasomotor symptoms are pathophysiologically related to low E2 levels [Freedman, 2005] and are associated with depressed mood [Joffe et al., 2002]), (b) a woman’s mean E2 across all weeks, (c) degree of absolute change in E2 since last week, (d) direction of E2 change (where 0 = decrease since last week and 1 = increase since last week), and (e) the interaction of absolute E2 change since last week and direction of change. 1 Absolute change in E2 was specified as a random effect. Follow-up exploratory analyses examined whether the effects of the E2 variables described earlier were exacerbated among women with either remitted (past) depression (coded as 1) or current depression (coded as 2) compared to women with no history of depression (coded as 0).
The multilevel models for primary analyses were constructed as shown subsequently for woman j at week i. In this example, CES-D is the weekly outcome. Equation 1 depicts the Level 1 equation:
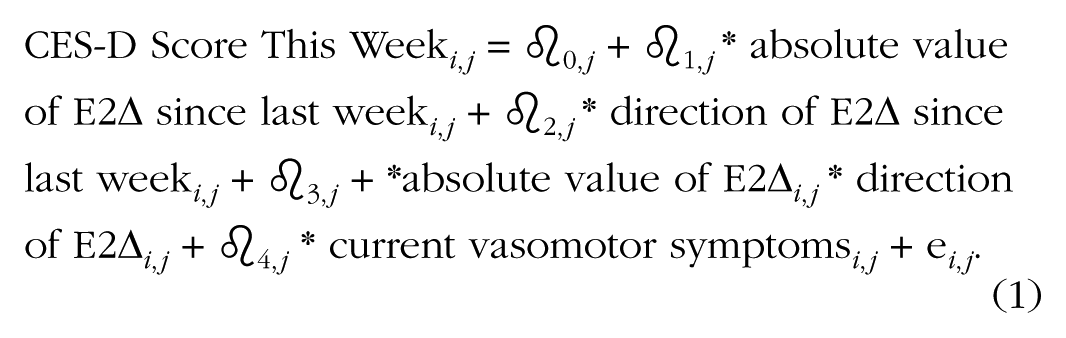
In Equation 1, CES-D score at week i is a function of person j’s intercept CES-D (
In addition, Equation 2a models differences in CES-D scores between people across waves as a function of the sample CES-D intercept (η0,0), average E2 across weeks (η0,2), and unexplained variance (U0,j), as shown in the Level 2 equation:

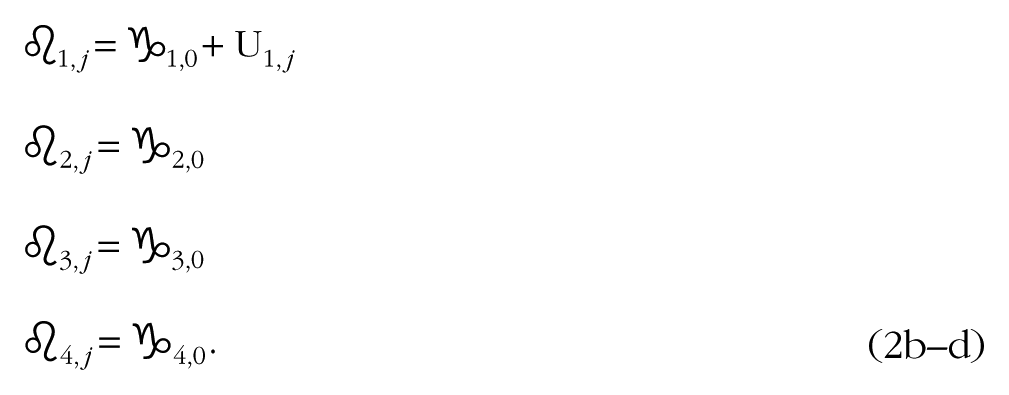
Finally, Equations 2b through 2d describe fixed (i.e., consistent across people) effects of most within-person predictors on CES-D score. However, the effect of absolute E2 change on weekly CES-D demonstrated significant between-person variability and was therefore specified as a random effect described by both the average effect of absolute E2 change on weekly CES-D (η1,0) and between-person differences in this effect (U1,j):
It should be noted that due to the nature of the analyses described above, with past-week E2 change predicting weekly cortisol and affective symptoms, cortisol and mood assessments made during Week 1 of the study were not used in analyses except in the calculation of weekly change scores.
Power analyses
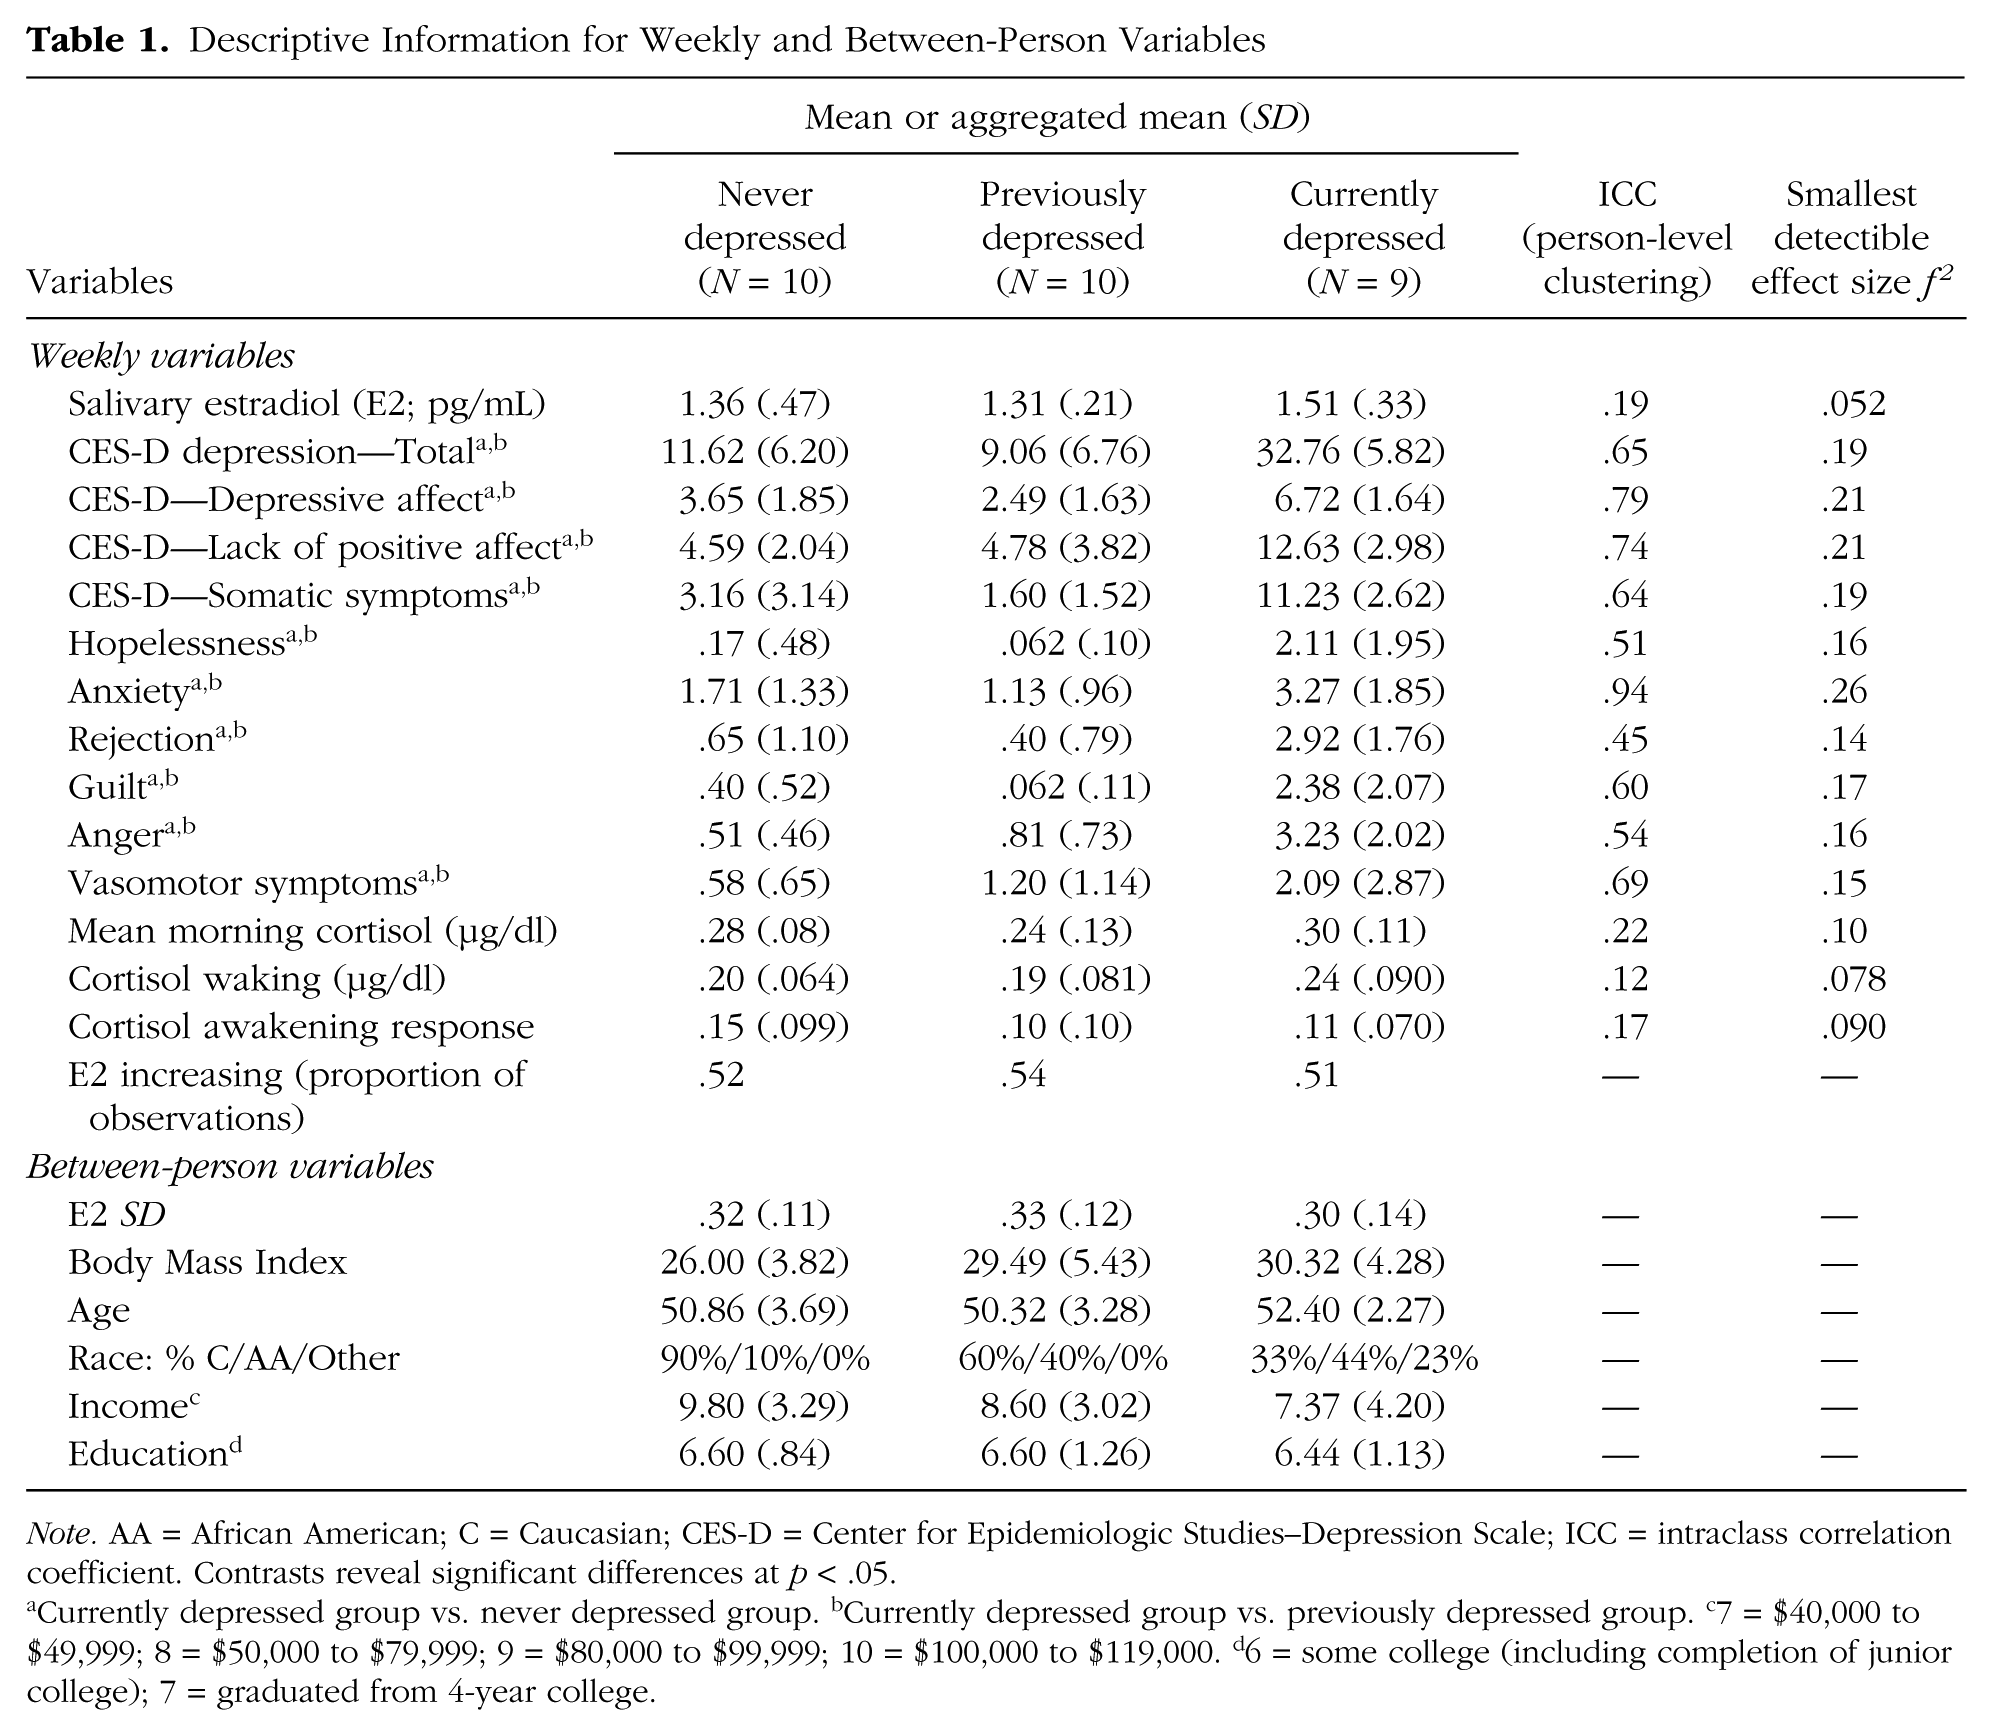
Power analyses were carried out as sensitivity analyses; that is, for each weekly outcome, we used the observed intraclass correlation (ICC) in our sample to estimate the smallest detectible effect size f2 (Snijders & Bosker, 1999). Results for each outcome can be found in Table 1. According to Murphy and Myors (2004), local effect size conventions for multilevel regression coefficients (or functional sets of coefficients) are roughly as follows: .02 = small effect, .15 = medium effect, and .35 = large effect. For cortisol outcomes, the smallest detectible effect sizes were conventionally small-to-medium (range = .078–.10). For affective outcomes, the smallest detectible effect sizes were conventionally medium-to-large, with a range of .14 (rejection; small-to-medium) to .26 (anxiety; medium-to-large). In sum, although the present study was not powered to detect conventionally small effects of E2 changes on affective symptoms specifically, it was adequately powered to detect at least conventionally medium-sized effects on both HPA axis function and affective symptoms. Power analyses for the exploratory moderation analyses indicated sufficient power to detect only large effects; therefore, the exploratory three-way interaction analyses were not powered to detect small-to-medium–sized differences between the three groups.
Descriptive Information for Weekly and Between-Person Variables
Note. AA = African American; C = Caucasian; CES-D = Center for Epidemiologic Studies–Depression Scale; ICC = intraclass correlation coefficient. Contrasts reveal significant differences at p < .05.
Currently depressed group vs. never depressed group. bCurrently depressed group vs. previously depressed group. c7 = $40,000 to $49,999; 8 = $50,000 to $79,999; 9 = $80,000 to $99,999; 10 = $100,000 to $119,000. d6 = some college (including completion of junior college); 7 = graduated from 4-year college.
Results
Study adherence
Overall, study acceptability and adherence were quite good. Ninety-four percent of eligible women agreed to participate in the study. However, one past-depressed participant was excluded from analysis because her E2 levels at all time points were greater than or equal to two standard deviations above the mean. All other E2 concentrations were within the expected perimenopausal range, however. Few samples were missed completely: zero waking or 30-minute postwaking samples, one 3:00 p.m. sample, and ten 3:00 a.m. samples. Only one participant missed more than one saliva sample in a single day. Of all saliva samples collected by participants, 79% were collected within 5 min of the correct time based on self-report. Saliva collection tardiness was most common for the 3:00 p.m. sample (32% were >5 min late) and least common for the waking sample (9% were >5 min late).
Preliminary analyses
Examination of distributions across person- and week-level outcomes indicated that baseline CES-D, weekly E2, weekly cortisol variables, and weekly affective variables were all normally distributed (Tabachnick & Fidell, 2000). Table 1 lists means and standard deviations for each weekly and between-person variable by group. ICCs (the proportion of variance in the weekly outcome that can be attributed to person-level clustering) for each weekly variable are also listed in Table 1. Zero-order correlations among person-level variables indicated positive associations between E2 person mean and E2 person standard deviation, r(29) = .33, p = .025, as well as between E2 mean and baseline CES-D, r(29) = .28, p = .012; however, E2 standard deviation was not significantly associated with baseline CES-D scores, r(29) = −.086, p = .650.
Additionally, we compared the aggregated means of all variables across the three depression categories (never depressed, previously depressed but remitted, and currently depressed) using Tukey corrections for multiple contrasts. Results are indicated as superscripts in Table 1. For all affective outcomes, women with current depression showed higher affective symptoms than both women with past depression and women with no history of depression. Neither levels of E2 nor cortisol variables showed any differences between diagnostic categories. Finally, depression groups did not significantly differ on age, income (response options: <$15,000, $15,000–$19,999, $20,000–$24,999, $25,000–$29,999, $30,000–$34,999, $35,000–$39,999, $40,000–$49,999, $50,000–$79,999, $80,000–$99,999, $100,000–$119,999, $120,000–$139,999, $140,000–$159,999, $160,000–$179,999, $180,000–$199,999, or $200,000 or above), race (response options: White or Caucasian, Black or African American, Native Hawaiian or Pacific Islander, Native American, Alaska Native, Black of Caribbean, Cuban, European or Other Descent, Asian, or Other), education (response options: 0–4 grades, 5–8 grades, some high school, graduate from high school, trade school or business college, some college, graduated from 4-year college, postgraduate work at a university), BMI, standard deviation of E2, or the proportion of observations at which E2 was going up (direction of change = 1) or down (direction of change = 0). However, contrasts revealed nonsignificant trends toward higher BMI and a greater percentage of racial minorities in the currently depressed group compared with the other two groups (ps < .06). Therefore, these variables were originally used as covariates in subsequent analyses; however, their inclusion did not substantively alter results, and they were therefore removed from analyses for simplicity.
Does the degree of change in estradiol from the previous week predict affective symptoms and HPA axis functioning?
Results of models examining the associations of between-person E2 levels and within-person E2 changes with weekly affective and cortisol variables in the full sample are presented in Table 2. Across most affective outcomes, including all CES-D subscales, felt rejection, anger, and anxiety, degree of absolute change in E2 interacted with direction of E2 change to predict affective symptoms such that greater increases in E2 in the past week were associated with increased symptoms in the index week. Identical effects were found for mean morning cortisol, waking cortisol, and cortisol at 30 min following waking but not for cortisol awakening response. Therefore, increasing E2 in the past week predicted greater affective symptoms and higher morning levels of cortisol in the subsequent index week, although not cortisol reactivity to awakening. Significant random effects of absolute change in E2 across all outcomes except cortisol awakening response (see Table 2) indicated significant individual differences in the extent to which changes in E2 were associated with symptoms and cortisol levels; that is, these effects are moderated. Effect sizes (f 2) for individual E2 predictors are also provided in Table 2; effect sizes for affective variables indicated that E2 average exerted conventionally small effects on all outcomes, within-person changes in E2 generally exerted small effects on affective outcomes, and within-person changes in E2 exerted conventionally medium-to-large effects on cortisol. Therefore, although many of the small effects described in Table 2 were statistically significant, the smallest detectible effect sizes listed for each outcome in Table 1 suggest that failure of some small effects of E2 on affective variables to reach statistical significance may be due to inadequate statistical power.
Multilevel Regression Models Predicting the Index Week’s Emotional Symptoms and Hypothalamic–Pituitary–Adrenal (HPA) Axis Functioning From Average E2 Across Weeks and Weekly Changes in E2 (Full Sample)
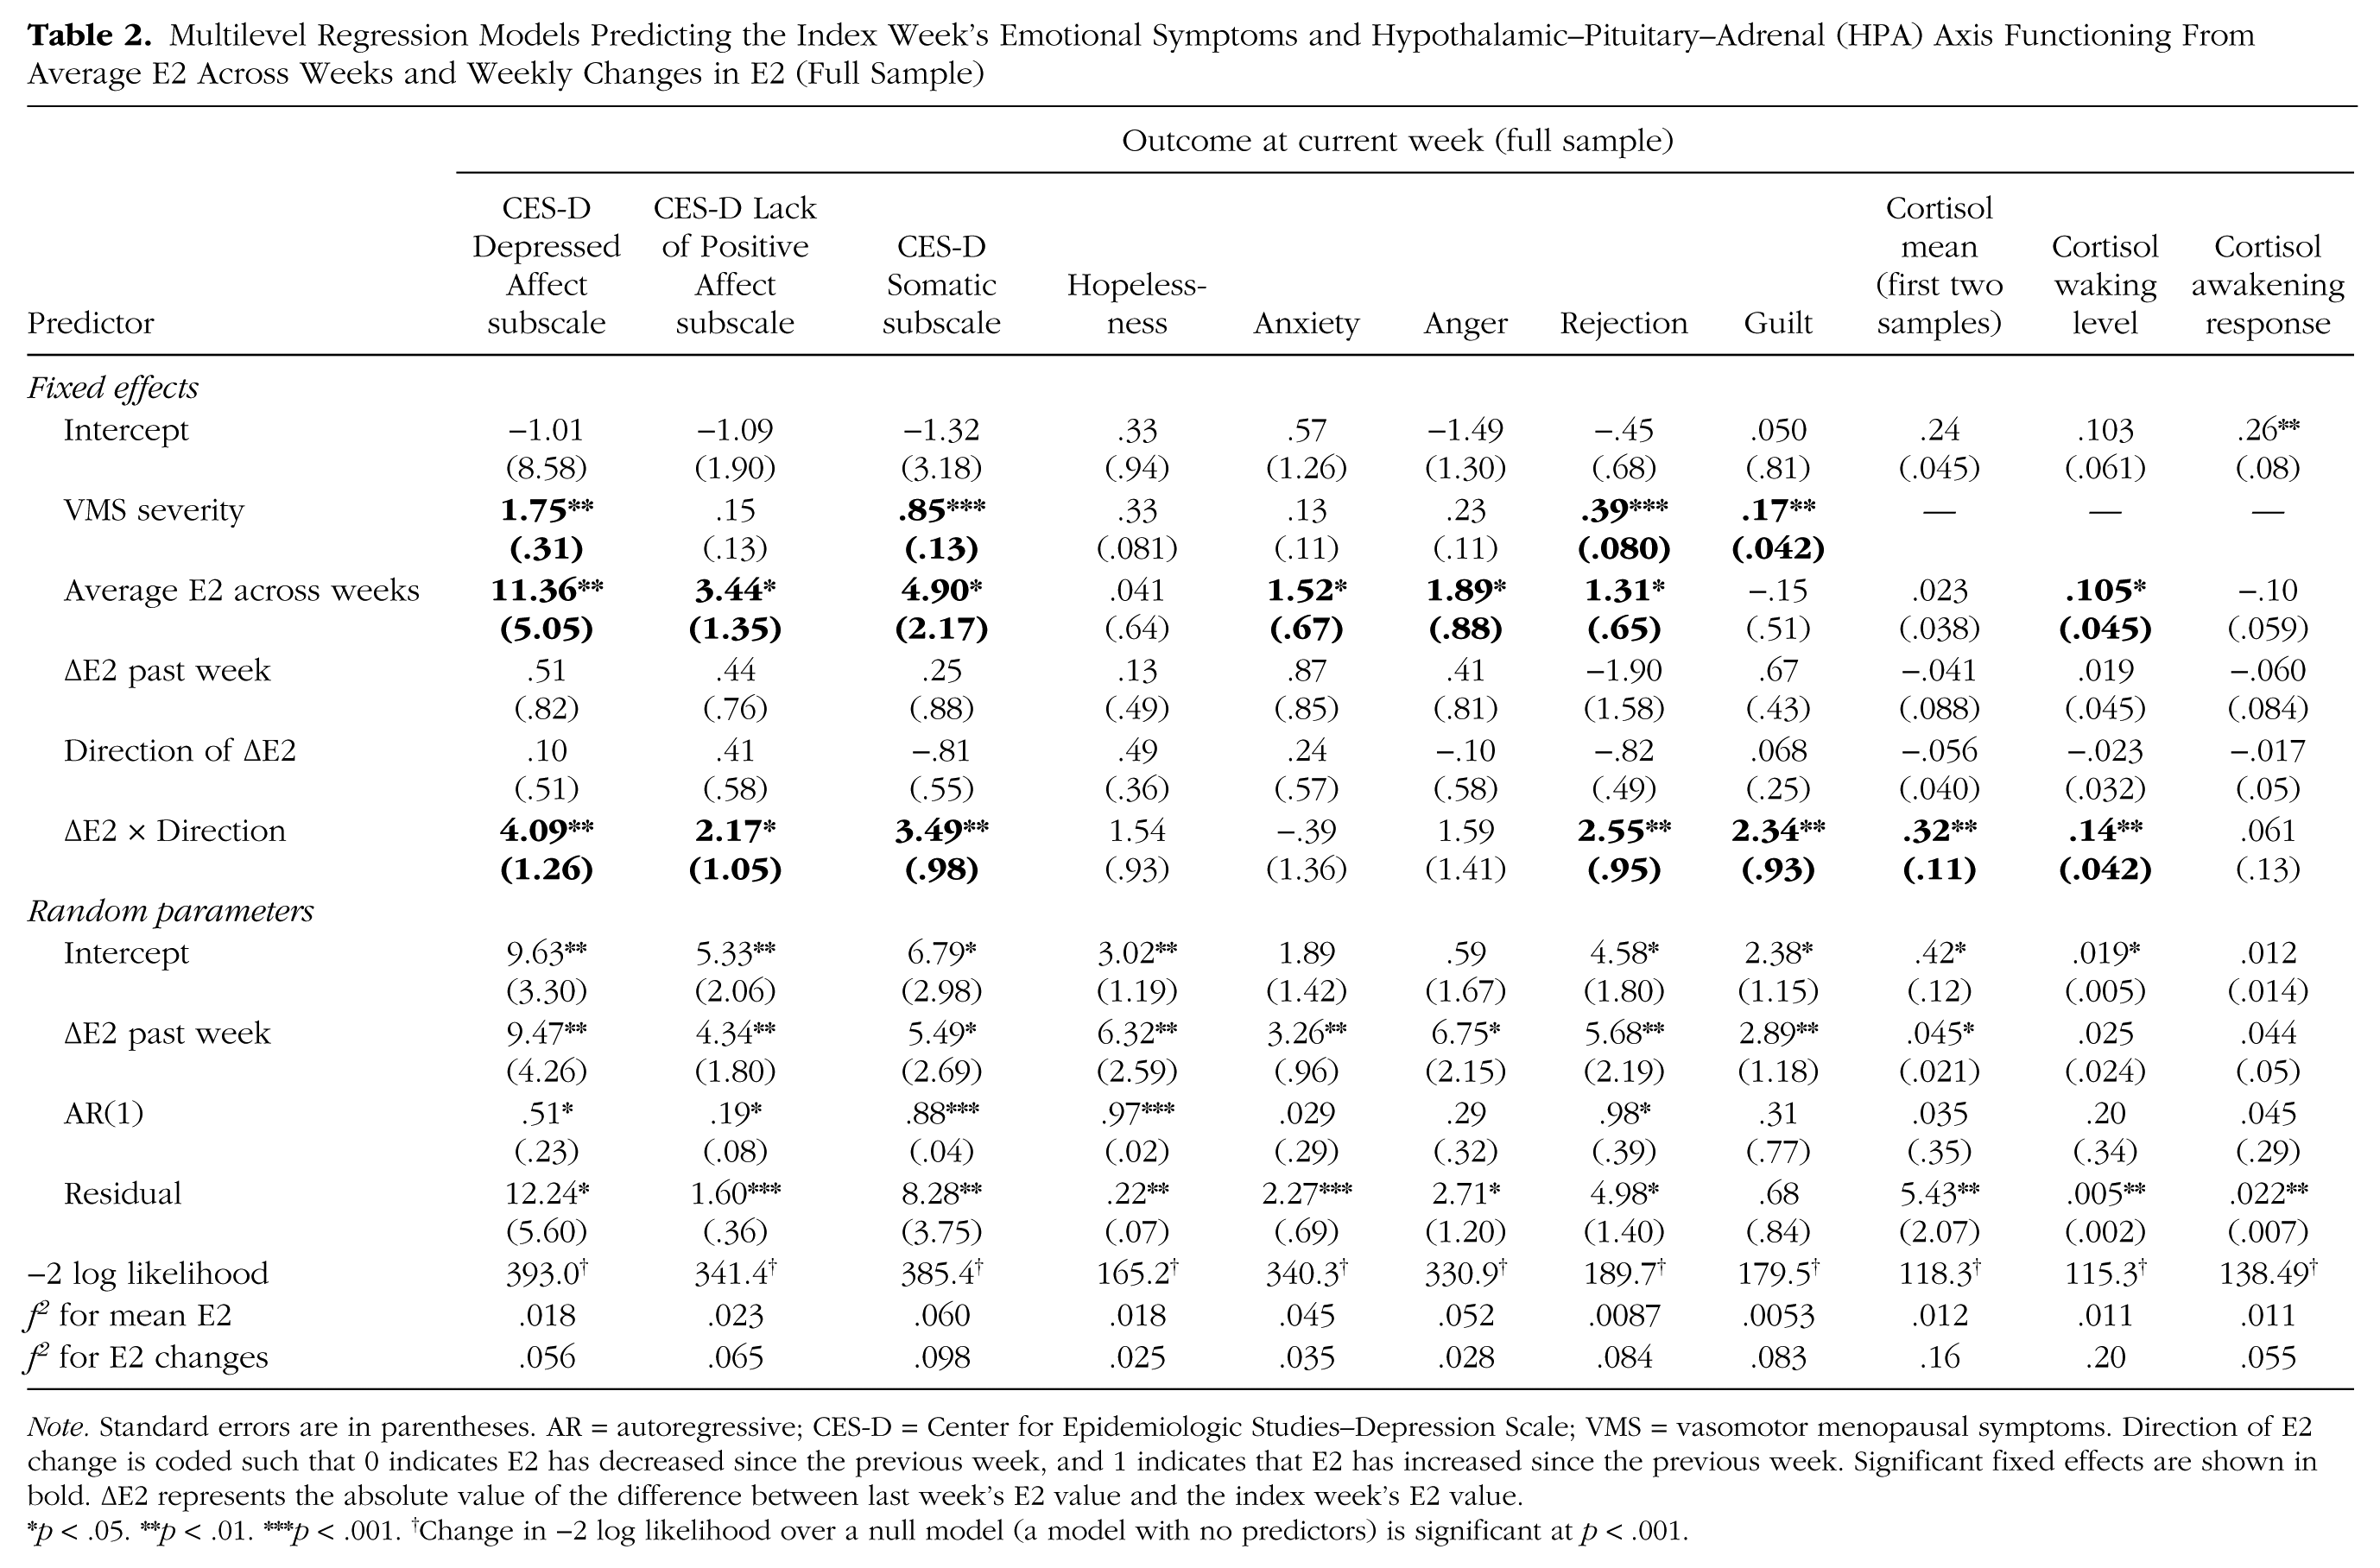
Note. Standard errors are in parentheses. AR = autoregressive; CES-D = Center for Epidemiologic Studies–Depression Scale; VMS = vasomotor menopausal symptoms. Direction of E2 change is coded such that 0 indicates E2 has decreased since the previous week, and 1 indicates that E2 has increased since the previous week. Significant fixed effects are shown in bold. ΔE2 represents the absolute value of the difference between last week’s E2 value and the index week’s E2 value.
p < .05. **p < .01. ***p < .001. †Change in −2 log likelihood over a null model (a model with no predictors) is significant at p < .001.
In order to verify that the effects of absolute E2 change were significant only in weeks when E2 was increasing, we examined the simple effects of absolute E2 change on affective and cortisol outcomes (a) on weeks in which E2 had increased over the past week and (b) on weeks in which E2 had decreased over the past week. These separate analyses confirmed that greater past-week increases in E2 were significantly associated with increased affective symptoms and cortisol on the index week (all ps < .02), whereas greater past-week decreases in E2 were not significantly associated with affective or cortisol variables (p > .39). Inspection of influence statistics indicated that the effects of changing E2 were not driven by a small number of influential cases (i.e., not driven by multivariate outliers). Notably, there were no statistically significant within-person associations of wake time with cortisol variables, and inclusion of within-person changes in wake time as a covariate did not alter results of models predicting cortisol variables.
Is past or present depression associated with increased affective and endocrine sensitivity to changes in estradiol during the perimenopause?
Next, exploratory moderation analyses examined whether the influence of changing E2 on affective and cortisol variables differed by depression history (never experienced depression, past depression, and current depression). In these models, we examined the interaction of depression category with all E2 predictors described in the first set of models (in Table 1), including person mean E2, absolute change in E2 since the past week, direction of E2 change in the past week, and the interaction of absolute change and direction of change. Results of these models indicated that, across all affective outcomes, the interactive effects of absolute change and direction of change were stronger in women with current depression than in women with past depression or no history of depression. Across cortisol outcomes, the interactive effects of absolute change and direction of change were stronger in women with either current depression or a history of depression than among women with no history of depression. Effects of E2 mean did not differ significantly across diagnostic categories. Inspection of influence statistics again ruled out the possibility that these findings were due to multivariate outliers. Effect sizes (f2) for the influence of E2 mean on all outcomes were small; effect sizes for the influence of E2 changes on affective variables were conventionally medium-to-large, and effect sizes for E2 changes on cortisol variables were conventionally large. These interactive effects of category, absolute E2 change, and direction of change on affect and cortisol were each corroborated by significant three-way interactions between baseline CES-D score, absolute change in E2, and direction of E2 change.
To probe these interactive effects, we examined the simple effects of E2 predictors separately among women in each diagnostic category. For affective variables, analyses revealed significant interactive effects of absolute E2 change and direction of change only among women with current depression. For cortisol variables, analyses revealed significant interactive effects of absolute E2 change and direction of change among women with current depression and among women with past depression. Probes of the interaction between absolute change and direction of change again revealed that the simple slope of absolute change on outcomes was significant only on weeks when E2 had increased from the previous week. Results of models predicting affective and cortisol variables from E2 means and change in women with current depression are presented in Table 3. Figure 1 depicts the effects of E2 change on affective symptoms in women with current depression and the effects of E2 change on morning cortisol in women with current and past depression.
Multilevel Regression Models Predicting the Index Week’s Emotional Symptoms and HPA Axis Functioning From Average E2 Across Weeks and Weekly Changes in E2 (Depressed Subsample)
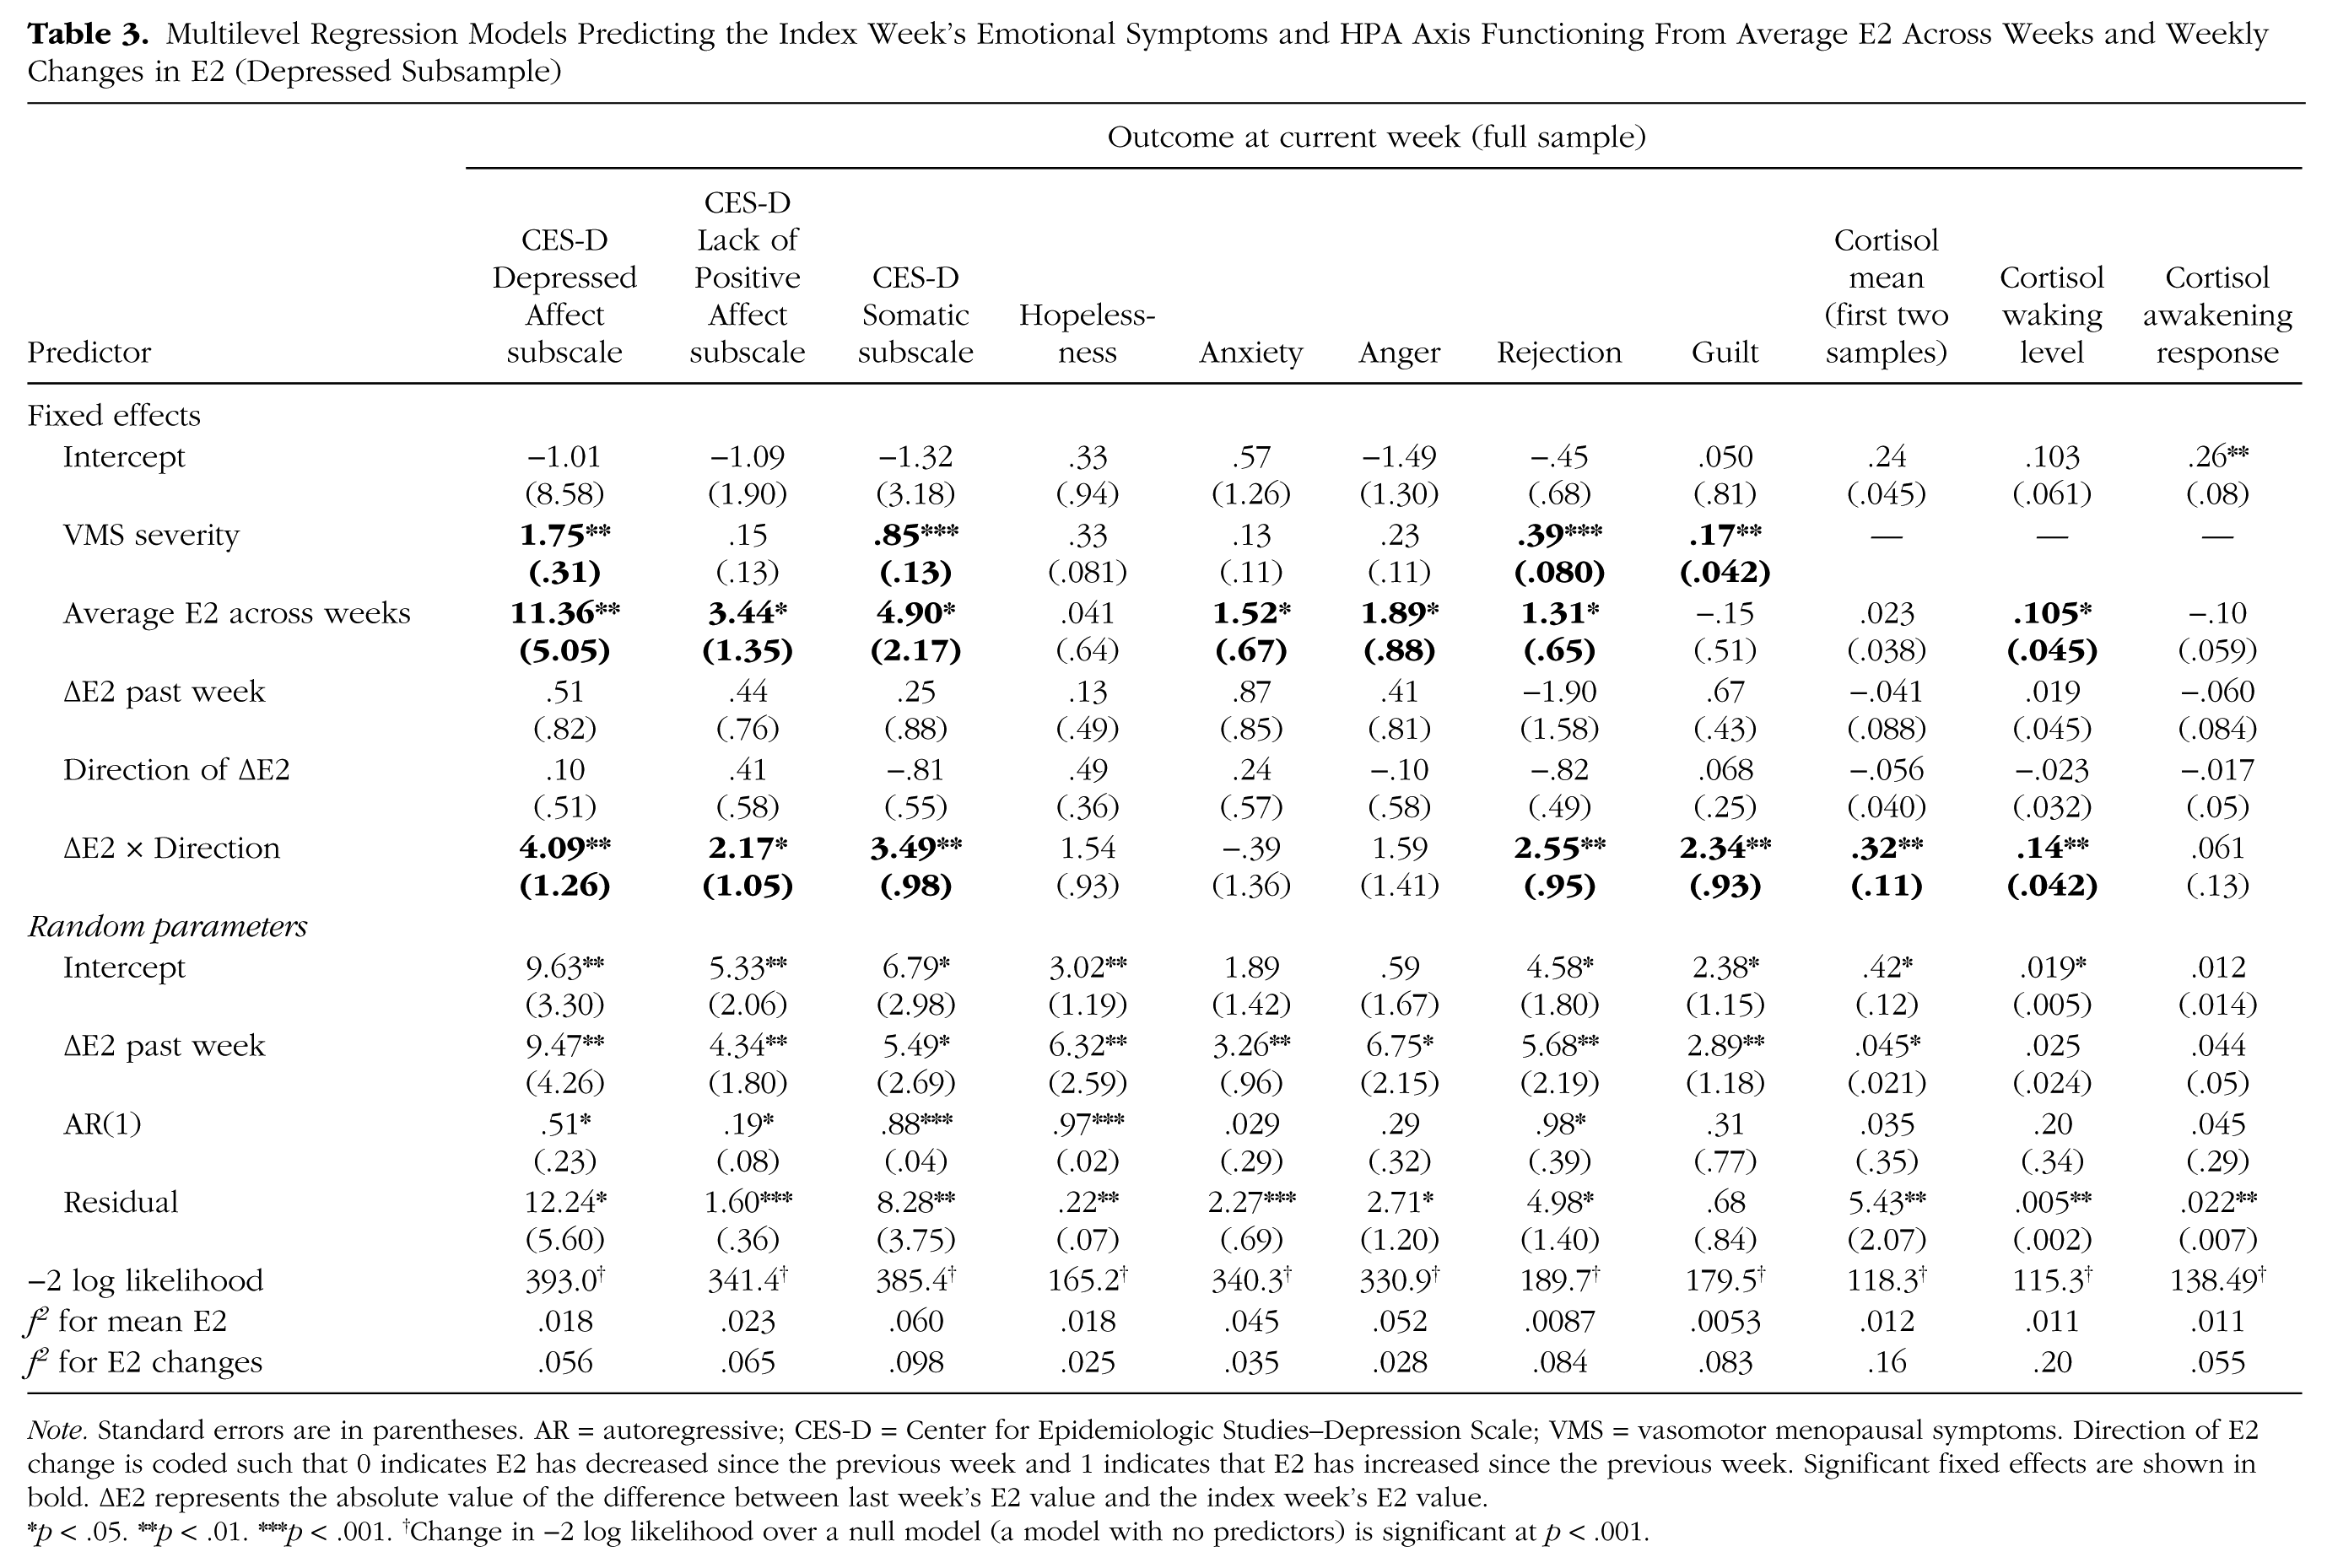
Note. Standard errors are in parentheses. AR = autoregressive; CES-D = Center for Epidemiologic Studies–Depression Scale; VMS = vasomotor menopausal symptoms. Direction of E2 change is coded such that 0 indicates E2 has decreased since the previous week and 1 indicates that E2 has increased since the previous week. Significant fixed effects are shown in bold. ΔE2 represents the absolute value of the difference between last week’s E2 value and the index week’s E2 value.
p < .05. **p < .01. ***p < .001. †Change in −2 log likelihood over a null model (a model with no predictors) is significant at p < .001.
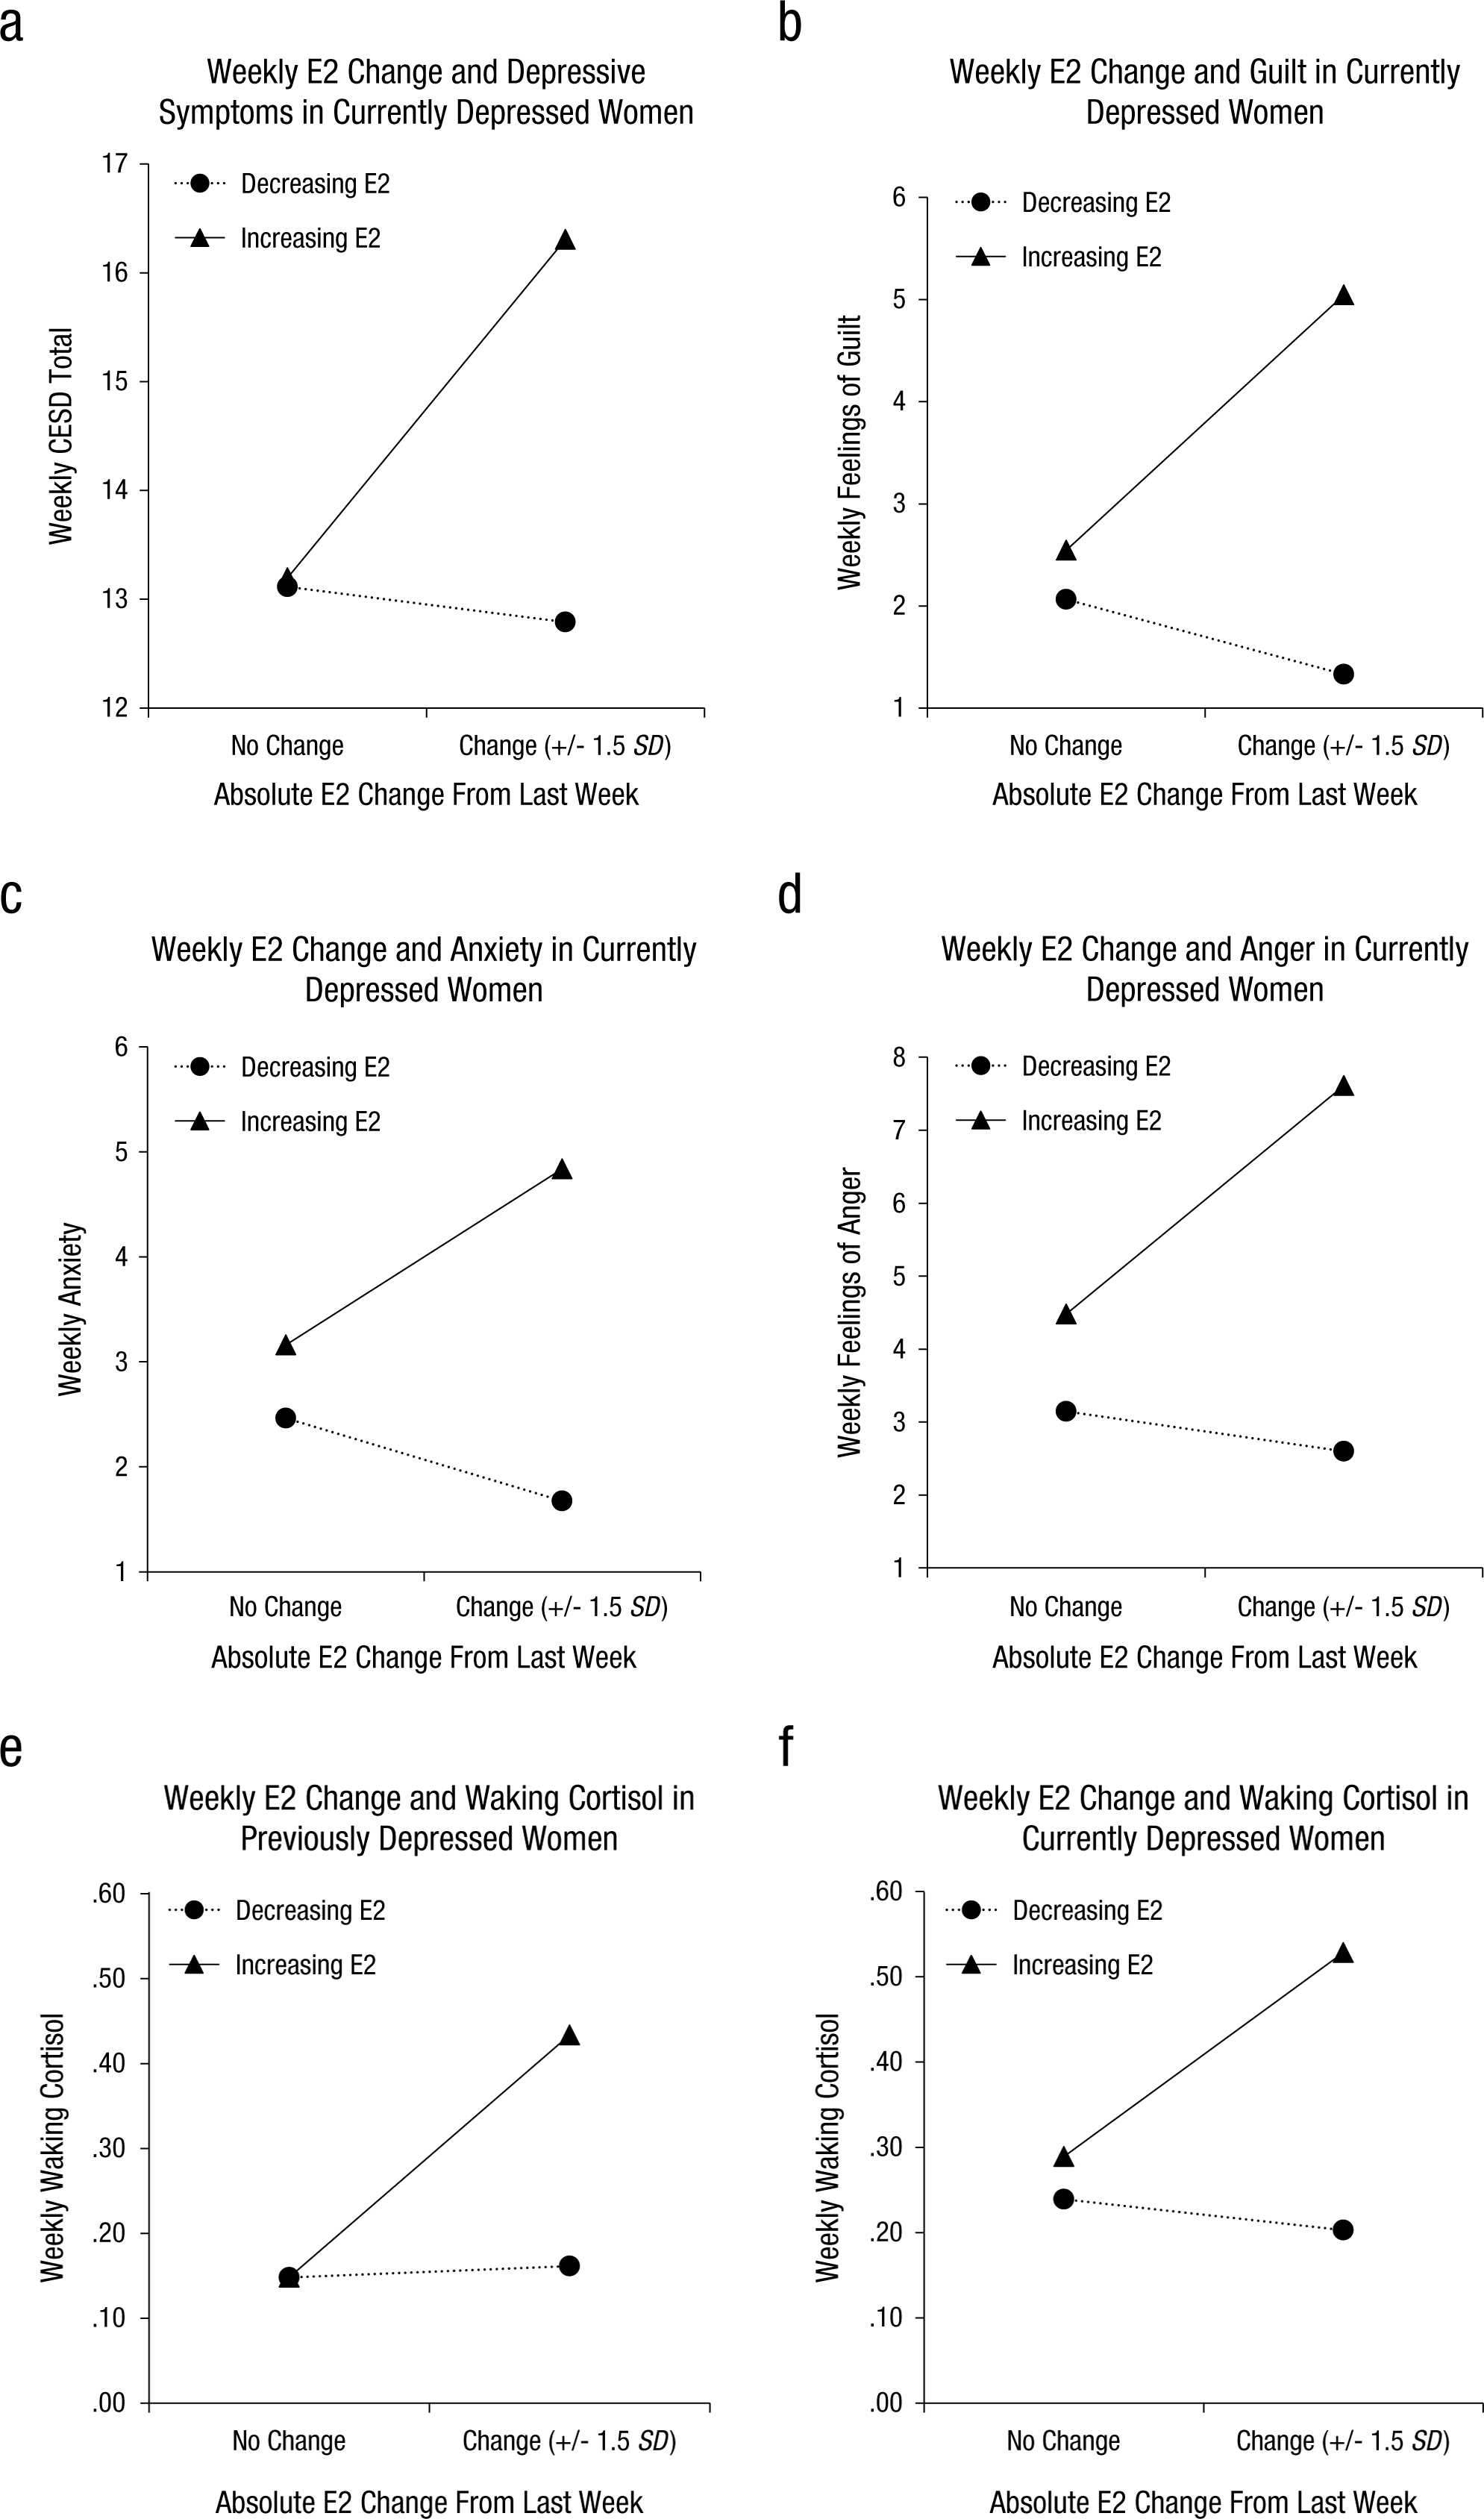
Associations (a–f) of weekly E2 changes with affective symptoms in currently depressed women and indices of HPA axis functioning in women with previous and current depression.
Discussion
The menopause transition or perimenopause—the 5 or so years leading up to the cessation of menstruation—is associated with an increased risk of clinically elevated depressive symptoms and full-blown major depressive disorder (e.g., Bromberger et al., 2007). Although the reasons for this spike in depression risk are unknown, the current study provides preliminary support for a model of perimenopausal depression in which excessive E2 fluctuation, which accompanies the menopause transition, may trigger alterations in the HPA axis—a system that plays a key role in regulating one’s response to stress—in a subset of women such that they become more stress-reactive (Gordon et al., 2015). The results therefore suggest that perimenopausal depression may be unique in its etiology and may therefore benefit from unique interventions, such as the use of hormone therapy to stabilize E2 levels. By implicating the HPA axis, the current study also supports the investigation of nonpharmacological stress management interventions to treat and/or prevent perimenopausal depression.
More specifically, the current study examined week-to-week E2 change in relation to weekly self-reported mood and morning cortisol levels. Furthermore, exploratory analyses examined whether the effect of E2 change would differ among currently depressed, past-depressed, and never-depressed perimenopausal women. It was found that in the full participant sample, the degree to which E2 increased from one week to the next (the index week) was positively associated with depressive symptoms, negative mood, and morning cortisol levels in the index week. However, the effect of increasing E2 on mood was only significant among the currently depressed women, where increasing E2 from one week to the next was associated with a wide variety of emotional symptoms in the index week. Although it is possible that the nonsignificant relationship between E2 and mood in the nondepressed groups resulted from a restricted range of scores on the mood measures, these preliminary findings may also suggest that acute increases in E2, which are commonly observed during the menopause transition, exacerbate negative mood states in a subset of women. This is consistent with observations made by Freeman et al. (2004) during an early analysis of the Penn Ovarian Aging Study, who noted that among women approaching the menopause transition, those who experienced an overall increase in E2, not a decrease, over the course of the 4-year study period were more likely to report significant depression.
In addition to the effect of E2 change on mood, an effect of greater E2 increases on cortisol in the index week was also observed among both currently and past-depressed women. Although these findings must be replicated, they provide preliminary support for the HPA axis’ involvement in the development of perimenopausal depression. More specifically, consistent with our proposed model of perimenopausal depression development (Gordon et al., 2015), the results may suggest that large acute increases in E2 enhance HPA axis activation in some women, placing them at greater risk for perimenopausal depression. Such a process would be consistent with our understanding of the HPA axis as being critical in emotion processing and the stress response and is consistent with studies finding that elevated morning cortisol predicts the subsequent onset of major depressive disorder in initially euthymic women (Harris et al., 2000).
The current findings are particularly interesting in light of a recent study comparing activation of the hypothalamus, hippocampus, and amygdala—three brain areas that play a key role in regulating the HPA axis—among 15 women with recurrent major depressive disorder and 15 healthy controls during the follicular “low-E2” versus the midluteal “high-E2” phases of the menstrual cycle (Jacobs et al., 2015). During each of the two phases, women underwent an functional MRI (fMRI) scan while undergoing a mild visual stress challenge. It was found that although the high-E2 phase of the menstrual cycle was associated with attenuated stress circuitry activity in response to the challenge among the healthy women, the women with recurrent depression did not exhibit this stress-dampening effect of E2. These findings, along with postmortem studies observing relatively lower E2 receptor expression in brain areas relevant for stress processing among women with major depressive disorder at the time of their death (Perlman et al., 2005), suggest that the expression and distribution of E2 receptors in brain areas that regulate the HPA axis may be altered in women with current or past depression. Whether this altered receptor expression precedes and contributes to depression development or is the result of living with a depressive disorder is unknown; however, findings from animal models suggest that exposure to chronic stress can lead to a down-regulation of E2 receptors in brain areas regulating the HPA axis (Gerrits et al., 2005). Thus, it is possible that alterations in E2 receptor expression, triggered by chronic stress, precede and contribute to the onset of depression.
Importantly, in the current study, the effects of E2 change on mood and cortisol were independent of mean E2 levels, a finding that is consistent with previous research (Freeman et al., 2006; Gordon et al., 2016; Schmidt et al., 2015). The importance of E2 change is also consistent with the observation that the risk of depression increases during the menopause transition and early postmenopause (see Gordon et al., 2015, for review) but is no longer elevated in the later postmenopausal years, which are characterized by very low but stable E2 levels. Of note, it is possible that the menstrual cycle effects on stress neurocircuitry observed in the study by Jacobs et al. (2015), described earlier, are due to greater E2 change in the luteal “high-E2” phase compared to the follicular “low-E2” phase.
Although increasing E2 predicted greater morning HPA axis activation in both women with current and past depression, the effect of increasing E2 on affective symptoms was only significant among the currently depressed women. What might differentiate the subset of women who exhibited increased cortisol and mood symptoms following increases in E2 from those women who exhibit elevated cortisol but no mood changes in relation to E2 increases? We propose that greater life stress may provide that context of vulnerability. Indeed, consistent with other research that has shown that negative life events proximate to the menopause transition are a significant predictor of the onset of perimenopausal depression (Bromberger et al., 2007; Bromberger et al., 2011), in the current study, 80% of currently depressed women reported experiencing at least one very stressful life event (e.g., divorce, death of a close family member or close friend) in the 6 months preceding the study according to the Life Experiences Survey (Sarason & Johnson, 1976; Sarason, Johnson, & Siegel, 1978), whereas only 30% of the past-depressed participants did, a difference found to be statistically significant using chi-squared analyses. One possible explanation is that frequent and persistent increases in E2 during the menopause transition enhance HPA axis activation, which subsequently increases emotional and physiologic sensitivity to stressful life events and sets the stage for the development of depressive illness (Bradley et al., 2008; Heim & Nemeroff, 1999; Nemeroff, 1996). This is consistent with our prior finding that E2 fluctuation in the menopause transition predicted negative emotional responses to a psychosocial laboratory stressor, but it only predicted the onset of clinically significant depressive symptoms among women who had recently experienced a very stressful life event (Gordon et al., 2016). Although the current study was not statistically powered or designed to test a mediating role of cortisol in the expression of affective symptoms in women with perimenopausal depression, these results provide preliminary evidence consistent with our previously proposed model of perimenopausal depression development (Gordon et al., 2015) and suggest that the role of HPA axis regulation in perimenopausal depression is worthy of further study.
The results of the current study add to a body of literature suggesting that perimenopausal depression may differ somewhat from depression unrelated to reproductive events in its etiology and thus deserves continued investigation. As mentioned earlier, if confirmed in follow-up studies, our findings may have important clinical implications for the treatment and/or prevention of perimenopausal depression. By implicating E2 fluctuation in perimenopausal depression development, the current study lends support for the use of transdermal E2 (i.e., an estrogen patch), which helps to stabilize E2 levels, as a treatment for perimenopausal depression. To date, a few small randomized control trials have found that transdermal E2 is more effective than placebo at decreasing depressive symptoms and treating major depressive disorder in perimenopausal women (de Novaes Soares, Almeida, Joffe, & Cohen, 2001; Joffe et al., 2011; Schmidt et al., 2000); the results of the current study provide indirect evidence that transdermal E2’s benefits are due to its ability to reduce E2 fluctuation. If excessive sensitivity to stress, via HPA axis alterations, is confirmed to be a mechanism underlying the effect of E2 fluctuation on mood, this may also suggest a role for psychological interventions in the treatment and/or prevention of perimenopausal depression. Specifically, interventions aimed at increasing resilience in the face of life stress, such as mindfulness-based stress reduction, may be a promising prophylactic intervention in perimenopausal women. Further research of the underlying biological mechanisms linking E2 fluctuation, HPA axis activation, and perimenopausal mood may also uncover other targets for pharmacological interventions (e.g., at the level of the E2 receptor and/or HPA axis).
Of course, dysregulation of the HPA axis is unlikely to be the only mechanism underlying E2’s effect on mood in the menopause transition. Other mechanisms underlying the effects of E2 on mood currently under investigation, such as withdrawal from the anti-inflammatory (Vegeto, Benedusi, & Maggi, 2008) and neuroprotective (Bredemann & McMahon, 2014) effects of E2 and its modulation of the memory of emotionally relevant information (Barha, Dalton, & Galea, 2010; Milad et al., 2010), are also worthy of further study. Another possibility that has been suggested by Lasley and colleagues relates to individual differences in the bioavailability of androstanediol, a metabolite of testosterone whose levels increase 100-fold in the menopause transition (McConnell, Stanczyk, Sowers, Randolph, & Lasley, 2012). Androstanediol is released by the adrenal glands and can act like estrogen throughout the body (Lasley, Crawford, & McConnell, 2011). Similarly, individual differences in the presence of estrone, a biologically less potent estrogen, may contribute to individual differences in sensitivity to E2 flux. Finally, individual differences in levels of sex-hormone–binding globulin, and therefore levels of bioavailable E2, may also play a role in determining the hormonal environment to which a woman is exposed during the menopause transition. It is also possible that the importance of each of these mechanisms may differ across women; in other words, different women may be sensitive to E2 fluctuation for different reasons. A single, unifying etiological explanation for all cases of perimenopausal depression development may therefore neither be necessary nor currently possible. In this case, parallel lines of research investigating different candidate mechanisms involved in perimenopausal depression need not be considered redundant or mutually exclusive; “E2 sensitivity” may manifest itself differently, both neurobiologically and clinically, across different women.
Further research focused on the etiology of perimenopausal depression may also aid in its early detection and prevention. For example, the current study suggests that women with a history of depression may be particularly sensitive to perimenopausal changes in E2. This knowledge may encourage women with a history of depression to pay close attention to their mood as they enter the menopause transition and to seek help early if they start to notice the appearance of depressive symptoms. The knowledge that many other women experience depressive symptoms during the menopause transition and that perimenopausal depression has a biological basis may also help validate women’s experiences. At the same time, to avoid overpathologizing a natural life stage, it is important for women to know that although the hormonal changes associated with the menopause transition may contribute to the development of depressive symptoms in some women, this is not the case for most.
One aim of the current study was to determine the feasibility of using participant-collected weekly saliva samples to measure perimenopausal fluctuations in E2. Favorable recruitment and adherence rates suggest that the methodology used in the current study may, in fact, be a practical option for studying the psychological correlates of perimenopausal hormonal change. Although saliva has not been shown to be a viable medium for measuring very low E2 levels, such as those seen among older postmenopausal women (Tivis, Richardson, Peddi, & Arjmandi, 2005) and men (Shirtcliff et al., 2000), salivary E2 has otherwise been shown to correlate well with serum levels (Choe, Khan-Dawood, & Dawood, 1983; Ellison & Lipson, 1999; Shirtcliff et al., 2000). Salivary E2 also provides the unique advantage of reflecting levels of E2 that is unbound to sex-hormone–binding globulin and therefore free to exert biological effects; blood levels of E2, on the other hand, reflect total levels of E2—both bound and unbound.
The current study’s results should be considered in light of several limitations, including its small sample size. A larger sample size would allow for the investigation of other factors that may moderate the relationship between changes in E2, mood, and HPA axis activation, such as a past history of reproductive mood disorders and exposure to recent stressful life events, which are both risk factors for perimenopausal depression (see Gordon et al., 2015, for review) and may increase women’s sensitivity to the mood effects of E2 change (Bloch et al., 2000; Gordon et al., 2016). Assessing changes in E2, mood, and cortisol over a greater number of weeks would have also increased our statistical power in detecting within-person effects of E2 change. Future studies examining the mood effects of E2 would also benefit from the use of a well-validated and comprehensive affect scale. Finally, although adjusting for race did not significantly alter the current findings, the three depression groups examined in the current study did differ somewhat in their racial composition, with fewer Caucasians in the past- and currently depressed groups.
Future work in this area would benefit from the use of a pharmacological fMRI approach to characterizing the neurobiological mediators of experimentally induced E2 change on cortisol and mood in perimenopausal women. The use of such methods would allow us to pinpoint the neurobiological mechanisms by which experimentally induced acute changes in E2 might increase HPA axis activation and affective symptoms and identify potential targets for intervention. Furthermore, the ideal study would have a participant sample that is large and heterogeneous enough to allow for the examination of potential moderating variables, including exposure to early and recent life stressors or a history of depression, to explore the possibility that sensitivity to acute changes in E2 may be prospectively predicted by psychosocial or physiological risk factors.
Despite the limitations of the present study, several strengths make it a valuable contribution to the current literature. In addition to demonstrating the feasibility and validity of frequent salivary E2 to predict mood changes in perimenopausal women, the weekly assessment of E2 and mood is much more frequent than that of other studies examining the relationship between natural perimenopausal E2 fluctuation and mood. Additionally, it is the first study of E2 fluctuation and mood to include currently depressed perimenopausal women. Finally, it is the first to examine HPA axis activation in relation to natural perimenopausal E2 changes. In sum, the present study provides evidence that HPA axis dysregulation, triggered by large acute changes in E2, is worthy of further study as a candidate mechanism involved in the pathophysiology of perimenopausal depression.
Footnotes
Declaration of Conflicting Interests
D. R. Rubinow serves on the editorial board of Servier Laboratories, is a consultant for Sage Therapeutics Inc., and has received grant funding from the Foundation of Hope. The remaining authors declared that they had no conflicts of interest with respect to their authorship or the publication of this article.
Funding
This research was supported by the National Center for Advancing Translational Sciences (NCATS), National Institutes of Health (NIH), through Grant Award Number UL1TR001111 and NIH Grants RO1-MH087619 and T32 MH093315. J. L. Gordon is also the recipient of a Postdoctoral Fellowship of the Fonds de la Recherche du Québec–Santé (FRQS). Both D. R. Rubinow and S. Girdler have also received grant funding from the NIH.