
Abstract
Social cognition has become a major focus in psychosis research aimed at explaining heterogeneity in functional outcome and developing interventions oriented to functional recovery. However, there is still no consensus on the structure of social cognition in psychosis, and research in this area has been plagued by lack of replication. Our first goal was to replicate the factor structure of social cognition using nearly identical tasks in independent samples. Our second goal was to externally validate the factors as they relate to nonsocial cognition and various symptoms in the prediction of functioning using machine learning. Confirmatory factor analyses validated a three-factor model for social cognition in psychosis (low-level, high-level, attributional bias factor). A least absolute shrinkage and selection operator regression and cross-validation provided evidence for external validity of data-driven linear models including the social-cognitive factors, nonsocial cognition, and symptoms. We addressed the replicability problems that have impeded research in this area, and our results will guide future psychosis studies.
Social cognition, the mental operations needed to perceive, interpret, and process information for adaptive social interactions, has become a major focus in psychosis research aimed at explaining heterogeneity in functional outcome (Fett et al., 2011) and developing new interventions oriented to functional recovery (Horan et al., 2018). A fundamental issue for all types of social cognition research concerns the underlying factor structure of this construct in psychosis. Indeed, identifying the structure of social cognition was identified as an important goal nearly 10 years ago in an early consensus meeting on future directions for social cognition research in psychosis (Green et al., 2008). Despite the considerable attention that this issue has garnered, there is still no consensus on the basic structure of social cognition in psychosis (Etchepare & Prouteau, 2018), and research in this area has been plagued by a lack of replication in terms of both the number of factors and their functional correlates. The current study was designed to rigorously address methodological and data-analytic limitations of existing studies in an effort to confirm in a new, fully independent sample the structure and external correlates of social cognition that we previously identified (Mancuso, Horan, Kern, & Green, 2011).
Studies of the structure of social cognition in psychosis have produced highly inconsistent findings. Exploratory factor analyses have ranged from two (Buck, Healey, Gagen, Roberts, & Penn, 2016; Ziv, Leiser, & Levine, 2011) to three (Corbera, Wexler, Ikezawa, & Bell, 2013; Mancuso et al., 2011; Mehta et al., 2014) to four factors (Bell, Tsang, Greig, & Bryson, 2009; Stouten, Veling, Laan, van der Helm, & van der Gaag, 2017). Likewise, three confirmatory factor analyses examined models ranging from one to four factors and reported support for either one-factor (Browne et al., 2016), two-factor (Oliver et al., 2019), or four-factor models (Bell et al., 2009). This lack of replicability across studies likely reflects methodological factors such as the use of different social cognitive tasks, the frequent use of a small number of tasks focused on a relatively narrow range of social cognitive processes, and variability in clinical sample characteristics. One relatively consistent finding across studies that assessed the social cognitive domain of attributional style is that attributional bias constitutes a separable factor from other tasks assessing various low-level (e.g., facial affect perception, social cue perception) and high-level (mentalizing, perspective taking, empathy) social cognitive processes (Buck et al., 2016; Mancuso et al., 2011). However, there have been no consistent structural findings regarding tasks outside the domain of attributional bias. Note that no prior studies have used confirmatory factor analysis to evaluate factor structure replicability using identical tasks in independent samples that comprised similar types of patients.
In addition to inconsistencies in the structure of social cognition in psychosis, there are inconsistent findings regarding relations between social-cognitive factors and external correlates. For example, some studies have found significant associations with negative symptoms (Browne et al., 2016; Oliver et al., 2019), whereas others have not (Buck et al., 2016; Mancuso et al., 2011). Likewise, some studies have found significant associations with measures of real-world functioning (Mancuso et al., 2011), whereas others have not (Buck et al., 2016).
Past inconsistencies in external correlates may reflect three key data-analytic limitations. First, different factor structures in themselves obviously result in different external correlates of the individual factors. Second, bivariate approaches such as correlation coefficients ignore that the contribution of social cognition to functioning changes after accounting for nonsocial cognitive impairments and clinical symptoms (Green, Hellemann, Horan, Lee, & Wynn, 2012; Lin et al., 2013; Thomas et al., 2017). Two previous studies (Buck et al., 2016; Mancuso et al., 2011) used hierarchical regression to address incremental validity. However, they included either a brief IQ measure only (Buck et al., 2016) or a single measure for total negative symptoms and for nonsocial cognition only (Mancuso et al., 2011). Furthermore, hierarchical regression analyses depend heavily on the particular order in which a larger set of variables is entered, and results can change because of that decision. Third, Pearson correlations within a given data set can be strongly affected by outlying single observations or subsets of observations. If the samples underlying the analyses are heterogeneous, they are prone to overfitting and are less likely to be reproduced in other data sets. No study has addressed overfitting in this context so far.
Confirming a factor structure of social cognition would automatically also address the first data-analytic limitation. Approaches based on machine learning are very well suited to address the latter two data-analytic limitations that have likely also contributed to the lack of replicability in the external correlates of social cognition. To address the issue of incremental validity within a multiple regression framework, least absolute shrinkage and selection operator (LASSO) can be used. In LASSO regression, all possible combinations of a large number of variables can be automatically estimated to obtain the overall best performing model for predicting an outcome. In addition, LASSO generates parsimonious models (i.e., it does not retain explanatory variables that have no—or practically no—independent predictive value). Furthermore, to address the problem of overfitting, LASSO regression is easily combined with cross-validation to test for the consistency of a relationship across subsets (i.e., “folds”) of participants, essentially mimicking independent replication within a given sample.
In this study, our approach to replication (i.e., of the structure of social cognition in psychosis) was to use an independent experiment that attempted to address the same scientific question as a previous experiment, produced consistent results, and thus confirmed earlier conclusions (Leeka & Peng, 2015; Peng, 2011). Because the current experiment used complementary yet conceptually distinct analytical methods compared with our previous experiment (e.g., data-driven vs. theory-driven; Mancuso et al., 2011), replication did not aim to produce identical statistical results. We had two goals for this replication study.
First, we sought to replicate the three-factor structure (i.e., low-level, high-level, attributional bias factors) of social cognition that we previously found using exploratory factor analysis (EFA; Mancuso et al., 2011) in an independent data set. We used confirmatory factor analysis (CFA), the standard for replication of data-driven EFA results (Flora & Flake, 2017; Osborne & Fitzpatrick, 2012), on a new participant sample with nearly identical assessments. We expected a good model fit for a three-factor solution and superiority of the three-factor model over nested two- and one-factor models. Second, we sought to externally validate the factors as they relate to nonsocial cognition and a broad range of symptoms in the prediction of functional capacity and real-world functioning. We used LASSO regression and cross-validation in addition to bivariate Pearson correlations to specifically identify robust external correlates of the factors that are more likely to be replicable going forward. For external validation, we expected the data-driven regression models to be consistent with past results from theory-driven hierarchical regression and structural equation modeling (Green et al., 2012; Lin et al., 2013; Mancuso et al., 2011; Thomas et al., 2017). Specifically, we expected an additive value of the low-level and high-level social-cognitive factors above and beyond nonsocial cognition and symptoms in models that predict functional capacity but no additive value of these factors above and beyond experiential negative symptoms in models that predict real-world functioning.
Method
Participants
A total of 146 participants was recruited from outpatient clinics at the VA Greater Los Angeles Healthcare System (VAGLAHS) and local community mental health facilities. All participants in this study were enrolled in a clinical trial of social cognitive training (Horan et al., 2018). In the current study, we used data from the baseline assessments. Exclusion criteria were evidence of current or past neurological disorder (e.g., epilepsy), IQ less than 70, or substance use disorder within the past month. Five participants with less than 25 out of 28 baseline assessment scores (90%; see Assessments below) were excluded from the current analyses. All of the remaining 141 participants either met criteria from the fourth edition of the Diagnostic and Statistical Manual of Mental Disorders (DSM–IV; American Psychiatric Association, 1994) for schizophrenia (n = 109), schizoaffective disorder (n = 14), or psychosis not otherwise specified (NOS; not secondary to substance use disorder; n = 18). Diagnoses were confirmed by review of medical records and consultation with treating psychiatrists, who provided approval for each patient that participated in the study. A structured diagnostic interview was not used. Participants were clinically stable (no psychiatric hospitalizations in the past 2 months, same antipsychotic medication for the past 6 weeks). Medication types and dosages were not controlled and were left to the discretion of the participants’ treating physicians. All participants had the capacity to give informed consent and provided written informed consent after all procedures were fully explained in accordance with procedures approved by the Institutional Review Board at VAGLAHS.
Assessments
Social cognitive assessment
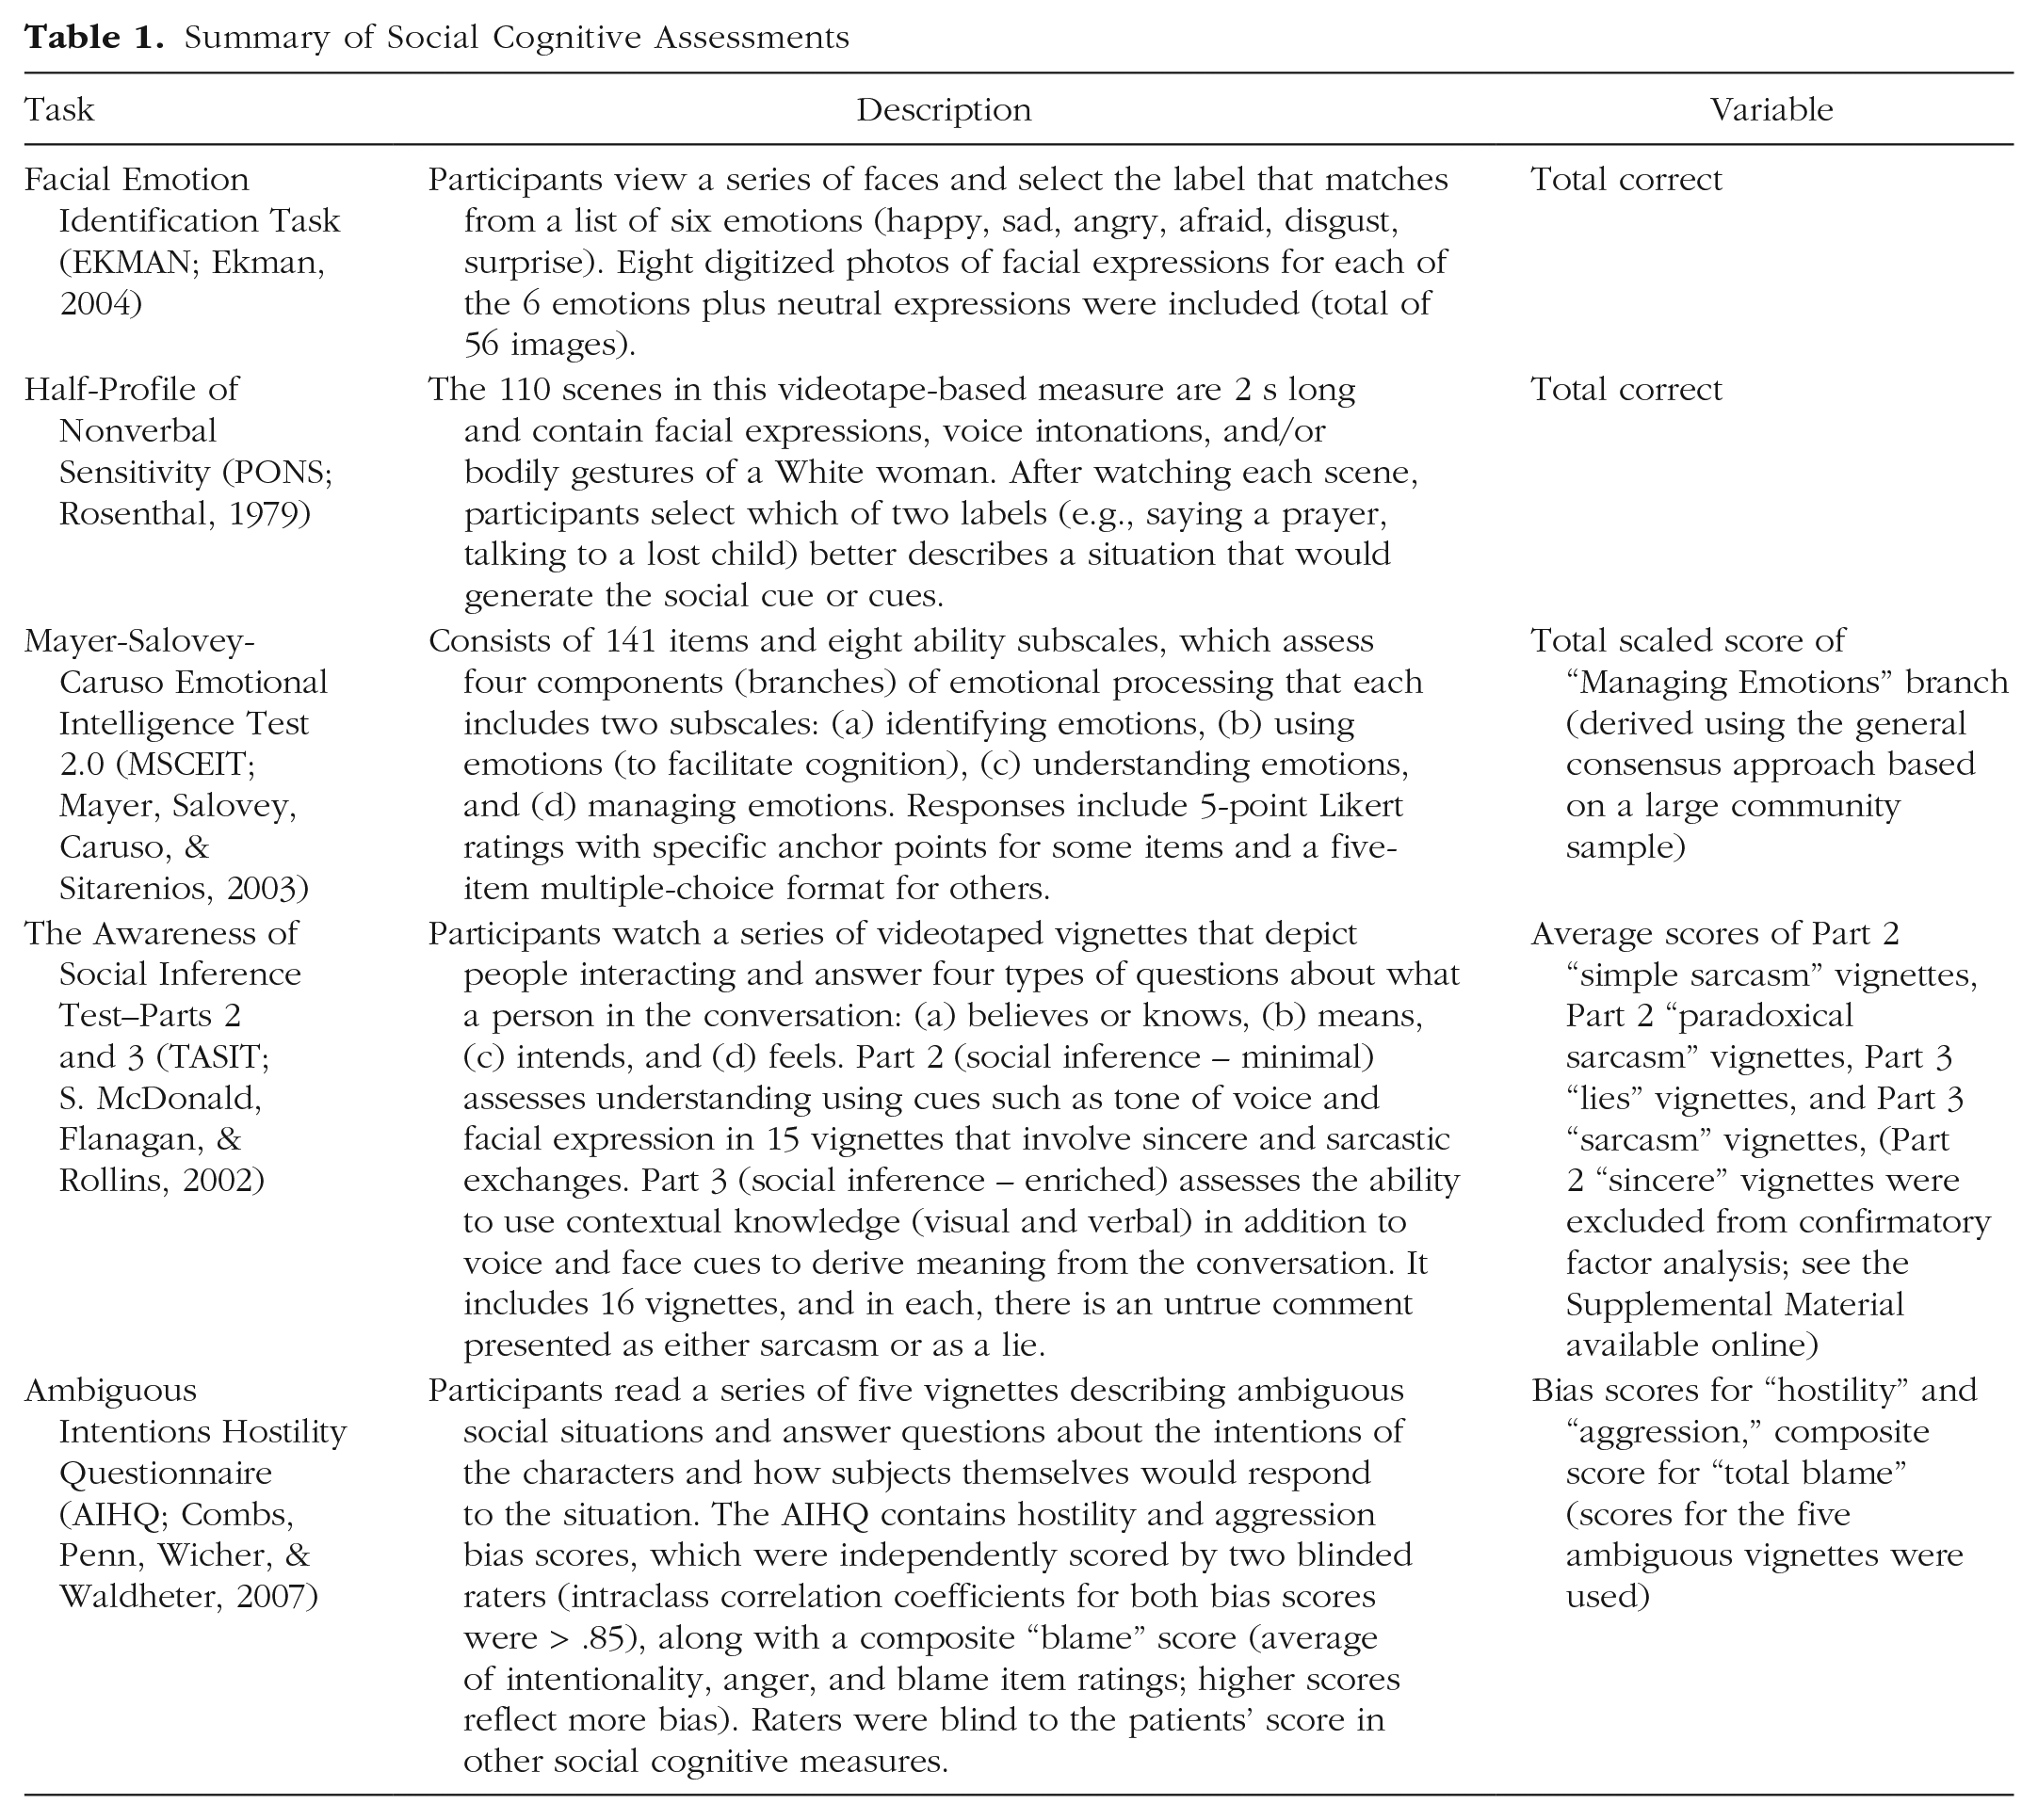
The Facial Emotion Identification Task (EKMAN; Ekman, 2004), the Half-Profile of Nonverbal Sensitivity (PONS; Rosenthal, 1979), the Mayer-Salovey-Caruso Emotional Intelligence Test–Managing Emotions (MSCEIT-ME; Mayer, Salovey, Caruso, & Sitarenios, 2003), the Awareness of Social Inference Test (TASIT; S. McDonald, Flanagan, & Rollins, 2002), and the Ambiguous Intentions Hostility Questionnaire (AIHQ; Combs, Penn, Wicher, & Waldheter, 2007) were used to assess social cognition. Details of the social cognitive test battery and respective subscales of interest for the CFA in this study are presented in Table 1.
Summary of Social Cognitive Assessments
Nonsocial cognitive assessment
The MATRICS Consensus Cognitive Battery (MCCB; Nuechterlein & Green, 2006) was used to assess nonsocial cognition. An age- and gender-corrected neurocognitive composite score (MCCB neurocognitive composite) was derived from six domains: speed of processing, attention/vigilance, working memory, verbal learning, visual learning, and reasoning and problem solving.
Symptom assessment
The Scale for the Assessment of Negative Symptoms (SANS; Andreasen, 1989) was used to assess negative symptoms. We computed subscores for experiential negative symptoms (sum of global ratings for avolition/apathy and global ratings for anhedonia/asociality; SANS Experiential) and expressive negative symptoms (sum of global ratings for affective flattening and global ratings for alogia; SANS Expressive). The positive-symptom-factor score from the 24-item version of the Brief Psychiatric Rating Scale (BPRS; Kopelowicz, Ventura, Liberman, & Mintz, 2008) was used to assess positive symptoms.
Functional outcome assessment
Functional capacity was assessed with the UCSD Performance-based Skills Assessment (UPSA; Patterson, Goldman, McKibbin, Hughs, & Jeste, 2001) and the Maryland Assessment of Social Competence (MASC; Bellack, Sayers, Mueser, & Bennett, 1994). For the UPSA, the total score was used (UPSA total). For MASC, the mean ratings of the conversation subscore, the nonverbal subscore, and the effective subscore were used (MASC total). Real-world functioning was assessed with the Role Functioning Scale (RFS; McPheeters, 1984). The average score of the four subscales was used (RFS total). For more detailed information on the measures, see Assessments under Supplemental Methods in the Supplemental Material available online.
Statistical analysis
Statistical analyses were performed in the R software environment (Version 3.4.3; R Core Team, 2017). All data used for analyses were continuous. Missing data were minimal (0.6%). Imputation of missing data was performed using the R package Amelia (Version 1.7.4; Honaker, King, & Blackwell, 2015). The expectation-maximization (EM) algorithm was run once on the full data set (instead of imputation based on bootstrapped data). After that, all raw scores and t scores were converted to z scores (normalization/scaling within sample).
Confirmatory factor analysis
The CFA model consisted of three latent factors that described variability in 10 social cognitive assessments (Fig. 1). The factors were characterized as Higher Level Inferential and Regulatory Processes (Factor 1), Lower Level Social Cue Detection (Factor 2), and Hostile Attributional Style (Factor 3). Factor analyses were conducted in two steps: assessment of model fit and model comparison.
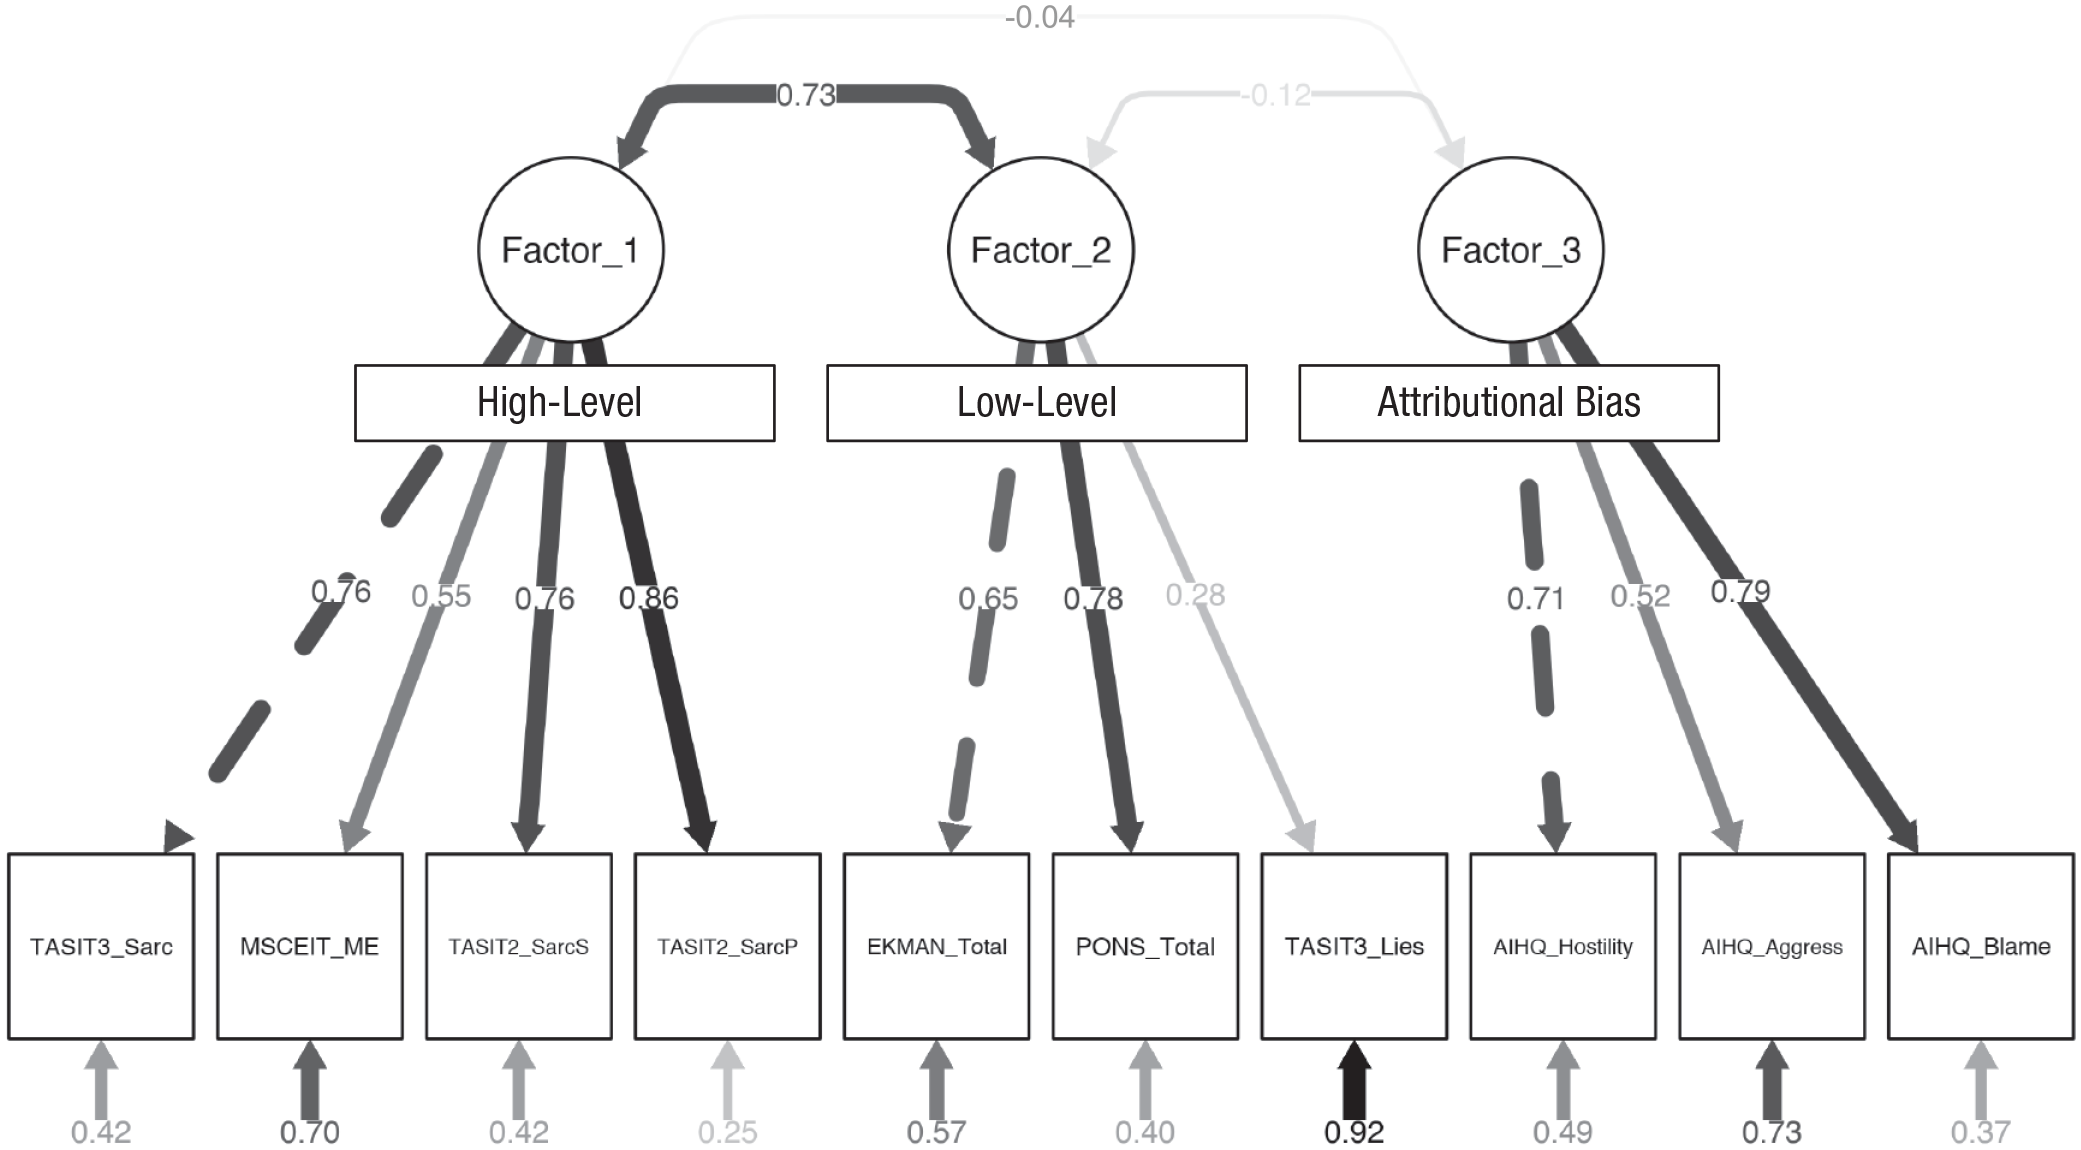
Confirmatory factor analysis for a three-factor model of social cognition. Values shown are the standardized parameter estimates, that is, the standardized regression coefficients (β). Dotted lines indicate fixed parameters in the model. Thickness of lines indicate statistical significance. Circles represent latent variables, and rectangles represent observed variables. A description of each social cognitive assessment can be found in Table 1.
In a first step, maximum likelihood (ML) was used to fit a CFA to the empirical data and to determine fit and parameter estimates for this model. Two common types of indices were used to assess model fit: absolute and incremental (Hooper, Coughlan, & Mullen, 2008). Absolute fit indices are measures of how well the model fits compared with no model at all (Jöreskog & Sörbom, 1993). In this study, the χ2/degrees of freedom ratio (χ2/df), the goodness-of-fit index (GFI), the root mean square error of approximation (RMSEA), and the standardized root mean square residual (SRMR) were used. Incremental fit indices compare the model of interest with a baseline model (e.g., a model in which all variables are uncorrelated; R. P. McDonald & Ho, 2002). In this study, the comparative fit index (CFI) and the Tucker-Lewis index (TLI) were used.
In a second step, the fit of the three-factor model was compared with the fit of nested two- and one-factor models. The two-factor model was derived by constraining the correlation between Factors 1 and 2 to 1.0. Factors 1 and 2 showed the highest correlation in our previous study (Mancuso et al., 2011). The one-factor model was derived by constraining the correlations between all factors to 1.0. Statistical comparison was performed using the χ2 difference test (Δχ2). For nested models, a significant Δχ2 statistic indicates superiority of the model with the lowest χ2 value (considering the change in degrees of freedom by removing free parameters from the model; Bollen, 1989).
After these two steps, factor scores for the three latent factors were computed for each participant using factor score regression with unit weighting (0 = does not load on the factor, 1 = loads on the factor) of the standardized social cognitive scores. Unit weighting yields factor scores that are less likely to be overfit and more likely to be replicable in an independent sample. All analyses were performed using the R package lavaan (Rosseel, 2015).
External validation
First, we used bivariate Pearson correlations for external validation of the factors, as done in previous studies (Browne et al., 2016; Mehta et al., 2014).
Second, we used LASSO regression to model the independent contributions of social-cognitive Factors 1 and 2, on the one hand, and expressive versus experiential negative symptoms, positive symptoms, and nonsocial cognitive impairment, on the other hand, in the prediction of functioning (UPSA, MASC, RFS). Because Factor 3 showed no significant correlation with any of the functioning measures (Table 2) and because previous studies found no contribution of Factor 3 to functioning (Buck et al., 2016; Mancuso et al., 2011; Pinkham, Penn, Green, & Harvey, 2016), we included the machine-learning approach for Factor 3 as a supplemental, exploratory analysis only. In addition, the relationship of each social-cognitive factor, which showed a significant bivariate correlation with experiential negative symptoms, was also analyzed using a LASSO regression that modeled the independent contribution of that social-cognitive factor and nonsocial cognition as explanatory variables and experiential negative symptoms as an outcome variable. This approach was chosen because it has been shown in prior modeling studies that effects of social cognition on real-world functioning are mediated via experiential negative symptoms (Green et al., 2012).
Bivariate Correlations Between the Three Social-Cognitive Factors and Measures of Symptoms, Nonsocial Cognition, and Functioning
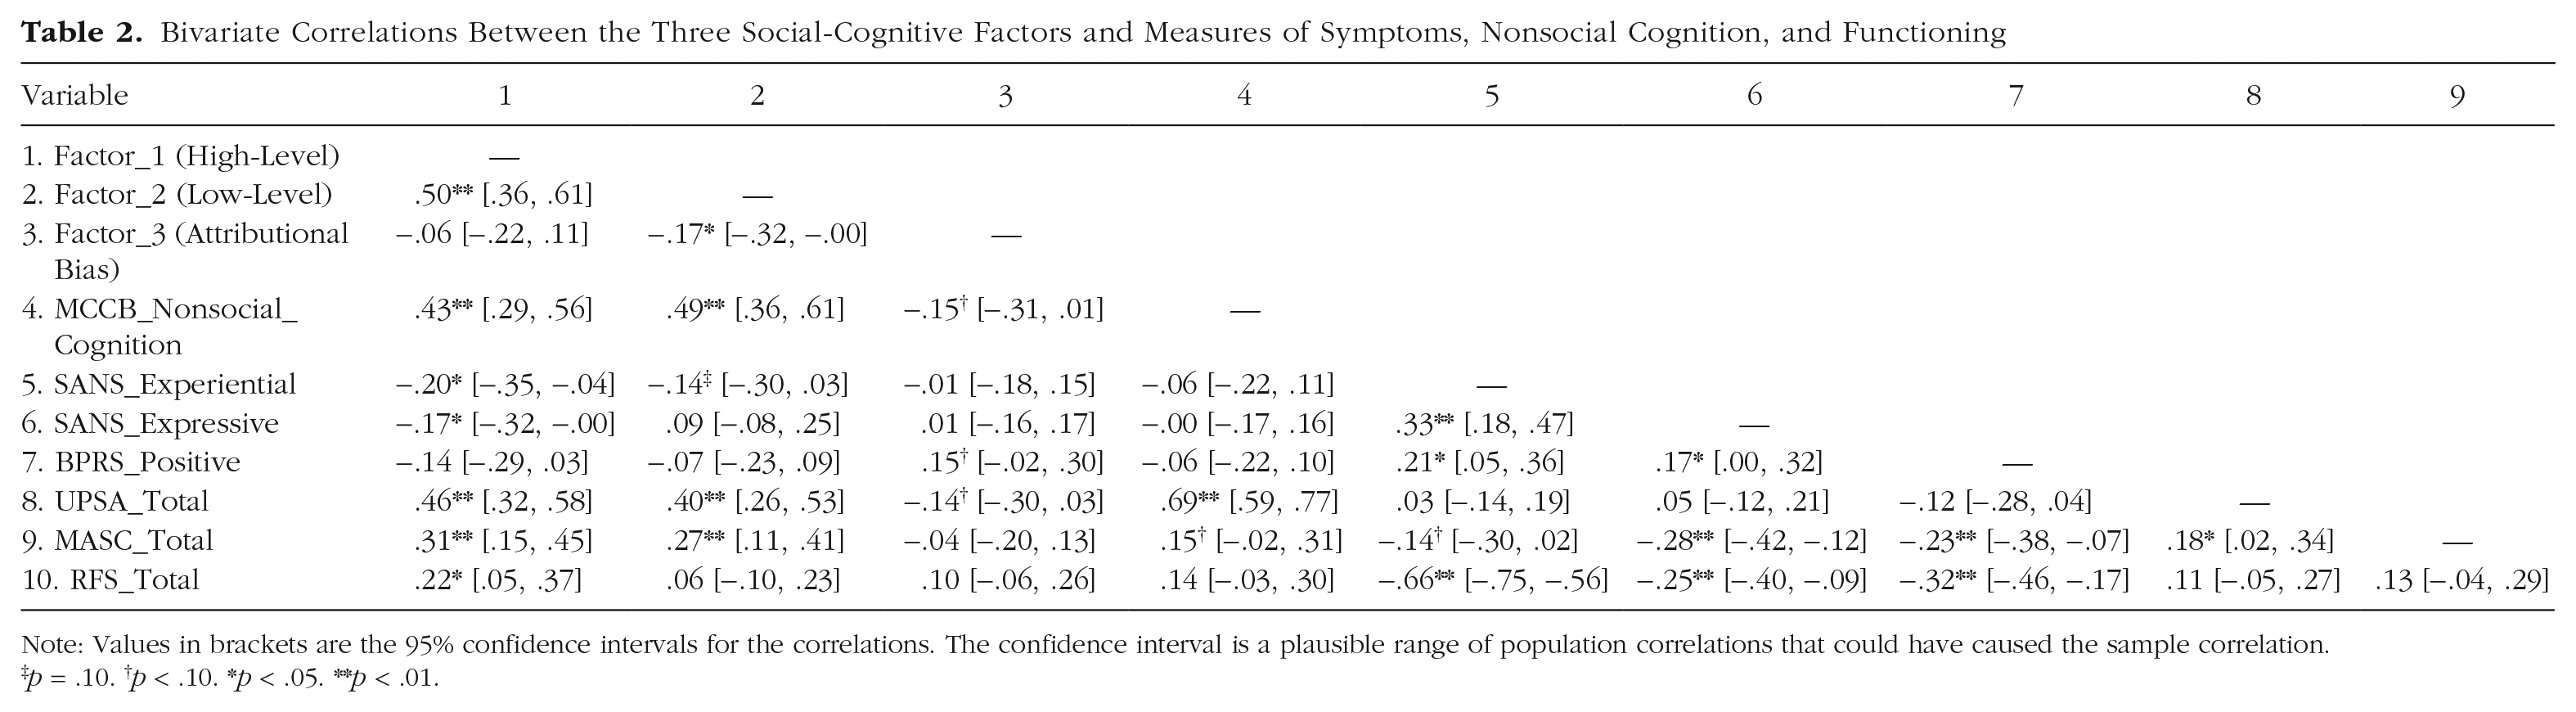
Note: Values in brackets are the 95% confidence intervals for the correlations. The confidence interval is a plausible range of population correlations that could have caused the sample correlation.
p = .10. †p < .10. *p < .05. **p < .01.
LASSO penalizes linear models so that the regression coefficients of explanatory variables that have no (or practically no) independent contribution to the prediction are shrunk to 0. The degree of shrinkage was chosen to balance close fit and degree of shrinkage (for details, see the Supplemental Material) using 5-fold cross-validation. Cross-validation produces robust choices of the shrinkage parameter that are not driven by individual participants and thus avoids overfitting. We repeated the estimation of the optimal shrinkage parameter using cross-validation 100 times and conducted a LASSO regression of the complete data set for each choice of the shrinkage parameter. All analyses for external validation were performed using the R package glmnet (Friedman, Hastie, & Tibshirani, 2015). For more detailed information on these analyses, see Statistical Analysis under Supplemental Methods in the Supplemental Material.
Results
Demographic and clinical information
A total of 141 participants who met DSM–IV criteria for either schizophrenia (n = 109), schizoaffective disorder (n = 14), or psychosis NOS (n = 18) were eligible for the current analyses. The mean age was 47.7 years (SD = 10), mean education was 12.5 years (SD = 1.9), and 67.4% of the sample were men. With regard to ethnicity, the sample was 21.7% Hispanic. With regard to race, the sample was 55% White, 34.3% African American, 3.6% Asian, 1.4% Hawaiian Pacific Islanders, and 5.7% multiracial. Participants showed low to moderate negative and positive symptoms (SANS affective flattening: M = 1.69, SD = 1.40; SANS alogia: M = 0.67, SD = 1.09; SANS avolition/apathy: M = 3.04, SD = 0.96; SANS anhedonia/asociality: M = 2.53, SD = 1.20; BPRS positive: M = 1.96, SD = 0.88). For descriptive statistics for the social cognitive, nonsocial cognitive, symptom, and functioning measures, see Table S1 in the Supplemental Material.
Confirmatory factor analysis
The three-factor model (Fig. 1) showed a good but not excellent fit. The values for χ2/df (1.68); GFI (.931); RMSEA (0.069), p (RMSEA ≤ 0.05) = .156; SRMR (0.062); CFI (.947); and TLI (.926) reached common cutoffs for a good fit (Hooper et al., 2008). However, they did not substantially surpass the cutoffs for excellent or good (shown respectively in parentheses): χ2/df (< 2, 2–5), GFI (> .95, > .90), RMSEA (< 0.06, < 0.08), SRMR (< 0.05, < 0.08), CFI (> .95, > .90), and TLI (> .95, > .80). More detailed information on the estimated CFA model is provided in Figure 1 and Table S2 in the Supplemental Material. The detection-of-lies subscale of the TASIT Part 3 showed a low factor loading (Fig. 1) and moderate residual correlations, which caused a slightly compromised model fit. For details, see Table S2 and Confirmatory Factor Analysis under Supplemental Results in the Supplemental Material. Table S3 in the Supplemental Material shows the factor loadings of the CFA in the current sample next to the factor loadings of the EFA in our previous sample (Mancuso et al., 2011).
Note that the three-factor model, χ2(32) = 53.769, showed a significantly superior fit, as assessed with the Δχ2 test, compared with both the nested two-factor model, ∆χ2(2) = 18.64, p (> χ2) = 8.96 × 10⁻⁵, and the one-factor model, ∆χ2(3) = 101.95, p (> χ2) = 2.2 × 10⁻¹⁶.
Note that there was no obvious demographic variation in the social cognition measures that drove the three-factor structure of social cognition in this study (see Table S4 and Confirmatory Factor Analysis under Supplemental Results). For further information, the intercorrelations among the social cognition measures on which the CFA was based are presented in Table S5 in the Supplemental Material. Correlations between nonsocial cognition and the social cognition measures are presented in Table S6 in the Supplemental Material.
External validation
The patterns of bivariate Pearson correlations with measures of symptoms, nonsocial cognition, and functional outcomes (Table 2) were highly similar to the ones observed in our previous study (Mancuso et al., 2011). There were just a few minor differences. Although the r values for the correlation between Factor 1 (high-level) and negative symptoms were similar in both studies (r ~ −.2), the correlations were statistically significant in the current sample only. This finding might be due to higher power in the current sample (N = 141) compared with the previous sample (N = 85). The current, larger study differed from the previous study in another way: Factor 1 alone (high level), but not Factor 2 (low level), was significantly correlated with real-world functioning. In addition, the previous study found significant correlations for Factor 3 (attributional bias) with nonsocial cognition and positive symptoms; however, the current study found a trend only (i.e., r = –.15 in the current sample in contrast to r = .22 in the previous study for nonsocial cognition; r = .15 in the current current sample in contrast to r = .28 in the previous study for positive symptoms; Mancuso et al., 2011).
Statistical results for the models that were obtained from 100 repetitions of multiple linear regression with LASSO shrinkage and five-fold cross-validation are presented in Figures 2 and 3. A linear combination of at least one subset of explanatory variables was found to be useful for estimating each functional outcome (UPSA, MASC, RFS).

Multiple linear models including Factor 1 (high-level social cognition) for the prediction of functioning. Shown on the left are the mean standardized βs (± 1 SE) for each explanatory variable in the models predicting functional capacity—UCSD Performance-based Skills Assessment (UPSA; Patterson, Goldman, McKibbin, Hughs, & Jeste, 2001) and the Maryland Assessment of Social Competence (MASC; Bellack, Sayers, Mueser, & Bennett, 1994)—and real-world functioning (Role Functioning Scale [RFS]; McPheeters, 1984). A higher absolute β value for an explanatory variable reflects a stronger contribution of that variable to functional outcome. All β values are standardized and thus comparable between variables. A β value of 0 indicates no or practically no independent contribution of an explanatory variable to functional outcome above and beyond other variables. Shown on the right is the percentage of repetitions in which an explanatory variable was retained in the model (i.e., its β value not shrunk to 0). The higher the percentage, the more robust the variable’s contribution.
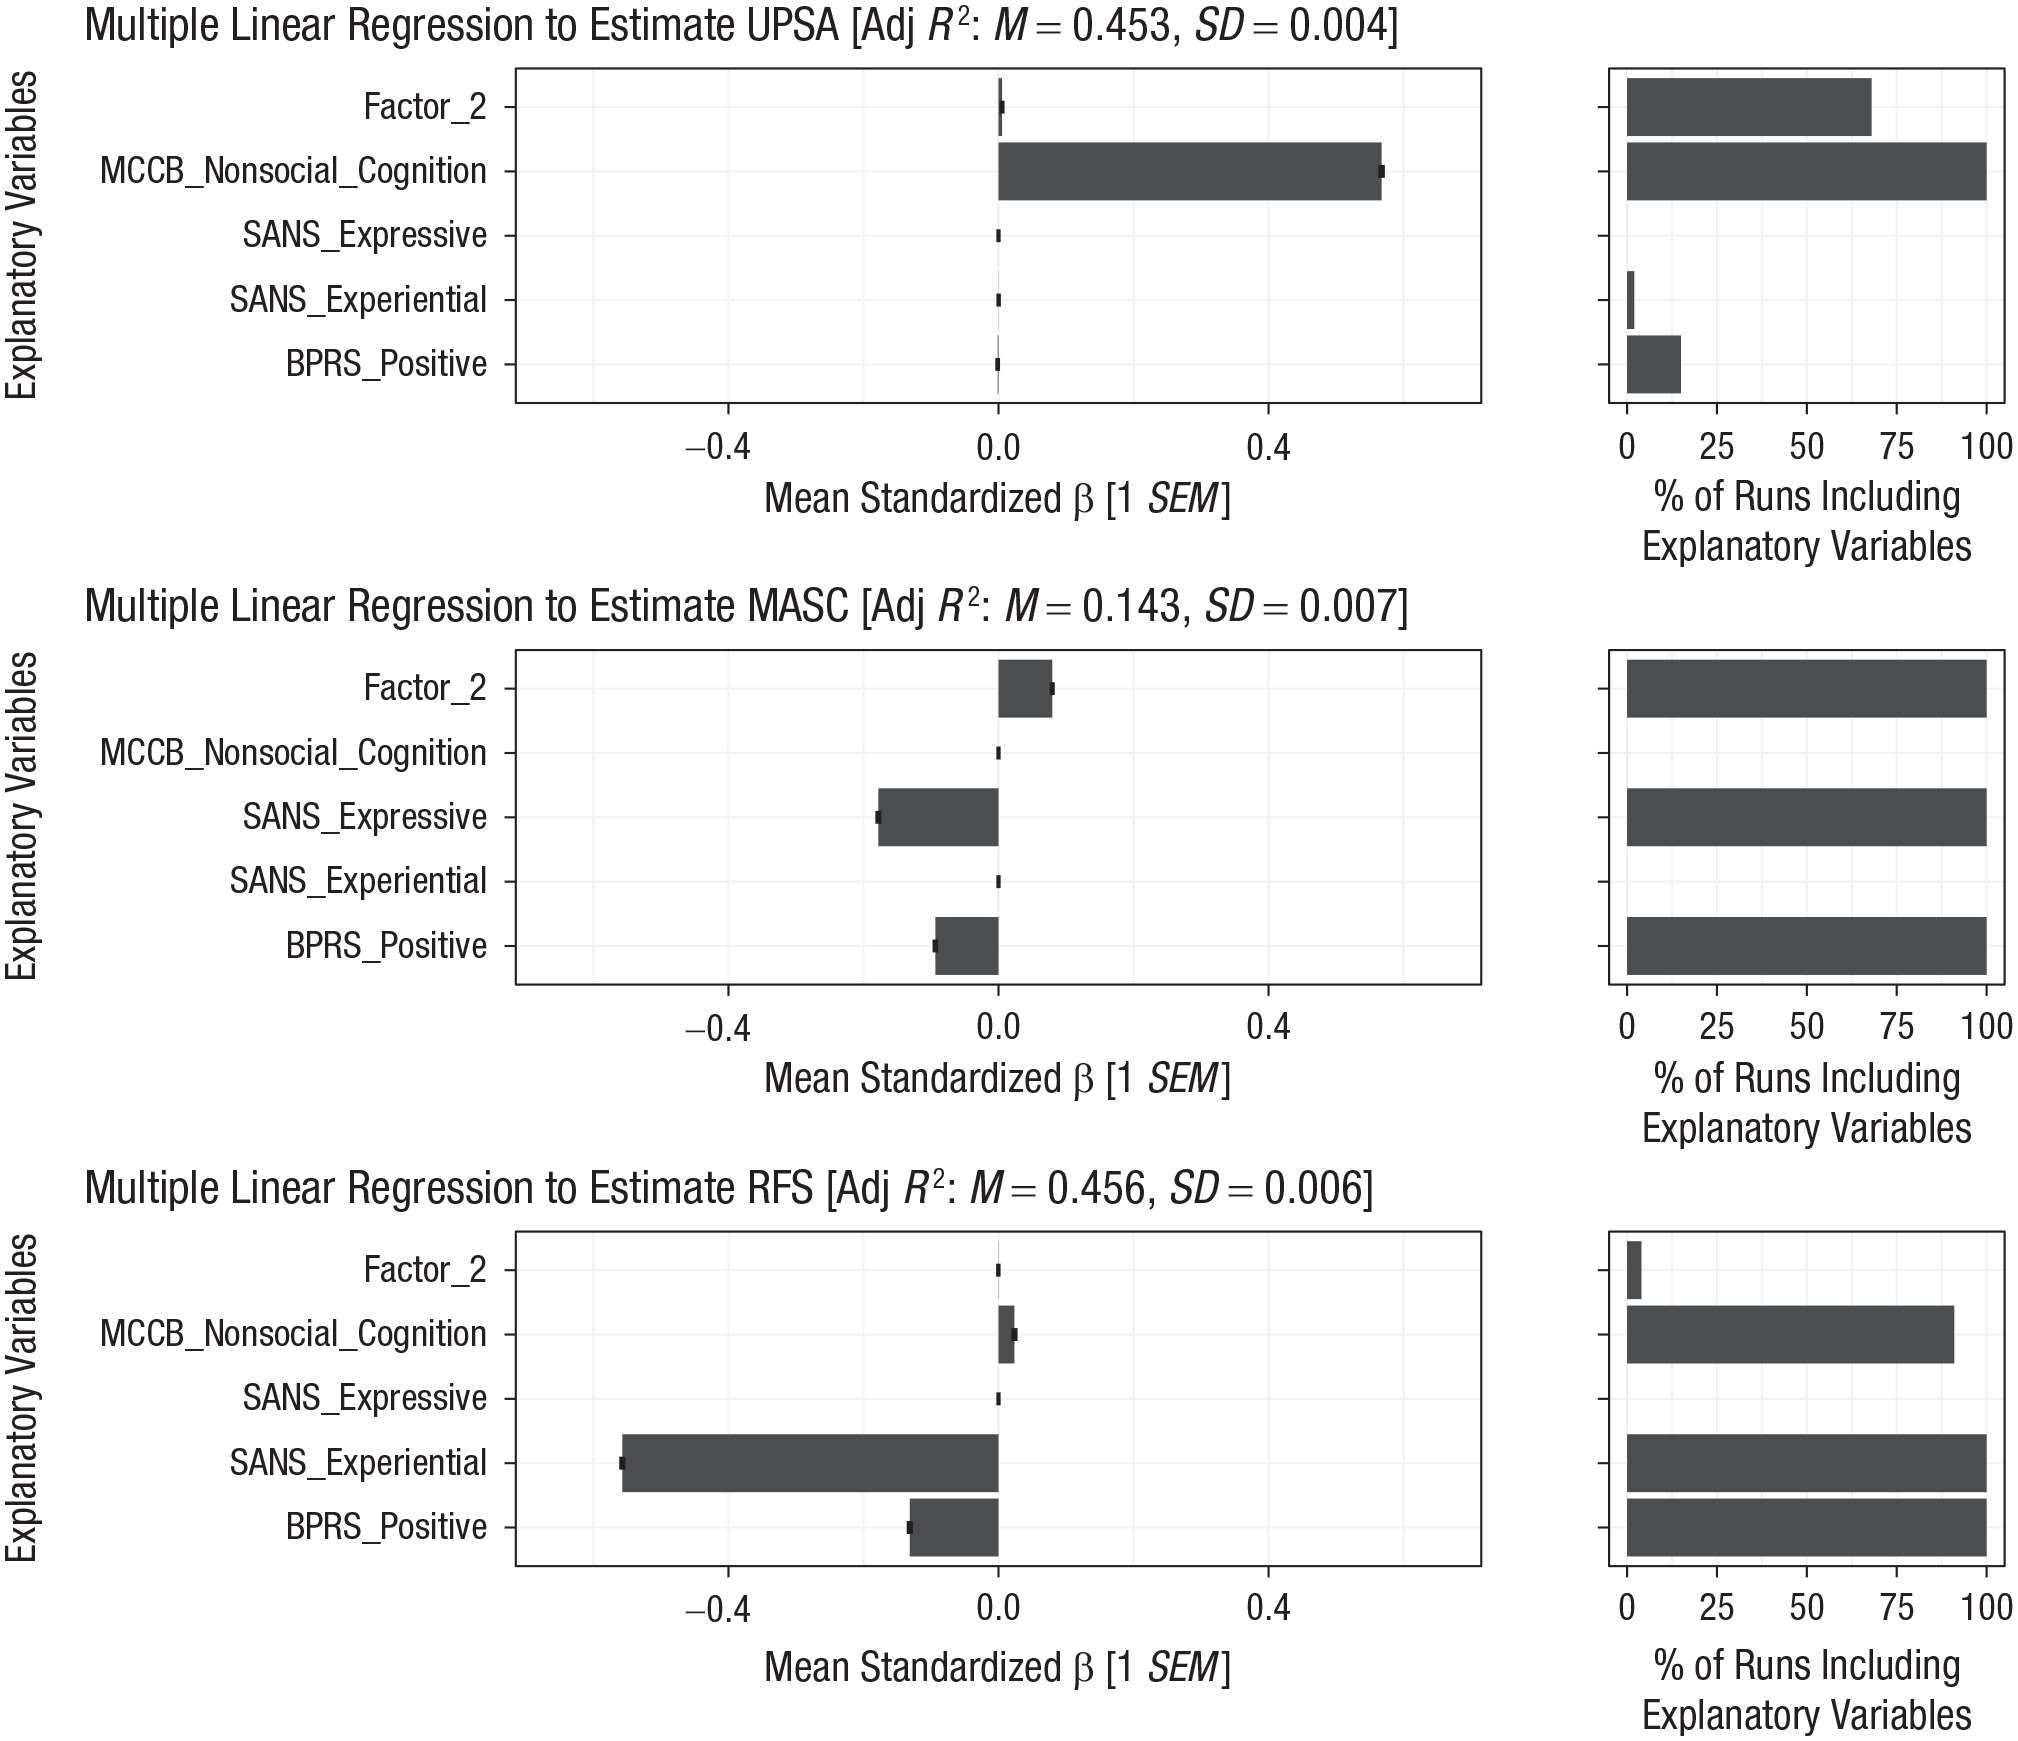
Multiple linear models including Factor 2 (low-level social cognition) for the prediction of functioning. Shown on the left are the mean standardized βs (± 1 SE) for each explanatory variable in the models predicting functional capacity—UCSD Performance-based Skills Assessment (UPSA; Patterson, Goldman, McKibbin, Hughs, & Jeste, 2001) and the Maryland Assessment of Social Competence (MASC; Bellack, Sayers, Mueser, & Bennett, 1994)—and real-world functioning (Role Functioning Scale [RFS]; McPheeters, 1984). Shown on the right is the percentage of repetitions in which an explanatory variable was retained in the model.
The linear models including Factor 1 (Fig. 2) were found to be similar to the ones including Factor 2 (Fig. 3). This was largely expected given a moderate intercorrelation between the two factors (r = .5; Table 2). But the factors also showed specific differences in their external correlates. All models were consistent with existing theory and therefore provided external validation of the factors.
Models predicting functional capacity showed a mean β value of the social-cognitive factors that was different from 0. For UPSA, the models confirm a stronger contribution of nonsocial cognition compared with social cognition. Factor 1 showed a higher β value than Factor 2 and was retained in all of the 100 repetitions, compared with about 68 out of 100 for Factor 2. Thus, the independent predictive value of Factor 1 was higher and more robust than that of Factor 2.
For MASC, the models confirm a comparable independent contribution of expressive negative symptoms, positive symptoms, and social cognition. Both Factors 1 and 2 were retained in all of the 100 repetitions.
Models predicting real-world functioning showed no (Factor 2) or practically no (Factor 1) independent predictive value of the social-cognitive factors above and beyond experiential negative symptoms (high β of −0.55), positive symptoms, and nonsocial cognition. Factor 1 was retained in the model in about half of the repetitions but with very low β values. Factor 2 was shrunk to 0 in almost all of the 100 repetitions.
To determine whether the significant correlation between Factor 1 and experiential negative symptoms in the current sample (see above), but not previous sample (Mancuso et al., 2011), could be explained by a strong impact of outlying subsets of observations, we conducted an additional LASSO regression (and cross-validation). This analysis showed a robust (i.e., retained in all 100 repetitions) and independent contribution of Factor 1 (above and beyond nonsocial cognition) in the prediction of experiential negative symptoms (see Fig. S1 in the Supplemental Material). Therefore, it can be excluded that outlying subsets of observations had a strong impact.
Discussion
The multifactor structure of social cognition in psychosis found in a previous study (Mancuso et al., 2011) was replicated using a large, nearly identical set of tasks in an independent participant sample. In addition, using robust data-driven machine-learning techniques, we replicated the expected pattern of independent contributions of social-cognitive factors, on the one hand, and expressive versus experiential negative symptoms, positive symptoms, and nonsocial cognitive impairment, on the other hand, in the prediction of functioning. Modeling this complex interaction among a large set of variables confirmed external and incremental validity of the low and high social-cognitive factors. These findings indicate that replicability in the structure and correlates of social cognition in psychosis is achievable across independent samples using highly similar measures of social cognition and external variables. They also highlight how methodological factors have contributed to inconsistencies across prior studies in this area.
Using CFA, we replicated the three-factor structure of social cognition found by Mancuso et al. (2011) using EFA. Only one prior CFA study directly addressed replicability using a related approach. Browne et al. (2016) used CFA to show a robust structure of social cognition when the same participants were reassessed with the same, relatively narrow set of emotion perception and mentalizing tasks after a short interval of 2 to 4 weeks. The current study substantially advances beyond this prior work by replicating the structure we previously identified with a much broader range of social cognitive measures in a fully independent clinical sample.
Consistent with our earlier findings, we found a low-level factor and a high-level factor that were moderately intercorrelated (r = .5 in current study; r = .3 in Mancuso et al., 2011) but clearly separated from the attributional bias factor. A separate attributional bias factor was also found by every other study that included tasks assessing attributional style (Buck et al., 2016; Mehta et al., 2014). Despite the replicability of this factor, instrumentation in this area is very limited, and the findings raise a methodological caveat. All studies that assessed attributional bias used the AIHQ except for Mehta et al. (2014), who instead used the IPSAQ (none used both). Thus, the field has relied on two self-report/rater-based measures—AIHQ and IPSAQ—in the absence of validated measures using other approaches. Although the AIHQ and IPSAQ are often described as measures of attributional bias, they are not significantly correlated in people with psychosis (Combs et al., 2007). The closest relevant performance measure we are aware of is the beads task, which is believed to assess a tendency to “jump to conclusions.” However, this is clearly a broader construct than attributional bias, and studies have not found significant associations between it and the AIHQ or IPSAQ (Buck et al., 2016; Healey et al., 2015; Langdon, Ward, & Coltheart, 2010). Thus, it is currently unclear if the attributional bias factor is capturing a cohesive social cognitive construct rather than method-specific variance. The construct validity of an attributional bias factor cannot be fully evaluated until sound measures using alternate approaches are developed (see discussion below).
Our finding of separate factors for low and high social cognition replicates the findings not only of our previous EFA study using nearly identical social cognitive measures (Mancuso et al., 2011) but also of some studies using nonoverlapping measures and different factor-analytic approaches (e.g., Mehta et al., 2014, who used PCA; Oliver et al., 2019, who used EFA first and CFA second in the same data set). Note that even the CFA by Browne et al. (2016) actually statistically favored two separate low- and high-level factors. However, these factors were strongly intercorrelated (r = .87), which led the authors to propose a single-factor model instead. It is noteworthy that the hinting task did not load cleanly onto this single factor (Browne et al., 2016).
Therefore, the discrepancy between separate high- and low-level factors compared with unitary factor solutions may reflect the specific mentalizing measure or measures selected. The TASIT may capture mentalizing capability more specifically than the hinting task and therefore also separate a high-level factor more clearly. This view is supported by three facts. First, the TASIT is a more ecologically valid and challenging task. Second, it is only moderately correlated with the hinting task (rs = .2–.4; Buck et al., 2016; Morrison et al., 2019). Third, the TASIT clearly loaded on a separate high-level factor in the current and most previous studies (Mancuso et al., 2011; Oliver et al., 2019). The one study that used the TASIT and did not find a separate high-level factor examined a relatively small sample of individuals with psychosis for this type of analysis (n = 65; Buck et al., 2016). Moreover, their clinical sample was specifically selected for social difficulties, which may have truncated the range of social cognitive scores and also made it more difficult to uncover separate high- and low-level social-cognitive factors. Note that Buck et al. (2016) did detect a separation in high as opposed to low factors in their healthy control sample, which had no functional selection criteria. Apart from previous structural studies, a separation into low-level and high-level factors is supported by neuroimaging studies in social cognitive neuroscience (Green, Horan, & Lee, 2015; Van Overwalle & Baetens, 2009).
Critically, the high correlation between the low-level and high-level factor in the current and other structural studies could be inflated because of variance in nonsocial cognition. We would not expect the social and nonsocial cognition measures to be fully independent. In fact, we were one of the first groups to demonstrate that social and nonsocial cognition are not fully separate in schizophrenia (Sergi et al., 2007). In line with this earlier finding and consistent with the high correlation between the low-level and high-level factor, we see moderate correlations between nonsocial cognition and the social cognitive measures for low- and high-level factors (i.e., TASIT, MSCEIT, EKMAN, PONS). However, there were no significant correlations between nonsocial cognition and AIHQ (see Table S6 in the Supplemental Material).
In light of the relatively restricted range and psychometric properties of social cognitive measures available for use in psychosis (Pinkham et al., 2016; Pinkham, Harvey, & Penn, 2018), we anticipate that replicability of separate low-level and high-level factors (and a attributional bias factor) will grow as research in this area matures and multiple, psychometrically sound measures of different social cognitive constructs are developed. New approaches are being explored for the assessment of attributional bias. For example, the sensitivity of the AIHQ might be improved by including accidental items as well as ambiguous events (Buck et al., 2018). In addition, alternative measures of bias in psychosis hold some promise, including, for example, the Davos Assessment of Cognitive Biases Scale (Davidson, Lesser, Parente, & Fiszdon, 2018; Van der Gaag et al., 2013), the Intentionality Bias Task (Buck et al., 2018; Rosset, 2008), and the Social Attribution Test (Bell, Fiszdon, Greig, & Wexler, 2010). A key next step is to determine how these measures, which use different formats (performance vs. self-report) and types of stimuli (visual vs. verbal), relate to each other and to the AIHQ.
For the assessment of low-level (e.g., emotion recognition) and high-level social cognition (e.g., theory of mind, emotion regulation), there are several paths forward for method development. Development of assessments that measure low- and high-level social cognition more specifically will also result in a better distinction of these two factors. For example, the flourishing area of social cognitive neuroscience (Arioli, Crespi, & Canessa, 2018; Caruana, McArthur, Woolgar, & Brock, 2017; Lieberman, 2007; Porcelli et al., 2019; Tudusciuc & Adolphs, 2015) provides a rich source of novel measures that could be adapted for use in schizophrenia research; however, in our experience, this translational process is not straightforward (Kern et al., 2013). Alternatively, tasks developed for other clinical populations, such as autism spectrum and neurological disorders (Caruana et al., 2018; Henry, Von Hippel, Molenberghs, Lee, & Sachdev, 2016; Kandalaft, Didehbani, Krawczyk, Allen, & Chapman, 2013), might be fruitfully adapted to schizophrenia research. There are also interesting new paradigms using emerging technologies, such as virtual reality, that show promise for use in schizophrenia research (Caruana, Seymour, Brock, & Langdon, 2019; Oker et al., 2015).
Over and above the robust evidence for the replicable multifactor structure, the current study replicated external and incremental validity of the social-cognitive factors and overcame past limitations in the assessment of external correlates.
Simple bivariate correlations showed differential patterns of correlations of each of the three factors with clinical symptoms, nonsocial cognition, and functional outcome measures (Table 2). These findings were largely consistent with the correlations found in our previous (Mancuso et al., 2011) and other studies (for reviews, see Green et al., 2019; Javed & Charles, 2018). In this study, we observed that high-level social cognition explained about 5% of the variance in real-world functioning (RFS; r = .22), which is a definite but rather small contribution compared with experiential negative symptoms (44%; r = .66). Furthermore, social cognition most reliably predicted functional capacity as measured with the MASC (r = .31 for high level; r = .27 for low level), a measure of ability to solve common problems in an interpersonal context. In contrast, we found that nonsocial cognition most reliably predicted functional capacity as captured with the UPSA (r = .69), a measure of everyday tasks that do not require rich social cognitive abilities. These findings are in line with recent hypotheses that suggest that social cognition and nonsocial cognition predict different domains of functioning (Silberstein & Harvey, 2019). Critically, in contrast to both the high-level and low-level factor, the attributional bias factor was not linked to any functional outcome measure, similar to previous findings (Buck et al., 2016; Mancuso et al., 2011; Pinkham et al., 2016).
In a next step, LASSO regression using shrinkage chosen by cross-validation allowed us to assess how the contributions of both low- and high-level social-cognitive factors to functioning change after accounting for nonsocial cognition and a broad range of clinical symptoms. This approach also provides information on incremental validity and controls for overfitting. The regression models resulting from these machine-learning techniques showed that both factors had an additive value above and beyond nonsocial cognition and clinical symptoms in models that predict functional capacity. That is, the β values of the social-cognitive factors were not shrunk to 0. In line with the results of the bivariate correlations, social cognition, but not nonsocial cognition (β = 0), had a predictive value for the MASC. Note that expressive negative symptoms most strongly contributed to the MASC in the regression models. Although β values for both social and nonsocial cognition were nonzero in the models estimating the UPSA, nonsocial cognition had a higher predictive value compared with social cognition (i.e., a higher β value). In contrast to functional capacity, there was no (or practically no) additive value of the social-cognitive factors above and beyond negative symptoms in models that predict real-world functioning. These results are consistent with our previous hierarchical regression models (Mancuso et al., 2011). The results were based on a complementary data-driven analysis (vs. a theory-driven approach) and arrived at the same conclusion. The current regression models also controlled for a larger set of clinical symptoms than previous studies, that is, separate expressive and experiential negative symptoms (Blanchard & Cohen, 2006) and positive symptoms. In addition, the relationships retained in the data-driven, cross-validated models are more likely to replicate going forward.
In line with meta-analyses showing that theory of mind has the strongest association with functional outcome (Fett et al., 2011), we found a significant bivariate correlation only for the high-level factor with real-world functioning. However, the additive value of high-level social cognition to real-world functioning was minimal at best after accounting for other variables. Although such little contribution was unexpected, we know from prior modeling studies that there are several intervening variables between social cognition and functioning, particularly defeatist beliefs and experiential negative symptoms (Grant & Beck, 2009; Green et al., 2012; Quinlan, Roesch, & Granholm, 2014; Rassovsky, Horan, Lee, Sergi, & Green, 2011; Thomas et al., 2017). Note that the high-level factor showed associations with experiential negative symptoms in the current study both in bivariate correlations and in data-driven models. Taken together, these findings indicate that the contribution of high-level social cognition to real-world functioning is mainly mediated by experiential negative symptoms.
These conclusions should be tempered by two considerations. First, some similarities among items in the SANS experiential subscale and those in the RFS (Blanchard, Kring, Horan, & Gur, 2011) could have (a) inflated their interrelationship, (b) left little variance left to explain in the multiple linear models, and (c) thus masked a direct link from social cognition to everyday life. Second, although the current sample size was well suited for factor analysis, it is small for a machine-learning approach. This can result in some existing external correlates not being selected using the shrinkage parameter chosen by cross-validation. However, these external correlates are likely (a) to have very weak independent contributions, (b) to be driven by outlying subsets of observations, and (c) to be of little practical relevance. In addition, the current data set is one of the largest collected to date in terms of both the number of participants and number of social cognitive tasks, which minimizes the chance that relevant independent contributions to functional outcome were discarded using LASSO regression and cross-validation.
The current study had the following additional limitations. First, the generalizability of the factor structure and external correlate results are constrained by the use of a sample of older, chronically ill, medicated, and predominantly male patients. Second, as already mentioned with regard to the AIHQ and attributional bias factor, method variance is a possible confounding mechanism. However, we consider the influence of this potential confounder on our results to be small for several reasons: (a) The current study used a multimethod approach with ability scales, self-reports, and rater-scored measures of social cognition; (b) the rater-based scores from the AIHQ did not significantly correlate with rater-based scores on the RFS; (c) even though our ability scales were intercorrelated, the three-factor solution, consisting of two factors that each comprised only ability scales, was still superior to a two-factor solution with all ability scales loading on only one factor; and (d) both the high-level and low-level social-cognitive factors are inferred from different vignettes of the same measures (i.e., the TASIT). Third, the data-driven modeling in this study would optimally have been validated in yet another independent data set assessing a wide range of both low and high social cognition processes, ideally with different, psychometrically sound tasks. Aside from the practical challenges, further development of new social cognitive tasks is needed for such a multitask cross-validation approach.
In summary, we addressed the replicability problems that have impeded research in the described research area. The current findings demonstrate the replicability of a multifactor structure when using highly similar social cognitive tests and clinical samples. Identifying the structure of social cognition is foundational for guiding research that addresses this functionally important area, including developing test batteries to address key social cognitive domains, optimizing models of how social cognition affects functional outcome, utilizing neuroimaging and molecular genetic studies, and developing new treatments that target social cognition. The current findings also point to the need for more careful attention to methodological features when designing and interpreting structural studies of social cognition and the need for new, improved measures to investigate this complex construct.
Supplemental Material
Riedel_Supplemental_Material – Supplemental material for The Factor Structure of Social Cognition in Schizophrenia: A Focus on Replication With Confirmatory Factor Analysis and Machine Learning
Supplemental material, Riedel_Supplemental_Material for The Factor Structure of Social Cognition in Schizophrenia: A Focus on Replication With Confirmatory Factor Analysis and Machine Learning by Philipp Riedel, William P. Horan, Junghee Lee, Gerhard S. Hellemann and Michael F. Green in Clinical Psychological Science
Footnotes
Acknowledgements
We thank the staff of the Green Lab at the University of California, Los Angeles, for help with data acquisition.
Transparency
Action Editor: Michael F. Pogue-Geile
Editor: Scott O. Lilienfeld
Author Contributions
W. P. Horan, J. Lee, G. S. Hellemann, and M. F. Green contributed to the experimental design of the study and wrote the protocol. Data analysis was performed by P. Riedel and W. P. Horan. G. S. Hellemann assisted with the analyses as a statistical consultant. The first draft of the manuscript was written by P. Riedel. All of the authors contributed to and approved the final manuscript for submission.
References
Supplementary Material
Please find the following supplemental material available below.
For Open Access articles published under a Creative Commons License, all supplemental material carries the same license as the article it is associated with.
For non-Open Access articles published, all supplemental material carries a non-exclusive license, and permission requests for re-use of supplemental material or any part of supplemental material shall be sent directly to the copyright owner as specified in the copyright notice associated with the article.