
Abstract
Recently, consideration was given to the impact of dose selection strategies in phase IIb on the overall success of drug development programs. A natural next step is to simultaneously optimize design aspects of both phase IIB and phase III. We used type 2 diabetes as an example, including realistic regulatory and commercial scenarios for this indication. The expected net present value (eNPV) has been selected as the primary outcome because it naturally accommodates optimization, providing an explicit trade-off between the probability of success (PoS) and time delays and trial costs. Our findings are that larger studies and/or implementation of an adaptive design over a fixed design in phase IIb provide more precise dose selection and reduce the bias of treatment effects and uncertainty in the estimated eNPV within the range of sample sizes that we examined. Developers also have to ensure that dose selection criteria are consistent with development strategy and objectives.
1. Background
Late-stage clinical trials are large and usually risky investments. The sponsor has to decide whether to enter dose-finding phase IIb and later, based on the results of that trial, whether to continue into the even more expensive confirmatory phase III. Given that the project is not discontinued, key questions are how to design the trials in terms of, for example, dose(s) and sample size, with the goal of maximizing the probability of success (PoS), patient benefit, and expected net present value (eNPV).
To find a good dose is often critical to a project’s success. Recently, the Adaptive Dose-Ranging Studies (ADRS), a working group that operated under the Pharmaceutical Research and Manufacturers of America (PhRMA), published several papers in which they proposed novel dose selection methods. 1 , 2 Additionally, consideration was given to impacts that dose selection strategies in phase IIb have on the overall success of development programs 3 , 4 and whether 1 or 2 doses from the dose-finding stage should be chosen to continue into phase III. 3
A natural next step is to simultaneously optimize design aspects of both phase IIb and phase III. As a continuation of the ADRS, an adaptive program (AP) has been formed to address the issues around such optimization at a program level. The AP is part of the Adaptive Design Scientific Working Group (ADSWG), now working under the DIA. The objective of the AP is to further develop theoretical approaches for the optimization of drug development at the program level and propose applications to selected therapeutic areas. The first specific indications selected were neuropathic pain, 5 oncology, and diabetes.
This paper extends the work of the ADRS such that it addresses issues specific to type 2 diabetes drug development, including realistic regulatory and commercial issues and scenarios. Diabetes is affecting more and more people worldwide because of changes in diet and lifestyle. The World Health Organization (WHO) estimates that there were 171 million people with diabetes in the year 2000 and predicts that this number will more than double by the year 2030. Approximately 90% to 95% of the diabetic population is affected by type 2 diabetes. Recent findings that some diabetes treatments were associated with an increased risk of major cardiovascular (CV) events have prompted the FDA to issue a specific guidance for industry for evaluating CV risk in antidiabetic therapies. 6 The consequences of this new regulatory guidance are increased costs and development risks. For pharmaceutical companies, this makes diabetes a high-risk/high-reward indication that requires a simultaneous consideration of efficacy and safety end points.
For confidentiality reasons, we have chosen to study a fictional project, and we have simplified certain aspects for pedagogical reasons. An actual drug project will have to be analyzed more thoroughly, based on the available information about efficacy and safety as well as on possible development options and known constraints. We hope that many of the ideas used in this example will be possible to carry over to new applications, even if tailoring will be needed.
2. Methods
The AP’s approach to program optimization is basically decision analytic. 7 We advocate that the assumptions underlying drug development decisions should be stated explicitly, that a variety of different design options should be generated, 8 and that a clear goal function should be defined. Technical details related to the information described in this section are presented in the online appendix that is linked to this paper.
2.1. Objectives
The objective of this study was to investigate the impact of selected phase IIb and phase III design parameters and decision criteria on regulatory and commercial outcomes for drug development programs for diabetes. Recommendations will be made for both the optimization of drug development in general and product development for diabetes specifically. The impact of the following design parameters will be assessed: (1) phase IIb design, (2) phase IIb sample size, and (3) phase III sample size.
2.2. Outcome
Defined as the probability of regulatory approval, the PoS is often a key measure of the performance of different program design options. Note that the PoS usually increases as the sample size increases. The eNPV has been selected as the primary outcome because it naturally accommodates optimization,9–11 providing an explicit trade-off between the PoS and time delays and trial costs. Several works describe the use of the eNPV to optimize drug development at the program level3–5 or at the portfolio level. 11 , 12
2.3. End Points
2.3.1. Efficacy
The primary regulatory efficacy end point for the program will be the HbA1c change from baseline, which is a standard efficacy end point in diabetes trials. For phase II studies, the treatment duration is usually either 12 or 24 weeks. For phase III studies, the treatment duration can range from 24 weeks up to 2 years.
2.3.2. Safety
While not strictly a key regulatory end point, the incidence of hypoglycemic events is a great medical concern and also has a significant impact on expected revenues. Consequentially, they are an important component of the dose selection criteria.
As already mentioned, in product development for diabetes, CV events are the safety events of largest concern. Because these events accrue at a very slow rate, they cannot be included in the decision criteria regarding the dose selection or progress into phase III in the same way as hypoglycemic events. Also, the CV requirement may require the initiation of an additional, larger CV outcomes trial to observe a sufficient number of events. As a result, the consideration of CV events is outside the scope of this paper.
2.4. Phase IIb Design
In this phase II study, we considered both a fixed design and an adaptive design. Specifically, the adaptive design chosen was a Bayesian general adaptive design allocation (GADA), 1 which used treatment adaptations that occurred every 4 weeks and were based on targeting doses with the maximum utility values (see below for description of utility functions). Prior work has compared the performance of several published adaptive dose-finding methods including GADA 1 , 3 and the impact of the frequency of interim analyses. 2 We decided not to further investigate these research questions, as we wanted to limit the number of parameters that we varied.
A longitudinal model was used for HbA1c over time so that patients with incomplete data could be used in the adaptation and analyses. Specifically, a time-course hierarchical model was used to allow all intermediate observations to be used in predicting the final value. We assumed a biweekly visit schedule for HbA1c assessments. Although the number of hypoglycemic episodes would be recorded at every visit, we dichotomized a patient as either having a hypoglycemic episode or not for the entire study. For simplicity, we did not make a distinction between severe and nonsevere hypoglycemic episodes. A futility rule based on the primary efficacy end point was utilized to stop studies that had no efficacious dose levels after 200 patients had been randomized into the study. If the maximum efficacious dose had less than a 10% posterior probability of having a mean change in HbA1c that was at least 0.8% better than a placebo, then the study was stopped for futility. The number of dose levels to include in a phase IIb dose-finding study has been examined elsewhere. 2 For simplicity, we assume 5 dose levels of the experimental treatment will be used in the phase IIb study along with a placebo arm. This is a suitable number of doses for this type of trial based on our prior experience and previously published work. 3 The duration of a phase IIb study for an antidiabetic medication is usually 12 to 24 weeks. For this study, the duration was only 12 weeks. We examined sample sizes of 300 and 600 patients. For enrollment, we assumed that 10 patients per week would be randomized after a “ramp-up” period of 9 weeks. We assumed a 20% dropout rate across all the experimental arms and placebo arm. Although not shown in this paper for brevity, alternative enrollment and dropout rates should be considered when examining the operating characteristics of a design. 13
Dose response analyses should be used for both efficacy and safety end points in assessing dose levels in these types of studies. For the dose response analyses, we chose a 4-parameter Emax model for the HbA1c end point and a first-order normal dynamic linear model 14 for the hypoglycemia end point. Prior diffuse distributions were selected for the parameters of these models and for the longitudinal model for HbA1c because we wanted the posterior distributions to be mostly determined by the data in phase IIb rather than from prior strong beliefs. Component utility functions were created for both the primary efficacy end point of HbA1c and the incidence of hypoglycemia. For HbA1c, the largest utility value was 3 and was achieved when the change from baseline to end point relative to the placebo was ≤–1.3% (Figure 1). For changes in the experimental arm relative to the placebo between –1.3% and –1.0%, the utility value decreased from 3 to 1. Similarly, the utility value decreased from 1 to 0 (although not as aggressively as in the previous interval) for changes in the experimental arm relative to the placebo between –1.0% and 0.0%. For any changes in which the placebo had a larger decrease in HbA1c relative to an experimental arm, the utility value was 0. Because it is unlikely that an experimental arm would have a lower incidence of hypoglycemia than the placebo, the largest safety component utility value was 1 for any instances where this occurred or up to a 4% worsening: this component utility value decreased linearly between 4% and 30% for a greater incidence of hypoglycemia in the experimental arm. When the incidence of hypoglycemia in the experimental arm was greater than 30% more than in the placebo arm, the utility value was 0. The utility components for HbA1c and hypoglycemia rates were multiplied together to give the overall utility of an experimental dose. This would allow for an experimental dose level that had an unacceptable hypoglycemia risk to be assigned a value of 0 regardless of the efficacy of that dose.
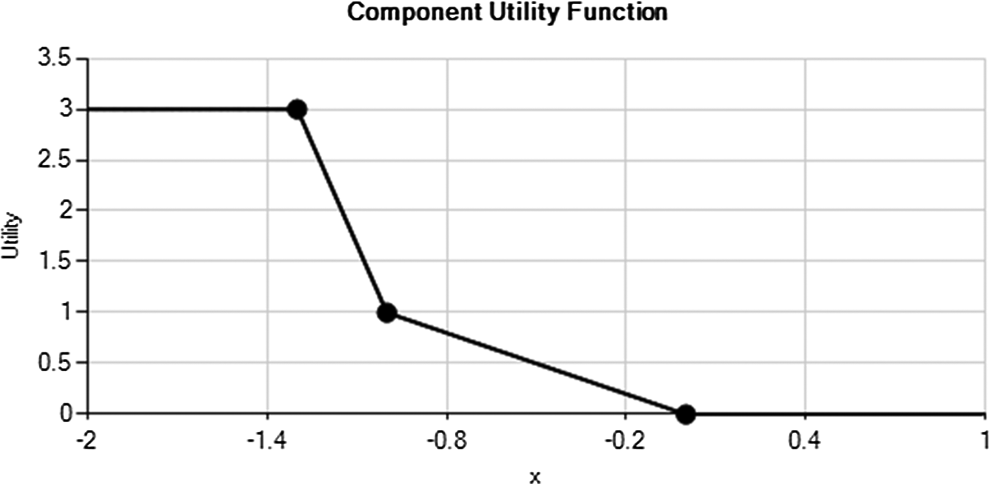
HbA1c utility function. The x-axis is the difference between the experimental arm and the placebo arm. The y-axis (utility) is the utility value assigned to this difference.
Doses were evaluated based on the utility relative to a clinically meaningful value, which was 0.8 for our study. The evaluation rule used was the following: if the probability of the efficacy of a dose being greater than the clinically meaningful value was ≥50%, then a dose was deemed viable. Note that the analyses were similar for both the fixed and adaptive designs. Selection of a phase III dose based only on statistical significance was not performed.
For the simulations, we initially created 3 efficacy scenarios: worse than expected, expected, and better than expected. We also created 3 safety scenarios: equal, expected, and worse than expected. For brevity, we do not show the results from scenarios where the efficacy was worse than expected because none of the experimental dose levels was of clinical value and consequently was chosen for further development. For all scenarios, the placebo is assumed to have a value of 0 for HbA1c change from baseline to end point and a value of 5% for the incidence of hypoglycemia. The “expected” efficacy scenario has HbA1c improvements of 0.2, 0.3, 0.6, 0.8, and 1.0 percentage points for doses D1 to D5, respectively. The “better than expected” scenario has improvements of 0.4, 0.5, 1.0, 1.3, and 1.5, respectively. The “equal” safety scenario has no increase in hypoglycemia rates on active doses. The “expected” scenario has increases of 0%, 0%, 0%, 3%, and 5% for the 5 doses of D1 to D5, respectively, while “worse than expected” has 0%, 3%, 5%, 25%, and 30% for these doses, respectively.
2.5. Phase III Design
Our approach focuses on the decision point between phase II and phase III. If the phase II results show that at least 1 dose is viable as defined in section 2.4, then a single dose with the highest utility is carried forward to 3 parallel phase III studies. The 3 phase III studies are described in Table 1. The envisaged phase III studies are nonadaptive, have equal allocation to all arms, and are assumed to start and run concurrently. Our sample size parameter for phase III is n3 patients per experimental arm in each of the studies. To explore sensitivity to the phase III sample size, we computed results for different sample sizes ranging from 200 to 600 per arm (phase III sample size will be denoted as n3).
Description of phase III studies.
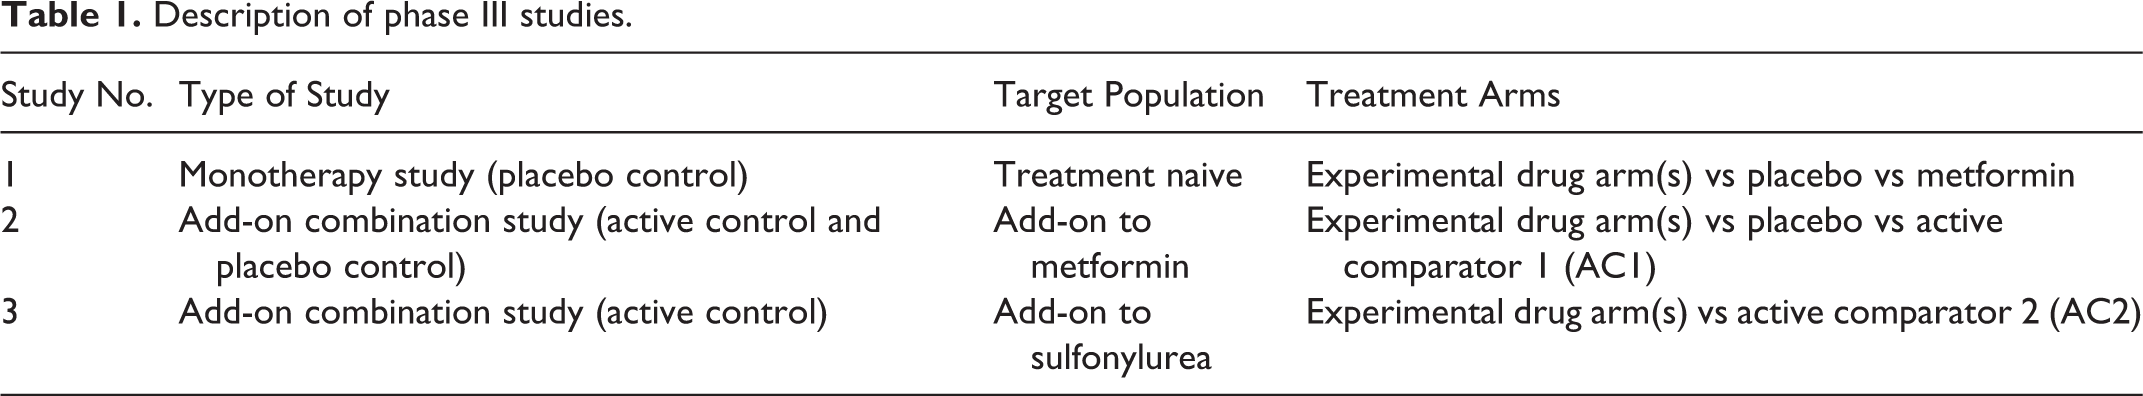
The predicted revenue is computed using a combination of the probabilities to achieve various degrees of success in the separate phase III studies, associated with the perceived market value of a drug achieving these goals. To start generating revenues, however, regulatory approval has to be achieved first. Because CV requirements have not been considered, we have only applied the following minimum regulatory approval criteria:
At least 2 trials have to demonstrate statistical significance for efficacy. One of these studies has to be study I , showing superiority versus the placebo.
Each indication—monotherapy, add-on to metformin, and add-on to sulphonylurea—is approved if the above condition is met and statistically significant superiority over the placebo or noninferiority versus the active control is shown in the trial for that indication.
For HbA1c, a noninferiority margin of 0.3 was applied.
Once the regulatory approval is accomplished, the product can begin generating revenues. The revenue function is not defined by a simple factorization of efficacy and safety end points as in the phase II clinical utility function. Rather, the interaction between safety and efficacy parameters is modeled in a more complex way. Specifically, we reduce the expected revenue of a drug with an increasing incidence of hypoglycemia differently, depending on whether the drug achieves the separate efficacy goals in the separate phase III studies. Maximum revenues of US$10 billion from demonstrating superiority to active control 1 (AC1), compared to only US$1 billion from noninferiority, and an additional US$3 billion from superiority to active control 2 (AC2), or US$1 billion from noninferiority, are scaled down by penalty factors as illustrated in Figure 2. Our commercial model assumes virtually no sales in the monotherapy market segment but additive sales from the add-on to sulphonylurea and add-on to metformin segments.
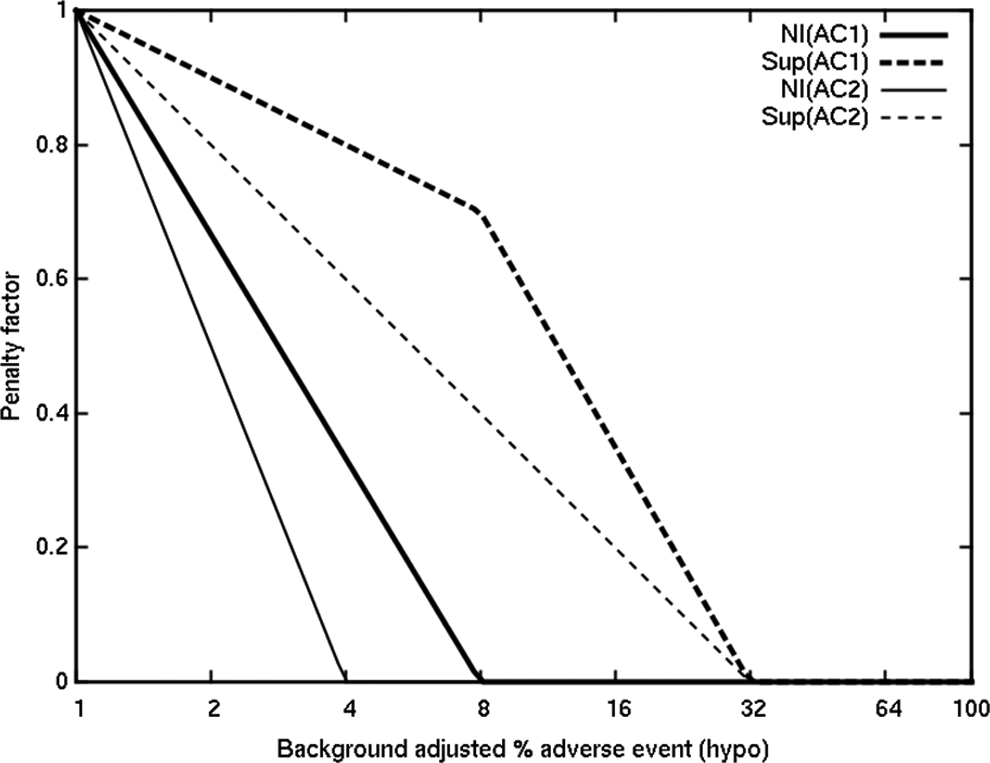
Expected revenue adjustments (fraction of maximum NPV) for different possible phase III outcomes.
The incidence of adverse events “p” is the placebo-adjusted probability that a patient will experience hypoglycemic episode(s), and a correction accounts for a background of 1% so that the x-axis in Figure 2 is S = 1 + 99p. Finally, the eNPV is computed, as a function of all these parameters, as expected revenue minus the costs associated with the trial programs. We do not account for the time to market (in terms of reducing patent exclusivity time), as we expect that a CV trial will be time limiting, nor do we discount the future revenue in future years. Furthermore, there is additional uncertainty when estimating revenue because of unknown future competition.
2.6. Cost
We model the phase II and III development costs crudely as a fixed sum of US$3 million plus US$10,000 per patient enrolled. Where the phase II results are evaluated as a failure and the program stops, the cost spent is US$1 million plus US$10,000 per patient enrolled in that phase.
2.7. Simulations
From each phase IIb design, the detailed results of 5000 separate simulated trials (with random variation in patient recruitment and responses) were carried forward into the computation of predicted revenue and hence eNPV for each of multiple scenarios of “true” dose response and dose safety profiles. Computed quantities relating to proportions of 5000 simulated trials should typically experience a simulation error less than 1%.
3. Results
As described in section 2, selected development options were compared on the probability that the design determined the dose with the maximum utility and on the eNPV of the product. It is evident from Figure 3 that the adaptive designs identify the maximum utility dose more often than the fixed design. For the 600 patient designs, the adaptive design correctly identifies this dose 87% of the time, whereas the fixed design identifies this dose 69% of the time. Figure 4 illustrates the additional patients who will be assigned to the highest utility doses using an adaptive design compared to a fixed design for 3 different scenarios.
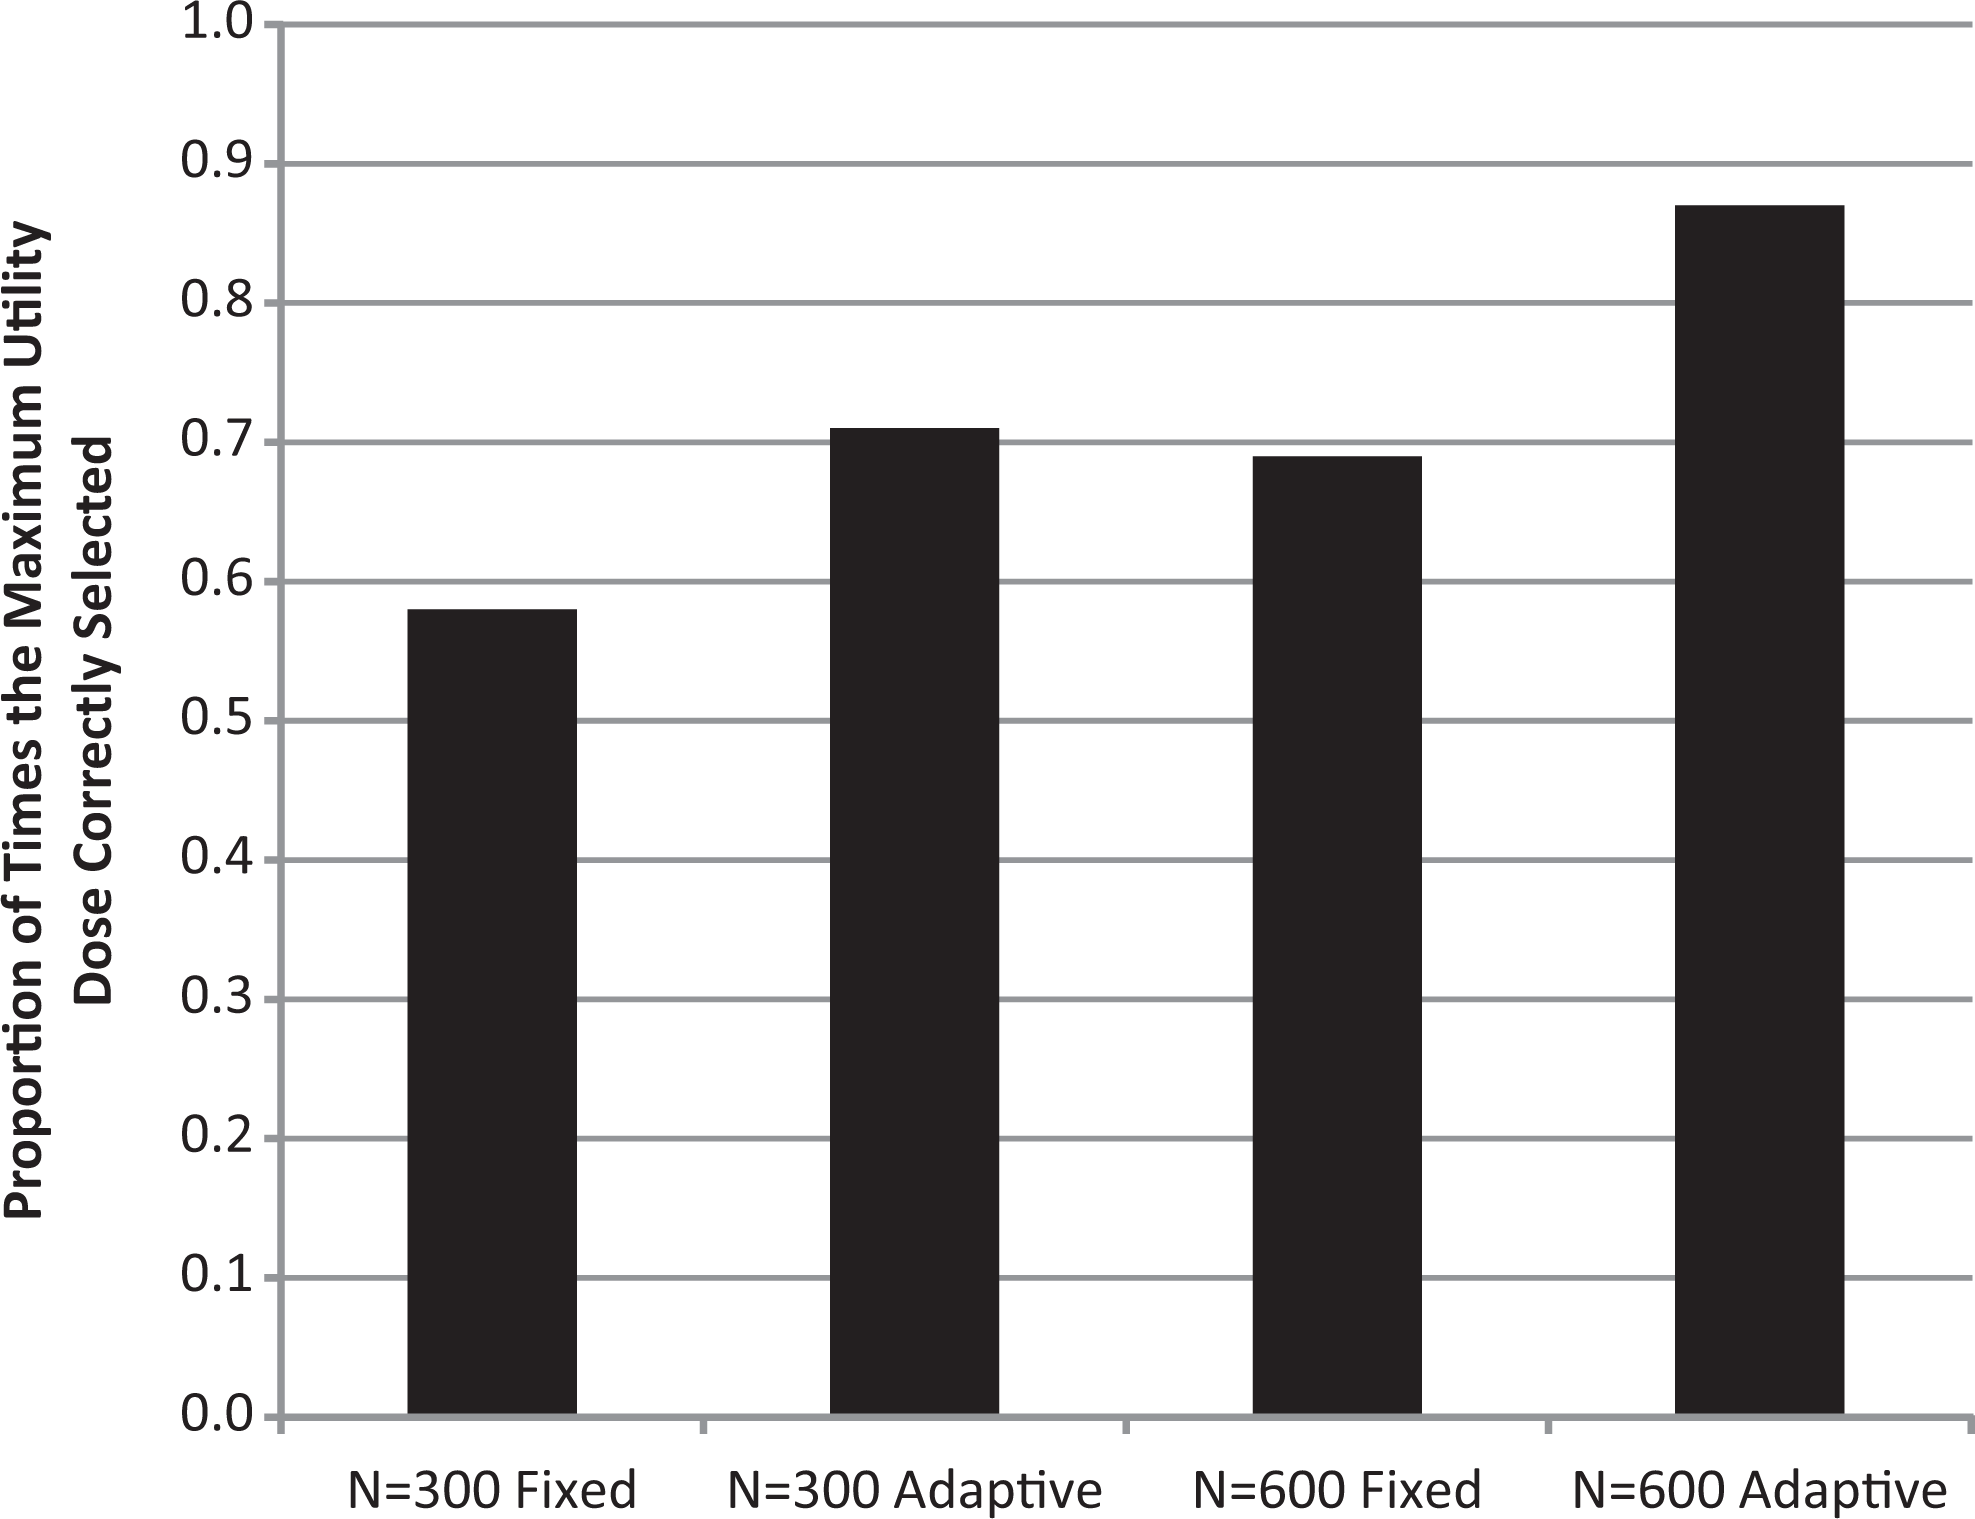
Proportion of times that the maximum utility dose is correctly identified for successful trials with the scenario where efficacy is better than expected and where the top 2 dose levels have high rates of hypoglycemic episodes.
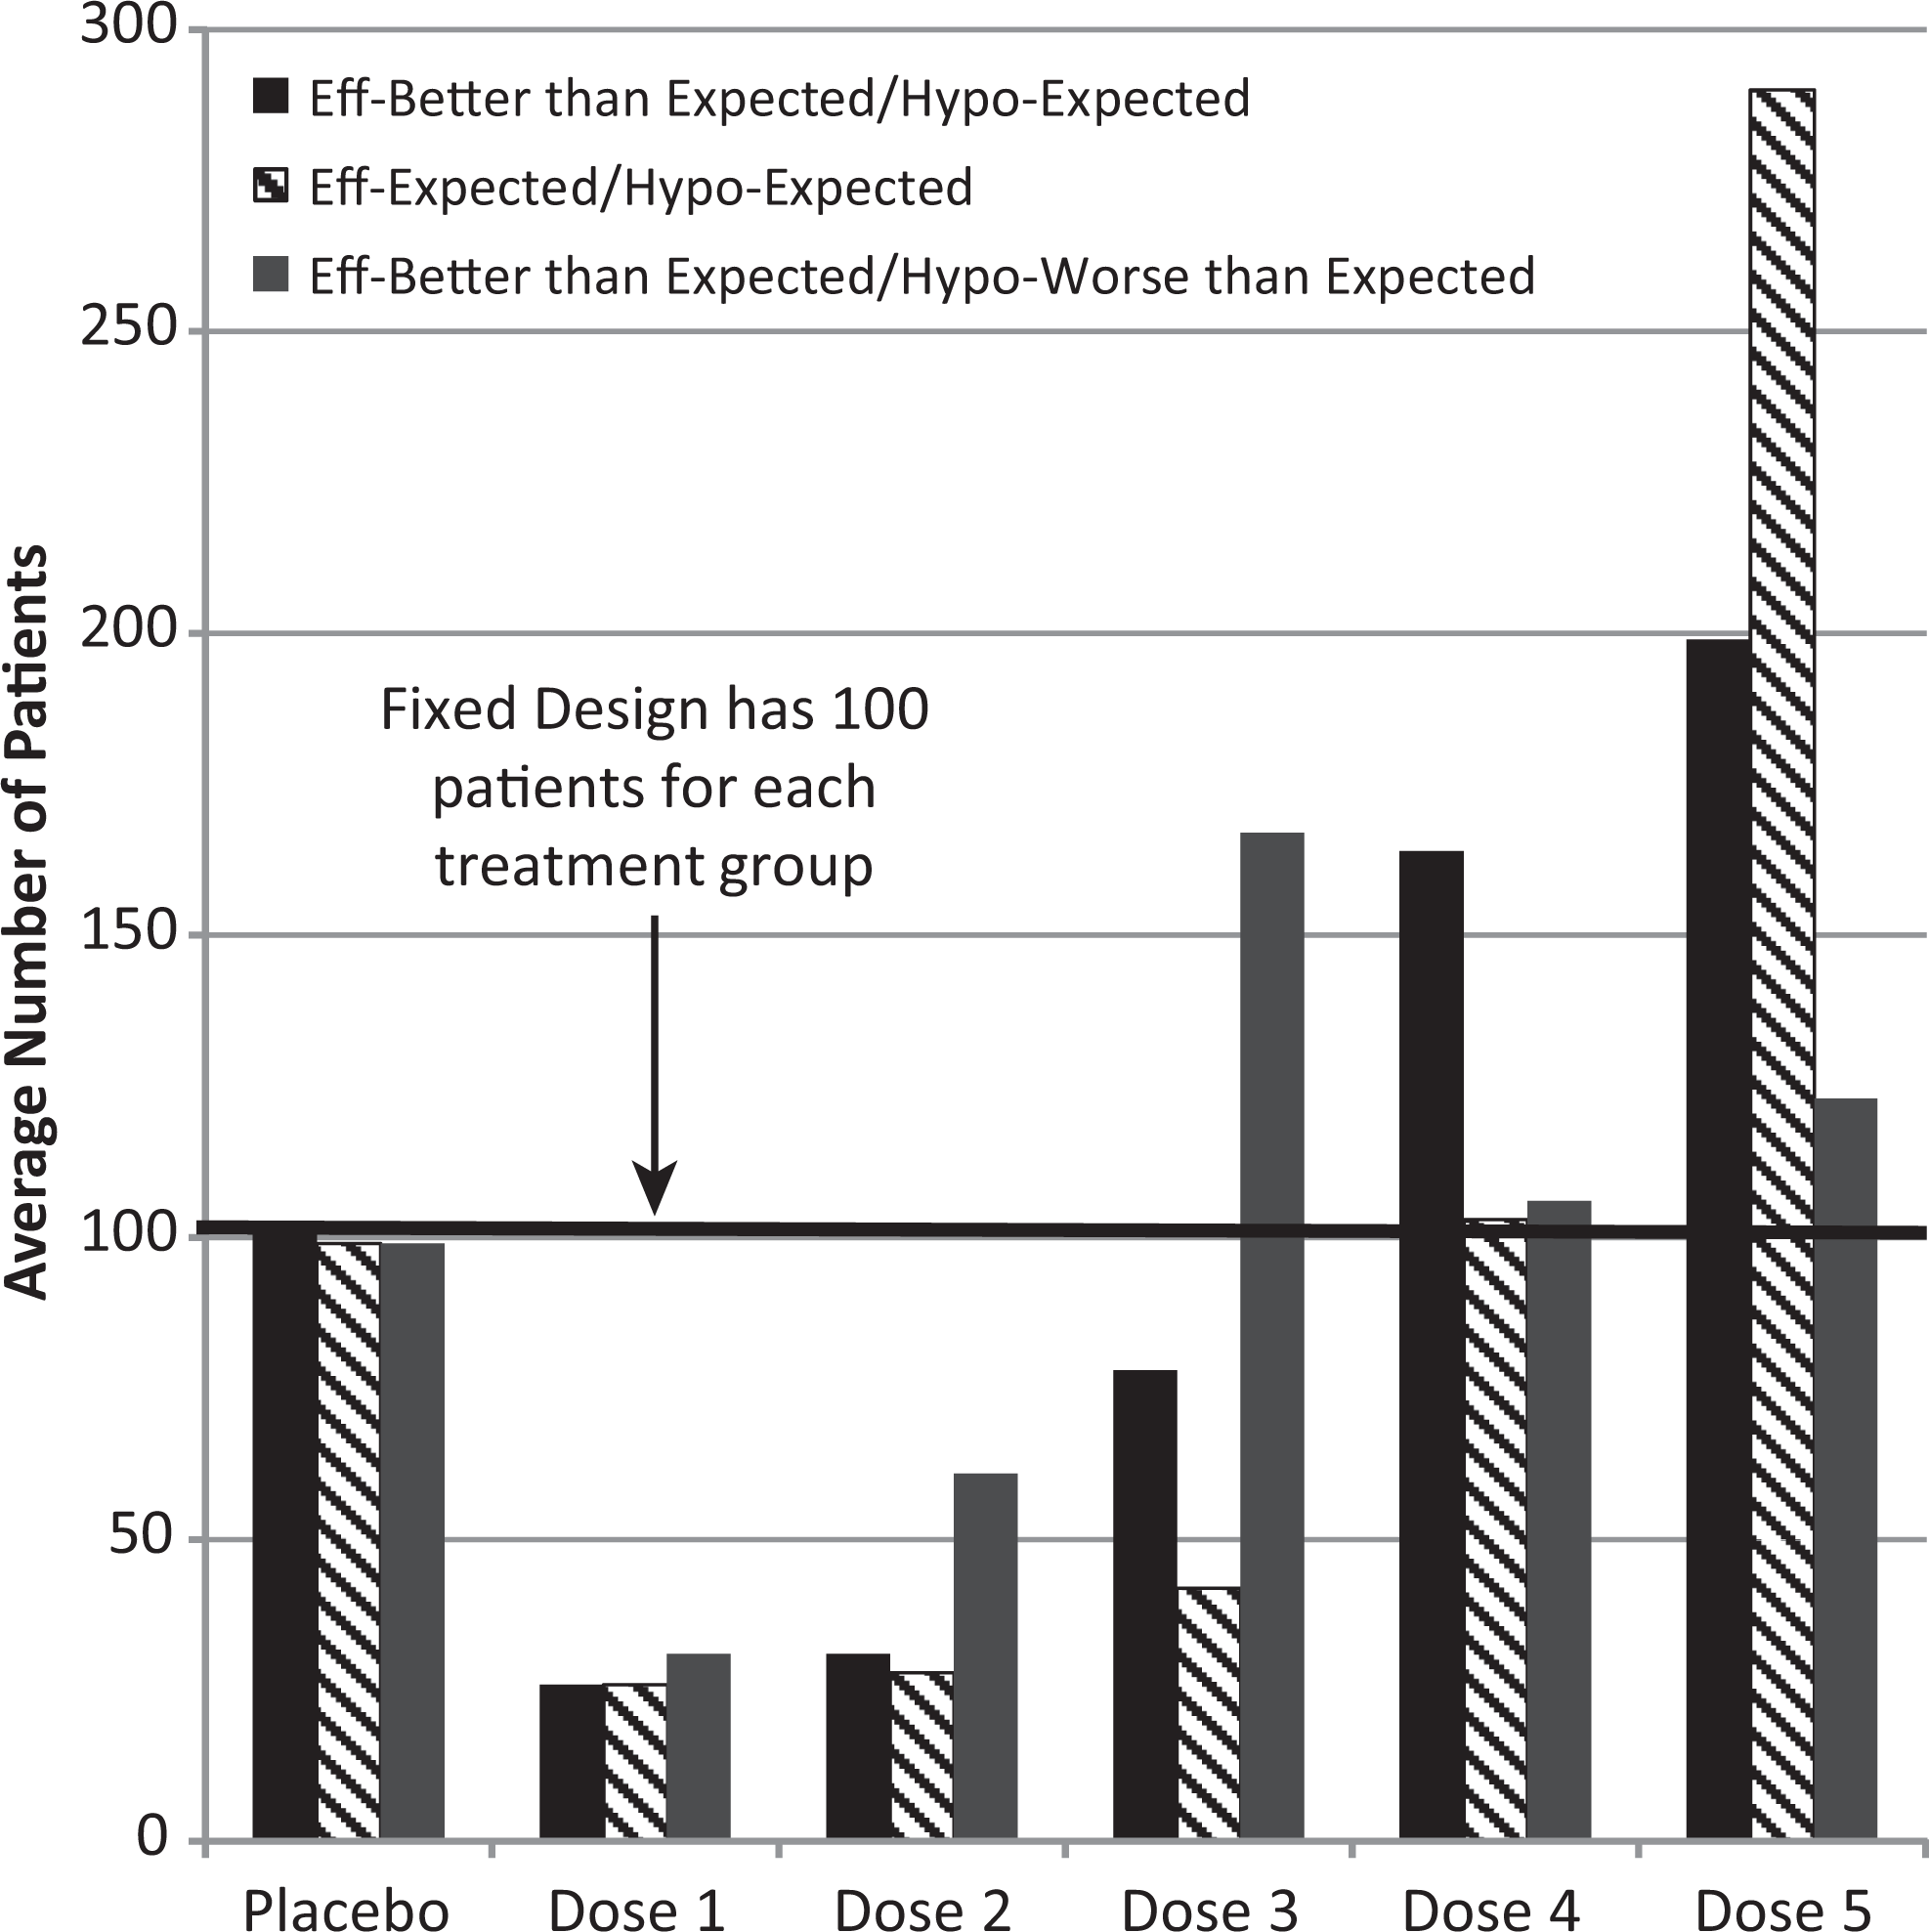
Average number of patients: fixed versus adaptive (12 weeks with 600 patients) for 3 different scenarios.
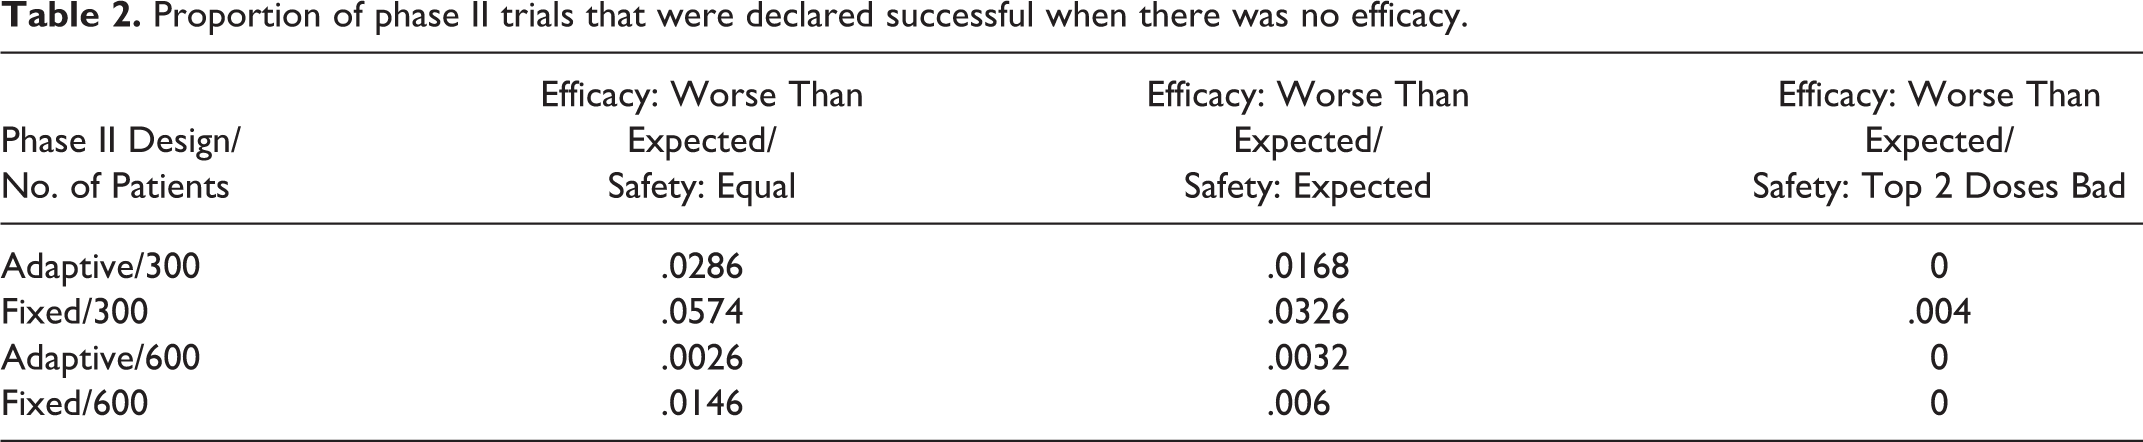
We also looked into the type I error for the phase II trial, which is in the proportion of phase II trials that were declared “successful” when there was no efficacy. Results displayed in Table 2 show that larger phase II trials perform better, and an adaptive design performs better than a fixed design, regardless of the assumed safety profile.
Proportion of phase II trials that were declared successful when there was no efficacy.
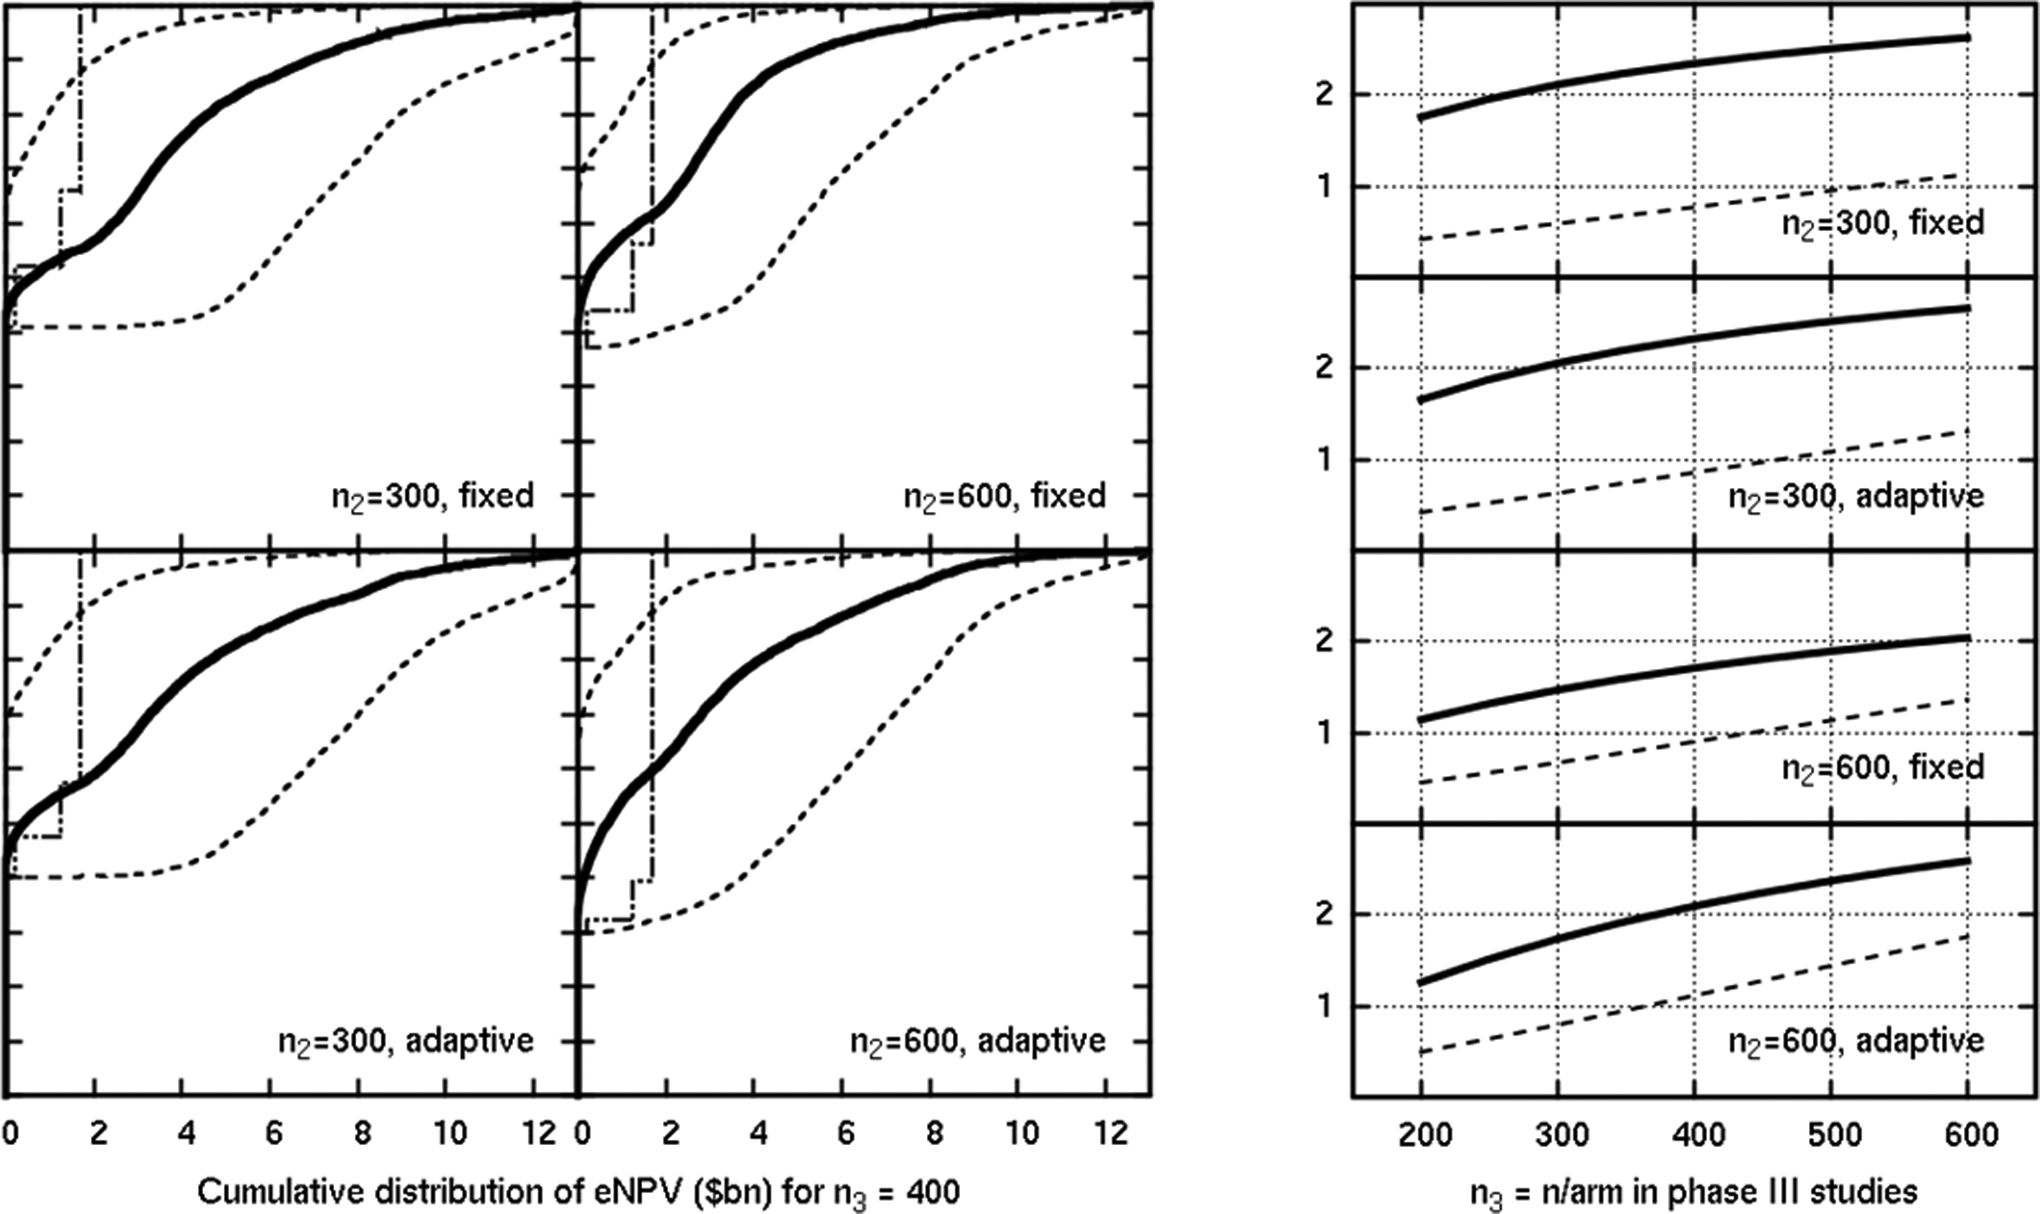
For each of 5000 simulations, we compared the eNPV predicted on the basis of the posterior mean efficacy and safety from the phase IIb trial—the observations on which decisions would be made before phase III—with the “true” eNPV of that selected dose, using the mean parameter values from which the phase II simulations were created. In such a comparison, it is important to realize that considerable uncertainty in the parameters remains before phase III. Therefore, as well as the central eNPV from the mean observed values, we computed typical “upper” and “lower” values roughly equivalent to ±1 standard deviation (SD) of the posterior distribution for each end point in the Bayesian phase II analysis. (Sometimes, the uncertainty in efficacy of the chosen dose and sometimes the uncertainty in its safety dominate; the uncertainty with greater effect is used independently in determining upper and lower values.) These are approximations rather than formal credibility intervals for the eNPV.
Figure 5 shows the distribution of the eNPV for the simulations in the scenario where both efficacy and safety were as expected. The 4 plots on the left are for n3 = 400 per arm. The plots correspond to 4 different phase II designs (varying total phase II sample size of n2 = 300 vs 600, and a fixed allocation vs a flexible adaptive GADA-type design). The central, prominent thick line is the eNPV prediction based on the mean observed efficacy and mean observed hypoglycemic probability. Thinner lines indicate how uncertain such a phase IIb–based prediction is by incorporating an upper and lower eNPV using the observed SD values in the phase IIb posteriors. The equivalent of ±1 SD is shown. On the corresponding plot on the right, the thick solid lines show the dependence of the mean predicted value on the phase III sample size. Thus, each value shown on the right at x = 400 corresponds to the mean of the cumulative distribution in each relevant left plot. The solid line corresponds to the estimated eNPV, and the dashed line is the true eNPV.
Results of a scenario where efficacy and safety were as expected. The y-axis is the eNPV in US$ billion in the plots on the right, which show the mean estimated (solid) and mean true (dashed) eNPV.
On the plots on the left, there are stepping dashed lines corresponding to the true eNPVs from the simulated means for each dose. The steps represent different dose selections made for phase III (for successful phase IIb trials; failed trials generate no revenue). The vertical position of the step shows for each phase IIb design the proportion of the simulated trials selected that dose. The plots on the right show the dependence of the mean of the true eNPV (the average of the stepped line weighted by the proportions of trials selecting the particular dose) on the phase III sample size. The difference between the predicted and true lines represents the overall bias inherent in making a go/no-go decision based on the relatively small volume of phase IIb data. The magnitude of the bias depends on the phase IIb design. This bias should be borne in mind when comparing the predicted eNPVs from observed estimates: phase IIb designs may show high eNPVs either because they correctly select a more valuable dose or because they overestimate the value of the dose they have selected.
We see a sizeable fraction of the simulations ending in phase IIb failure or very little predicted power to generate revenue, even if they continue to phase III. In our example, the potential revenue (billions) dwarfs the variable costs (tens of millions) so these plots are truncated at zero eNPV rather than trying to highlight the different cost of a phase IIb versus a phase III failure. However, saving tens of millions of dollars by preventing a phase III failure is a very real concern in practice. Therefore, careful evaluation of potential revenue relative to the probability of a successful viable dose in phase II is critical.
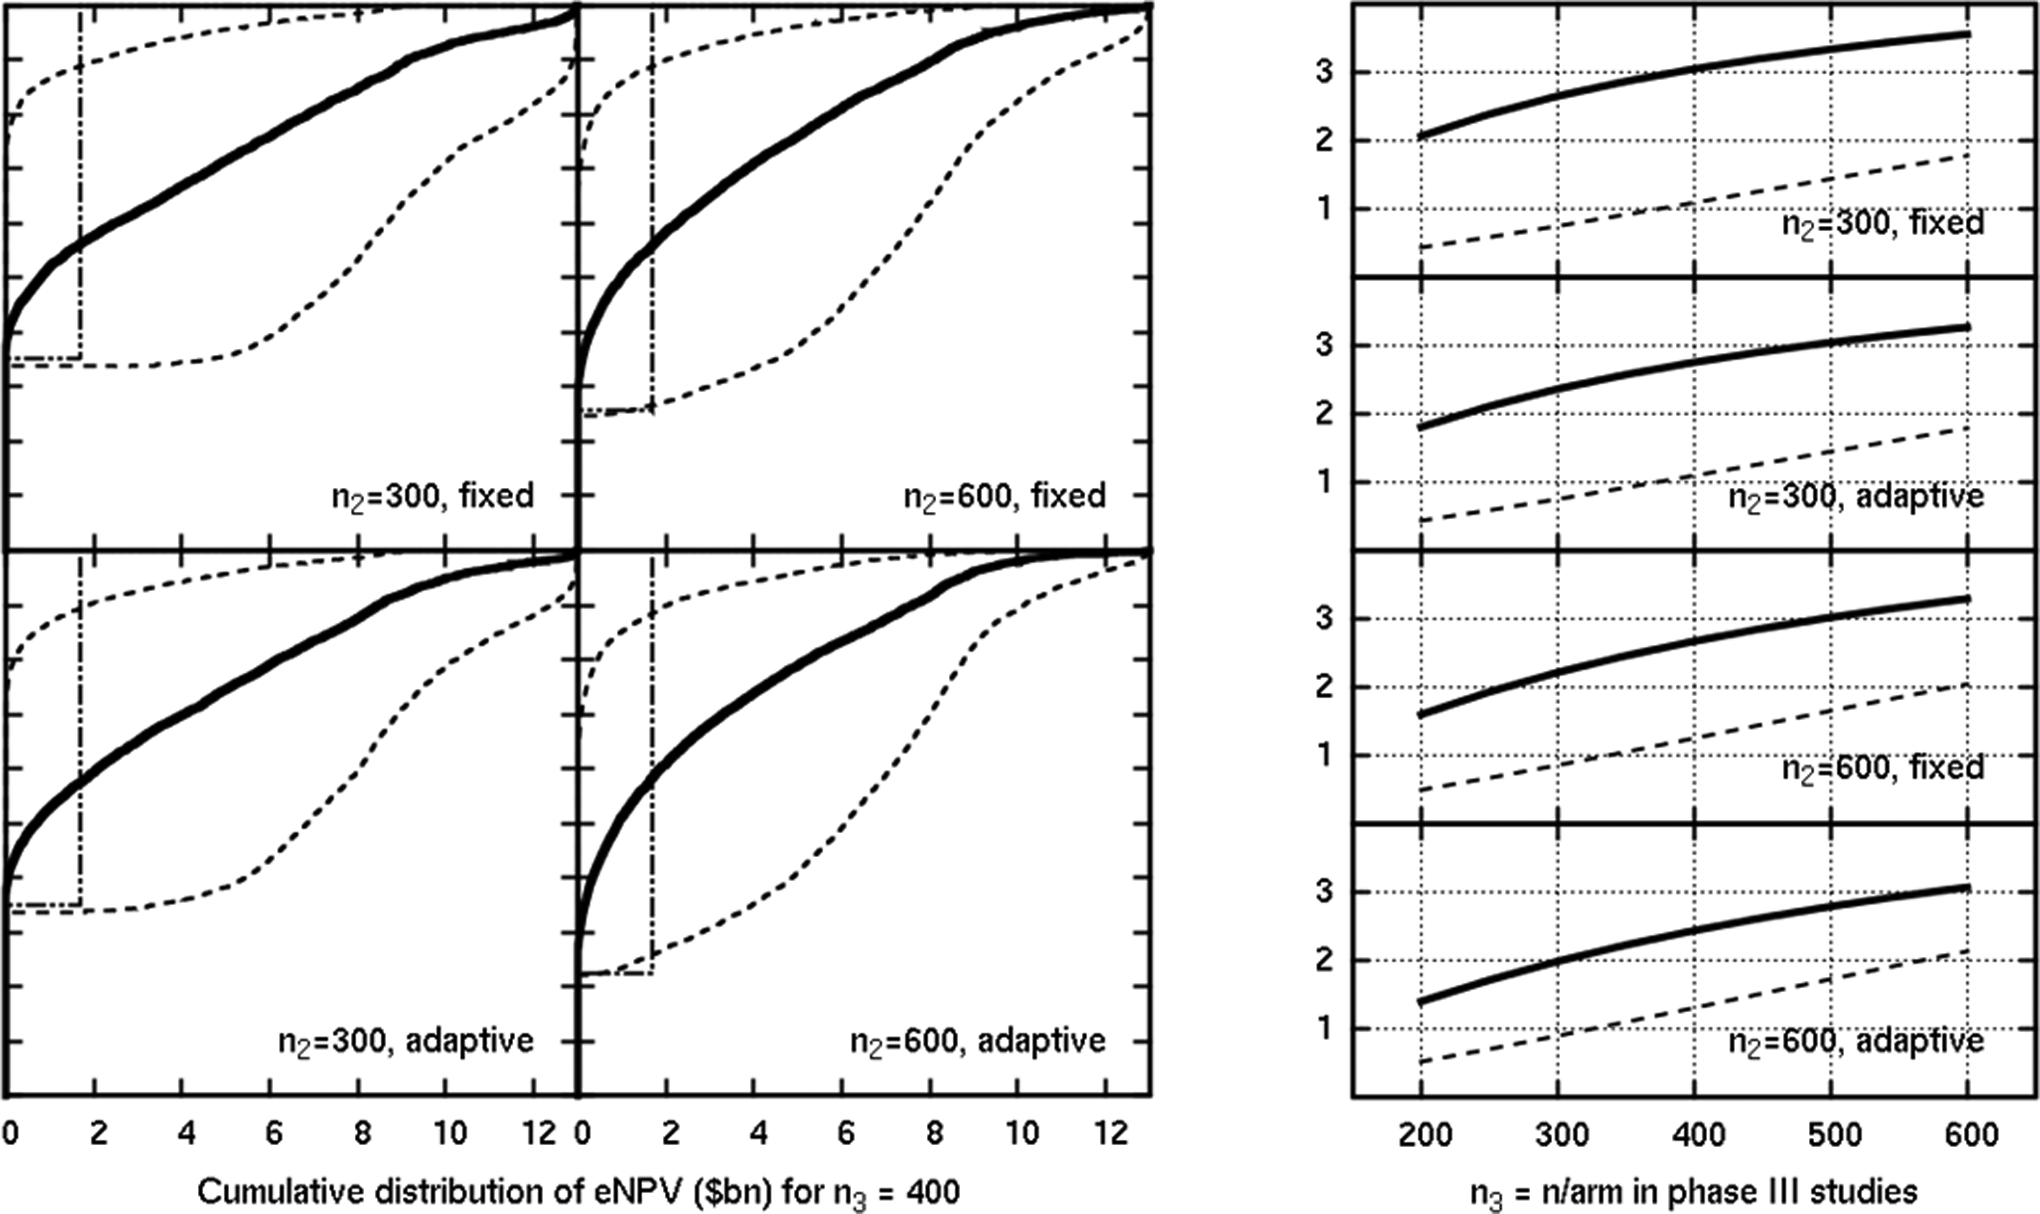
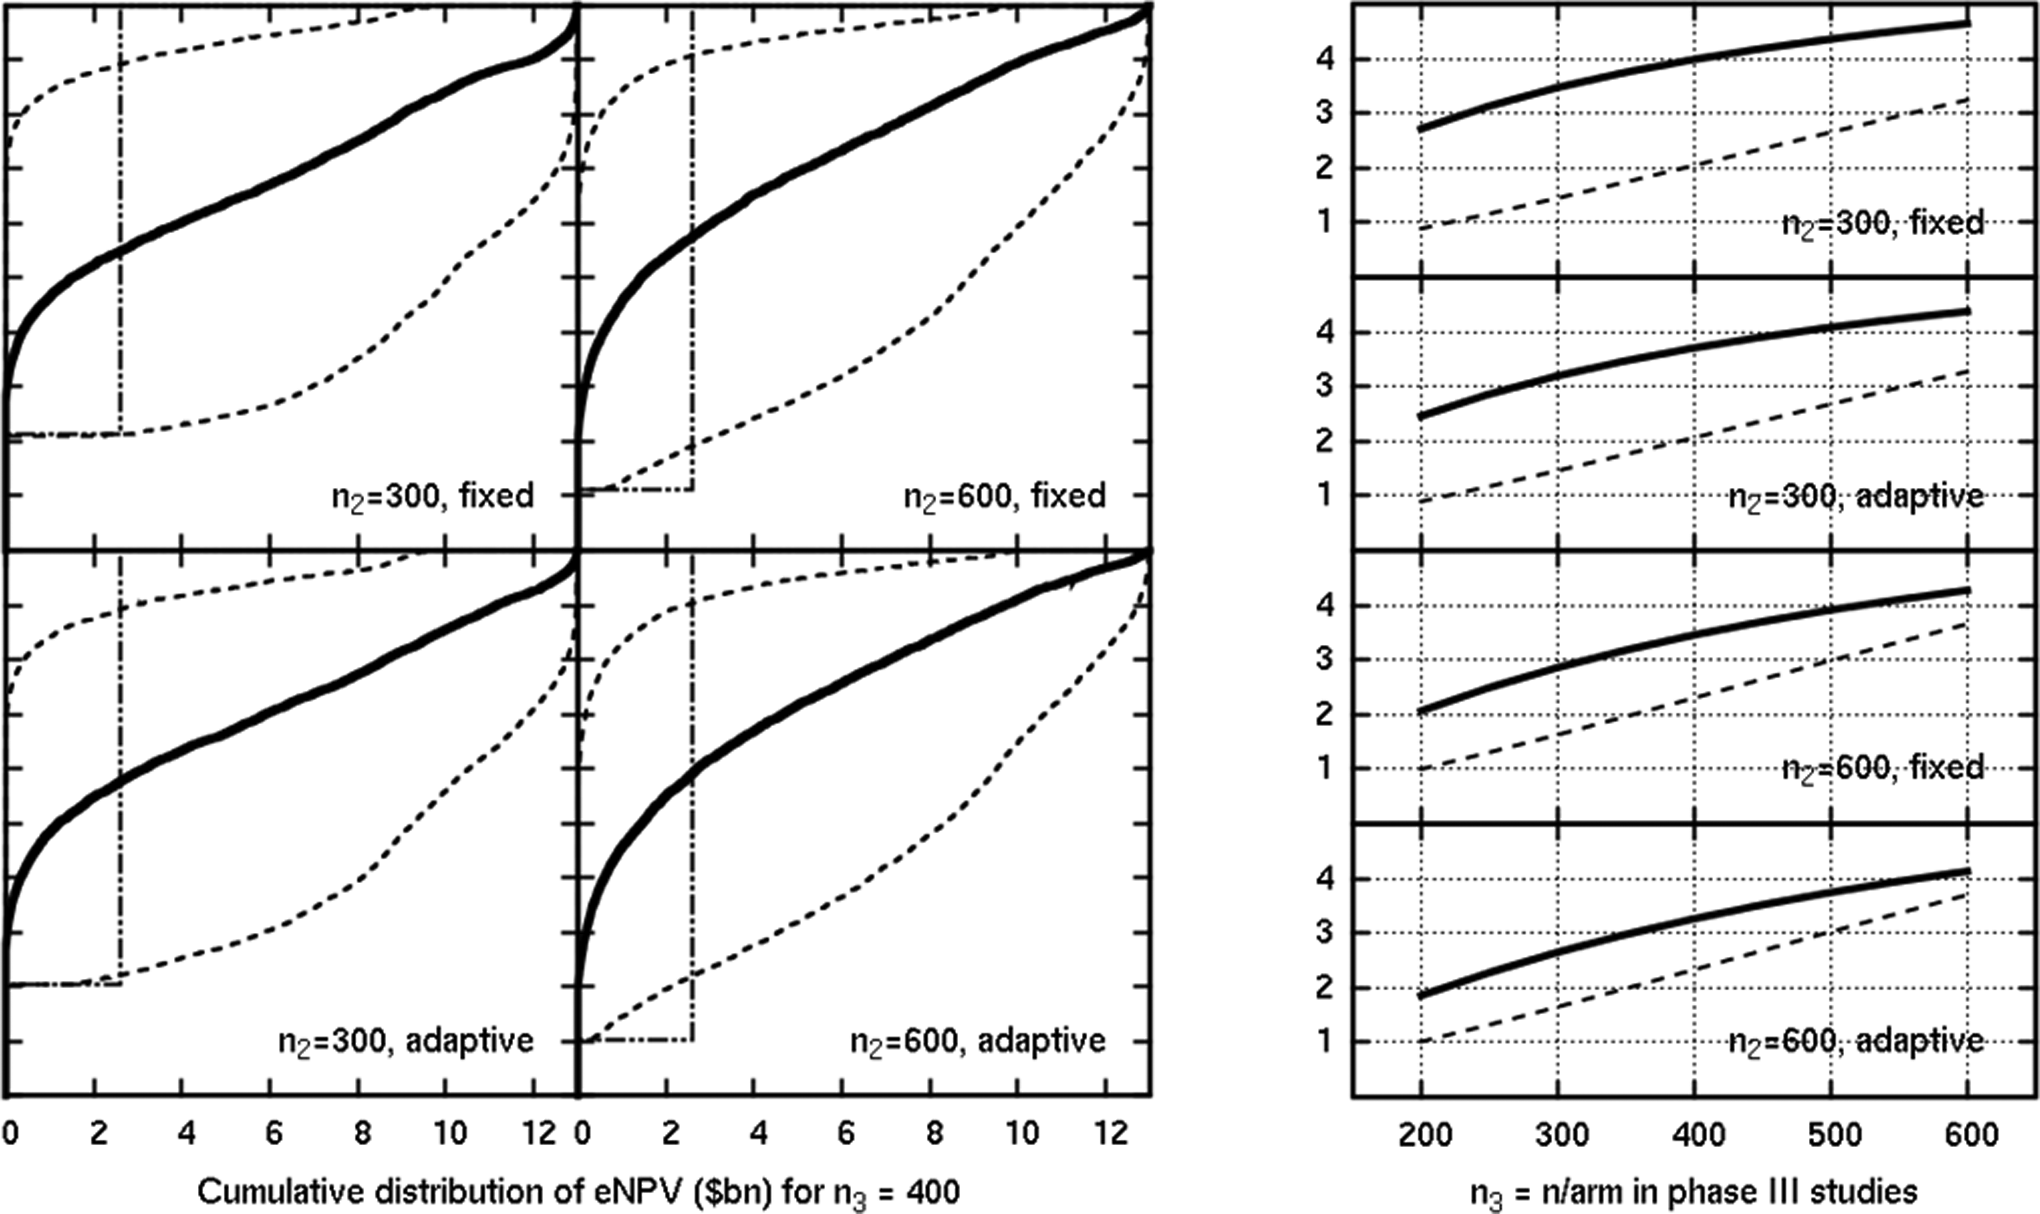
The results of a more efficacious scenario are shown in Figure 6. Here, the safety parameter is as expected, but the efficacy is better than expected. The 3 highest doses are all potential revenue-earning selections for phase III, with either of the top 2 doses earning in excess of US$8 billion because of higher power to beat the comparators in phase III studies; the designs correctly ignore the middle dose, which has “only” a US$2.6 billion value in comparison. As would be expected, there are few failures in such a positive situation. All 4 phase IIb designs perform well here, the most evident feature being a reduction in uncertainty with a greater phase IIb sample size.
Results of a scenario where efficacy was better than expected, but safety was as expected. The y-axis is the eNPV in US$ billion in the plots on the right, which show the mean estimated (solid) and mean true (dashed) eNPV.
To show the effect of a more serious hypoglycemic profile, we show in Figure 7 a scenario combining high efficacy with worse than expected safety. Selection of the top 2 doses is heavily penalized because of their poor hypoglycemic profile, so the aim of the development program is to identify the middle (third highest) dose, which still has a potential to earn up to US$2 billion. Here, about half of the programs succeed; the true values (dashed lines on the right) show that the larger phase II designs and the adaptive designs have the advantage.
Results in a scenario where efficacy was better than expected, but safety was poor for the top 2 doses. The y-axis is the eNPV in US$ billion in the plots on the right, which show the mean estimated (solid) and mean true (dashed) eNPV.
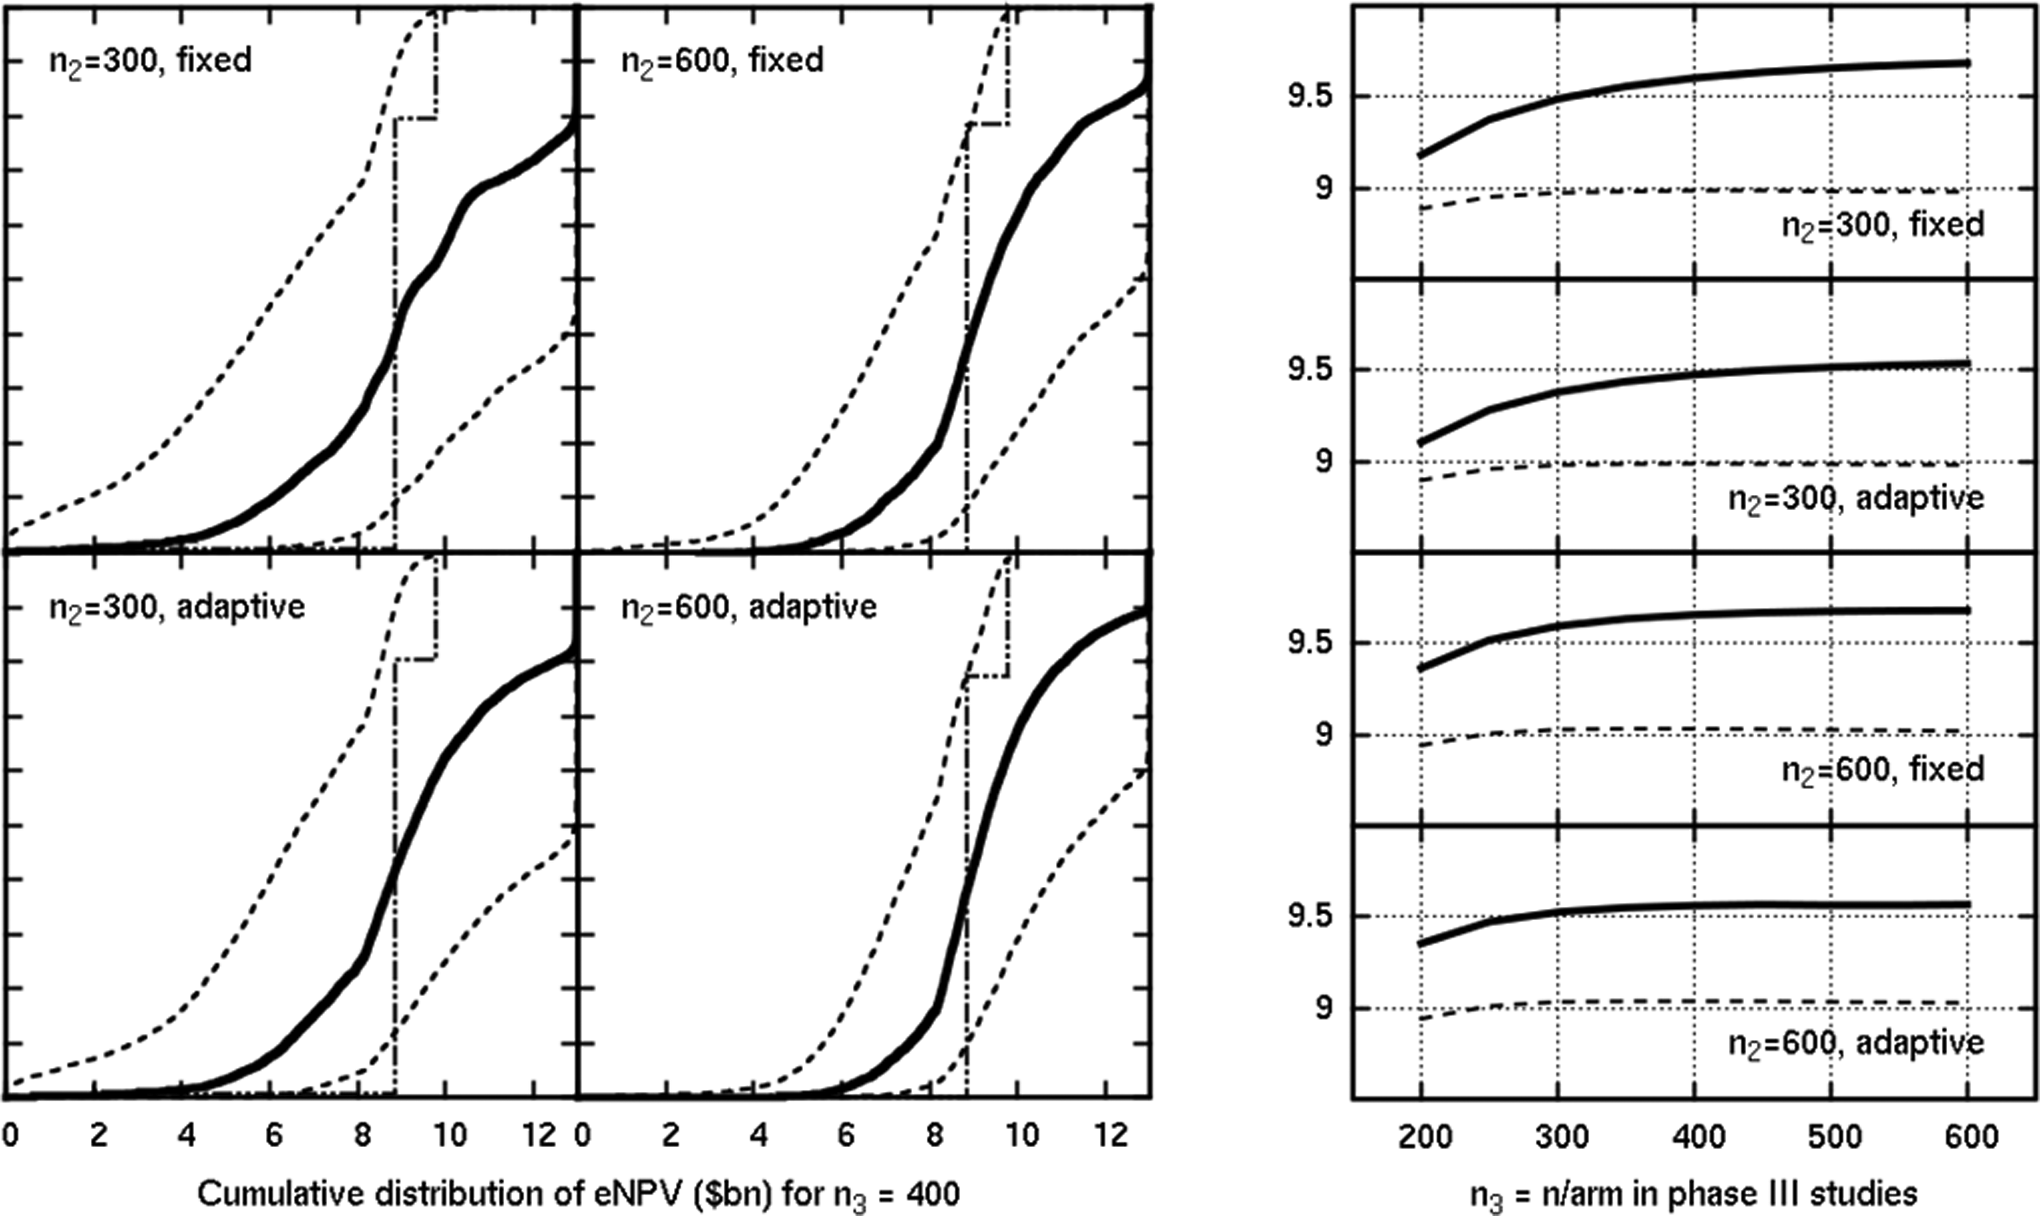
Finally, we show a better hypoglycemic profile, with an equal probability of events compared to the placebo, combined with the expected efficacy profile, in Figure 8. We see the true and estimated eNPVs continuing to rise with the phase III sample size for sizes as great as 600 per arm. This reflects an efficacy scenario where the increase in the PoS still outweighs the extra costs of the larger phase III trials.
Results in a scenario where efficacy was as expected, but safety was better than expected (equal with placebo). The y-axis is the eNPV in US$ billion in the plots on the right, which show the mean estimated (solid) and mean true (dashed) eNPV.
Clearly, it would be possible to perform a detailed comparison of the trade-off between phase II and phase III sample size using these techniques, but such analyses may be dominated by the assumption of the potential revenue associated with particular outcomes, which here dwarfs the development cost. We also comment that an analysis of simulation outputs based on marginal changes in the eNPV (resulting from an increase of correct dose selection in a small percentage of trials) may depend on a subset of the total number of simulations, and care must be taken to include sufficient simulations in the analysis.
4. Discussion
4.1. Findings
Comparison of our efficacy utility function with the eNPV computation is informative. The revenue function accounts for the problem that a middle-efficacy drug is in practice, penalized by a low power to obtain good results in phase III, even if, were that drug to be approved should it succeed at phase III, the true efficacy could be beneficial to society. Assessing multiple doses or treatments using a utility function, multiple stakeholders must be included in the prespecification of a suitable function. In Figure 9, we show a contour plot of the utility function and the eNPV function (for n3 = 400, a choice that would have to be made in advance of phase IIb if that function is intended for dose selection). While the general shape agrees in the central areas, there is a region where the functions disagree. We found that, when comparing like with like, the more sophisticated phase IIb study designs (larger, or incorporating adaptive allocation) made better stop/go decisions and dose selections, leading to a greater eNPV. This would not necessarily be the case if the utility function specified from a clinical basis were inadequately aligned with a PoS-motivated eNPV function.
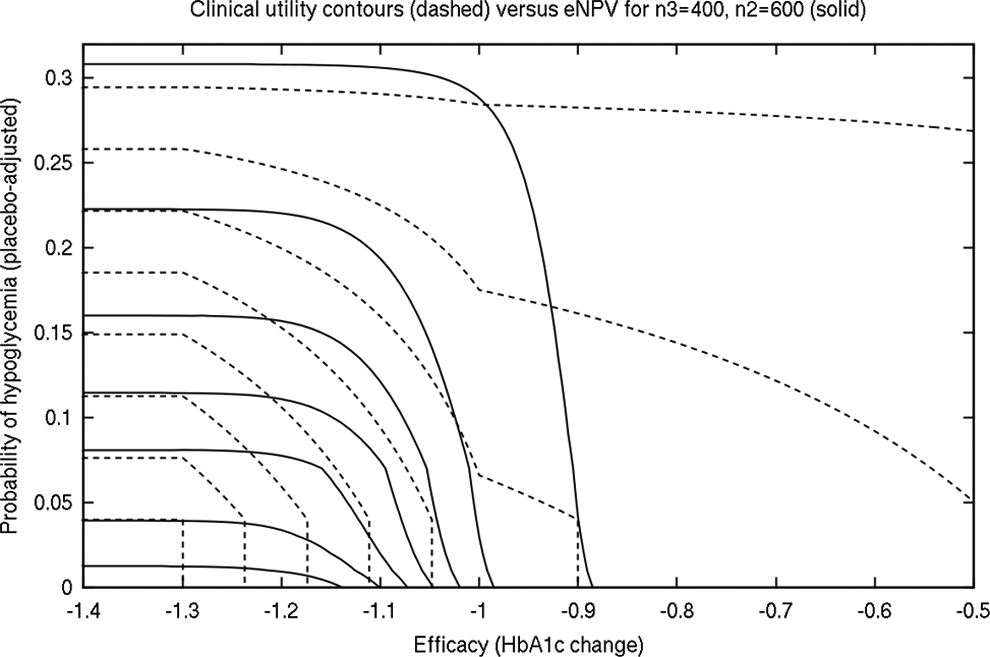
Contour plot of utility versus eNPV for n2 = 600 total and n3 = 400 per arm.
Larger phase III trials were associated with an improvement in the eNPV. This comes from better power for comparisons over active controls. Achieving active control–related milestones increases expected revenues for a relatively small increase in costs. As previously explained, we assumed a fixed time of development when calculating revenues. The length of phase III trials would most likely not have an impact on the length of product development anyway, as they would most likely be conducted in parallel with the longer CV outcomes trial.
4.2. Utility Functions
The history of quantitative utility goes back to the 18th century and the work of Bernoulli. 15 The idea is to support decision making by selecting options that maximize the prespecified desired utility. What is different with maximizing utility from maximizing the mathematical expectation is that utility functions represent one’s personal preferences, or “moral expectations,” to use Bernoulli’s terminology, which is very applicable to drug development.
The application of utility functions has recently gained a lot of popularity in drug development, particularly for dose selection. 16 , 17 One challenge associated with the application of utility functions in drug development, however, is a presence of numerous stakeholders. Regulatory agencies, medical practitioners, industry decision makers, and patients all have their views on what may be the optimal utility of a product. Because the primary interest in a medical field, including the pharmaceutical industry, is to serve a patient, in an ideal world, patients’ utility would be highly correlated with regulatory requirements and commercial expectations. Until that is the case, one has to be clear that their dose selection criteria are consistent with their objectives. In this work, however, our intention was to mimic a typical development process in which the utility function is specified by a clinical team, while expected revenues are projected by a commercial development team.
To explore the tension between the clinical utility function and our eNPV function further, we also simulated the development program with a purely eNPV-based rule being applied at the end of phase II for dose selection. For successful phase II simulated trials, rather than selecting the dose with the maximum utility as in the previous results in this paper, we selected instead the dose that had the maximum apparent eNPV based on the trial’s observed HbA1c efficacy and observed hypoglycemic profile. In the majority of the scenarios we simulated, the impact of this alternative selection rule was not large; however, in 2 scenarios, we saw noteworthy differences. The results of this alternative calculation are shown in Figures 10 and 11, corresponding respectively to the scenario with better than expected efficacy and expected safety and the scenario with better than expected efficacy but worse than expected safety profile. Figures 10 and 11 contain on the right the same plot as in the corresponding Figures 6 and 7 for the original selection rule (utility), with a new plot on the left showing the mean observed and true eNPV if the dose selection is based on the eNPV rule.
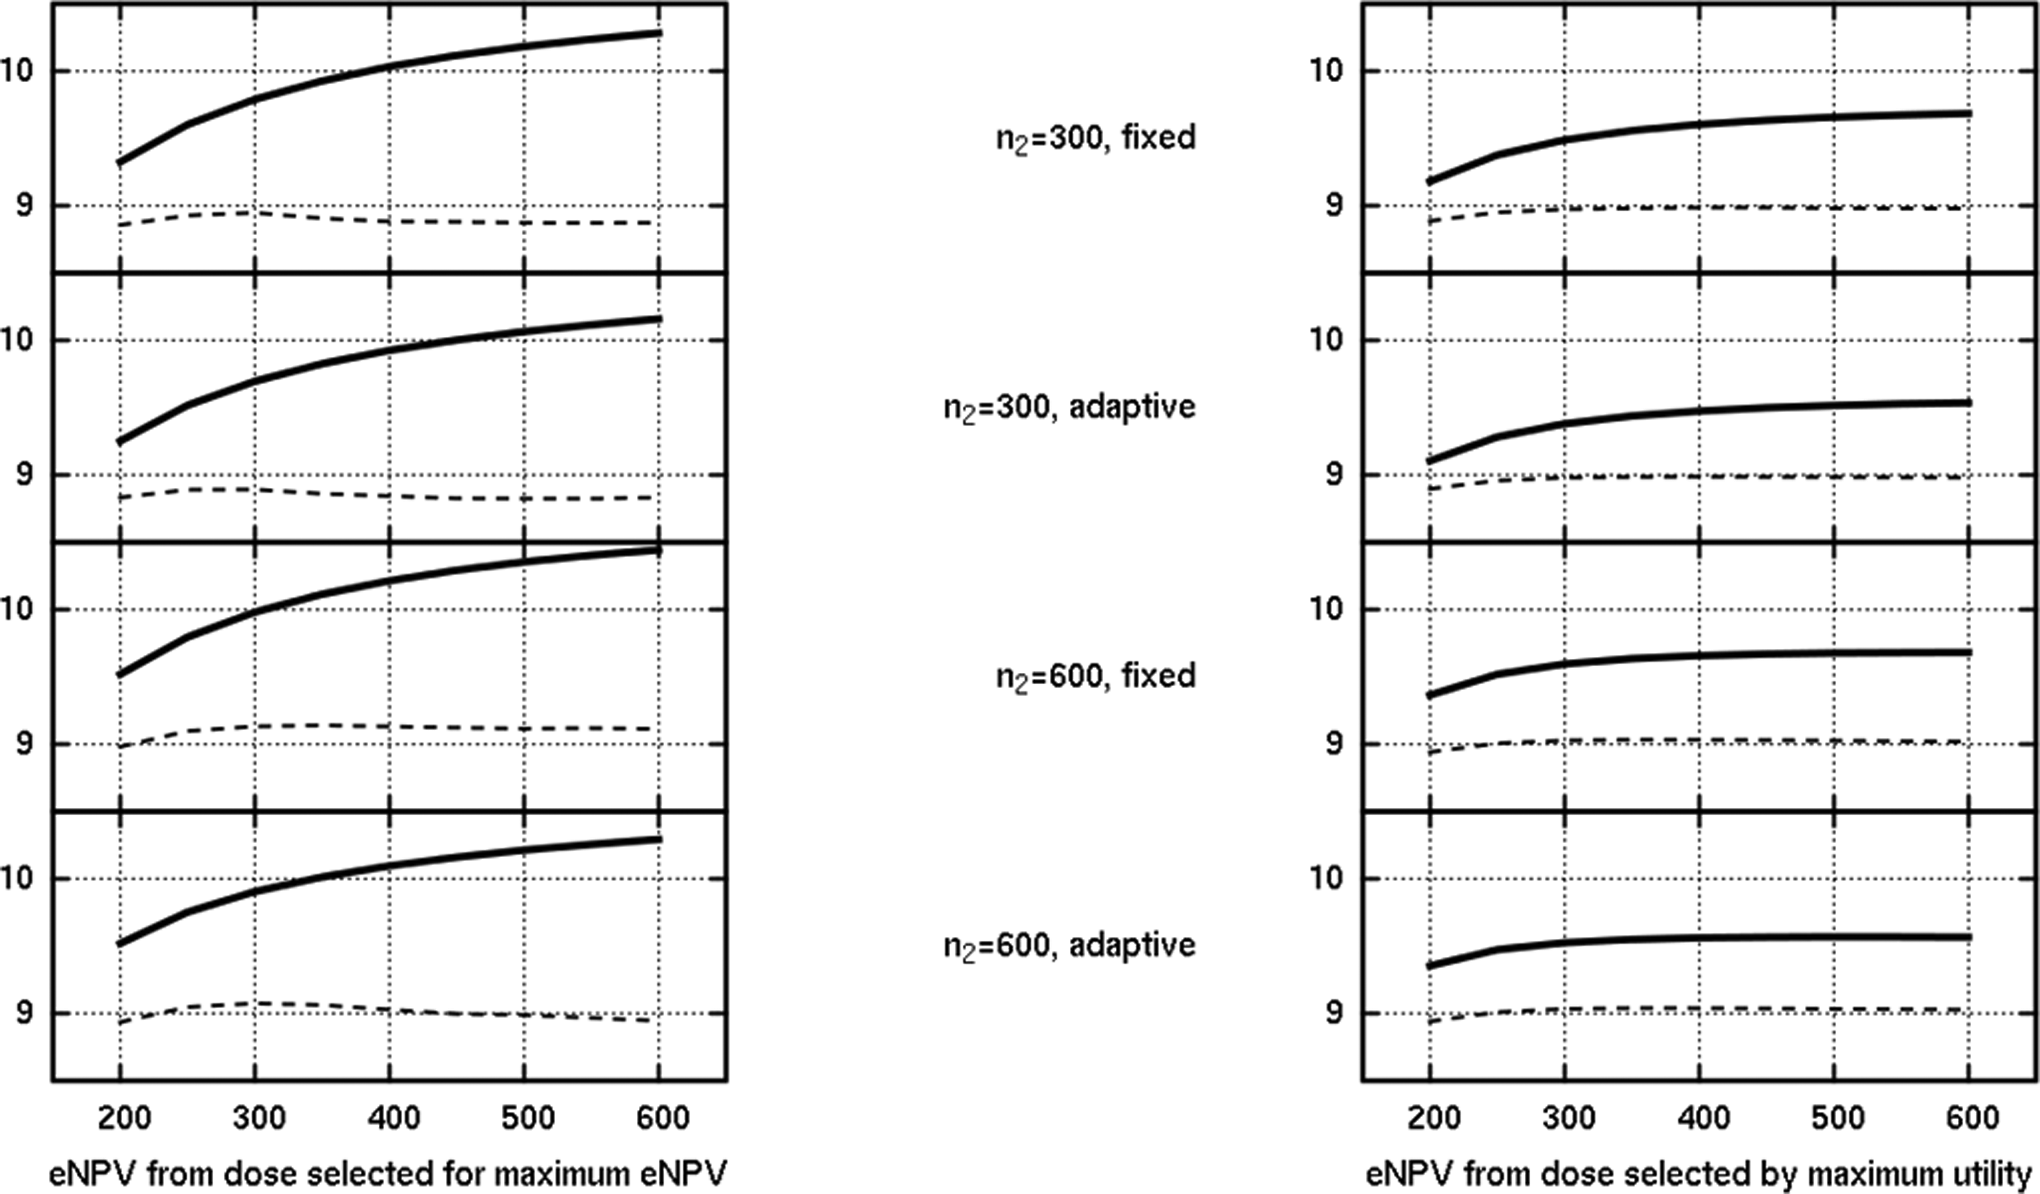
Comparison of the dose selection rule in a scenario where efficacy was better than expected, but safety was as expected. The y-axis is the eNPV in US$ billion, showing the mean estimated (solid) and mean true (dashed) eNPV.
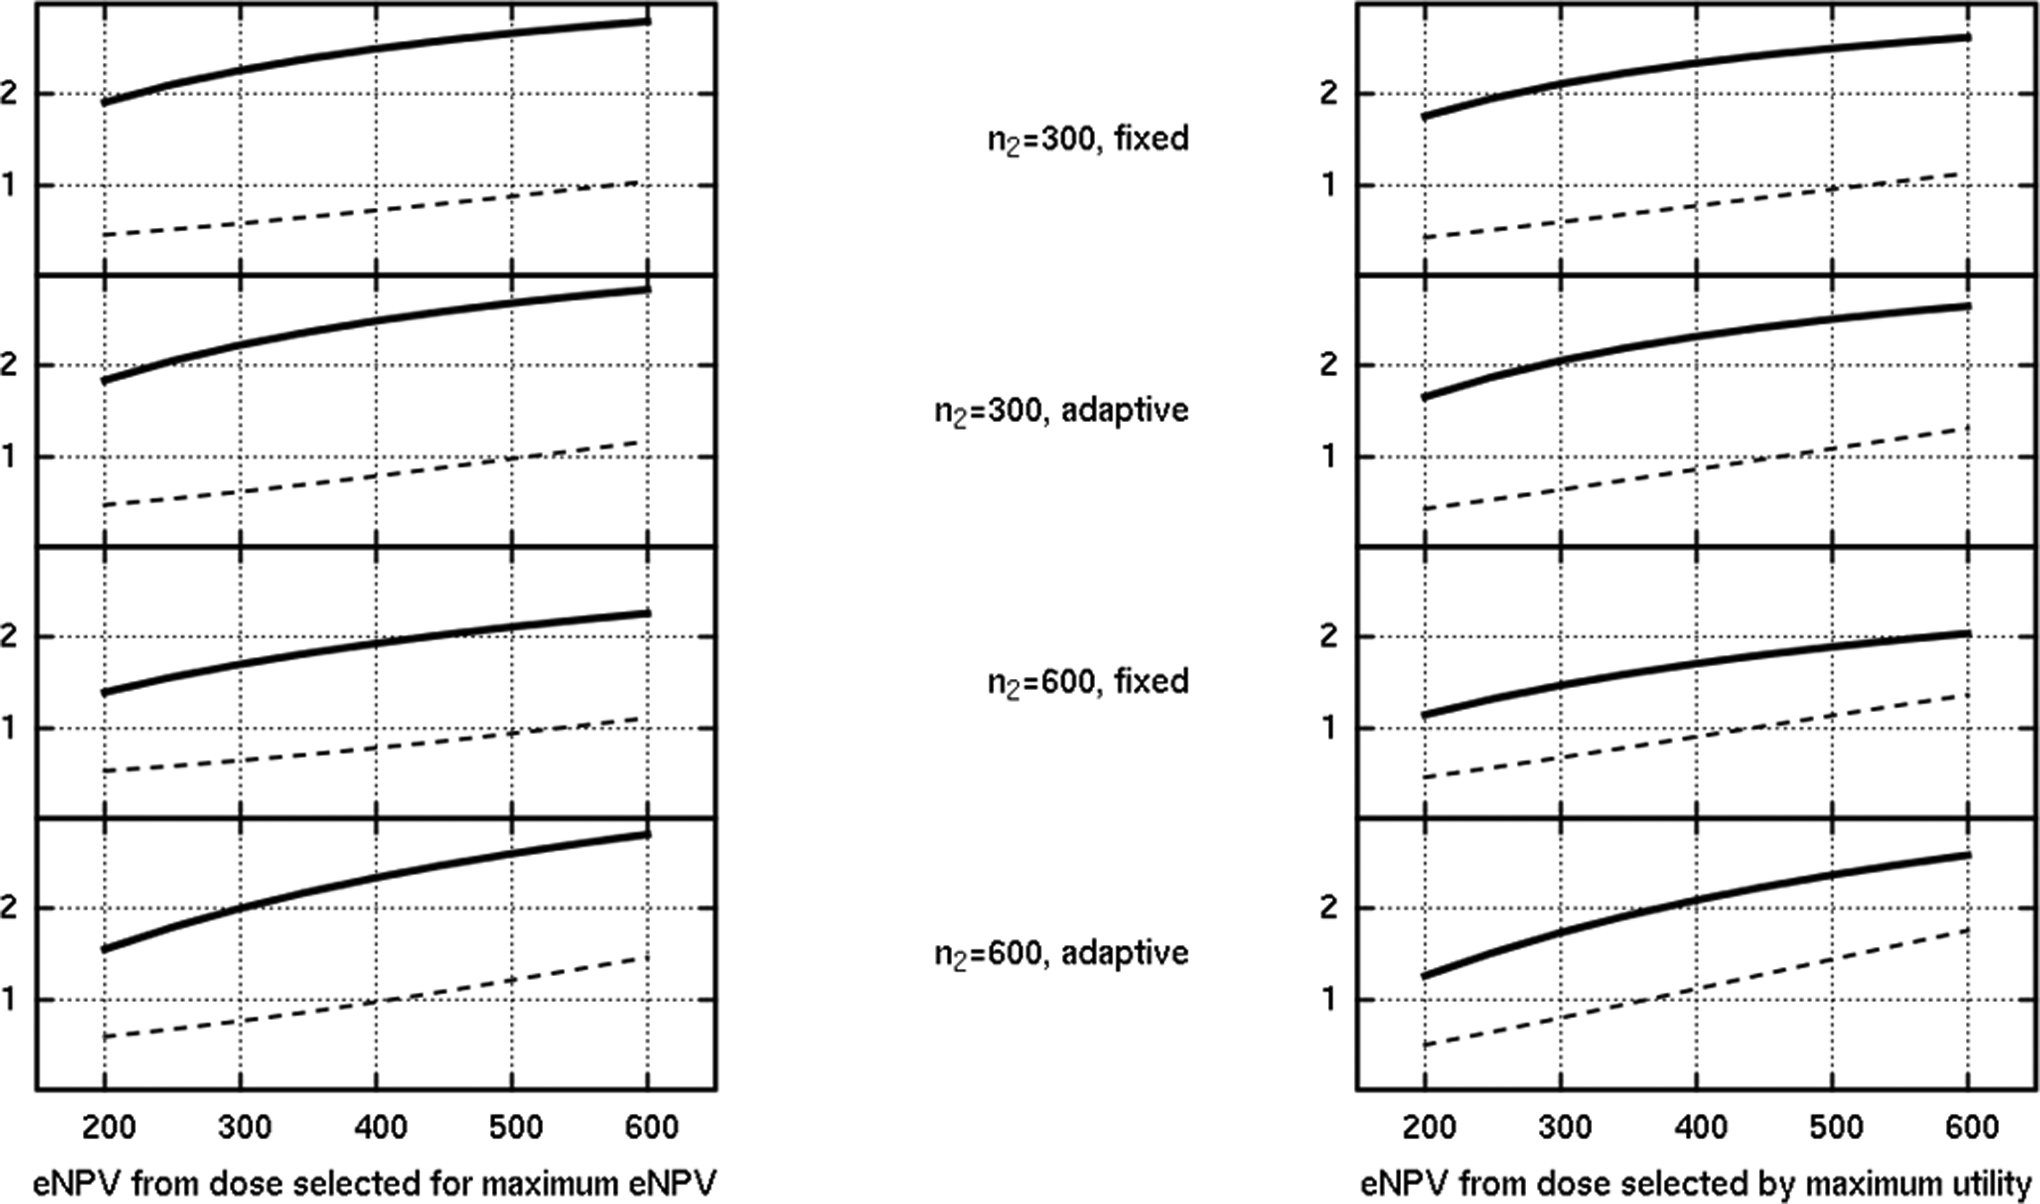
Comparison of the dose selection rule in a scenario where efficacy was better than expected, but safety was poor for the top 2 doses. The y-axis is the eNPV in US$ billion, showing the mean estimated (solid) and mean true (dashed) eNPV.
Consider first Figure 10, which shows the mean observed and true eNPV according to this new selection rule, for the optimistic scenario originally featured in Figure 6. Note that in the case of the adaptive designs, the adaptive algorithm was still itself focused on seeking the dose with the maximum utility, but at the end of phase II, the dose with an apparent maximum eNPV was taken to phase III if the trial was judged a success (by the original criterion). As one might anticipate, the solid line shows a higher mean observed eNPV for the new rule (left plot); it is precisely that which is driving selection, so where there is disagreement on the dose selection, the new rule achieves a greater observed eNPV. However, the dashed line is especially interesting. This represents the mean of the true eNPV that is computed for the chosen dose. In this case, surprisingly, the disagreement on the selection, based on observed (biased) values, actually results in a slightly lower true eNPV on average for some of the designs. Because the dose selection through the eNPV is predicated on the phase III sample size, the incidence of disagreement between that and the maximum utility rule depends on n3 and varied between about 12% and 45% for this scenario. Sometimes, the eNPV rule favored a higher dose, sometimes a lower one, and the presence of 2 doses with very similar true eNPVs (see the vertical stepping line in Figure 6) means the eNPV rule based on observed trial data can be vulnerable to preferring the “wrong” one, bearing in mind that the effect of bias in the 2 end points may be asymmetric on the derived combination values.
The effects discussed are also present in Figure 11, which shows the same quantities plotted in the scenario where the top 2 doses have a poor hypoglycemic profile. Here, the eNPV rule tended to select a higher dose than the utility rule more often than a lower dose (more than 15% of the simulations in the case of the fixed phase II design of 600 patients), presumably, underestimating the hypoglycemic effect of the top 2 doses from observed data, lured by the high efficacy. This leads to a systematically slightly lower dashed line in Figure 11 but arguably reminds us of the limited value in focusing on simply the mean of a value such as the eNPV, which does not adequately summarize the universe of simulated programs with differing phase II data, dose selections, and outcomes.
In future work, we intend to extend the adaptive phase II algorithm code to be able to target the eNPV rule directly during the adaptive trial, which could reduce the problems associated with bias by targeting the most promising doses to receive the most allocated patients. This will at least ensure a consistent framework in which the stop/go decision, preferment of doses, and eventual transition to phase III are all driven by the same criteria, which are also used to assess the program simulations. However, we do note that the eNPV measure, as a type of utility function, does rely on a predetermined choice of the phase III sample size. Further consideration needs to be given to the circumstances under which that sample size itself may be modified during the program and how sample size reassessment should be included in the assessment of the whole program when the goal function depends on it.
4.3. Bias and Uncertainty
While what-if scenarios in simulation studies are based on some assumed true values, in real drug development, true parameters are not known, and decisions are made based on the observed data, as has been discussed in detail in the previous section. Bias related to expected treatment efficacy18–20 as well as positive bias associated with dose selection 21 are well known. It has also been demonstrated that this bias is inversely correlated to the amount of information. Our findings that smaller phase IIb trials would be associated with a larger positive bias are consistent with this (Figures 5 –7). Design comparisons based on bias did not show consistently an advantage of an adaptive over a fixed design, although the adaptation was focused on selecting between quite similarly valued successful doses, and achieving an increased sample size on the eventually selected dose is evidently beneficial in a wider range of scenarios than those investigated here. When it comes to the uncertainty of treatment estimates, our findings are that larger phase IIb trials and/or adaptive designs perform better than smaller trials with a fixed design within the range of sample sizes we studied. Determining the optimal sample size among a range of sample sizes has been discussed previously. 5 Expressed in eNPV terms in a high-risk/high-reward indication such as diabetes, the uncertainty of eNPV projections based on even the larger phase IIb designs is striking.
5. Conclusions/Recommendations
Our study was specific to drug development for diabetes when it comes to the following parameters: development strategy, key safety and efficacy end points, phase IIb and III sample sizes, regulatory requirements, and expected revenues. While some of our findings can be extrapolated to other therapeutic areas, we recommend that simulations be conducted to support the optimization of any drug development program.
Larger phase IIb studies provide more precise dose selection and reduce the positive treatment effect bias and uncertainty in the estimated eNPV. Similar improvements are seen with implementation of an adaptive design over a fixed design in phase IIb. Our results demonstrate that larger sample sizes in phase III would improve the eNPV because of improvements in the PoS.
One important finding is that dose selection criteria have to be consistent with developers’ objectives. It is a very common situation that dose selection criteria are defined by research and development (R&D) teams, while one of the key objectives is to maximize the expected revenues. To avoid this problem, we recommend a closer collaboration of R&D clinical and commercial groups earlier in development. 10 , 11
In this simulation study, we did not address the FDA requirement for CV events because that would open different research questions suitable for a separate publication. We note that addressing the CV requirement would have a major impact on the cost and timelines. This is the reason that in this work we did not address the time of development, as that would be driven primarily by a separate CV outcomes study. Another consideration when reviewing this simulation study is that we only chose 1 dose to move to phase III (there may have been other viable doses for a given scenario) to limit the number of parameters that we were investigating. If more than 1 dose is used in phase III, then this could have an impact on the eNPV. 3
Footnotes
Presented at the 47th DIA Annual Meeting; June 19-23, 2011; Chicago, Illinois.
Declaration of Conflicting Interests
The author(s) declared no potential conflicts of interest with respect to the research, authorship, and/or publication of this article.
Funding
The author(s) received no financial support for the research, authorship, and/or publication of this article.
References
Supplementary Material
Please find the following supplemental material available below.
For Open Access articles published under a Creative Commons License, all supplemental material carries the same license as the article it is associated with.
For non-Open Access articles published, all supplemental material carries a non-exclusive license, and permission requests for re-use of supplemental material or any part of supplemental material shall be sent directly to the copyright owner as specified in the copyright notice associated with the article.